
 Open Access Article
 This Open Access Article is licensed under a Creative Commons Attribution-Non Commercial 3.0 Unported Licence
A soft on/off switch based on the electrochemically reversible H–J interconversion of a floating porphyrin membrane†
Andrés F.
Molina-Osorio
 a,
Sho
Yamamoto
b,
Iván
Robayo-Molina
a,
Alonso
Gamero-Quijano
a,
Hirohisa
Nagatani
bc and
Micheál D.
Scanlon
*ad
a,
Sho
Yamamoto
b,
Iván
Robayo-Molina
a,
Alonso
Gamero-Quijano
a,
Hirohisa
Nagatani
bc and
Micheál D.
Scanlon
*ad
aThe Bernal Institute and Department of Chemical Sciences, School of Natural Sciences, University of Limerick (UL), Limerick V94 T9PX, Ireland. E-mail: micheal.scanlon@ul.ie
bDivision of Material Chemistry, Graduate School of Natural Science and Technology, Kanazawa University, Kakuma, Kanazawa 920-1192, Japan
cFaculty of Chemistry, Institute of Science and Engineering, Kanazawa University, Kakuma, Kanazawa 920-1192, Japan
dThe Advanced Materials and Bioengineering Research (AMBER) Centre, Ireland
First published on 1st July 2021
Abstract
Soft molecular assemblies that respond reversibly to external stimuli are attractive materials as on/off switches, in optoelectronic, memory and sensor technologies. In this Edge Article, we present the reversible structural rearrangement of a soft porphyrin membrane under an electrical potential stimulus in the absence of solid-state architectures. The free-floating porphyrin membrane lies at the interface between immiscible aqueous and organic electrolyte solutions and is formed through interfacial self-assembly of zinc(II) meso-tetrakis(4-carboxyphenyl)porphyrins (ZnPor). A potential difference between the two immiscible electrolyte solutions induces the intercalation of bis(triphenylphosphoranylidene)ammonium cations from the organic electrolyte that exchange with protons in the porphyrin membrane. In situ UV/vis absorbance spectroscopy shows that this ionic intercalation and exchange induces a structural interconversion of the individual porphyrin molecules in the membrane from an H- to a J-type molecular configuration. These structural rearrangements are reversible over 30 potential cycles. In situ polarisation-modulation fluorescence spectroscopy further provides clear evidence of structural interconversion of the porphyrin membrane, as intercalation of the organic electrolyte cations significantly affects the latter's emissive properties. By adjusting the pH of the aqueous phase, additional control of the electrochemically reversible structural interconversion can be achieved, with total suppression at pH 3.
Introduction
Controlling the molecular arrangements of chromophores in supramolecular assemblies remains a grand challenge with functional dyes such as porphyrins.1 In these assemblies, non-covalent intermolecular interactions precisely control the position and orientation of single molecules, thereby governing the physicochemical and photophysical properties of the ensemble.2–4 For example, in the solid-state, changes in molecular packing may turn non-emissive organic molecules such as terpyridine into good emitters,5 or impact significantly the emission of anthracene assemblies.6 Methodologies that reversibly modulate such arrangements using external stimuli are long sought after given their potential importance in the development of on/off switching behaviour in optoelectronic, memory and sensor technologies.7–10 Among these stimuli, light,11 pH,12 and electric fields13 can provide flexible external control with a certain degree of reversibility.Compared to the interface between solid electrodes and electrolytes, the interface between two immiscible electrolyte solutions (ITIES) is dynamic and lacks inherent defects such as step edges, domain boundaries, terraces and kinks.14 Thus, the uniform templating of adsorbed molecules at such “soft” interfaces can provide a pathway to molecular assemblies with unique structural arrangements and functionalities.15 Given the weak interaction with the interface, intermolecular interactions in molecular assemblies adsorbed at the ITIES can be externally manipulated by applying an electrical potential stimulus across the liquid|liquid boundary.16 Recently, we developed an experimental approach to induce the self-assembly of Zn(II) meso-tetrakis(4-carboxyphenyl)porphyrin (ZnPor) through a hydrogen bond-mediated mechanism at the ITIES.17 By optimising the pH of the aqueous phase to closely match the pKa of the carboxyl groups (pKa = 5.8),18 films of ZnPor nanostructures self-assembled at the liquid|liquid interface creating a porphyrin membrane intermediate between the two electrolyte solutions. Upon polarisation, carboxyl groups in the ZnPor membrane act as cationic exchange sites and give rise to purely ionic electrochemical signals resembling those of redox-type reactions in solid substrates.19
In this Edge Article, we use in situ spectroelectrochemical techniques to demonstrate that ion intercalation and exchange reactions in these soft ZnPor membranes are accompanied by a change in the stacking arrangement of the individual porphyrin molecules within the nanostructures. In situ UV/vis absorbance and polarisation-modulation fluorescence spectroscopies in total internal reflection mode (TIR-UV/vis and PM-TIRF, respectively) show that exchange of protons in the porphyrin membrane by bulky bis(triphenylphosphoranylidene)ammonium cations (R2N+) from the organic electrolyte induces a stacking interconversion of the porphyrins from a compact H-type nanostructure to an open J-type. This interconversion can be manipulated by an interfacial Galvani potential difference between the two electrolyte solutions (Δwoϕ) and is reversible over 30 potential cycles.
Results and discussion
Monitoring reversible H- to J-type interconversion of the interfacial porphyrin membrane by in situ UV/vis spectroelectrochemistry
The potential induced interconversion between H- and J-type nanostructures in the ZnPor membrane was analysed in a 4-electrode configuration by cyclic voltammetry (CV), and in situ TIR-UV/vis and PM-TIRF; the configuration of the electrochemical cell used is presented schematically in Fig. 1 and in detail in Fig. S1 of the ESI.† Schematics and experimental optimisation procedures for the in situ TIR-UV/vis absorbance and PM-TIRF spectroelectrochemical setups, respectively, are detailed in Fig. S2–S6.† Soft ZnPor membranes were obtained from the self-assembly of ZnPor at the water|α,α,α-trifluorotoluene (TFT) interface as described in detail in the ESI† and our previous work.17 For CV and TIR-UV/vis absorbance experiments, ZnPor molecules not adsorbed at the liquid|liquid interface were flushed out, leaving only the membrane between the two electrolyte solutions of approximately 200 nm in thickness (Fig. S7†). For PM-TIRF experiments, after the ZnPor membrane was self-assembled, non-adsorbed ZnPor molecules remained in the aqueous phase during the course of the experiment.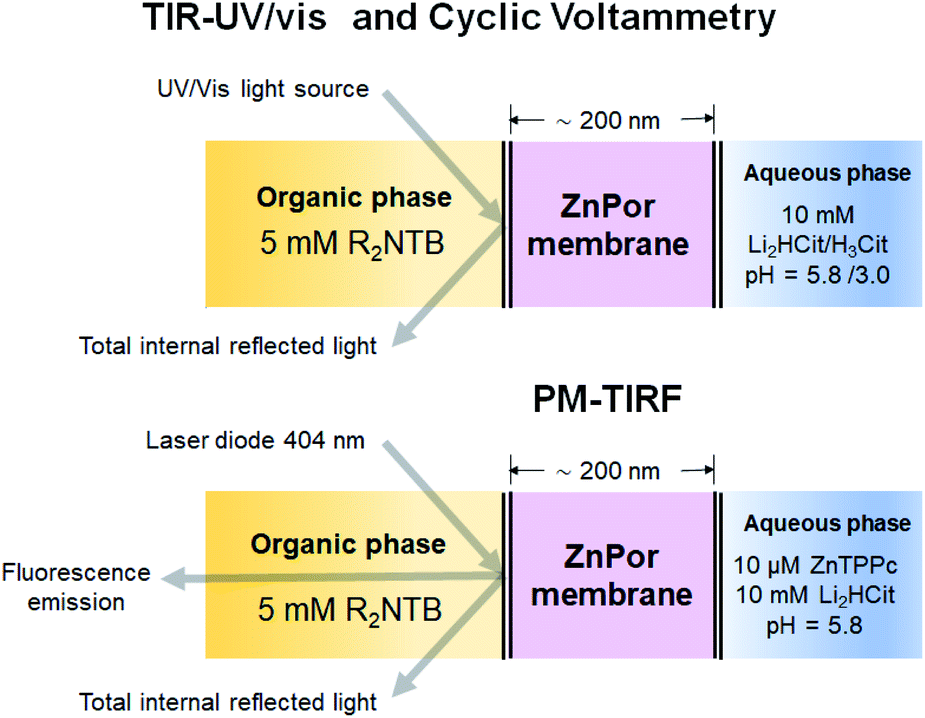 | ||
| Fig. 1 Schematic configurations for spectroelectrochemical studies with the ZnPor membrane system. The techniques used were cyclic voltammetry (CV), in situ UV/vis absorbance and polarisation-modulation fluorescence spectroscopies in total internal reflection mode (TIR-UV/vis and PM-TIRF, respectively). The organic phase was α,α,α-trifluorotoluene (TFT) containing 5 mM bis(triphenylphosphoranylidene)ammonium tetrakis(pentafluorophenyl)-borate (R2NTB). The aqueous phase was 10 mM lithium citrate (Li2HCit) at pH 5.8, or 10 mM citric acid (H3Cit) at pH 3.0. The ZnPor membrane was prepared from 10 μM solutions of ZnPor in contact with the TFT as described in the ESI.† | ||
Fig. 2a shows CVs in the presence and absence of the ZnPor membrane, respectively. At potentials where the aqueous phase is polarised negatively with respect to the organic phase (Δwoϕ < 0), an increase in the interfacial concentration of R2N+ near the organic electrolyte|membrane interface leads to a reversible intercalation/exchange reaction associated with peaks A and B in the voltammogram.19 Scanning negatively, R2N+ ions penetrate the membrane binding to anionic carboxyl sites and displacing protons through ion exchange at neutral carboxyl sites producing peak A. The latter process reverses as the potential direction is switched and scanned to more positive potentials, yielding peak B.19
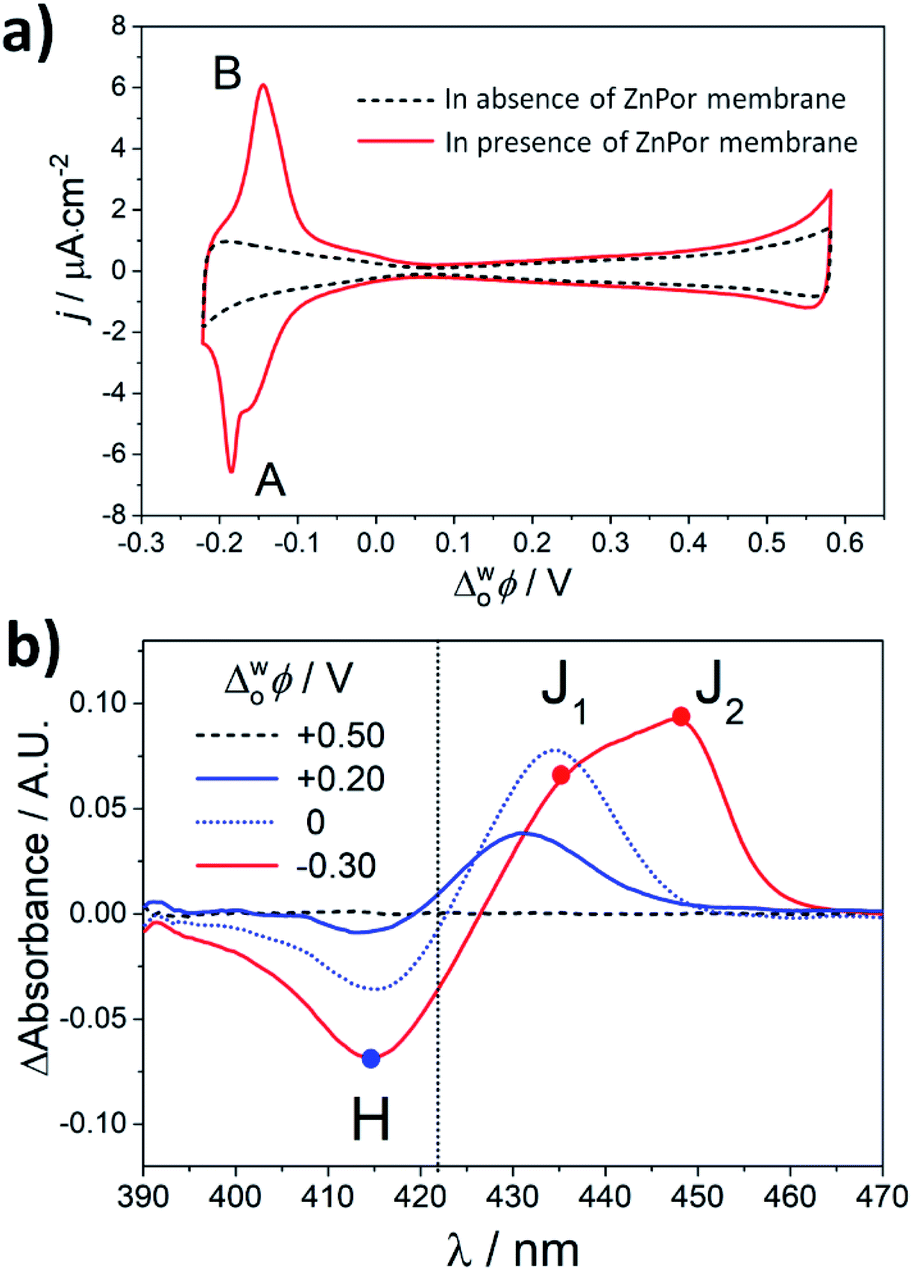 | ||
| Fig. 2 (a) Cyclic voltammetry (CV) in the absence and presence of the ZnPor membrane in the configuration presented schematically in Fig. 1a. The scan rate was 25 mV s−1. The 4-electrode electrochemical cell setup used for these measurements is presented in Fig. S1.† (b) Differential TIR-UV/vis absorbance spectra of the ZnPor membrane at different Δwoϕ. The spectrum of the membrane at +0.50 V was taken as a blank. | ||
In situ TIR-UV/vis absorbance measurements were carried out at different Δwoϕ, as presented in Fig. 2b. Differential spectra were obtained by subtracting the spectrum of the ZnPor membrane obtained at +0.5 V from spectra obtained at each Δwoϕ. A stepwise interconversion between three dominant supramolecular nanostructures is observed. Using the λmax. of ZnPor in solution at pH 5.8 (λmax. = 422 nm) as a reference (Fig. S8†), these supramolecular nanostructures were assigned as either H-type (λmax. = 414 nm) or J-type (J1, λmax. = 435 nm and J2, λmax. = 448 nm). Control differential spectra in the absence of the ZnPor film were featureless (Fig. S4†).
The differential TIR-UV/vis absorbance spectra in Fig. 2b indicate that the structure of the ZnPor membrane is dynamic across the whole potential range studied. The potential of zero charge (PZC) at pH 5.8 in the presence of the ZnPor membrane was determined previously as +0.25 V.19 At potentials approaching or more positive than the PZC, i.e., +0.2 and +0.5 V, ZnPor molecules primarily adopt a compact H-type configuration as observed for other porphyrin assemblies at the ITIES.20 Note that at these positive potentials, no electrochemical signals were observed in the presence of the ZnPor membrane, and thereby a more compact structure could be expected. At potentials more negative than the PZC, i.e., 0 and −0.30 V, R2N+ accumulates at the organic electrolyte|membrane interface. We propose that electrostatic interactions with R2N+ cause a partial opening of the nanostructures in the membrane and the appearance of an initial J-type structure (J1). The subsequent intercalation of bulky R2N+ species and their exchange with substantially smaller protons in the membrane cause further structural rearrangements into a more open J-type configuration (J2). A structural interconversion was also observed in the presence of other bulky and hydrophobic ions, such as tetraoctylammonium cations (TOA+), but absent with smaller species, such as tetraethylammonium (TEA+) or tetrabutylammonium (TBA+) cations (data not shown). These observations suggest that features such as size and hydrophobicity are central to the ability of these cations to intercalate into the ZnPor membrane (Fig. S13 and S14†).
Of particular note is that differential TIR-UV/vis absorbance measurements clearly indicate that H–J interconversion begins to take place even at potentials considerably positive of peaks A and B. The latter is due to the continuous change in the double layer and the gradual build-up of R2N+ species at the organic electrolyte|membrane interface as Δwoϕ is scanned negatively.
The reversibility of the structural H–J interconversion was demonstrated by comparing the magnitude of the absorbance of the H and J2 nanostructures as a function of the number of potential cycles, as presented in Fig. 3a (one cycle = potential steps from +0.50 V to −0.25 V to +0.50 V). A near constant absorbance value for 30 cycles indicates an excellent, robust reversibility of the optical properties of the membrane. This observation is in line with the negligible charge differential (ΔQ ≈ 0 μC cm−2) determined electrochemically for peaks A and B in the voltammogram, presented in Fig. S9.† The electrochemically reversible H–J interconversion of the ZnPor membrane at the water|TFT interface is shown schematically in Fig. 3b.
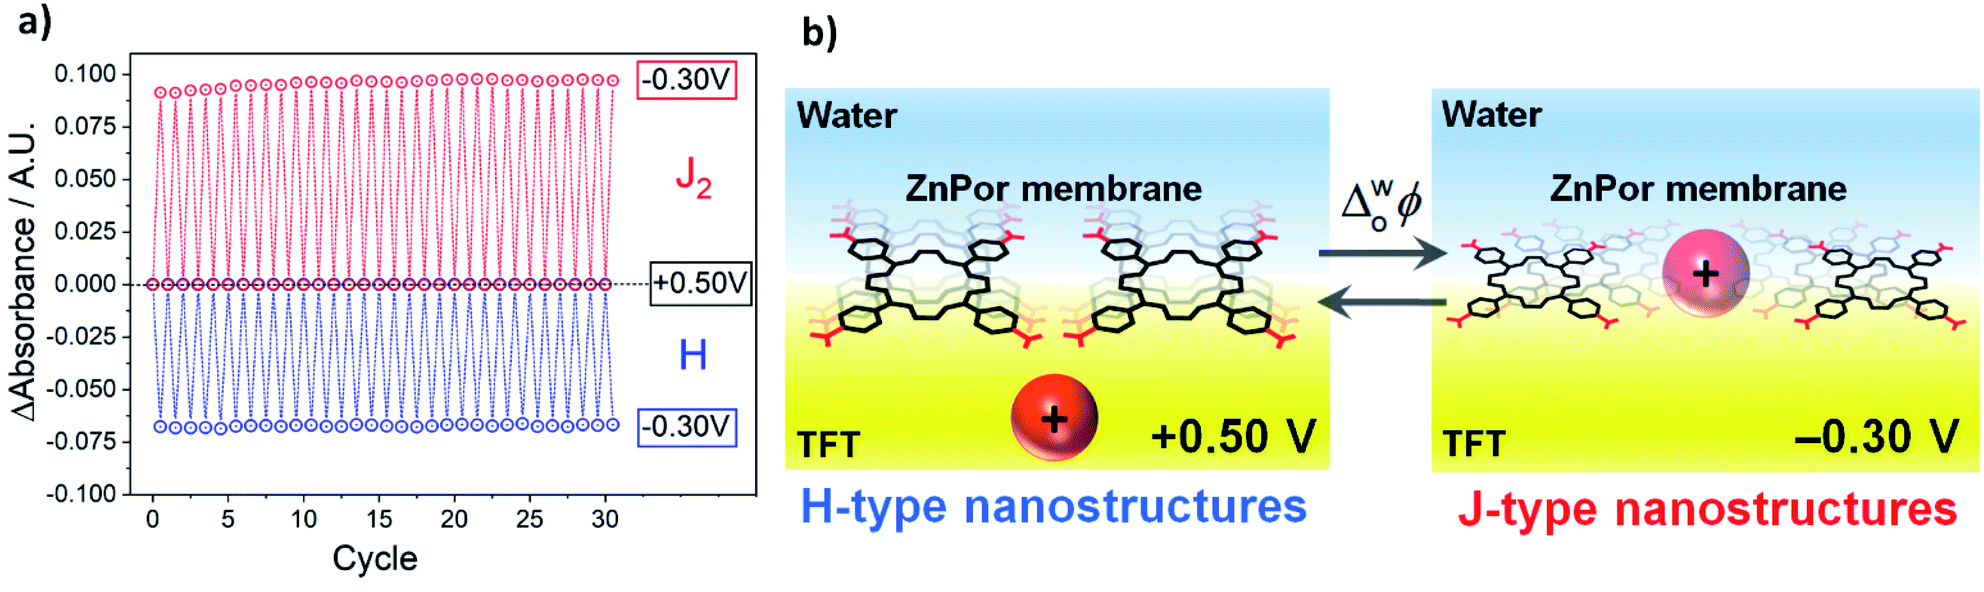 | ||
| Fig. 3 (a) Reversible H–J interconversion of the ZnPor membrane as a function of the potential cycle. One cycle = potential steps from +0.50 V to −0.25 V to +0.50 V. The absorbance of H and J2 was measured at 414 and 448 nm, respectively, from the differential TIR-UV/vis absorbance spectra presented in Fig. S10 and animated in a movie, see ESI.† (b) Schematic of the electrochemically reversible H–J interconversion of the ZnPor membrane at the water|TFT interface. For clarity, only the porphyrins near the interface are depicted, but R2N+ intercalation occurs throughout the ca. 200 nm thickness of the ZnPor membrane and not just at the monolayer of porphyrin near the water|TFT interface. Thus, upon variations of the applied Δwoϕ, the thickness of ZnPor membrane is not fixed and will expand/contract during the reversible intercalation/de-intercalation process. | ||
Suppression and reactivation of the interfacial porphyrin membrane H–J interconversion by pH
The pH of the aqueous phase significantly effects the structural interconversion and electrochemistry of the ZnPor membrane. As presented in Fig. 4, by decreasing the pH from 5.8 to 3.0, the electrochemical ion intercalation/exchange was suppressed with all electrochemical signals related to the presence of the ZnPor membrane disappearing. Furthermore, the H–J interconversion was suppressed at pH 3.0, with no changes in the differential absorbance spectra observed at different Δwoϕ. Thus, the spectroelectrochemical analysis clearly demonstrates that the potential induced intercalation/exchange reaction is responsible for the H–J interconversion observed. Consequently, when the former is suppressed, the porphyrin membrane retains a compact H-type configuration. Control TIR-UV/Vis absorbance experiments show that even though the ZnPor membrane initially self-assembles only at a pH value near the pKa of the carboxyl groups (pKa = 5.8), once assembled, the membrane is stable even at very acidic conditions (Fig. S11†). This excludes any effects of redissolution of the membrane on the analysis presented.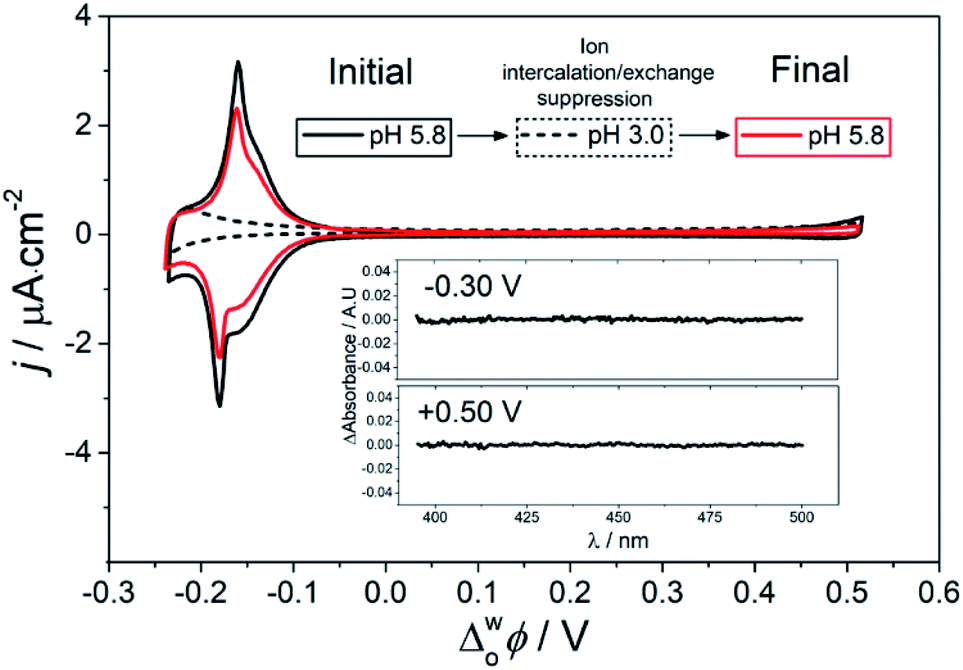 | ||
| Fig. 4 Suppression and reactivation of the ZnPor membrane H–J interconversion monitored by CV and differential TIR-UV/vis absorbance. The scan rate for the CV was 5 mV s−1. Inset: differential absorbance of the membrane at pH 3.0 with Δwoϕ equal to −0.30 V and +0.50 V, respectively. The TIR-UV/vis absorbance spectrum at +0.50 V was taken as the blank, and spectra at other Δwoϕ across the full potential range studied are shown in Fig. S12.† | ||
Both the applied Δwoϕ and pH of the aqueous phase shift the chemical equilibrium involving carboxyl groups in the ZnPor membrane, aqueous protons, and bulky organic R2N+ cations. The overall equilibrium of the ion exchange in the membrane, m, can be represented as follows
| –COOHm + R2Nm+ ⇆ –COOR2Nm+ + Hm+ | (1) |
This equilibrium is similar to that present in membranes used in ion selective electrodes (ISE).21 In effect, within a certain potential range, the porphyrin membrane acts as an intermediate phase separating the aqueous and organic electrolyte solutions.19 The ion exchange reaction can be considered as the combination of acid dissociation
| –COOHm ⇄ –COOm− + Hm+ | (2) |
| –COOm− + R2Nm+ ⇄ COOR2Nm+ | (3) |
In turn, the equilibrium constant of the acid dissociation reaction is dictated by ionic equilibrium at the membrane|aqueous electrolyte interface
| –COOHm ⇄ COOm− + Haq.+ | (4) |
| –COOm− + R2Norg.+ ⇄ COOR2Nm+ | (5) |
In situ polarisation-modulation fluorescence spectroscopy of the interfacial porphyrin membrane H–J interconversion
Further spectroelectrochemical evidence of the reversible structural interconversion of the ZnPor membrane was obtained using PM-TIRF to probe the effect of interfacial polarisation on the emitted fluorescence. PM-TIRF signals (ΔFp–s) as a function of emission wavelength (PM-TIRF spectra) were recorded at different Δwoϕ (Fig. 5a.). As demonstrated in previous works, PM-TIRF spectra are interface-specific, with signals arising from randomly oriented molecules in the bulk phases effectively cancelled out.22,23 At Δwoϕ = +0.59, +0.29, −0.06 and −0.15 V, two emission peaks were observed (λem. = 613 and 663 nm), similar to the emission peaks for the monomeric porphyrin (see Fig. S15†). The negative values of ΔFp–s at each Δwoϕ confirm the relatively horizontal orientation of individual ZnPor molecules within the membrane with respect to the plane of the interface.23 PM-TIRF spectra measured at −0.06 and −0.15 V show a major decrease in −ΔFp–s compared to the spectrum at +0.29 V, with no spectral shift. The decrease in −ΔFp–s may be associated with a change in molecular orientation of the ZnPor molecules within the membrane at the more negative potentials. The lack of a spectral shift indicates association of the ZnPor molecules in the membrane mainly through hydrogen bonds between their carboxyl groups.16 This finding is in line with the pH dependency of the ZnPor membrane formation, as detailed in our recent work,17 and the cooperative hydrogen bonding model proposed by Girault and co-workers in their photoelectrochemical studies of ZnPor at a polarised water|1,2-dichloroethane interface.24 At Δwoϕ < −0.30 V, the PM-TIRF spectra red-shifted and a third emission peak (λem. = 694 nm) appeared, confirming close π–π stacking of the porphyrin ring at the interface and the formation of J-type nanostructures.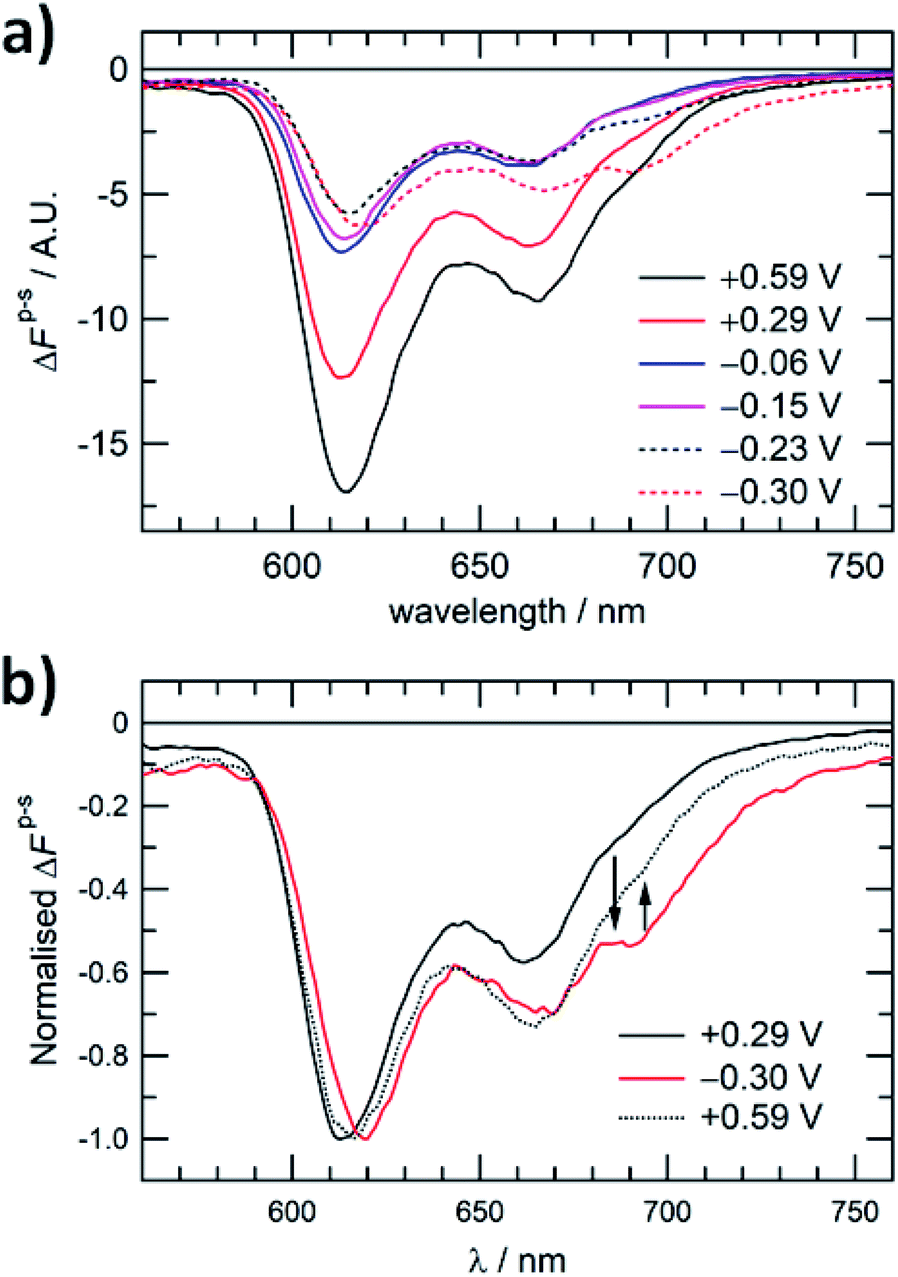 | ||
| Fig. 5 (a) PM-TIRF spectra of the ZnPor membrane at different Δwoϕ. (b) PM-TIRF spectra of the ZnPor membrane after a potential cycle from +0.29 V to −0.30 V and back to +0.59 V. λexc. = 404 nm. | ||
As presented in Fig. 5b, by switching the potential across the interface between the positive and negative potentials, the emission peak at 694 nm can be effectively controlled, further demonstrating the reversibility of the structural interconversion and the control over the emission properties of the porphyrin membrane. The rate of the dissociation of the J-aggregate was rather slow at +0.29 V, and therefore a higher positive potential of +0.59 V was applied on switching back from negative to positive potentials.
Conclusions
In this Edge Article, we demonstrate the reversible structural interconversion of a soft porphyrin membrane from an H- to a J-type molecular configuration in the absence of any solid-state architectures. The interconversion was controlled by applying an interfacial Galvani potential difference between two immiscible electrolyte solutions. The potential difference induced an ion intercalation/exchange reaction that affected reversibly the supramolecular structure of the membrane. The latter was demonstrated electrochemically by cyclic voltammetry and spectroscopically by in situ UV/vis absorbance and polarisation-modulated fluorescence spectroscopies in total internal reflection mode. The H- to J-interconversion was robust and repeatable over at least 30 potential cycles. The interconversion was suppressed within the polarisable potential window at pH 3.0, but recoverable by returning the pH of the aqueous phase to pH 5.8.The work herein opens new opportunities to investigate the use of structurally dynamic soft supramolecular porphyrin assemblies at the ITIES as switchable on/off responsive nanomaterials, with applications in optoelectronic, memory and sensor devices. The structural interconversion was not solely restricted to the intercalation of one specific organic cation, such as bis(triphenylphosphoranylidene)ammonium cations, but also observed with tetraoctylammonium cations. Thus, this type of electrochromic behavior can be manipulated by introducing different hydrophobic and bulky cations in the organic phase.
Data availability
All pertinent experimental data and detailed procedures for implementation and optimisation of the spectroelectrochemical experiments at the interface between two immiscible electrolyte solutions (ITIES) are provided in the ESI.Author contributions
A. F. M-O. and M. D. S. designed the study. A. F. M-O., S. Y. and A. G.-Q. developed and optimised the TIR-UV/vis experimental setup. A. F. M.-O., S. Y. and I. R.-M. carried out the TIR-UV/vis experiments and analysed the data. S. Y. carried out the PM-TIRF experiments and analysed the data under the supervision of H. N. M. D. S. and H. N. were responsible for overall project administration and supervision as well as funding acquisition. All authors contributed to the discussion and writing the article.Conflicts of interest
There are no conflicts to declare.Acknowledgements
M. D. S. and A. F. M.-O. acknowledge Science Foundation Ireland (SFI) under Grant no. 13/SIRG/2137 and the European Research Council through a Starting Grant (Agreement no. 716792). A. G.-Q. acknowledges funding received from an Irish Research Council Government of Ireland Postdoctoral Fellowship Award (Grant Number GOIPD/2018/252). H. N. acknowledges a Grant-in-Aid for Scientific Research (C) (No. 19K05541) from Japan Society for the Promotion of Science (JSPS). S. Y. thanks the JSPS Research Fellowship for Young Scientists (No. 17J02009).Notes and references
- G. Magna, D. Monti, C. Di Natale, R. Paolesse and M. Stefanelli, Molecules, 2019, 24, 4307 CrossRef CAS PubMed.
- K. Cai, J. Xie, D. Zhang, W. Shi, Q. Yan and D. Zhao, J. Am. Chem. Soc., 2018, 140, 5764–5773 CrossRef CAS PubMed.
- M. F. J. Mabesoone, A. J. Markvoort, M. Banno, T. Yamaguchi, F. Helmich, Y. Naito, E. Yashima, A. R. A. Palmans and E. W. Meijer, J. Am. Chem. Soc., 2018, 140, 7810–7819 CrossRef CAS PubMed.
- R. van der Weegen, A. J. P. Teunissen and E. W. Meijer, Chem.–Eur. J., 2017, 23, 3773–3783 CrossRef CAS PubMed.
- T. Mutai, H. Satou and K. Araki, Nat. Mater., 2005, 4, 685–687 CrossRef CAS PubMed.
- Y. Dong, B. Xu, J. Zhang, X. Tan, L. Wang, J. Chen, H. Lv, S. Wen, B. Li, L. Ye, B. Zou and W. Tian, Angew. Chem., Int. Ed., 2012, 51, 10782–10785 CrossRef CAS PubMed.
- A. Mammana, A. D'Urso, R. Lauceri and R. Purrello, J. Am. Chem. Soc., 2007, 129, 8062–8063 CrossRef CAS PubMed.
- S. Ishihara, J. Labuta, W. Van Rossom, D. Ishikawa, K. Minami, J. P. Hill and K. Ariga, Phys. Chem. Chem. Phys., 2014, 16, 9713–9746 RSC.
- S. Yagai, in Supramolecular Soft Matter: Applications in Materials and Organic Electronics, ed. T. Nakanishi, John Wiley & Sons, Inc, 2011, pp. 77–95 Search PubMed.
- T. Eder, T. Stangl, M. Gmelch, K. Remmerssen, D. Laux, S. Höger, J. M. Lupton and J. Vogelsang, Nat. Commun., 2017, 8, 1641 CrossRef PubMed.
- J. Wang, A. Kulago, W. R. Browne and B. L. Feilnga, J. Am. Chem. Soc., 2010, 132, 4191–4196 CrossRef CAS.
- K. Adachi, Y. Ura and N. Kanetada, J. Porphyrins Phthalocyanines, 2018, 22, 658–669 CrossRef CAS.
- M. Mrinalini, S. S. Pathak, B. S. Achary, L. S. Panchakarla and S. Prasanthkumar, Chem.–Asian J., 2019, 14, 537–541 CrossRef CAS PubMed.
- H. H. Girault, in Developments in Electrochemistry: Science Inspired by Martin Fleischmann, ed. D. Pletcher, Z.-Q. Tian and D. E. Williams, John Wiley & Sons, Ltd, 2014, pp. 295–308 Search PubMed.
- J. F. Stoddart, Nat. Chem., 2009, 1, 14–15 CrossRef CAS PubMed.
- Z. Samec, Electrochim. Acta, 2012, 84, 21–28 CrossRef CAS.
- A. F. Molina-Osorio, D. Cheung, C. O'Dwyer, A. A. Stewart, M. Dossot, G. Herzog and M. D. Scanlon, J. Phys. Chem. C, 2020, 124, 6929–6937 CrossRef CAS.
- N. C. Maiti, S. Mazumdar and N. Periasamy, J. Phys. Chem. B, 1998, 102, 1528–1538 CrossRef CAS.
- A. F. Molina-Osorio, J. A. Manzanares, A. Gamero-Quijano and M. D. Scanlon, J. Phys. Chem. C, 2020, 124, 18346–18355 CrossRef CAS.
- A. J. Olaya, D. Schaming, P. F. Brevet, H. Nagatani, H. J. Xu, M. Meyer and H. H. Girault, Angew. Chem., Int. Ed., 2012, 51, 6447–6451 CrossRef CAS PubMed.
- E. Bakker, P. Bühlmann and E. Pretsch, Chem. Rev., 1997, 97, 3083–3132 CrossRef CAS PubMed.
- S. Yamamoto, H. Nagatani and H. Imura, Langmuir, 2017, 33, 10134–10142 CrossRef CAS PubMed.
- S. Yamamoto, H. Nagatani, K. Morita and H. Imura, J. Phys. Chem. C, 2016, 120, 7248–7255 CrossRef CAS.
- H. Jensen, J. J. Kakkassery, H. Nagatani, D. J. Fermín and H. H. Girault, J. Am. Chem. Soc., 2000, 122, 10943–10948 CrossRef CAS.
Footnote |
| † Electronic supplementary information (ESI) available: Details of the experimental setups, expanded results, control experiments and animation of Fig. S10. See DOI: 10.1039/d0sc05786j |
| This journal is © The Royal Society of Chemistry 2021 |