 Open Access Article
A rapid and sensitive method for chiroptical sensing of α-amino acids via click-like labeling with o-phthalaldehyde and p-toluenethiol†
Bo
Li‡
ab,
Jie
Zhang‡
a,
Li
Li
 *a and
Gong
Chen
 *b
*b
aBeijing Key Laboratory of Active Substances Discovery and Druggability Evaluation, Institute of Materia Medica, Chinese Academy of Medical Sciences, Peking Union Medical College, Beijing 100050, China. E-mail: annaleelin@imm.ac.cn
bState Key Laboratory and Institute of Elemento-Organic Chemistry, College of Chemistry, Nankai University, Tianjin 300071, China. E-mail: gongchen@nankai.edu.cn
First published on 22nd December 2020
Abstract
A highly practical method for comprehensive chiroptical sensing of free α amino acids with streamlined operation and high sensitivity via dual CD/UV measurements is developed. The assay takes advantage of an efficient and selective three-component labeling reaction of primary amines with o-phthalaldehyde and p-toluenethiol reagents to derivatize the NH2 group of analytes into an isoindole. The covalent labeling generates sensitive UV and CD readouts, both of which show an excellent linear relationship with the concentration of analytes. The high reactivity and the novel optical reporting mechanism allow fast and accurate measurement without background interference. The sensing assay works well for a remarkably broad range of analyte concentrations, with an unprecedented lower limit of 10 micromolar concentration.
Introduction
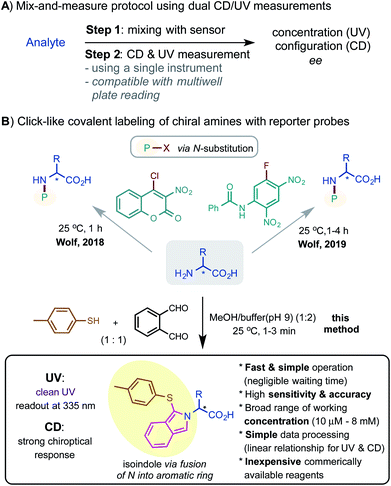
The widespread use of α-amino acids (αAAs) and other chiral amine compounds in academic and industrial laboratories has generated substantial interest in developing sensitive and convenient methods for their chiral analysis.1 Due to the operational limitations of chromatographic techniques, attention has been increasingly shifted to optical methods.2,3 Over the past decade, methods for chiroptical sensing based on circular dichroism (CD) spectroscopy with small molecule sensors have been greatly advanced by the groups of Chin, Anslyn, Wolf, Pu, Joyce, Zonta and others.4–7 By exploiting the mechanisms of dynamic covalent chemistry, supramolecular assembly, and metal complexation, these methods both amplify the CD signal and report the concentration to allow quantitative measurement of the enantiomeric composition of analytes with high accuracy.Among these chiroptical methods, the combination of CD and UV is probably the most desirable as the measurements can be conveniently performed on a single instrument, which can be readily modified with multiwell plate reading for parallel analysis (Scheme 1A). Notably, the Wolf group reported several powerful mix-and-measure protocols using organohalide derivatizing agents (a coumarin chloride and an aryl fluoride) that selectively react with the amine analytes to generate CD and UV readouts (Scheme 1B).7,8 However, while labeling reactions via N-substitution can proceed cleanly, they require relatively long reaction times (1–4 hours) at high reaction concentrations (typically > 1 mM). Herein, we report a new method for chiroptical sensing of various α-amino acids via a click-like three-component labeling of primary amines with o-phthalaldehyde and p-toluenethiol reagents.9 The resulting N-fused aromatic isoindole moiety provides strong UV and CD responses, enabling fast, sensitive, and accurate measurement across a very broad range of analyte concentrations.
Results and discussion
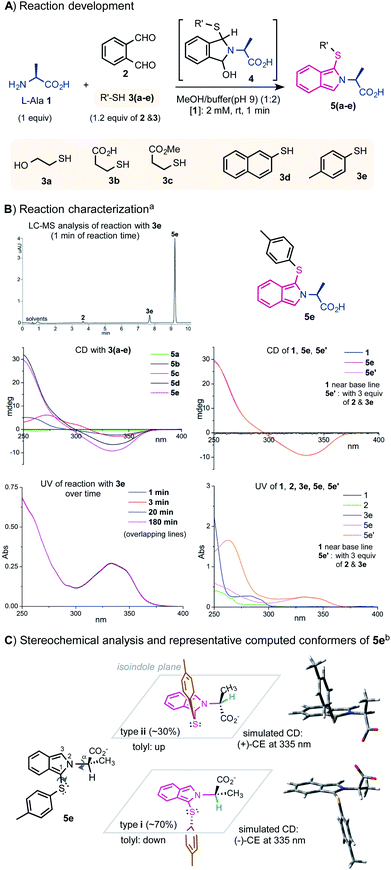
The key to designing dual sensors for CD/UV-based assay is to generate strong and clear readouts for both CD and UV. While a variety of sensing mechanisms have been successfully exploited to amplify the CD signal of αAAs, methods for simultaneous UV amplification with high sensitivity are surprisingly limited. The three-component condensation reaction between the amino group of αAAs, o-phthalaldehyde (oPA) 2, and alkyl thiol reagents such as 2-mercaptorethanol 3a or 3-mercapto propanoic acid 3b has long been used to derivatize αAAs for HPLC analysis (Fig. 1A).10–12 The oPA labeling reactions can proceed cleanly and quickly under mild conditions to form 1-thiolate substituted isoindole product 5. The isoindole moiety has a strong UV absorption around 335 nm, offering a clean UV readout with little background inference from the αAA and the labeling reagents. Its emission around 450 nM has also been used for fluorescence detection. Encouraged by their favorable UV properties, we questioned whether the N-fused isoindole structure on the αAA can induce useful CD signals for chiroptical sensing. The three-component condensation reaction is believed to proceed through a cyclic hemiaminal intermediate 4, which upon dehydration gives the heteroaromatic product.We commenced the investigation with the reaction of a model αAA L-alanine 1 and a stoichiometric mixture of oPA and different thiols. To our delight, the isoindolyl derivatives of Ala indeed exhibited an excellent CD response around 335 nm with p-toluenethiol 3e giving the strongest signal among the thiol reagents tested. 3e is a commercially available solid compound and has a much weaker odor than the liquid alkyl thiols. The UV spectrum of the reaction mixture showed a distinct absorption at 335 nm (Fig. 1B).13 As indicated by LC-MS and UV measurements, 1.2 equiv. of 3e and 2 reacted cleanly with 1 equiv. of 1 at 2 mM in the mixed solvents of MeOH and phosphate buffer (pH 9) (1/2) at room temperature (rt) under an air atmosphere to give product 5e in >95% conversion in 1 min. Notably, the use of excess amounts of 2 and 3e (e.g. 3 equiv.) has a negligible impact on the readout of CD and UV at 335 nM (Fig. 1B). The reaction mixture was diluted for CD and UV measurements. UV and LC-MS analyses showed that product 5e is stable over a period of 12 hours.14 The UV and CD spectra of 5e are not strongly affected by the solvents (see the ESI† for assaying spectra using other organic solvents). Aqueous MeOH medium is preferred for its excellent solubilizing ability for αAAs and lack of interference for UV and CD measurements.
 | ||
| Fig. 1 Labeling of L-Ala with oPA and thiols for chiroptical sensing by CD/UV. (A) Reaction development. (B) Reaction characterization; a) reaction mixture was diluted 7 times and samples were measured at 0.285 mM for CD and UV. (C) Stereochemical analysis and respresentative computed conformers of 5e; b) DFT calculations were performed at the M062X/6-311+G(d,p) level, see the ESI† for details. | ||
As shown in Fig. 1C, our preliminary structural and spectroscopic analysis using time-dependent density functional theory (TDDFT) calculations showed that the tolyl group of (S)-5e could be positioned below (type (i) conformers) or above (type (ii) conformers) the isoindole plane, forming the opposite relative stereochemical arrangement of the two aryl groups along the C1–S bond. Both types (i) and (ii) prefer near-eclipse conformations to the Cα–H bond and adopt syn and anti to the C1–S bond respectively. Type (i) and (ii) conformers give opposite Cotton effects (CE) according to the electronic circular dichroism (ECD) simulation. Type (i) conformers are more stable than type (ii) conformers; (i) and (ii) roughly represent 70% and 30% in the conformational equilibrium mixture respectively. The overall ECD spectrum of (S)-5e matched well with its experimental data, which showed a negative CE at 335 nm (see ESI Fig. 10† for details).
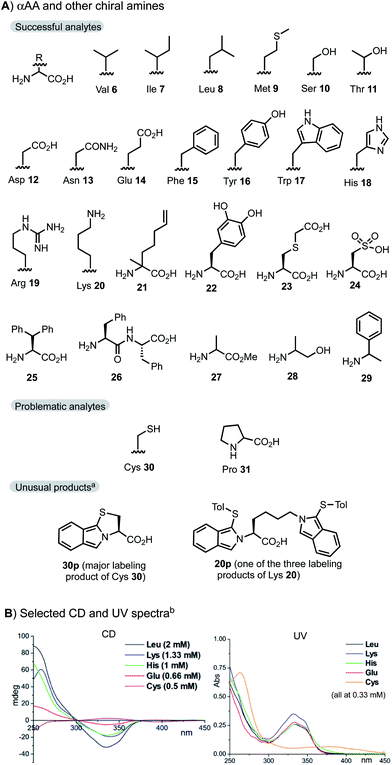
The new protocol was next applied to sense other optically pure proteinogenic αAA and primary alkylamine samples (Fig. 2A). Typically, 1 equiv. of the analytes and 1.2 equiv. of 2 and 3e were mixed in MeOH/buffer at 0.5–8 mM concentration for 1 min. In practice, the assaying can be performed without any deliberate aging. All αAAs except Cys and Pro showed a similar profile and sensitivity in both CD and UV spectra. The CD and UV spectra of selected αAAs are shown in Fig. 2B. Pro 31 cannot form the corresponding isoindole product due to its secondary amino group. The reaction of Cys 30 mainly formed a tricyclic isoindole product 30pvia the intramolecular addition of the SH side chain along with two dimeric side products (see the ESI†). The reaction of Lys 20 with 1.2 equiv. of 2 and 3e gave a mixture of mono- and bis-labeled products (e.g.20p) at the α and ε amino positions (see ESI Fig. 9† for details). Side chains such as CO2H (Glu, Asp), CONH2 (Gln, Asn), OH (Ser, Thr, Tyr), guanidine (Arg), and imidazole (His) did not interfere with the condensation reaction. Reactions of nonproteinogenic or unnatural αAAs 21–25 and even dipeptide Phe–Phe 26 gave similar results. Ala methyl ester 27 gave an almost identical CD readout to Ala 1. Assaying of alaninol 28 and 1-phenylethylamine 29 gave a slightly weaker CD signal (∼40%) in comparison with Ala 1.
 | ||
| Fig. 2 Substrate scope at a normal concentration range. Standard assaying conditions (1.2 equiv. of reagents, 1 min). (A) αAA and other chiral amines; a) see the ESI† for LC-MS analysis of the reaction mixture. (B) Selected CD and UV spectra; b) samples were measured at the concentration specified. | ||
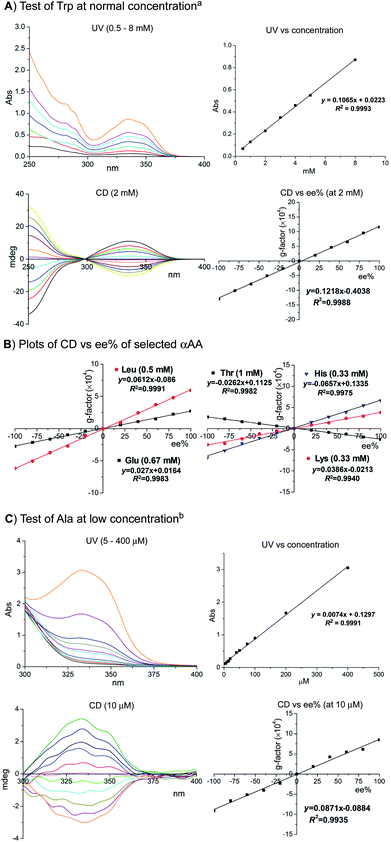
As shown in Fig. 3A, the UV absorption at 335 nm shows an excellent linear relationship with the concentration of Trp between 0.5 and 8 mM (all samples above 0.5 mM were diluted for CD and UV measurements). Moreover, the CD signals at 335 nm also showed an excellent linear relationship with the enantiomeric excess (ee) of Trp samples assayed at 2 mM using the standard protocol with 1.2 equiv. of oPA and 3e. As shown in Fig. 3B, plots of the g factor of CD vs. ee% for representative αAAs Leu 8, Glu 14, His 18, and Thr 11 measured at 0.33–1 mM showed an excellent linear relationship. The plot of UV absorption vs. concentration showed a notable deviation (R2 = 0.9852) from the linear relationship for Lys probably due to the formation of mixed labeling products (see the ESI†). However, the plot of g factor vs. ee% showed excellent linear relationship for Lys.
 | ||
| Fig. 3 Assaying αAAs at varied concentrations. Standard conditions: 1.2 equiv. of 2 and 3e, 1 min for [αAA] > 300 μM. Modified conditions: 5 equiv. and 1 min for 100–300 μM; 20 equiv. and 3 min for 50–100 μM; 100 equiv. and 3 min for 5–50 μM. See the ESI† for tests of Trp at 10 μM and Ala at 2 mM. (A) Test of Trp at normal concentration; a) all samples were diluted 6 times for the UV vs. concentration plot. The real measured concentration is 1/6 of the ones shown in the X axis. All samples (2 mM) were diluted 4 times for the CD vs. ee% plot, measured at 0.50 mM. (B) Plots of CD vs. ee% of selected αAA. (C) Test of Ala at low concentration; b) assaying samples were measured without dilution. The g-factor was the average of four measurements. | ||
Chiroptical sensing of analytes at low concentrations remains a difficult challenge for the existing methods due to low labeling reactivity and high background noise. We were pleased to find that our method worked well for αAA samples below 300 μM under slightly modified conditions with excess amounts of oPA and 3e (5–100 equiv.) and 3 min of mixing time. As exemplified by the test of Ala, the UV signal at 335 nm showed excellent linear relationship with the concentration between 5 and 400 μM (assaying samples below 0.5 mM were measured without dilution). Moreover, the plot of g factor vs. ee% showed an excellent linear relationship for Ala at 10 μM.15 Notably, excess amounts of reagents had a negligible impact on the CD and UV signals at 335 nM, due to the unique signal amplifying mechanism of this method. Sensing of the Trp sample at 10 μM gave similar sensitivity (see the ESI†).
As shown in Table 1, our assay was tested with representative Ala and Trp samples at varied concentrations and of varied enantiomeric ratios. The simple linear relationships greatly simplified the calculation of the concentrations and ee values from UV and CD measurements. In all cases, the absolute configuration of the major enantiomer was correctly assigned. The measured data of concentration and ee values were mostly within 5% error of the actual value at both high (8 mM) and low (10 μM) assaying concentrations.
| Sample | Sensing | |||||
|---|---|---|---|---|---|---|
| Entry | Conf. | Conc. | ee% | Conf. | Conc. | ee% |
| 1 | Ala-L | 2.00 mM | −100.0 | L | 1.91 mM | −98.7 |
| 2 | Ala-D | 7.00 mM | 37.1 | D | 6.87 mM | 38.2 |
| 3 | Trp-L | 7.00 mM | −100.0 | L | 7.10 mM | −103.4 |
| 4 | Trp-D | 3.50 mM | 42.8 | D | 3.57 mM | 43.9 |
| 5 | Ala-L | 40.0 μM | −60.0 | L | 39.2 μM | −61.2 |
| 6 | Ala-D | 10.0 μM | 100.0 | D | 9.5 μM | 99.6 |
| 7 | Trp-L | 21.0 μM | −65.0 | L | 22.2 μM | −67.2 |
| 8 | Trp-D | 38.0 μM | 79.0 | D | 35.8 μM | 77.5 |
Conclusions
In summary, we have developed a highly practical method for comprehensive chiroptical sensing of free α amino acids which gives high sensitivity via dual CD/UV measurements using a single instrument. The click-like covalent labeling reaction rapidly fuses the NH2 group of analytes into a N-heteroaromatic isoindole structure, which amplifies both UV and CD signals of amines with an excellent linear relationship with the concentration. The high reactivity and the novel optical reporting mechanism of the labeling reaction allow fast and accurate measurement with negligible aging time and background interference. The sensing assay works well for a remarkably broad range of analyte concentrations with an unprecedented lower limit of 10 micromolar concentration. The sensing assay is simple, robust and cheap. We expect that this method can be readily adapted for high throughput experimentation analysis using a CD instrument equipped with a multiwell plate reader.Conflicts of interest
There are no conflicts to declare.Acknowledgements
We gratefully thank the CAMS Innovation Fund for Medical Sciences (CIFMS, No. 2016-I2M-3-009) and the Drug Innovation Major Project (2018ZX09711-001-005) for financial support of this work.Notes and references
- Selected review of AA sensing: (a) Y. Zhou and J. Yoon, Chem. Soc. Rev., 2012, 41, 52–67 RSC; (b) A. P. F. Turner, Chem. Soc. Rev., 2013, 42, 3184–3196 RSC; (c) M. Tsukamoto and H. B. Kagan, Adv. Synth. Catal., 2002, 344, 453–463 CrossRef CAS; (d) L. Pu, Angew. Chem., Int. Ed., 2020, 59, 21814–21828 CrossRef CAS.
- Selected reviews on optical sensing: (a) D. Leung, S. O. Kang and E. V. Anslyn, Chem. Soc. Rev., 2012, 41, 448–479 RSC; (b) J. Wu, B. Kwon, W. Liu, E. V. Anslyn, P. Wang and J. S. Kim, Chem. Rev., 2015, 115, 7893–7943 CrossRef CAS; (c) B. T. Herrera, S. L. Pilicer, E. V. Anslyn, L. A. Joyce and C. Wolf, J. Am. Chem. Soc., 2018, 140, 10385–10401 CrossRef CAS; (d) Z. Li, J. R. Askim and K. S. Suslick, Chem. Rev., 2019, 119, 231–292 CrossRef CAS.
- Selected examples of fluorescence sensing of AAs: (a) X. Mei and C. Wolf, J. Am. Chem. Soc., 2006, 128, 13326–13327 CrossRef CAS; (b) Z. Huang, S. Yu, K. Wen, X. Yu and L. Pu, Chem. Sci., 2014, 5, 3457–3462 RSC; (c) E. G. Shcherbakova, T. Minami, V. Brega, T. D. James and P. Anzenbacher Jr, Angew. Chem., Int. Ed., 2015, 54, 7130–7133 CrossRef CAS; (d) K. Wen, S. Yu, Z. Huang, L. Chen, M. Xiao, X. Yu and L. Pu, J. Am. Chem. Soc., 2015, 137, 4517–4524 CrossRef CAS; (e) E. G. Shcherbakova, V. Brega, T. Minami, S. Sheykhi, T. D. James and P. Anzenbacher Jr, Chem.–Eur. J., 2016, 22, 10074–10080 CrossRef CAS.
- C. Wolf and K. W. Bentley, Chem. Soc. Rev., 2013, 42, 5408–5424 RSC.
- Selected examples of fluorescence/CD sensing assays: (a) K. W. Bentley and C. Wolf, J. Am. Chem. Soc., 2013, 135, 12200–12203 CrossRef CAS; (b) K. W. Bentley, Y. G. Nam, J. M. Murphy and C. Wolf, J. Am. Chem. Soc., 2013, 135, 18052–18055 CrossRef CAS; (c) K. W. Bentley and C. Wolf, J. Org. Chem., 2014, 79, 6517–6531 CrossRef CAS; (d) S. L. Pilicer, P. R. Bakhshi, K. W. Bentley and C. Wolf, J. Am. Chem. Soc., 2017, 139, 1758–1761 CrossRef CAS.
- Selected examples of UV/CD sensing assays: (a) X. Huang, B. H. Rickman, B. Borhan, N. Berova and K. Nakanishi, J. Am. Chem. Soc., 1998, 120, 6185–6186 CrossRef CAS; (b) J. F. Folmer-Andersen, V. M. Lynch and E. V. Anslyn, J. Am. Chem. Soc., 2005, 127, 7986–7987 CrossRef CAS; (c) J. F. Folmer-Andersen, M. Kitamura and E. V. Anslyn, J. Am. Chem. Soc., 2006, 128, 5652–5653 CrossRef CAS; (d) H. Kim, S. M. So, C. P. Yen, E. Vinhato, A. J. Lough, J. I. Hong, H. J. Kim and J. Chin, Angew. Chem., Int. Ed., 2008, 47, 8657–8660 CrossRef CAS; (e) D. Leung and E. V. Anslyn, J. Am. Chem. Soc., 2008, 130, 12328–12333 CrossRef CAS; (f) L. A. Joyce, J. W. Canary and E. V. Anslyn, Chem.–Eur. J., 2012, 18, 8064–8069 CrossRef CAS; (g) F. A. Scaramuzzo, G. Licini and C. Zonta, Chem.–Eur. J., 2013, 19, 16809–16813 CrossRef CAS; (h) H. M. Seifert, Y.-B. Jiang and E. V. Anslyn, Chem. Commun., 2014, 50, 15330–15332 RSC; (i) F. Biedermann and W. M. Nau, Angew. Chem., Int. Ed., 2014, 53, 5694–5699 CrossRef CAS; (j) L. A. Joyce, E. C. Sherer and C. J. Welch, Chem. Sci., 2014, 5, 2855–2861 RSC; (k) K. W. Bentley, P. Zhang and C. Wolf, Sci. Adv., 2016, 2, e1501162 CrossRef; (l) Z. A. De los Santos and C. Wolf, J. Am. Chem. Soc., 2016, 138, 13517–13520 CrossRef CAS; (m) E. Badetti, K. Wurst, G. Licini and C. Zonta, Chem.–Eur. J., 2016, 22, 6515–6518 CrossRef CAS; (n) P. Zardi, K. Wurst, G. Licini and C. Zonta, J. Am. Chem. Soc., 2017, 139, 15616–15619 CrossRef CAS; (o) L. Chen, S. Yu, M. Xiao, Z. Huang, K. Wen, Y. Xu, F. Zhao, X. Yu and L. Pu, Eur. J. Org. Chem., 2017, 2338–2343 CrossRef CAS; (p) Y.-W. Zhao, Y. Wang and X.-M. Zhang, ACS Appl. Mater. Interfaces, 2017, 9, 20991–20999 CrossRef CAS; (q) C. C. Lynch, Z. A. De los Santos and C. Wolf, Chem. Commun., 2019, 55, 6297–6300 RSC; (r) F. Y. Thanzeel, K. Balaraman and C. Wolf, Nat. Commun., 2018, 9, 5323 CrossRef CAS; (s) S. L. Pilicer, P. R. Bakhshi, K. W. Bentley and C. Wolf, J. Am. Chem. Soc., 2019, 141, 16382–16387 CrossRef.
- Selected examples of chiroptical sensing based on covalent substrate binding: (a) F. Y. Thanzeel, K. Balaraman and C. Wolf, Nat. Commun., 2018, 9, 5323 CrossRef CAS; (b) S. L. Pilicer, P. R. Bakhshi, K. W. Bentley and C. Wolf, J. Am. Chem. Soc., 2019, 141, 16382–16387 CrossRef.
- Selected examples of chiroptical sensing based on covalent substrate binding: (a) X. Huang, N. Fujioka, G. Pescitelli, F. E. Koehn, R. T. Williamson, K. Nakanishi and N. Berova, J. Am. Chem. Soc., 2002, 124, 10320–10335 CrossRef CAS; (b) S. Superchi, R. Bisaccia, D. Casarini, A. Laurita and C. Rosini, J. Am. Chem. Soc., 2006, 128, 6893–6902 CrossRef CAS; (c) L. Dutot, K. Wright, M. Wakselman, J.-P. Mazaleyrat, M. De Zotti, C. Peggion, F. Formaggio and C. Toniolo, J. Am. Chem. Soc., 2008, 130, 5986–5992 CrossRef CASSee also: (d) C. Wang, C. Zeng, X. Zhang and L. Pu, J. Org. Chem., 2017, 82, 12669–12673 CrossRef CAS.
- Also see initial post of this manuscript on ChemRxiv: https://doi.org/10.26434/chemrxiv.12671144.v1.
- P. Zuman, Chem. Rev., 2004, 104, 3217–3238 CrossRef CAS.
- oPA method for AA derivatization: (a) J. D. H. Cooper, G. Ogden, J. Mcintosh and D. C. Turnell, Anal. Biochem., 1984, 142, 98–102 CrossRef CAS; (b) W. A. Jacobs, M. W. Leburg and E. J. Madaj, Anal. Biochem., 1986, 156, 334–340 CrossRef CAS.
- Recent applications of oPA: (a) Y. Zhang, Q. Zhang, C. T. T. Wong and X. Li, J. Am. Chem. Soc., 2019, 141, 12274–12279 CrossRef CAS; (b) M. Todorovic, K. D. Schwab, J. Zeisler, C. Zhang, F. Benard and D. M. Perrin, Angew. Chem., Int. Ed., 2019, 58, 14120–14124 CrossRef CAS.
- Compound 5e is weakly fluorescent (emission maximum at 450 nm, Φ: 8.3% in MeOH/H2O).
- In the classic oPA labelling reactions of αAAs with alkyl thiol reagents such as 3a and 3b, the corresponding isoindole product 5 can slowly react with O2 to form oxidized by-products. In comparison, 5e with the tolyl thiolate group is stable and does not show evident decomposition in the reaction mixture within 12 hours under an air atmosphere.
- The plot of g-factor vs. ee% showed a better linear relationship than the plot of molar ellipticity vs. ee% at 10 μM (R2: 0.9935 vs. 0.9913, see the ESI† for details). Measurements of Ala at 5 μM gave acceptable sensitivity at high ee values while the sensitivity dropped considerably at 2.5 μM.
Footnotes |
| † Electronic supplementary information (ESI) available. See DOI: 10.1039/d0sc05749e |
| ‡ These authors contributed equally to this work. |
| This journal is © The Royal Society of Chemistry 2021 |

