
 Open Access Article
 This Open Access Article is licensed under a Creative Commons Attribution-Non Commercial 3.0 Unported Licence
Engineering of TMDC–OSC hybrid interfaces: the thermodynamics of unitary and mixed acene monolayers on MoS2†
Stefan R.
Kachel‡
 a,
Pierre-Martin
Dombrowski‡
b,
Tobias
Breuer
b,
J. Michael
Gottfried
a and
Gregor
Witte
*b
a,
Pierre-Martin
Dombrowski‡
b,
Tobias
Breuer
b,
J. Michael
Gottfried
a and
Gregor
Witte
*b
aFachbereich Chemie, Philipps-Universität Marburg, Hans-Meerwein-Straße 4, 35032 Marburg, Germany
bFachbereich Physik, Philipps-Universität Marburg, Renthof 7, 35032 Marburg, Germany. E-mail: gregor.witte@physik.uni-marburg.de
First published on 30th December 2020
Abstract
Hybrid systems of two-dimensional (2D) materials such as transition metal dichalcogenides (TMDCs) and organic semiconductors (OSCs) have become subject of great interest for future device architectures. Although OSC–TMDC hybrid systems have been used in first device demonstrations, the precise preparation of ultra-thin OSC films on TMDCs has not been addressed. Due to the weak van der Waals interaction between TMDCs and OSCs, this requires precise knowledge of the thermodynamics at hand. Here, we use temperature-programmed desorption (TPD) and Monte Carlo (MC) simulations of TPD traces to characterize the desorption kinetics of pentacene (PEN) and perfluoropentacene (PFP) on MoS2 as a model system for OSCs on TMDCs. We show that the monolayers of PEN and PFP are thermally stabilized compared to their multilayers, which allows preparation of nominal monolayers by selective desorption of multilayers. This stabilization is, however, caused by entropy due to a high molecular mobility rather than an enhanced molecule–substrate bond. Consequently, the nominal monolayers are not densely packed films. Molecular mobility can be suppressed in mixed monolayers of PEN and PFP that, due to intermolecular attraction, form highly ordered films as shown by scanning tunneling microscopy. Although this reduces the entropic stabilization, the intermolecular attraction further stabilizes mixed films.
Introduction
Since the first successful isolation of graphene, interest in the field of two-dimensional materials has been continuously growing.1,2 Offering a wide range of charge transport properties ranging from insulators such as hexagonal boron nitride to semiconductors like transition metal dichalcogenides (TMDCs) to semi-metallic materials such as graphene, van der Waals (vdW) bound hetero systems of 2D materials (2DMs) provide unprecedented prospects for device miniaturization in next-generation electronics.3–8 Besides the aspect of device miniaturization, the single-layer structure of these materials offers versatile possibilities for the development of flexible nanostructures with atomically sharp interfaces.9,10A promising extension of the number of possible vdW hetero systems that retains the desired 2D structure and flexibility is provided by the combination of 2DMs with thin layers of organic semiconductors (OSCs) in organic-2DM hybrid systems.11,12 Since properties of OSCs are more easily tuneable through synthesis than those of 2DMs, such hybrid heterostructures can greatly facilitate device engineering. Moreover, OSCs can complement 2DMs: while 2DMs generally have a higher charge carrier mobility, OSCs offer a high optical absorption efficiency, which renders the combination of OSCs with 2DMs particularly beneficial for optoelectronic applications such as photovoltaics.13 In fact, OSC–2DM hybrid systems have already been realized in photovoltaic devices14–17 and p–n junctions.16,18–23 However, while theoretical concept studies focus on highly ordered OSC monolayers or single molecules on 2DMs,24,25 real hybrid heterosystems are usually restricted to OSC multilayers. This is because, unlike monolayers of 2DMs that are commercially available, the fabrication of true single-layer hybrid systems remains challenging as it requires highly precise dosing in molecular beam epitaxy.
A more scalable approach to the fabrication of molecular monolayers is that of selective desorption of multilayers that is commonly applied on metallic surfaces, where the first molecular layer is often chemisorbed and thereby thermally stabilized against dewetting and 3D growth.26,27 This approach eliminates the requirement of precise thickness-control of the molecular film since any film thickness can be annealed until only the stabilized first molecular layer remains on the inorganic substrate. However, such a thermal stabilization is to date not reported for any TMDC and it is uncertain whether the relatively weak vdW interaction at the OSC–TMDC interface is capable of stabilizing the first molecular layer. Consequently, an in-depth study of the thermal stability of OSCs on TMDCs is of paramount importance, as it serves as a model system for the emerging field of engineering molecular nanostructures28,29 and could also enable a scalable fabrication of 2D OSC–TMDC hybrid heterostructures.
In this work, we present a detailed analysis of the desorption characteristics of ultra-thin pentacene (C22H14, PEN) and perfluoropentacene (C22F14, PFP) films on molybdenum disulfide (MoS2). Hybrid systems of PEN and MoS2, in particular, have already been used in various photovoltaic devices and p–n junctions with remarkable properties.16,17,19,21 Additional theoretical studies have provided first insight into electronic interactions at the PEN/MoS2 interface.24,25 In contrast to PEN, PFP is an n-type OSC.30 Although its carbon backbone is structurally identical to that of PEN, it exhibits a distinctly modified charge distribution due to its electronegative fluorine atoms that lead to an inverted quadrupole moment. Not only does the comparison of these two OSCs enable us to study influences of electronic configuration on the thermal stability of molecular monolayers, but it also provides an interesting prospect for mixed films of PEN and PFP that are additionally stabilized by intermolecular attraction as reported for their multilayer mixtures in a previous work.31 To minimize the influence of defects at the MoS2 surface on the OSC–TMDC interface, we use pristine exfoliated MoS2 single crystals on which we found epitaxial growth of PEN and PFP in a previous study.32
To study molecular desorption kinetics, we use temperature-programmed desorption (TPD) as a versatile technique for investigating the thermal evolution and interfacial bond strength of organic/inorganic hybrid systems. In recent years, TPD has been increasingly employed to study interfaces between large aromatic molecules and metals33–48 or graphite.49–52 On metals, the activation energy of desorption (often referred to as desorption energy) is commonly used as a measure for the adsorption energy, i.e. the OSC/metal binding energy. On weakly interacting substrates, however, the relation between desorption energy and interface binding energy can be more complex due to an increasing importance of entropy as a result of a larger mobility of the molecular adsorbates. Entropic effects can lead to a thermal stabilization of the first molecular layer in spite of a smaller desorption energy compared to the multilayer, as entropy can reduce the prefactor of desorption, which increases desorption temperatures.50 Since prefactors depend on a system's entropy and its partition function, they do not only depend on the molecular species,53 but also on the particular interface that can influence molecular mobility. Therefore, prefactors are generally not precisely known, which complicates the determination of reliable desorption energies from TPD as common approximations such as Redhead's method54 are not applicable. Moreover, intermolecular interactions can also noticeably influence desorption energies, especially in weakly interacting hybrid systems. While such effects are often mentioned,36,38,45,47,52 they are rarely discussed quantitatively and even then, the analysis is restricted to simple linear approximations of coverage-dependent interactions.38,52
To study intermolecular interaction energies more accurately and to understand the complex interplay of intermolecular and OSC–TMDC interactions in unitary and mixed monolayers of PEN and PFP, we combine our experimental TPD data with Monte Carlo (MC) simulations that take structural configurations and interactions of molecules into account to compute TPD traces. In addition to TPD, we use near-edge X-ray absorption fine structure (NEXAFS) spectroscopy and work function measurements by means of the Kelvin probe technique to analyze the electronic coupling of the OSCs to MoS2 as well as scanning tunneling microscopy (STM) for a characterization of the geometrical arrangement of the OSC films.
Analysis of our TPD data shows that both PEN and PFP form thermally stabilized monolayers on MoS2 that desorb at significantly higher temperatures than the respective multilayers, although desorption energies are smaller in the monolayer regime than in the multilayer regime. While this, in principle, allows for a preparation of nominal molecular monolayers by means of selective desorption of multilayers, we also find evidence for a significant intermolecular repulsion in unitary PEN and PFP films, which is attributed to their electrostatic interaction. This repulsion, coupled with a relatively weak OSC–2DM interface bond, leads to the formation of a highly mobile, gas-like phase in the unitary molecular (sub-) monolayers that prevents the formation of densely packed monolayers at room temperature. However, mutual (electrostatic) attraction of PEN and PFP can be used to increase the packing density in intermixed monolayers, as it favors the formation of ordered co-structures, which is corroborated by STM data.
Methods
Experimental details
PEN (Sigma Aldrich, purity ≥ 99.9%) and PFP (Kanto Denka Kogyo, purity ≥ 99%) films were grown by means of organic molecular beam deposition under ultrahigh vacuum (UHV) conditions from resistively heated Knudsen cells. If not stated differently, molecular films were grown at a substrate temperature of 270 K at typical deposition rates of 2 Å min−1 as monitored by quartz crystal microbalances.Similar to a previously described growth protocol,55 MoS2 crystals (2H-MoS2) were grown by means of chemical vapor transport, starting from stoichiometric amounts of Mo, S and Br2, the latter being the source for the transport agent MoBr4 that is formed in situ. The reaction was performed in an evacuated quartz glass ampoule that was subjected to a temperature gradient from 1300 K to 1220 K for 20 days. This procedure yields crystals of almost centimeter size as shown in ref. 32. The crystals were exfoliated under ambient conditions before being evacuated. Prior to the deposition of molecules, the crystals were annealed at a temperature of 650 K for 15 min.
TPD measurements were carried out in a dedicated UHV apparatus with a base pressure in the low 10−10 mbar regime, as described elsewhere.46,48 Briefly, the apparatus hosts a HIDEN EPIC 1000 quadrupole mass spectrometer (QMS) with a mass range up to 1000 amu that enables detection of the intact molecular ions PEN+ (m/z = 278 amu) and PFP+ (m/z = 530 amu). If not stated differently, TPD traces were recorded with heating rates of 1 K s−1. Sample temperatures were precisely measured using a calibrated type K thermocouple mounted on top of the MoS2 crystal.
The microstructural order of molecular thin films was characterized in UHV (base pressure < 10−10 mbar) by means of STM (Omicron VT STM) in constant current mode using etched tungsten tips at sample temperatures of 110 K. The same UHV system hosts a Kelvin Probe (Besocke Delta Phi GmbH, Kelvin Probe S) that is used for work function measurements.
NEXAFS measurements in partial electron yield mode (retarding field: 150 V) were performed at the HE-SGM dipole beam line of the synchrotron storage ring BESSY II in Berlin (Germany). Details on the experimental setup and the data analysis can be found in ref. 56.
Computational details
MC simulations of TPD traces were performed using a modified version of the algorithm described in ref. 57. Molecules are modeled as two-dimensional circular discs to describe an averaged intermolecular interaction and to account for all possible relative rotational orientation that can be expected at elevated temperatures. These discs can diffuse freely on a jellium-like substrate. Intermolecular interactions are modeled by vdW and Coulomb interactions, the latter leading to a repulsive contribution in unitary films and an attractive contribution in mixed films of PEN and PFP. Structural configurations of the adlayer after molecular diffusion are used as input to compute coverage-dependent desorption energies. Details on the model and the algorithm can be found in the ESI.† The simulated TPD traces that are shown in this work are averaged from at least 50 randomized ensembles. For unitary and mixed PEN and PFP films, we use 64 and 100 molecules, respectively, per calculated TPD trace.Results and discussion
Electronic coupling and molecular orientation
At first, we performed temperature-dependent NEXAFS measurements of PEN and PFP thin films grown on exfoliated MoS2 single crystals to find out whether the molecular monolayers are thermally stabilized and to obtain information on the molecular orientation at elevated temperatures. Therefore, we deposited 0.5 nm of the molecules on MoS2 and slowly heated the sample to incrementally increasing temperatures.58 The resulting series of spectra are shown in Fig. 1(a) and (b) for PEN and PFP, respectively. Upon annealing of the molecular films, we observe a decrease of the intensity due to desorption of molecules, with residual intensity even after annealing to 410 K. At this temperature, molecular multilayers were found to be completely desorbed on SiO2 and gold,31,41 showing that the first molecular layer of PEN and PFP on MoS2 is thermally stabilized relative to the bulk substance.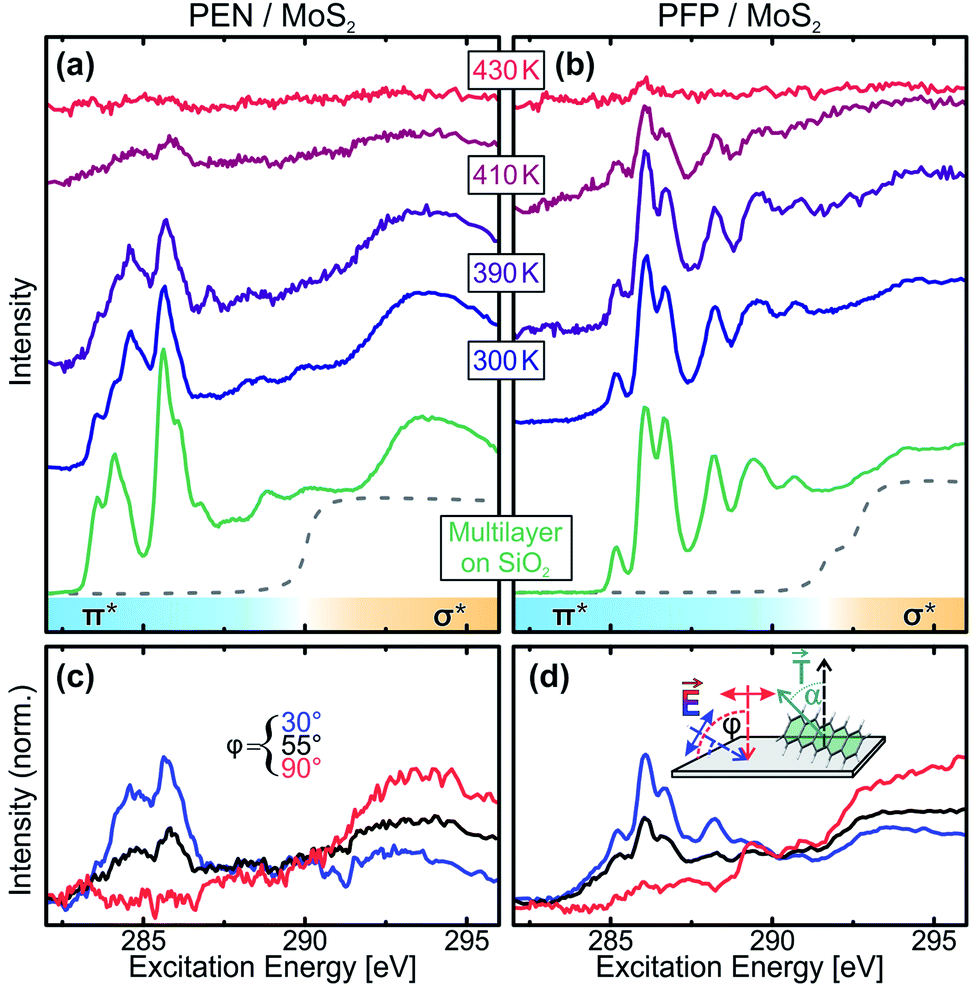 | ||
| Fig. 1 Temperature-dependent C 1s-NEXAFS spectra (φ = 55°) of (a) PEN and (b) PFP films on MoS2 (initial film thickness 0.5 nm; green spectra: multilayers on SiO2 with nominal thickness of 30 nm recorded at 300 K). The dashed lines mark the C 1s absorption edges. Panels (c) and (d) show C 1s-NEXAFS dichroism measurements of the PEN and PFP films, respectively, after annealing to 410 K. | ||
Comparing the monolayer spectra to NEXAFS spectra of multilayers of PEN and PFP on SiO2, where no coupling of the molecules to the substrate occurs (green curves), we identify a modified NEXAFS signature for the PEN monolayer on MoS2 in the sharp π*-resonances at excitation energies below the C 1s absorption edge (dashed lines). This is also found for PEN on Ag(111) and Au(111) and suggests a small chemical interaction.39,41 In contrast, no difference is found for PFP, in line with findings for Ag(111).59 Complementary Kelvin probe measurements show, however, no changes of the work function of the pristine MoS2 surface upon deposition of unitary monolayers and thin films of both molecular species as well as heterostacks of both species (for details, see the ESI†). Since, in contrast to metals, there is no push-back effect on MoS2 that could compensate work function changes caused by a charge transfer between the molecular films and MoS2, we can conclude that no notable charge transfer between the molecular films and MoS2 takes place. This agrees with a density functional theory study of PEN on MoS2 (ref. 24) and indicates that the electronic coupling of both molecular entities to MoS2 is relatively weak, in spite of the observed modification of the monolayer NEXAFS signature of PEN.
In addition to the thermal stability, we can also use NEXAFS to determine the molecular orientation on the substrate surface by quantitative analysis of the dichroism of NEXAFS spectra recorded at different angles of incidence of the synchrotron radiation as described in detail in ref. 56. In short, since the transition dipole moments (TDMs) corresponding to excitations into unoccupied π*-orbitals are oriented normal to the molecular backbone (see inset in Fig. 1(d)), the absorption of X-rays with the related photon energies depends on the relative orientation of the molecules and the polarization of the X-ray beam. Thus, one can determine the average orientation of molecules in the film by acquiring NEXAFS spectra at different sample orientations, i.e. at different angles of incidence φ. Fig. 1(c) and (d) show such measurements for acene films that were heated to 410 K. The quantitative analysis of the dichroism of the leading π*-resonances yields molecular tilt angles of α < 10°, showing that in the (sub-) monolayer regime, PEN and PFP are lying flat on the MoS2 surface even at elevated temperatures.
Thermal stability of unitary monolayers
To further investigate the nature of the thermally stabilized first layer, TPD measurements with different film thicknesses ranging from 0.5 Å to 12 Å were conducted that are shown in Fig. 2(a) and (b) for PEN and PFP, respectively. For both molecules, two clearly separated peaks are observed. The high-temperature peak occurs at all coverages, but increases in intensity and width only up to nominal film thicknesses of 3 Å. From this coverage on, a low-temperature peak begins to form that increases in height with the film thickness but exhibits the same ascending peak flank. As this behavior is characteristic for multilayer desorption, which can be well described by zeroth-order desorption kinetics,60 we ascribe the low-temperature peak to multilayer desorption and the high-temperature peak to monolayer desorption.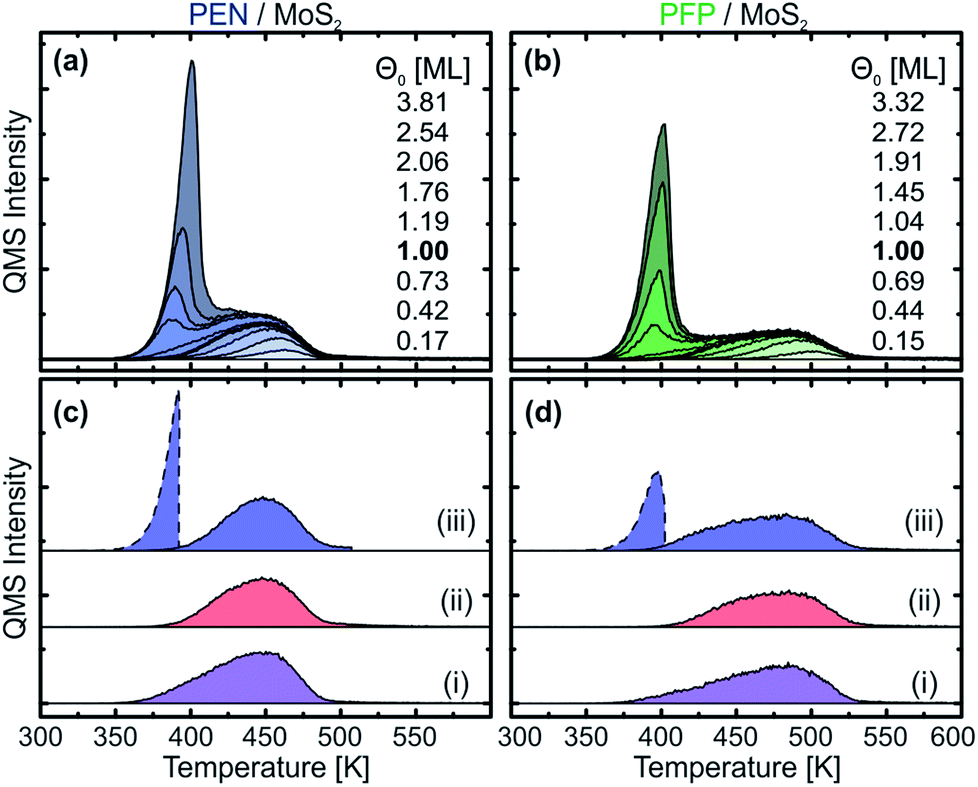 | ||
| Fig. 2 Series of TPD traces for different film thicknesses of (a) PEN and (b) PFP on MoS2. The nominal monolayers are marked with bold lines. Panels (c) and (d) depict monolayer traces of PEN and PFP, respectively, prepared with three different methods: (i) deposition of 3 Å (nominal monolayer) at 270 K, (ii) deposition of 8 Å at elevated temperature (PEN: 390 K; PFP: 400 K) and (iii) deposition of 8 Å at 270 K and subsequent annealing for 1 min (PEN: 390 K; PFP: 400 K), dashed lines indicate the desorbing multilayers upon annealing. Afterwards, the sample is cooled to 270 K and then heated again to record the TPD trace (solid line). | ||
In the monolayer regime, we find substantial differences in the desorption traces of the two molecules that range from 380 K to 490 K for PEN and from 390 K to 530 K for PFP. The higher desorption temperatures of PFP indicate a stronger interaction with MoS2 in comparison to PEN. Since for both acenes, notable multilayer desorption starts at approximately 350 K, the molecular monolayers are sufficiently stabilized to allow for a preparation of nominal monolayers by means of selective desorption of multilayers. This is shown in Fig. 2(c) and (d) for PEN and PFP, respectively, where TPD traces of nominal monolayers prepared by (i) direct deposition of 3 Å of the respective molecule (corresponding to a nominal coverage of 1 ML) at a substrate temperature of 270 K, (ii) deposition of 8 Å on a crystal at an elevated temperature (390 K for PEN and 400 K for PFP) and (iii) deposition of 8 Å at 270 K and subsequent annealing at 390 K (PEN) or 400 K (PFP) for 1 min are presented. Both annealing methods yield monolayer TPD traces with no multilayer peak, showing that nominal monolayers of PEN and PFP on MoS2 can be prepared by selective desorption of multilayers. In contrast, method (i) shows a weak low-temperature tail below 400 K that suggests an onset of multilayer formation, possibly prior to the completion of a densely packed monolayer. Therefore, we use the TPD traces obtained by method (ii), i.e. deposition of 8 Å on a hot MoS2, to define the nominal coverage of 1 ML.
The quantitative analysis of TPD traces is based on the Polanyi–Wigner equation:61
| r = νΘne−Ed/RT. | (1) |
For the quantitative analysis of Ed and ν in the multilayer regime, we have performed a leading-edge analysis.60 This analysis (for details, see the ESI†) yields desorption energies of (141 ± 3) kJ mol−1 and (149 ± 3) kJ mol−1 and prefactors of 1017.7±0.4 s−1 and 1018.5±0.4 s−1 for PEN and PFP, respectively. These values are in reasonable agreement with the PEN sublimation enthalpy of (157 ± 14) kJ mol−1,62 considering the large margins of error of the literature value. Larger sublimation enthalpies of fluorinated species compared to their non-fluorinated siblings are also reported for naphthalene and octafluoronaphthalene.63 This finding can be attributed to a slightly higher polarizability and quadrupole moment as calculated for the case of PEN and PFP,64 which enable stronger vdW interactions. A comparison of the crystalline phases of PEN and PFP revealed further a somewhat larger Kitaigorodskii packing coefficient for PFP,64 which is indicative of stronger dispersion interactions.
In the monolayer regime, the TPD traces do not exhibit the same leading-edge for different initial coverages, which can be seen more clearly in Fig. 3(a) and (b) that depict only the (sub-) monolayer TPD traces of PEN and PFP, respectively. To extract the kinetic parameters from this data, we have used a modified leading-edge analysis (mLEA) that is described in detail in a previous publication.48 This method uses only small temperature intervals (approximately 20 K) at the leading-edge of a TPD trace (corresponding to a coverage change of approx. 1%, details in the ESI†) to determine Ed and ν and can therefore provide coverage-specific values.
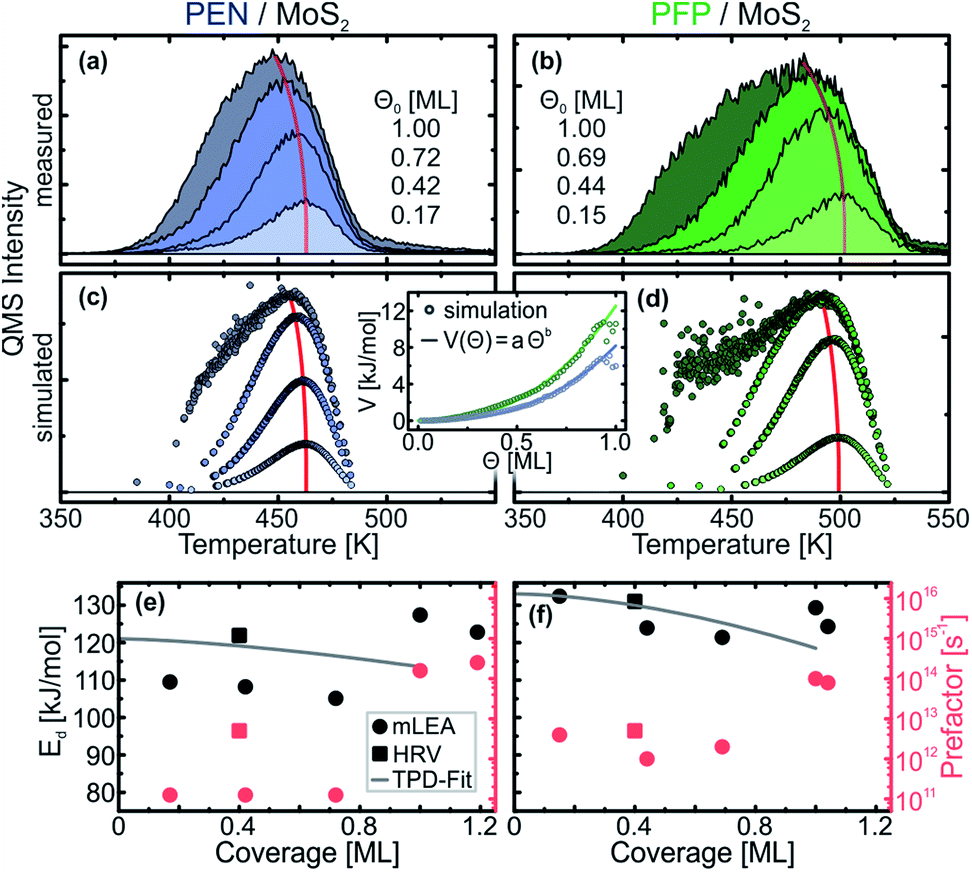 | ||
| Fig. 3 (a) and (b) TPD traces of PEN and PFP, respectively, on MoS2 for different initial (sub-) monolayer coverages Θ0. (c) and (d) MC simulations of TPD traces for PEN, respectively, for the same initial coverages as in (a) and (b). The inset shows the intermolecular interaction energy V as a function of the coverage Θ for PEN (blue) and PFP (green) obtained from the MC TPD simulations (circles) with exponential fits (lines). (e) and (f) Coverage-dependent desorption energies Ed (black) and pre-exponential factors ν (red) of PEN and PFP, respectively, on MoS2. | ||
The results of the mLEA are presented as circles in Fig. 3(d) and (e) for PEN and PFP, respectively. In the sub-monolayer regime (coverage < 0.8 ML), we find desorption energies in the range between 105 kJ mol−1 and 110 kJ mol−1 with prefactors of the order of magnitude of 1011 s−1 for PEN. Upon saturation of the monolayer, Ed increases to 127 kJ mol−1 and ν increases to 1014 s−1. For PFP, we find larger desorption energies in the range between 121 kJ mol−1 and 132 kJ mol−1 and prefactors of the order of magnitude of 1012 s−1 in the submonolayer regime. These values slightly change to 129 kJ mol−1 and 1014 s−1, respectively, upon saturation of the monolayer.
The finding of larger desorption energies for the PFP monolayer compared to the PEN monolayer is in line with the observation of an onset of monolayer desorption at higher temperatures. However, all of these kinetic parameters are significantly smaller than the respective results for multilayer desorption. In particular, desorption energies are significantly smaller in the monolayer than in the multilayer. Since notable multilayer desorption starts at lower temperatures than monolayer desorption, this result is, at first glance, rather surprising and counterintuitive. Moreover, the prefactors of both PEN and PFP are smaller than kBT/h (∼1013 s−1 at T = 400 K), which, according to transition state theory (TST), is the theoretical lowest limit for the prefactor.65 This raises the questions whether these results are robust or erroneous, possibly due to the rather low signal-to-noise ratio of the part of the leading-edge that is used in the mLEA.
To test the results of the mLEA, we have also performed heating-rate variation (HRV) experiments. Therefore, TPD traces were recorded for a selected coverage at varying heating rates. The heating rate-dependent peak temperature can then be used to derive Ed and ν independently of each other, as described in detail in ref. 48. Because this method requires multiple measurements per initial coverage, only one submonolayer coverage was used per molecule (0.4 ML for PEN and PFP). For precise control of the initial coverages, these submonolayers were prepared by deposition of 8 Å of the respective molecule and subsequent annealing to desorb multilayers and parts of the monolayer. Analysis of the initial coverages from the TPD traces shows that this method yields highly reproducible initial coverages. The HRV data and the corresponding analysis are presented in the ESI.† From the HRV analysis, we obtain Ed = (122 ± 5) kJ mol−1 and ν = 1012.7±0.5 s−1 for PEN and Ed = (131 ± 4) kJ mol−1 and ν = 1012.7±0.4 s−1 for PFP (squares in Fig. 3).
Considering the uncertainty of the mLEA (desorption energy error 4 kJ mol−1 and 9 kJ mol−1 and prefactor error 0.5 and 1.1 orders of magnitude for PEN and PFP, respectively), these HRV results are in fair agreement with those of the mLEA and thus confirm the general trend. Although the HRV desorption energies are slightly larger than those obtained from the mLEA, they are still significantly smaller than those of the multilayers. The HRV prefactors are an order of magnitude larger than those obtained from the mLEA and thus in agreement with the lower limit from TST, but still orders of magnitude smaller than typical prefactors obtained in TPD experiments with large molecules.34,49,50,53,65–70
This effect, i.e. a small desorption energy in the monolayer compared to the multilayer in combination with an increase of the prefactor upon saturation of the monolayer by several orders of magnitude, has already been observed and described in detail for 2,4′-bis(terpyridine) on highly oriented pyrolytic graphite (HOPG).50 An explanation for this phenomenon is provided by TST: the reaction rate constant kTST for the transition from the adsorbed initial state (IS) to the transition state (TS), that is the rate of desorption, can be related to the standard Gibbs free energy of activation, ΔG‡ (for a more detailed derivation, see the ESI†):71
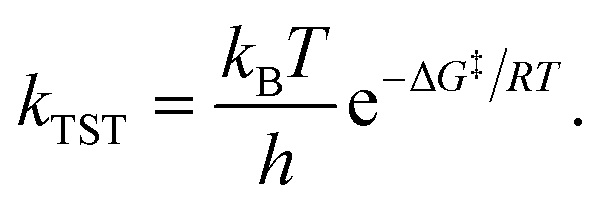 | (2) |
Using eqn (2) and the relation ΔG‡ = ΔH‡ − TΔS‡, where ΔH‡ is the standard enthalpy of activation and ΔS‡ is the standard entropy of activation, one can identify the desorption energy as71
| Ed = ΔH‡ + RT. | (3) |
With eqn (3), eqn (2) can be brought into the form kTST = νe−Ed/RT, which allows to identify the prefactor as
 | (4) |
On this basis, the exceptionally small prefactors can be interpreted. Eqn (4) shows that the prefactor scales with the entropy gain upon transition from the adsorbed IS to the TS. When a chemisorbed molecule reaches the TS for desorption, it typically gains additional degrees of freedom (DOFs) compared to the IS, because bonds to the surface break and formerly frustrated translations and rotations turn into (nearly) free translations and rotations. Therefore, the partition function in the transition state is frequently larger than in the adsorbed state, giving rise to a desorption prefactor larger than kBT/h.72
If the prefactor is in the range of kBT/h or even smaller, as is the case here, then the situation must be reversed, i.e. the TS must have a reduced number of DOFs, compared to the IS. This is the case when the adsorbed molecules are very mobile, while certain geometry restrictions apply to the TS. According to STM (see below), the adsorbed PEN molecules are indeed very mobile, resulting in large partition functions for two translation DOFs and one rotational DOF (around the axis perpendicular to the surface). In addition, due to the weak interaction with the surface, the two remaining frustrated rotations and one remaining frustrated translation (vibration perpendicular to the surface) are expected to contribute substantially to the total partition function. Especially the latter contributes only to the IS and can therefore substantially reduce the desorption prefactor. Note that the vibration perpendicular to the surface is necessarily strongly excited at the desorption temperature, because otherwise the molecule could not overcome the adsorption potential, and that the corresponding DOF does not contribute to the partition function of the TS, because it is related to the critical coordinate.
Regarding the geometry of the TS, it is obvious that the potential energy of a large planar molecule above a surface depends not only on the distance between its center-of-mass and the surface, but also on its orientation relative to the surface. This implies that the lowest-energy path of the desorption process is closely related to geometric parameters. Hence, of the many adsorption configurations available for the mobile adsorbed molecule, not all are equally suitable for the TS. The reduced number of configurations in the TS means that the partition function is reduced compared to the IS. In addition, a large planar molecule such as pentacene needs to be rather far away from the surface before it can freely rotate around all three axes. Geometry considerations for the case of pentacene show that its center-of-mass must be at least ∼7 Å above the surface, which far exceeds the vdW distance of <3 Å between the molecular plane and the substrate.73 It is therefore possible that the rotational partition function in the TS is still reduced compared to that of the gas phase. In contrast to the mobile molecules in the (sub-) monolayers, multilayers of PEN and PFP form crystalline films, as shown in a previous study.32 In these films, the molecules are immobile, resulting in a larger entropy gain upon desorption and therefore a larger prefactor for desorption.
An energetic argument for the stabilization of the mobile molecular monolayer can be made on the basis of eqn (2), which illustrates that the relevant thermodynamic potential for desorption is the standard Gibbs free energy of activation, not the standard enthalpy of activation that is closely related to the desorption energy. Consequently, the energy barrier for desorption does not only depend on the desorption energy, but also on the entropy change and thus on the prefactor. Using eqn (3) and (4), one can calculate ΔG‡mono − ΔG‡multi, i.e. the difference in the standard Gibbs free energies of activation for desorption from mono- and multilayer (for details, see the ESI†):
 | (5) |
At 400 K, eqn (5) yields a difference of the mono- and multilayer standard Gibbs free energy of activation of 19 kJ mol−1 for PEN and 26 kJ mol−1 for PFP, using the results of the HRV for the monolayer parameters. This shows that for both molecules, the barrier for desorption, given by the standard Gibbs free energy of activation, is larger in the monolayer than in the multilayer, which explains the stabilization of the molecular monolayers. The stabilization of the PEN and PFP monolayers is thus caused by entropy due to the formation of a highly mobile gas phase rather than a strong interface bond.
Upon saturation of the monolayer, the results of the mLEA (squares in Fig. 3(e) and (f)) show that the prefactors of PEN and PFP increase to about 1014 s−1, indicating a reduction of the molecular mobility. Comparing the prefactors for monolayer desorption to those for the multilayers, they are, however, still several orders of magnitude smaller. This indicates that only multilayer growth can reduce molecular mobility, which allows to conclude that no close-packed and therefore well-ordered monolayers of PEN and PFP are formed on MoS2 at room temperature, as observed for PFP on Ag(111) in a previous study.59 Hence, the nominal monolayer that can be prepared by selective desorption of multilayers does not correspond to a close-packed and therefore complete monolayer.
Intermolecular repulsion
A microscopic explanation for the formation of a highly mobile gas phase in the molecular monolayers can be found upon closer inspection of the (sub-) monolayer TPD traces. Fig. 3(a) and (b) show only the monolayer TPD traces of PEN and PFP, respectively, that exhibit a distinct peak shift to lower temperatures for increasing coverages as indicated by red lines. Such a peak shift is already reported for other systems including PEN on Au(111) and commonly attributed to (sometimes substrate-mediated) intermolecular repulsion.36,38,45,47,52 This causes a reduction of the desorption energy for increasing coverages as the repulsion increases with decreasing average nearest-neighbor distances. Such a reduction of the desorption energy at increasing coverage can also be found in Fig. 3(e) and (f) in the mLEA results for both molecules. Note that the experimental prefactors of desorption are approximately constant in the submonolayer regime up to coverages of 0.8 ML. Therefore, we exclude here the coverage- and temperature-dependence of the prefactor as the origin of the observed peak shifts.Using MC TPD simulations with electrostatic intermolecular interactions that are based on the molecular quadrupole moments calculated by density functional theory,64 we can find an estimate for the intermolecular interaction energies. Starting with the charge distribution of isolated molecules that exhibit a distinct quadrupole moment, the molecular charge distributions were represented by discrete point charges, which mediate the lateral electrostatic coupling. Slight adjustment of the effective charges in our disc-shaped molecules allows to reproduce the experimentally observed coverage-dependence of the TPD traces. The resulting simulated TPD traces are presented in Fig. 3(c) and (d) for PEN and PFP, respectively. With kinetic parameters that are close to those derived from the HRV experiments (PEN: Ed = 121 kJ mol−1, ν = 1012.5 s−1; PFP: Ed = 133 kJ mol−1, ν = 1012.7 s−1), the lowest coverage TPD traces can be reproduced accurately with Coulomb charges of q = 0.07e for PEN and q = 0.105e for PFP (for details on the modeled charge distribution, see the ESI†). The coulombic intermolecular repulsion leads, as expected, to a peak shift towards lower temperatures for increasing coverages as well as a significant broadening of the TPD traces of the saturated monolayers, in particular in the case of PFP. Only at intermediate coverages, the simulated coverage-dependent peak shift is less pronounced than the experimentally observed shift. This suggests that the real interaction potential has a somewhat longer range, i.e. decreases less strongly with distance, than the one used for the simulation.
Our simulation further allows to derive an effective potential V for intermolecular interactions as a function of the surface coverage Θ that is inversely related to the average intermolecular nearest-neighbor distance. The effective lateral interaction potentials of PEN and PFP obtained from our MD simulations are shown as circles in the inset of Fig. 3(c) and (d). Both curves can be modeled accurately by a simple exponential function of the form V(Θ) = aΘb. Fitting of this function to the simulated potential yields similar exponents b for PEN and PFP with (2.6 ± 0.1) and (2.5 ± 0.1), respectively. For the maximum interaction energy that is given by the factor a, we find (8.2 ± 0.1) kJ mol−1 and (12.5 ± 0.2) kJ mol−1 for PEN and PFP, respectively. This corresponds to ∼7% and ∼9% of the desorption energy in the zero-coverage limit, respectively, in line with a result of ∼7% reported for para-hexaphenyl on Au(111).38
The coverage-dependence of the interaction potential obtained from our MC TPD simulation can be plugged into the Polanyi–Wigner equation (eqn (1)) to determine the interaction energies directly from the experimental data. Therefore, we have used the prefactors that were also used for the MC TPD simulations, which agree with the HRV results, and fitted the Polanyi–Wigner equation with a coverage-dependent desorption energy Ed(Θ) = E0 − aΘb to the sets of TPD traces shown in Fig. 3(a) and (b). The resulting fits (see the ESI†) are in excellent agreement with the experimental TPD traces for all coverages. For the desorption energies (lines in Fig. 3(e) and (f)), we find Ed(Θ) = (121 − 7.5Θ1.5) kJ mol−1 for PEN and Ed(Θ) = (133 − 14.5Θ1.7) kJ mol−1 for PFP. In comparison to the simulation, the exponents are significantly smaller, reflecting the finding that our model somewhat underestimates the range of the intermolecular interactions. Nonetheless, the maximum interaction energies are of the same order of magnitude as those of the simulation with 7.5 kJ mol−1 for PEN and 14.5 kJ mol−1 for PFP and therefore still of the order of magnitude of only 10% of the zero-coverage desorption energy.
Intermixed monolayers
The above discussed TPD data shows that the unitary submonolayer phases of PEN and PFP are mainly entropically stabilized, i.e. by an entropy gain through the high mobility of the adsorbed molecules. These are unfavorable conditions for the formation of stable, densely packed monolayers, in which the mobility of the molecules and thus the entropic stabilization of the layer would be reduced. Therefore, it is desirable to achieve enthalpic stabilization of the monolayer by introducing attractive intermolecular interactions, which result in the formation of ordered, close-packed molecular monolayers.In a previous study on intermixed thin multilayer films of PEN and PFP, we found evidence for intermolecular attraction.31 To test whether these attractive forces also occur laterally in monolayer films with a flat-lying molecular orientation, we have conducted further TPD measurements on mixed monolayers of PEN and PFP. Fig. 4(a) shows the quasi-simultaneously recorded TPD traces of PEN (filled blue curve) and PFP (filled green curve) from an equimolar intermixture with a coverage slightly exceeding 1 ML, resulting in small multilayer desorption peaks. In comparison to the unitary PEN monolayer (blue line), the ascending flank of the PEN monolayer signal of the mixed film (filled blue curve) is less steep and the peak maximum shifts by approximately 20 K to higher temperatures, followed by a rather sharp high-temperature tail. In contrast, the TPD trace of PFP (filled green curve) is almost identical to the unitary phase (green line). Above 500 K, the TPD traces of unitary and intermixed PFP are equal because PEN has completely desorbed, leaving a nearly pristine PFP film on the surface.
 | ||
| Fig. 4 (a) Quasi-simultaneously recorded TPD traces of 0.6 ML PEN and 0.8 ML PFP in a mixed film (filled traces) and unitary films of 0.4 ML PEN (blue line) and 0.7 ML PFP (green line) on MoS2. (b) Simulated TPD traces of a randomized mixture of 0.5 ML PEN and 0.5 ML PFP (dots), 0.5 ML PEN (blue line) and 0.5 ML PFP (green line). (c) STM micrograph (−2.5 V, 250 pA, 110 K) of an intermixed monolayer of PEN and PFP on MoS2 with a linescan. The inset illustrates the alternating molecular structure. The substrate azimuth was determined from low-energy electron diffraction. (d) Illustration of the intermixed monolayer. (e) STM micrograph (−3.76 V, 120 pA, 110 K) of 8 Å PEN on MoS2 after annealing to 390 K for 1 min. (f) Illustration of a highly mobile (sub-) monolayer of PEN. | ||
Due to a continuous variation of the stoichiometric ratio of PEN![[thin space (1/6-em)]](https://www.rsc.org/images/entities/char_2009.gif) :PFP during the desorption experiment, the desorption parameters are continuously changing. This is equivalent to a superposition of many partially overlapping desorption peaks that are slightly shifted on the temperature axis with respect to each other. This results in a distorted leading-edge that yields unreasonable results using the mLEA. HRV analysis is difficult, because precise reproducibility of two coverages (for PEN and PFP) is needed to achieve identical samples for the several required experiments with different heating rates. Hence, the TPD traces of the mixed film were only analyzed qualitatively. The modified desorption behavior compared to the unitary phases of PEN and PFP can be explained by an interplay of intermolecular and molecule–substrate interactions. From our TPD traces of unitary PEN and PFP monolayers, we know that PFP desorbs at higher temperatures than PEN. Due to an electrostatic attraction between the opposing quadrupole moments of PEN and PFP,64 PFP acts as an anchor for PEN by increasing its desorption energy. However, since PFP binds stronger to MoS2 than PEN, PEN still desorbs at a higher rate than PFP until finally, only PFP remains on the substrate surface. At this point, the desorption rate of PEN rapidly drops to zero and the descending flanks of the unitary and intermixed phase PFP monolayer TPD traces are equal.
:PFP during the desorption experiment, the desorption parameters are continuously changing. This is equivalent to a superposition of many partially overlapping desorption peaks that are slightly shifted on the temperature axis with respect to each other. This results in a distorted leading-edge that yields unreasonable results using the mLEA. HRV analysis is difficult, because precise reproducibility of two coverages (for PEN and PFP) is needed to achieve identical samples for the several required experiments with different heating rates. Hence, the TPD traces of the mixed film were only analyzed qualitatively. The modified desorption behavior compared to the unitary phases of PEN and PFP can be explained by an interplay of intermolecular and molecule–substrate interactions. From our TPD traces of unitary PEN and PFP monolayers, we know that PFP desorbs at higher temperatures than PEN. Due to an electrostatic attraction between the opposing quadrupole moments of PEN and PFP,64 PFP acts as an anchor for PEN by increasing its desorption energy. However, since PFP binds stronger to MoS2 than PEN, PEN still desorbs at a higher rate than PFP until finally, only PFP remains on the substrate surface. At this point, the desorption rate of PEN rapidly drops to zero and the descending flanks of the unitary and intermixed phase PFP monolayer TPD traces are equal.
This behavior is well reproduced by our MC TPD simulations, as shown in Fig. 4(b). Note that the same interaction parameters were used for the simulation of TPD traces of unitary and mixed films of PEN and PFP. As in the experiment, we find a shift of the PEN desorption peak of the mixed film (blue dots) to higher temperatures, i.e. closer to the PFP peak, in comparison to the unitary PEN film (blue line). Although the simulated peak shift is somewhat smaller with only approximately 15 K in comparison to the experiment, the slope of the ascending flank of the PEN signal of the mixed film is reduced in comparison to the unitary film, as in the experiment. For PFP, the simulation shows no significant difference between unitary (green line) and mixed phase (green dots), which agrees well with the experiment. Only a slight shift of the PFP peak of the mixed film to higher temperatures can be seen that indicates a stabilization of PFP beyond the stabilization of the unitary PFP monolayer due to the mutual attraction of PEN and PFP.
The above discussed TPD data illustrates the importance of intermolecular interactions for the kinetic parameters, showing that molecular monolayers can be stabilized by electrostatic attraction in mixed films. However, since a quantitative analysis of the TPD data is not possible at the current state for mixed films of PEN and PFP as the mixing ratio of PEN and PFP changes dynamically, no conclusion can be drawn on the molecular mobility in the mixed film. To find out whether the mutual attraction of PEN and PFP can reduce molecular mobility and lead to the formation of an ordered, densely packed molecular layer, we have performed STM measurements on unitary and mixed films at temperatures of 110 K. Fig. 4(c) shows an STM micrograph of a mixed monolayer of PEN and PFP that clearly shows an ordered molecular structure. A contrast between neighboring molecules is visible that is caused by different electronic properties of PEN and PFP, showing that a well-ordered stoichiometric 1:1 intermixture is formed as illustrated in the inset of the figure. The linescan along a molecular row (bottom panel) shows the alternating structure of the mixed film more clearly. A vacancy in the molecular adlayer reveals a layer height of approximately 3 Å, corresponding to a flat-lying molecular orientation. A more detailed analysis of the molecular geometry can be found in the ESI.† The molecular arrangement is illustrated in Fig. 4(d).
In addition to the mixed phase, we have also conducted STM measurements on unitary monolayers on MoS2. Imaging of these films has proven to be rather challenging, which can be directly attributed to the high lateral mobility of the molecules. Fig. 4(e) shows an STM micrograph of 4 Å PEN on MoS2, corresponding to a coverage slightly above one monolayer. While no molecular structure could be resolved in the first layer and the image shows areas of instable contact caused by frequent tip changes, it is possible to image molecular islands in the second layer. A linescan across a bilayer island (bottom panel) reveals a step height of about 5 Å, which is larger than the typical height of 3 Å observed for flat-lying acenes. These findings are perfectly in line with our NEXAFS and TPD data: in the (sub-) monolayer regime, PEN lies flat on the MoS2 surface. Due to their mobility, it is not possible to image molecules in the first layer at a temperature of 110 K, as illustrated in Fig. 4(f). Upon multilayer growth, however, PEN tilts and forms a herringbone structure, leading to condensation of the highly mobile phase and formation of islands that can be imaged by STM. The molecular tilt in the multilayer phase causes an increased step height between the flat-lying first and tilted second on tilted first layer, as reported for PEN on HOPG in a previous study.43
The combination of STM with TPD reveals that the mutual electrostatic attraction of PEN and PFP is indeed capable of inducing the formation of well-ordered, close-packed molecular monolayers on MoS2, at least at a temperature of 110 K at which PEN is still mobile in its unitary phase. In the mixed film, the attractive forces between PEN and PFP add an enthalpic stabilization, which compensates for a potential loss of entropic stabilization. Using eqn (5), we can estimate the minimum intermolecular attraction required to stabilize the first molecular layer in absence of any entropic stabilization (for details, see the ESI†). Assuming equal prefactors for mono- and multilayer desorption, we obtain a minimum required stabilizing energy of (18 ± 4) kJ mol−1. For larger prefactors of monolayer desorption, a larger energy is required. From our MC TPD simulation of the mixed monolayer, we obtain a maximum interaction energy of ∼10 kJ mol−1, which is smaller than the minimum energy required for a stabilization of the first molecular layer in absence of an entropic contribution. This suggests that at elevated temperatures, molecules are still somewhat mobile in the mixed film, even though mobility might be reduced in comparison to the unitary films. In order to achieve an ordered molecular film at elevated temperatures, a stronger intermolecular attraction of at least (18 ± 4) kJ mol−1 is required.
Conclusions
In this study, we show that PEN and PFP on MoS2 form (sub-) monolayers that are stabilized with respect to their multilayer phases, preventing dewetting and 3D growth of the nominal monolayer. In contrast to, for instance, adsorption on metallic surfaces, the origin of this stabilization lies in the entropy of the mobile molecular film rather than the strength of the interfacial bond. This entropic stabilization effect has previously been reported for 2,4′-bis(terpyridine) on HOPG,50 another planar polycyclic aromatic hydrocarbon on a weakly interacting substrate, and can be expected to be a general phenomenon occurring for planar polycyclic aromatic molecules adsorbed on weakly interacting substrates (with a small corrugation of the molecule–substrate interaction potential). Considering reports of gas-like (sub-) monolayer phases of various planar polycyclic aromatic molecules on metallic surfaces,59,74–76 entropic stabilization might also occur in systems with a stronger interface bond, albeit contributing only little to the stabilization of the first molecular layer in comparison to a relatively large desorption energy.The high mobility of the molecules in the unitary monolayers can be ascribed to a combination of a relatively weak interface bond and intermolecular repulsion. Consequently, the entropic stabilization is an interface effect that can only occur in the (sub-) monolayer regime, as is illustrated in Fig. 5: in multilayer films, molecules adopt packing motifs that lead to stabilizing attractive contributions to the intermolecular interactions, for instance a herringbone packing motif (Fig. 5(a)), whereas in (sub-) monolayers, molecules are forced into a flat-lying orientation by the substrate. This results in repulsive intermolecular interactions in unitary films (Fig. 5(b)) and attractive interactions between PEN and PFP (Fig. 5(c)).
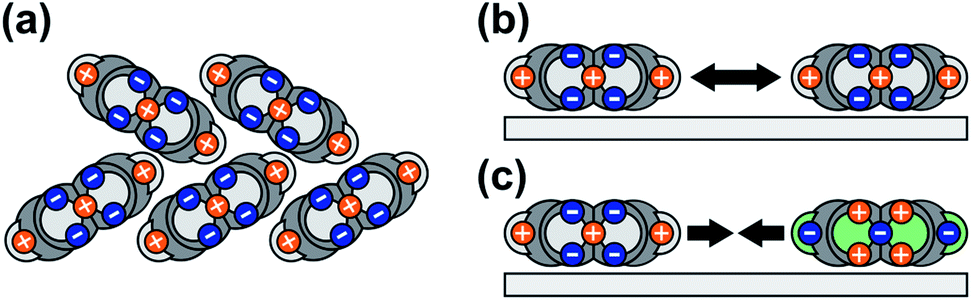 | ||
| Fig. 5 Illustration of electrostatic intermolecular interactions of PEN in a multilayer film with a herringbone packing motif (a), in a (sub-) monolayer film of PEN (b) and a mixed (sub-) monolayer film of PEN and PFP (c), shown in a side view along the long molecular axis. The molecular quadrupole moments are indicated by negative (blue) and positive (orange) point charges. | ||
These findings show that, in spite of a relatively weak interface bond, nominal molecular monolayers can be prepared on TMDCs and other weakly interacting substrates by means of selective desorption of multilayers, which is a more scalable process than the direct deposition of monolayers. The stabilization comes, however, at the price of reduced structural order and packing density: a mobile monolayer cannot be a highly ordered nanostructure. Nonetheless, such monolayers can find technical applications, for instance as spacer layers between layers of 2DMs.
Finally, we have shown that attractive intermolecular interactions can further stabilize molecular monolayers even though attraction reduces and might even completely eliminate the entropic stabilization of unitary films, thus paving the way for the preparation of highly ordered molecular films on weakly interacting substrates. Attractive intermolecular interactions in monolayers are often found in heterostructures of fluorinated and non-fluorinated OSCs,77–81 so the concept of stabilization by intermolecular attraction should be applicable beyond our model system of PEN and PFP. Molecules that are only partially fluorinated, such as the unilaterally fluorinated 1,2,10,11,12,14-hexafluoropentacene,82 could extend this concept to homomolecular films.
Author contributions
G. W. and T. B. initiated the project. T. B. and P.-M. D. performed the NEXAFS measurements. P.-M. D. performed the STM and Kelvin probe measurements and developed and ran the MC TPD simulations. S. R. K., P.-M. D. and T. B. performed the TPD measurements. S. R. K. analyzed the experimental TPD data. P.-M. D., G. W., S. R. K. and J. M. G. wrote the manuscript.Conflicts of interest
There are no conflicts to declare.Acknowledgements
We gratefully acknowledge financial support from the German Research Foundation (DFG) in the framework of the Collaborative Research Center ‘Structure and Dynamics of Internal Interfaces’ (223848855-SFB 1083, TP A2 and TP A4) and the Helmholtz-Zentrum Berlin (electron storage ring BESSY II) for provision of synchrotron radiation at the HE-SGM beamline. We further thank Steffen Zörb (Fachbereich Chemie, Philipps-Universität Marburg) for providing MoS2 crystals.Notes and references
- K. S. Novoselov, A. K. Geim, S. V. Morozov, D. Jiang, Y. Zhang, S. V. Dubonos, I. V. Grigorieva and A. A. Firsov, Science, 2004, 306, 666–669 CrossRef CAS.
- K. S. Novoselov, A. Mishchenko, A. Carvalho and A. H. Castro Neto, Science, 2016, 353, aac9439 CrossRef CAS.
- Q. H. Wang, K. Kalantar-Zadeh, A. Kis, J. N. Coleman and M. S. Strano, Nat. Nanotechnol., 2012, 7, 699–712 CrossRef CAS.
- L. Britnell, R. V. Gorbachev, R. Jalil, B. D. Belle, F. Schedin, A. Mishchenko, T. Georgiou, M. I. Katsnelson, L. Eaves, S. V. Morozov, N. M. R. Peres, J. Leist, A. K. Geim, K. S. Novoselov and L. A. Ponomarenko, Science, 2012, 335, 947–950 CrossRef CAS.
- L. Britnell, R. M. Ribeiro, A. Eckmann, R. Jalil, B. D. Belle, A. Mishchenko, Y.-J. Kim, R. V. Gorbachev, T. Georgiou, S. V. Morozov, A. N. Grigorenko, A. K. Geim, C. Casiraghi, A. H. Castro Neto and K. S. Novoselov, Science, 2013, 340, 1311–1314 CrossRef CAS.
- A. K. Geim and I. V. Grigorieva, Nature, 2013, 499, 419–425 CrossRef CAS.
- F. Withers, O. Del Pozo-Zamudio, S. Schwarz, S. Dufferwiel, P. M. Walker, T. Godde, A. P. Rooney, A. Gholinia, C. R. Woods, P. Blake, S. J. Haigh, K. Watanabe, T. Taniguchi, I. L. Aleiner, A. K. Geim, V. I. Fal'ko, A. I. Tartakovskii and K. S. Novoselov, Nano Lett., 2015, 15, 8223–8228 CrossRef CAS.
- M. Q. Zeng, Y. Xiao, J. X. Liu, K. Yang and L. Fu, Chem. Rev., 2018, 118, 6236–6296 CrossRef CAS.
- D. Akinwande, N. Petrone and J. Hone, Nat. Commun., 2014, 5, 5678 CrossRef CAS.
- W. Zhu, S. Park, M. N. Yogeesh and D. Akinwande, Flexible Printed Electron., 2017, 2, 043001 CrossRef.
- M. Gobbi, E. Orgiu and P. Samori, Adv. Mater., 2018, 30, 1706103 CrossRef.
- Y. L. Huang, Y. J. Zheng, Z. Song, D. Chi, A. T. S. Wee and S. Y. Quek, Chem. Soc. Rev., 2018, 47, 3241–3264 RSC.
- Y. Huang, W. Zheng, Y. Qiu and P. Hu, ACS Appl. Mater. Interfaces, 2016, 8, 23362–23370 CrossRef CAS.
- L.-Y. Gan, Q. Zhang, Y. Cheng and U. Schwingenschlögl, J. Phys. Chem. Lett., 2014, 5, 1445–1449 CrossRef CAS.
- S. Vélez, D. Ciudad, J. Island, M. Buscema, O. Txoperena, S. Parui, G. A. Steele, F. Casanova, H. S. J. van der Zant, A. Castellanos-Gomez and L. E. Hueso, Nanoscale, 2015, 7, 15442–15449 RSC.
- D. Jariwala, S. L. Howell, K.-S. Chen, J. Kang, V. K. Sangwan, S. A. Filippone, R. Turrisi, T. J. Marks, L. J. Lauhon and M. C. Hersam, Nano Lett., 2016, 16, 497–503 CrossRef CAS.
- S. B. Homan, V. K. Sangwan, I. Balla, H. Bergeron, E. A. Weiss and M. C. Hersam, Nano Lett., 2017, 17, 164–169 CrossRef.
- R. Chen, C. Lin, H. Yu, Y. Tang, C. Song, L. Yuwen, H. Li, X. Xie, L. Wang and W. Huang, Chem. Mater., 2016, 28, 4300–4306 CrossRef CAS.
- J.-K. Kim, K. Cho, T.-Y. Kim, J. Pak, J. Jang, Y. Song, Y. Kim, B. Y. Choi, S. Chung, W.-K. Hong and T. Lee, Sci. Rep., 2016, 6, 36775 CrossRef CAS.
- C. E. Petoukhoff, M. B. M. Krishna, D. Vori, I. Bozkurt, S. Deckoff-Jones, M. Chhowalla, D. M. O'Carroll and K. M. Dani, Phys. Rev. Lett., 2002, 89, 196103 CrossRef.
- J. Dong, F. Liu, F. Wang, J. Wang, M. Li, Y. Wen, L. Wang, G. Wang, J. He and C. Jiang, Nanoscale, 2017, 9, 7519–7525 RSC.
- H. J. Park, C.-J. Park, J. Y. Kim, M. S. Kim, J. Kim and J. Joo, ACS Appl. Mater. Interfaces, 2018, 10, 32556–32566 CrossRef CAS.
- L. Zhang, A. Sharma, Y. Zhu, Y. Zhang, B. Wang, M. Dong, H. T. Nguyen, Z. Wang, B. Wen, Y. Cao, B. Liu, X. Sun, J. Yang, Z. Li, A. Kar, Y. Shi, D. Macdonald, Z. Yu, X. Wang and Y. Lu, Adv. Mater., 2018, 30, 1803986 CrossRef.
- N. Shen and G. Tao, Adv. Mater. Interfaces, 2017, 4, 1601083 CrossRef.
- X.-Y. Xie, X.-Y. Liu, Q. Fang, W.-H. Fang and G. Cui, J. Phys. Chem. A, 2019, 123, 7693–7703 CrossRef CAS.
- S. Söhnchen, S. Lukas and G. Witte, J. Chem. Phys., 2004, 121, 525–534 CrossRef.
- F. Widdascheck, A. A. Hauke and G. Witte, Adv. Funct. Mater., 2019, 1808385 CrossRef.
- J. V. Barth, G. Costantini and K. Kern, Nature, 2005, 437, 671–679 CrossRef CAS.
- H. Liu, J. Xu, Y. Li and Y. Li, Acc. Chem. Res., 2010, 43, 1496–1508 CrossRef CAS.
- Y. Sakamoto, T. Suzuki, M. Kobayashi, Y. Gao, Y. Fukai, Y. Inoue, S. Fumio and S. Tokito, J. Am. Chem. Soc., 2004, 126, 8138–8140 CrossRef CAS.
- T. Breuer and G. Witte, J. Chem. Phys., 2013, 138, 114901 CrossRef.
- T. Breuer, T. Maßmeyer, A. Mänz, S. Zoerb, B. Harbrecht and G. Witte, Phys. Status Solidi RRL, 2016, 10, 905–910 CrossRef CAS.
- S. Lukas, S. Vollmer, G. Witte and C. Wöll, J. Chem. Phys., 2001, 114, 10123–10130 CrossRef CAS.
- K. A. Fichthorn and R. A. Miron, Phys. Rev. Lett., 2002, 89, 196103 CrossRef.
- S. Müllegger, I. Salzmann, R. Resel, G. Hlawacek, C. Teichert and A. Winkler, J. Chem. Phys., 2004, 121, 2272–2277 CrossRef.
- S. Müllegger, O. Stranik, E. Zojer and A. Winkler, Appl. Surf. Sci., 2004, 221, 184–196 CrossRef.
- S. Müllegger and A. Winkler, Surf. Sci., 2005, 574, 322–330 CrossRef.
- S. Müllegger and A. Winkler, Surf. Sci., 2006, 600, 1290–1299 CrossRef.
- D. Käfer and G. Witte, Chem. Phys. Lett., 2007, 442, 376–383 CrossRef.
- P. Frank, N. Koch, M. Koini, R. Rieger, K. Müllen, R. Resel and A. Winkler, Chem. Phys. Lett., 2009, 473, 321–325 CrossRef CAS.
- D. Käfer, C. Wöll and G. Witte, Appl. Phys. A, 2009, 95, 273–284 CrossRef.
- P. Frank, T. Djuric, M. Koini, I. Salzmann, R. Rieger, K. Müllen, R. Resel, N. Koch and A. Winkler, J. Phys. Chem. C, 2010, 114, 6650–6657 CrossRef CAS.
- J. Götzen, D. Käfer and G. Witte, Phys. Rev. B, 2010, 81, 085440 CrossRef.
- A. Winkler, Surf. Sci., 2016, 643, 124–137 CrossRef CAS.
- F. Maaß, Y. Jiang, W. Liu, A. Tkatchenko and P. Tegeder, J. Chem. Phys., 2018, 148, 214703 CrossRef.
- B. P. Klein, N. van der Heijden, S. R. Kachel, M. Franke, C. K. Krug, K. K. Greulich, L. Ruppenthal, P. Müller, P. Rosenow, S. Parhizkar, F. C. Bocquet, M. Schmid, W. Hieringer, R. J. Maurer, R. Tonner, C. Kumpf, I. Swart and J. M. Gottfried, Phys. Rev. X, 2019, 9, 011030 CAS.
- F. Maass, M. Ajdari, F. C. Kabeer, M. Vogtland, A. Tkatchenko and P. Tegeder, J. Phys. Chem. Lett., 2019, 10, 1000–1004 CrossRef CAS.
- S. R. Kachel, B. P. Klein, J. M. Morbec, M. Schöninger, M. Hutter, M. Schmid, P. Kratzer, B. Meyer, R. Tonner and J. M. Gottfried, J. Phys. Chem. C, 2020, 124, 8257–8268 CrossRef CAS.
- R. Zacharia, H. Ulbricht and T. Hertel, Phys. Rev. B: Condens. Matter Mater. Phys., 2004, 69, 155406 CrossRef.
- M. Roos, A. Breitruck, H. E. Hoster and R. J. Behm, Phys. Chem. Chem. Phys., 2010, 12, 818–822 RSC.
- J. Weippert, J. Hauns, J. Bachmann, A. Böttcher, X. Yao, B. Yang, A. Narita, K. Müllen and M. M. Kappes, J. Chem. Phys., 2018, 149, 194701 CrossRef.
- J. Weippert, P. Huber, A. Schulz, K. Y. Amsharov, A. Böttcher and M. M. Kappes, Phys. Status Solidi RRL, 2019, 1900348 CrossRef CAS.
- S. L. Tait, Z. Dohnálek, C. T. Campbell and B. D. Kay, J. Chem. Phys., 2005, 122, 164708 CrossRef.
- P. A. Redhead, Vacuum, 1962, 12, 203–211 CrossRef CAS.
- C. Piña, P. Bosch, D. Acosta, J. Barreto, A. Vazquez and E. Camarillo, J. Cryst. Growth, 1989, 96, 685–690 CrossRef.
- T. Breuer, M. Klues and G. Witte, J. Electron Spectrosc. Relat. Phenom., 2015, 204, 102–115 CrossRef CAS.
- B. Meng and W. H. Weinberg, J. Chem. Phys., 1994, 100, 5280–5289 CrossRef CAS.
- Individual heating steps took approximately 5min. Heating was stopped for the NEXAFS measurements, but sample temperatures decreased rather slowly due to the thermal capacity of the sample mount.
- M. Marks, C. Schmidt, C. H. Schwalb, T. Breuer, G. Witte and U. Höfer, J. Phys. Chem. C, 2012, 116, 1904–1911 CrossRef CAS.
- E. Habenschaden and J. Küppers, Surf. Sci., 1984, 138, L147–L150 CrossRef CAS.
- M. Polanyi and E. Wigner, Z. Phys. Chem., Abt. A, 1928, 139, 439–452 CAS.
- V. Oja and E. M. Suuberg, J. Chem. Eng. Data, 1998, 43, 486–492 CrossRef CAS.
- L. G. Radchenko and A. I. Kitaigorodskii, Russ. J. Phys. Chem., 1974, 48, 1595–1596 Search PubMed.
- M. Klues and G. Witte, CrystEngComm, 2018, 20, 63–74 RSC.
- J. M. Gottfried, E. K. Vestergaard, P. Bera and C. T. Campbell, J. Phys. Chem. B, 2006, 110, 17539–17545 CrossRef CAS.
- S. L. Tait, Z. Dohnálek, C. T. Campbell and B. D. Kay, J. Chem. Phys., 2005, 122, 164707 CrossRef.
- H. Ulbricht, R. Zacharia, N. Cindir and T. Hertel, Carbon, 2006, 44, 2931–2942 CrossRef CAS.
- J. D. Thrower, E. E. Friis, A. L. Skov, L. Nilsson, M. Andersen, L. Ferrighi, B. Jørgensen, S. Baouche, R. Balog, B. Hammer and L. Hornekær, J. Phys. Chem. C, 2013, 117, 13520–13529 CrossRef CAS.
- B. Scherwitzl, R. Resel and A. Winkler, J. Chem. Phys., 2014, 140, 184705 CrossRef.
- B. Scherwitzl, R. Lassnig, M. Truger, R. Resel, G. Leising and A. Winkler, J. Chem. Phys., 2016, 145, 094702 CrossRef.
- I. Chorkendorff and J. W. Niemantsverdriet, Concepts of Modern Catalysis and Kinetics, Wiley-VCH Verlag GmbH & Co. KGaA, Weinheim, 2003 Search PubMed.
- A. Redondo, Y. Zeiri, J. J. Low and W. A. Goddard, J. Chem. Phys., 1983, 79, 6410–6415 CrossRef CAS.
- A. Franco-Cañellas, S. Duhm, A. Gerlach and F. Schreiber, Rep. Prog. Phys., 2020, 83, 066501 CrossRef.
- D. B. Dougherty, W. Jin, W. G. Cullen, J. E. Reutt-Robey and S. W. Robey, J. Phys. Chem. C, 2008, 112, 20334–20339 CrossRef CAS.
- B. Stadtmüller, I. Kröger, F. Reinert and C. Kumpf, Phys. Rev. B, 2011, 83, 085416 CrossRef.
- S. Thussing and P. Jakob, J. Phys. Chem. C, 2016, 120, 9904–9913 CrossRef CAS.
- D. G. de Oteyza, I. Silanes, M. Ruiz-Osés, E. Barrena, B. P. Doyle, A. Arnau, H. Dosch, Y. Wakayama and J. E. Ortega, Adv. Funct. Mater., 2009, 19, 259–264 CrossRef CAS.
- Y. L. Huang, H. Li, J. Ma, H. Huang, W. Chen and A. T. S. Wee, Langmuir, 2010, 26, 3329–3334 CrossRef CAS.
- Y. Wakayama, D. G. de Oteyza, J. M. Garcia-Lastra and D. J. Mowbray, ACS Nano, 2011, 5, 581–589 CrossRef CAS.
- E. Goiri, M. Matena, A. El-Sayed, J. Lobo-Checa, P. Borghetti, C. Rogero, B. Detlefs, J. Duvernay, J. E. Ortega and D. G. de Oteyza, Phys. Rev. Lett., 2014, 112, 117602 CrossRef CAS.
- D. G. de Oteyza, J. M. Garcia-Lastra, E. Goiri, A. El-Sayed, Y. Wakayama and J. E. Ortega, J. Phys. Chem. C, 2014, 118, 18626–18630 CrossRef CAS.
- P. E. Hofmann, M. W. Tripp, D. Bischof, Y. Grell, A. L. C. Schiller, T. Breuer, S. I. Ivlev, G. Witte and U. Koert, Angew. Chem., Int. Ed., 2020, 59, 16501–16505 CrossRef CAS.
Footnotes |
| † Electronic supplementary information (ESI) available: Detailed information on the MC TPD simulation, Kelvin probe measurements of MoS2 and molecular films on MoS2, analysis of TPD traces, derivation of equations from transition state theory, estimation of energy of attractive intermolecular interactions required to overcome entropic stabilization, structural analysis of STM data. See DOI: 10.1039/d0sc05633b |
| ‡ These authors have contributed equally to this work. |
| This journal is © The Royal Society of Chemistry 2021 |