 Open Access Article
Regulation of redox balance using a biocompatible nanoplatform enhances phototherapy efficacy and suppresses tumor metastasis†
Qunying
Jiang
a,
Min
Pan
a,
Jialing
Hu
a,
Junlin
Sun
a,
Lei
Fan
a,
Zhiqiao
Zou
a,
Jianshuang
Wei
b,
Xiaoquan
Yang
b and
Xiaoqing
Liu
 *a
*a
aKey Laboratory of Analytical Chemistry for Biology and Medicine (Ministry of Education), College of Chemistry and Molecular Sciences, Wuhan University, Wuhan, Hubei 430072, P. R. China. E-mail: xiaoqingliu@whu.edu.cn
bBritton Chance Center for Biomedical Photonics, Wuhan National Laboratory for Optoelectronics, Huazhong University of Science and Technology, Wuhan, Hubei 430074, P. R. China
First published on 22nd October 2020
Abstract
Many cancer treatments including photodynamic therapy (PDT) utilize reactive oxygen species (ROS) to kill tumor cells. However, elevated antioxidant defense systems in cancer cells result in resistance to the therapy involving ROS. Here we describe a highly effective phototherapy through regulation of redox homeostasis with a biocompatible and versatile nanotherapeutic to inhibit tumor growth and metastasis. We systematically explore and exploit methylene blue adsorbed polydopamine nanoparticles as a targeted and precise nanocarrier, oxidative stress amplifier, photodynamic/photothermal agent, and multimodal probe for fluorescence, photothermal and photoacoustic imaging to enhance anti-tumor efficacy. Remarkably, following the glutathione-stimulated photosensitizer release to generate exogenous ROS, polydopamine eliminates the endogenous ROS scavenging system through depleting the primary antioxidant, thus amplifying the phototherapy and effectively suppressing tumor growth in vitro and in vivo. Furthermore, this approach enables a robust inhibition against breast cancer metastasis, as oxidative stress is a vital impediment to distant metastasis in tumor cells. Innovative, safe and effective nanotherapeutics via regulation of redox balance may provide a clinically relevant approach for cancer treatment.
Introduction
Photodynamic therapy (PDT) is one of the most promising cancer treatments that possesses prominent advantages, such as negligible drug resistance,1–3 minimal invasion,4,5 minor side effects,6 and short treatment cycles.7 With photodynamic treatment, a tremendous amount of intracellular reactive oxygen species (ROS) is generated in the presence of a photosensitizer upon light irradiation,8,9 which can result in tumor cell apoptosis because of the lesions of excessive ROS accumulation.10–13 Thus, the key element for effective PDT is to increase the intracellular levels of ROS. Until now, most of the strategies for effective PDT have been focused on directly promoting ROS production during photochemical reaction, such as selecting a photosensitizer with high singlet oxygen quantum yield,14 improving the uptake ability of photosensitizers,15,16 and supplying oxygen to tumor tissues to increase ROS levels.17,18Previous studies have shown that in response to the oxidative stress from excessive ROS,19–22 the tumor cells will maintain redox homeostasis by modulating intracellular ROS levels via ROS-scavenging systems,23 such as intracellular glutathione (GSH, a primary ROS-scavenging agent),24 superoxide dismutase, and catalase.25–28 Thus, the ROS levels are counteracted by elevated antioxidant defense mechanisms, which inevitably impairs PDT efficacy.29–32 As such, besides the direct way of improving photodynamic reactions, modulating redox homeostasis to eliminate ROS scavenging has immense potential for enhanced efficacy of PDT.33,34 However, the approach of regulating redox homeostasis has been rarely reported to realize efficient PDT. In the few efforts dedicated in this field, nanoparticles such as MnO2,35 Cu-g-C3N4,36 and Cu–MOF37 were applied to reduce ROS scavenging for PDT by the reduction of MnO2 or Cu(II). Unfortunately, transition metal-based therapy could possibly cause safety concerns, and the nanocarrier is limited to photodynamic function, without inherent potential for therapeutic synergy.35–40 For these reasons, we envisaged that modulation of intracellular redox balance by using smart nanoplatforms with good biocompatibility and diverse functions could allow effective PDT for cancer therapeutic development.
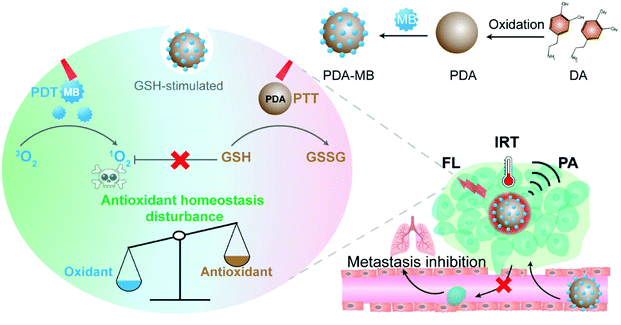
Here we demonstrate a biocompatible and versatile nanotherapeutic to regulate redox homeostasis and amplify intracellular ROS levels for enhanced phototherapy. Remarkably, this approach could effectively inhibit both primary tumors and metastatic breast cancer. As shown in Fig. 1, the facilely prepared photosensitizer–polydopamine (PDA) nanoparticles serve as an efficient anti-ROS scavenging agent, photodynamic and photothermal nanotherapeutic, as well as multimodal imaging agent. The prominent features of the amplified cancer therapeutic with polydopamine–methylene blue (PDA–MB) were systematically explored and exploited. First, PDA reacts with intracellular GSH and reduces its level, thereby impairing the antioxidant defense system of cancer cells, reversing the resistance of cancer cells to PDT, maintaining exogenous ROS produced by PDT, and thus sensitizing the cells to PDT. It should be noted that the function of PDA as an oxidative stress regulator has not been reported. Particularly, the elimination of the ROS scavenging system not only inhibits the homeostatic feedback for amplifying ROS levels, but also indicates great potential for antimetastasis, because oxidative stress has been reported as a barrier to distant metastasis very recently.41,42 Second, as a well-recognized biocompatible material,43–45 PDA delivers the FDA approved photosensitizer, MB, into tumor cells effectively. Such nanovehicles not only favor the production of plentiful ROS under irradiation but also hold promise for practical application. In addition, the adsorbed photosensitizer can be released from PDA–MB in response to overexpressed GSH in cancer cells, which is essential for tumor-specific PDT. Third, besides amplifying PDT, PDA also has excellent inherent photothermal conversion efficiency for photothermal therapy (PTT). Fourth, the nanoplatform is capable of multiplex imaging including fluorescence (FL), infrared thermal (IRT) and photoacoustic (PA) imaging to guide cancer treatment, and the multimodal probe provides an additional advantage of precise therapy. Therefore, the explored diverse functions enable this nanotherapeutic with immense potential for safe, effective, and precise cancer treatment. To the best of our knowledge, neither the function of PDA for regulating oxidative stress nor the nanomedicine-modulated oxidative stress for suppressing metastatic cancer has yet been explored.
Results and discussion
Preparation and characterization of PDA–MB
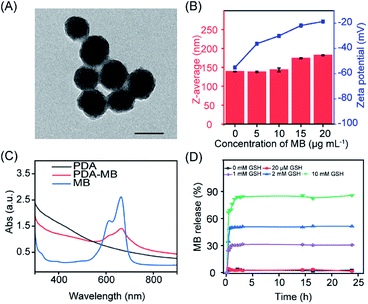
The PDA–MB was prepared at room temperature in a facile way by adsorption of MB onto self-polymerized PDA. Transmission electron microscopy (TEM) and scanning electron microscopy (SEM) images revealed that PDA–MB and PDA both had spherical structures with average diameters of 90 nm (Fig. 2A, S1 and S2†). Dynamic light scattering (DLS) analysis showed that the PDA–MB had a slight increase in hydrodynamic diameter and demonstrated reduced negative charges with elevated adsorption of MB onto PDA (Fig. 2B). A characteristic peak at 667 nm for PDA–MB matched well with that of MB in the UV-vis spectra (Fig. 2C), suggesting successful loading of MB. By adjusting the MB feed ratio (Fig. S3 and S4†), the loading efficiency of MB could reach up to 91.35% when utilizing 20 μg mL−1 MB and 100 μg mL−1 PDA for PDA–MB synthesis, while bigger ratios (MBweight/PDAweight > 1![[thin space (1/6-em)]](https://www.rsc.org/images/entities/char_2009.gif) :
:![[thin space (1/6-em)]](https://www.rsc.org/images/entities/char_2009.gif) 5) resulted in aggregation. The strong adsorption of the cationic MB onto PDA is via electrostatic attraction and π–π stacking,43,46 because the surface of PDA has high contents of primary and secondary amines as well as catechol and quinones.47 To mimic the cancerous microenvironment for potential therapeutic applications, PDA–MB was subjected to different concentrations of glutathione (GSH) and H2O2, which are overexpressed in the tumor environment. Time-dependent release profiles (Fig. 2D and S5A†) showed that addition of 0, 0.02, 1, 2, and 10 mM GSH resulted in 3.0%, 4.62%, 30.3%, 50.7%, and 84.5% of MB release from PDA–MB, whereas PDA–MB was not responsive to H2O2 stimulus. We also evaluated the effect of pH, including the tumor microenvironment pH (6.5–6.8), on MB release. Within 24 h, less than 8% release was observed at pH 7.4 and 6.5, and only very acidic pH (5.0) induced 24% release (Fig. S5B†). Additionally, there was relatively limited release behaviour (around 13%) in the presence of 5% bovine serum albumin (BSA) and 10% serum (Fig. S5C†), compared with that of GSH (around 85%). Such an accelerated MB release from PDA–MB upon GSH stimulus suggested a disruption of the π–π stacking and electrostatic interactions between PDA and MB. This was possibly because GSH could react with the quinone groups on the surface of PDA through the Schiff base reaction and Michael addition,45 sequentially inducing the MB release. The reaction between GSH and PDA–MB was further confirmed by zeta potential, hydrodynamic diameter analysis, and FTIR (Fourier transform infrared spectroscopy) (Fig. S6–S8†). When PDA–MB was incubated with a low concentration of GSH, the zeta-potential of PDA–MB remained unchanged, whereas a high level of GSH induced a significant decrease of zeta-potential (Fig. S6†). Similarly, a gradual increase of hydrodynamic diameter was observed over time in the presence of highly concentrated GSH, and only a negligible size change of PDA–MB was obtained for a low GSH level (Fig. S7†). In addition, comparisons of the FTIR spectra showed that the peak at 2524 cm−1 from –SH stretching vibration of GSH disappeared in the spectrum of the PDA adduct, while a new peak located at 1733 cm−1 was observed that originated from –COOH groups in GSH, which indicated the combination between GSH and PDA (Fig. S8†). Considering that cancer cells compared to other biological environments overexpress GSH (2–10 mM),48 the tumor microenvironment-stimulated release of the photosensitizer can facilitate targeted activation of ROS generation, which is vital for effective PDT.
5) resulted in aggregation. The strong adsorption of the cationic MB onto PDA is via electrostatic attraction and π–π stacking,43,46 because the surface of PDA has high contents of primary and secondary amines as well as catechol and quinones.47 To mimic the cancerous microenvironment for potential therapeutic applications, PDA–MB was subjected to different concentrations of glutathione (GSH) and H2O2, which are overexpressed in the tumor environment. Time-dependent release profiles (Fig. 2D and S5A†) showed that addition of 0, 0.02, 1, 2, and 10 mM GSH resulted in 3.0%, 4.62%, 30.3%, 50.7%, and 84.5% of MB release from PDA–MB, whereas PDA–MB was not responsive to H2O2 stimulus. We also evaluated the effect of pH, including the tumor microenvironment pH (6.5–6.8), on MB release. Within 24 h, less than 8% release was observed at pH 7.4 and 6.5, and only very acidic pH (5.0) induced 24% release (Fig. S5B†). Additionally, there was relatively limited release behaviour (around 13%) in the presence of 5% bovine serum albumin (BSA) and 10% serum (Fig. S5C†), compared with that of GSH (around 85%). Such an accelerated MB release from PDA–MB upon GSH stimulus suggested a disruption of the π–π stacking and electrostatic interactions between PDA and MB. This was possibly because GSH could react with the quinone groups on the surface of PDA through the Schiff base reaction and Michael addition,45 sequentially inducing the MB release. The reaction between GSH and PDA–MB was further confirmed by zeta potential, hydrodynamic diameter analysis, and FTIR (Fourier transform infrared spectroscopy) (Fig. S6–S8†). When PDA–MB was incubated with a low concentration of GSH, the zeta-potential of PDA–MB remained unchanged, whereas a high level of GSH induced a significant decrease of zeta-potential (Fig. S6†). Similarly, a gradual increase of hydrodynamic diameter was observed over time in the presence of highly concentrated GSH, and only a negligible size change of PDA–MB was obtained for a low GSH level (Fig. S7†). In addition, comparisons of the FTIR spectra showed that the peak at 2524 cm−1 from –SH stretching vibration of GSH disappeared in the spectrum of the PDA adduct, while a new peak located at 1733 cm−1 was observed that originated from –COOH groups in GSH, which indicated the combination between GSH and PDA (Fig. S8†). Considering that cancer cells compared to other biological environments overexpress GSH (2–10 mM),48 the tumor microenvironment-stimulated release of the photosensitizer can facilitate targeted activation of ROS generation, which is vital for effective PDT.
Enhanced ROS production by PDA–MB
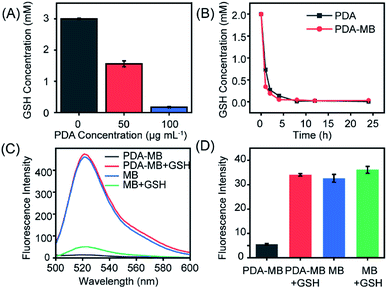
Encouraged by the reaction between PDA and GSH, we then systematically studied GSH depletion by PDA–MB to investigate the capability of PDA to modulate redox balance. For further verifying the reduction of GSH by PDA, 5,5′-dithiobis-(2-nitrobenzoic acid) (DTNB), which reacts with GSH and produces 2-nitro-5-thiobenzoic acid (TNB) with a characteristic absorption peak at 412 nm, was used as an indicator to monitor GSH levels.49,50 The amount of GSH consumption was investigated by adding different concentrations of PDA to a fixed amount of GSH. Fig. 3A showed strikingly less GSH in PDA solution, and about 3 mM GSH was consumed by 100 μg mL−1 PDA solution. Moreover, a time-dependent study suggested that as time extended, PDA and PDA–MB could react with a large amount of GSH and deplete it effectively within 1 hour, and both had equal GSH consumption ability (Fig. 3B). A gradually decreased absorbance intensity of PDA was observed over time in the presence of GSH, indicating that PDA could react with GSH (Fig. S9†). These results indicated that PDA could interact with GSH and reduce GSH levels. Thus, PDA–MB could act as an efficient antioxidant scavenger to modulate redox balance.In biological systems, GSH is the primary ROS-scavenging agent (antioxidant),24 and thus, depletion of GSH is supposed to benefit ROS accumulation.51 With the proof of GSH consumption by PDA in hand, we then analyzed the capacity of PDA to promote ROS generation with a ROS fluorescent probe, 2′,7′-dichlorofluorescein (DCFH). Fig. 3C shows the ROS levels produced from different systems under irradiation, including MB, MB with GSH, PDA–MB, and PDA–MB with GSH. The ROS level generated from free MB was considerably higher than that from the PDA–MB system, because the excited state of the photosensitizer is quenched due to electron transfer between the photosensitizer (electron donor) and nanocarrier (electron acceptor).52,53 However, addition of GSH to the MB solution reduced the ROS amount, demonstrating that GSH could eliminate ROS. Also, PDA–MB induced elevated ROS levels in the presence of GSH, attributed to the release of MB from PDA–MB in response to GSH stimulus. When subjected to GSH, the PDA–MB system demonstrated remarkably elevated levels of ROS compared to that of the free MB system, which indicated that PDA was capable of depleting GSH and thus amplifying ROS production. It should be noted that to estimate the GSH-induced release amount of MB from PDA–MB for normalizing MB's contribution to ROS, we monitored the fluorescence of MB derived from different systems (Fig. 3D). Negligible fluorescence was observed for 100 μg mL−1 PDA–MB; however, after incubation with 1 mM GSH, this system had similar high fluorescence intensity to that of 2 μg mL−1 free MB. The data suggested that the released MB was appropriately 2 μg mL−1 under these conditions. That's why the ROS level from PDA–MB incubated with GSH was close to that of the free MB, as shown in Fig. 3C. Taken together, all the above results manifested the capability of PDA–MB to enhance ROS generation leading to oxidative stress amplification under light irradiation through the depletion of GSH by PDA.
Promoted intracellular ROS levels by modulation of redox homeostasis with PDA–MB for effective in vitro PDT
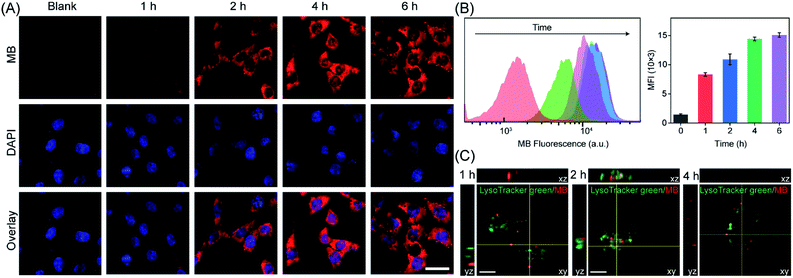
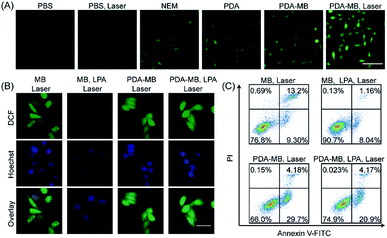
It is known that GSH is a highly-expressed antioxidant in tumor cells, acting as a ROS-scavenging system to maintain redox homeostasis.51 Thus, during PDT, the inhibition of ROS feedback scavenging by PDA-regulated redox homeostasis will amplify oxidative stress. Encouraged by the regulation of GSH and enhanced production of ROS by PDA–MB in the aqueous solution mimicking the cancerous environment, we investigated the feasibility of ROS promotion in cancer cells by PDA–MB. First, time-dependent fluorescence intensity of HeLa cells upon PDA–MB incubation was studied with confocal microscopy and flow cytometry (Fig. 4A and B). The dynamic analysis demonstrated good cellular uptake efficiency of PDA–MB. Next, the HeLa cells incubated with PDA–MB for different times were then stained with LysoTracker Green to observe the colocalization of PDA–MB and lysosomes.54Fig. 4C and S10† show the fluorescence images of HeLa cells treated with PDA–MB, where the green fluorescence corresponds to lysosomes stained with LysoTracker Green, and the red fluorescence corresponds to the MB. The red fluorescence of PDA–MB and the green fluorescence of LysoTracker overlapped well at 2 h. However, the Pearson's colocalization coefficient decreased at 4 h, demonstrating the lysosomal escape of PDA–MB. Subsequently, HeLa cells with different treatments were incubated with DCFH-DA, a ROS probe that can produce green fluorescence, and the intracellular ROS levels were monitored by fluorescence microscopy and flow cytometry (Fig. 5A and S11†). Fluorescence images showed that upon incubating the cells with PDA or PDA–MB green luminescence appeared, suggesting restoration of the intracellular ROS level by PDA through GSH depletion. Irradiation treatment led to a brighter luminescence of the cells incubated with PDA–MB, thanks to the ROS generation from MB and the ROS protection through GSH depletion by PDA. Consistent with the fluorescence imaging results, flow cytometric analysis exhibited that the presence of PDA or PDA–MB increased the intracellular ROS levels, and laser irradiation further provided more ROS. The fluorescence results from both fluorescence imaging and flow cytometry suggested a synergistic ROS promotion from homeostatic feedback inhibition-involved endogenous and exogenous ROS activation, as well as photosensitizer-involved exogenous ROS production. To verify the capability of PDA–MB to deplete intracellular GSH levels, the GSH/GSSG ratio in living cells was measured. Specifically, HeLa cells incubated separately with a commercially available GSH scavenger agent (NEM, N-ethylmalemide), GSH synthesis enhancer (LPA, α-lipoic acid), and PDA–MB were collected and extracted for analyzing GSH amount. As shown in Fig. S12,† the GSH/GSSG ratio in HeLa cells treated with PDA–MB was lower than that of the cells treated with NEM. This comparison clearly indicated that PDA–MB possesses superior capability to down-regulate intracellular GSH levels, which in turn suggests a promotion of ROS generation using PDA–MB.Following that, we treated HeLa cells with LPA for up-regulating the intracellular GSH levels to investigate the effect of antioxidant level on ROS generation. First, we cultured HeLa cells with PDA–MB and different concentrations of free MB separately and analyzed the mean fluorescence intensity of MB in HeLa cells by flow cytometry (Fig. S13†). Comparison indicated that the cells treated with either 2 μg mL−1 free MB or 100 μg mL−1 PDA–MB (equal to 2 μg mL−1 free MB) had similar fluorescence signals. This result suggested that upon intracellular GSH stimulus, the released amount of MB from PDA–MB was equal to the internalized free MB level, which was consistent with the previous aqueous solution results shown in Fig. 3. Combining the results from the solution and intracellular studies, the intracellular ROS generation capacity of the MB released from PDA–MB in response to GSH is similar to that of the free MB under the current conditions. Referring to the above conditions, HeLa cells pretreated with or without LPA were separately incubated with PDA–MB (100 μg mL−1) and free MB (2 μg mL−1) and exposed to laser irradiation. Because in the two systems (PDA–MB and free MB) MB's contribution to ROS in living cells was normalized as indicated above, we could then compare and focus on the influence of PDA on intracellular ROS generation. The resulting ROS levels in HeLa cells cultured with different materials under irradiation were visualized using a fluorescence microscope (Fig. 5B). For HeLa cells incubated with free MB, the ROS levels decreased upon addition of LPA (a GSH enhancer), confirming the ROS scavenging by the intracellular antioxidant (GSH). However, for HeLa cells incubated with PDA–MB, the ROS level was high and remained constant upon addition of LPA. This indicated successful elimination of the endogenous ROS scavenging system by PDA. In addition, the PDA–MB group showed a higher ROS level than the MB group, and the PDA–MB plus LPA group showed an evidently enhanced ROS amount compared to the MB plus LPA group, both demonstrating again the important role of PDA in regulating intracellular redox balance and the corresponding promotion of ROS generation. All the results demonstrated that the inhibition of the homeostatic feedback in response to PDT treatment was essential to amplify ROS production. Consistent with the previous results, these data manifested the potential of PDA–MB for amplified PDT in vitro.
Next, HeLa cells were separately cultured with PDA–MB and free MB, exposed to laser irradiation, and stained with annexin V-FITC and propidium iodide for apoptosis assay (Fig. 5C). The incubation of HeLa cells with MB and PDA–MB plus irradiation resulted in apoptosis ratios of 22.5% and 33.88%, respectively, which demonstrated that PDA–MB had an effective photocytotoxicity against tumor cells compared to free MB. To verify that the GSH modulation function of PDA–MB benefited the efficiency of PDT certainly, the HeLa cells were treated with MB plus LPA and PDA–MB plus LPA, respectively. When the intracellular GSH level was increased, the apoptotic cells treated with MB plus LPA were only 9.2%. The result indicated that the GSH level had significant negative effects on PDT. Compared with the above results, the apoptotic cells treated with PDA–MB plus LPA were 25.07%, which was close to the apoptosis rate of cells treated only with PDA–MB. These data verified that PDA–MB could attenuate ROS scavenging by GSH, demonstrating a high photodynamic effect even at relatively high antioxidant levels. All the results indicated that PDA is a good candidate to amplify intracellular ROS levels by regulating redox balance to improve the therapeutic effect of PDT.
In vitro phototherapeutic performance of PDA–MB to inhibit tumor growth and metastasis
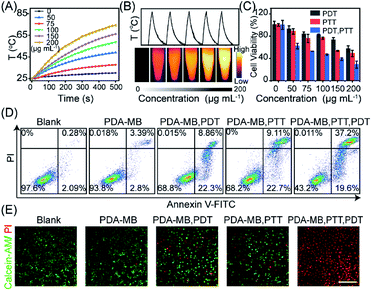
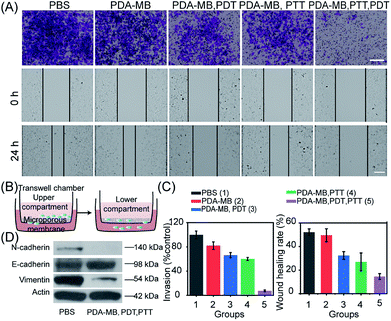
Besides the potent PDT efficacy attributed to the amplified intracellular ROS levels and the correspondingly improved in vitro PDT, the photothermal conversion efficiency of PDA–MB was evaluated (Fig. S14 and Table S1†).55 Time-dependent kinetics and thermographic images of PDA–MB at different concentrations demonstrated distinct temperature increase upon irradiation (Fig. 6A and B). The higher the concentrations of PDA–MB and power density applied, the greater the degree of temperature increase (Fig. S15A†). The control experiment indicated that PDA–MB and PDA had comparable high photothermal efficiencies, whereas MB and water showed negligible temperature changes (Fig. S15B†). In addition, recycling heating curves demonstrated excellent photothermal stability of PDA–MB (Fig. 6B). These results clearly proved that PDA–MB had excellent photothermal performance.In vitro phototherapeutic performance of PDA–MB was then systematically investigated. The in vitro phototoxicity was evaluated by MTT assay using HeLa cells incubated with PDA–MB under irradiation (Fig. 6C). As expected, cell viability was related to the amount of PDA–MB and decreased to the most extent when the cells were subjected to both PDT and PTT. The control experiment showed that no obvious cytotoxicity was observed for PDA and PDA–MB in the dark (Fig. S16†). It could be seen that phototherapy with PDA–MB was favorable, because PDA–MB had capability for ROS regulation to reach the threshold of cytotoxicity, as well as good biocompatibility. Correspondingly, cell apoptosis was determined by flow cytometry using HeLa cells co-stained with annexin V-FITC and propidium iodide. As shown in Fig. 6D, PTT or PDT led to more apoptotic cells (31.36% and 31.81%, sum of annexin V-FITC+/PI+ and annexin V-FITC+/PI−) than the groups without irradiation (6.19%), and the synergistic therapy led to the most apoptotic cells (56.8%). Specifically, photodynamic activation of PDA–MB resulted in a higher ratio of apoptotic cells than that of MB. To intuitively display the therapeutic efficiency, live–dead cell staining was performed by co-staining the cells with calcein-AM (green fluorescence) and propidium iodide (red fluorescence) (Fig. 6E). Likewise, confocal images demonstrated an effective phototherapeutic efficacy of the platform for in vitro anticancer treatment. Based on the excellent in vitro anticancer performance, we also assessed the anti-metastasis capacity of phototherapy with PDA–MB, inspired by recent reports on the relationship between oxidative stress and distant tumor metastasis.41,42 Cell invasion and motility are crucial for cancer metastasis,56 and thus we performed cell invasion and wound healing assays (Fig. 7A and B). The quantitative results showed that the invasion rate of the cells treated with this approach was reduced to 7.52%, indicating that the invasion was suppressed most greatly compared with other treatments. Similarly, compared with control groups, the scratched space for the treatment with PDA–MB plus PTT and PDT was minimally changed (wound healing rate, 13.87%) (Fig. 7C). The progression of epithelial–mesenchymal transition (EMT) is essential for cancer cell metastasis and tumor expansion, and the loss of E-cadherin expression accompanied by the overexpression of N-cadherin as well as the intermediate filament protein expression (such as vimentin) is the main feature of the EMT process.57 We analyzed the levels of metastasis-relevant protein markers by western blotting to further investigate metastasis inhibition with the nanomedicine. Fig. 7D shows that the cells treated with PDA–MB plus PDT and PTT upregulated E-cadherin levels and downregulated N-cadherin and vimentin levels, indicating that our approach could influence the expression of metastasis-relevant proteins. These results indicated that the synergistic phototherapy with PDA–MB could significantly suppress metastasis in vitro.
Multimodal imaging guided in vivo suppression of primary tumor and metastatic cancer with PDA–MB
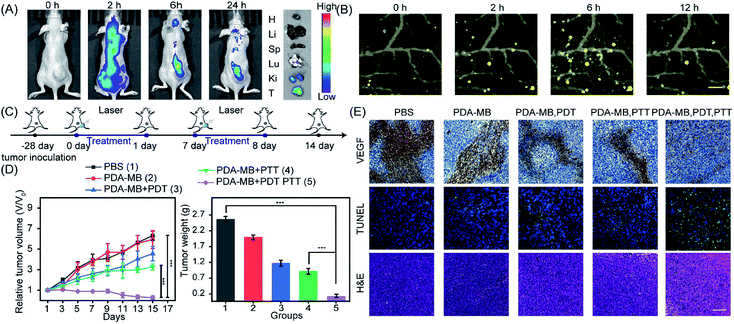
To measure the in vivo antitumor efficacy of phototherapy with PDA–MB, we established a xenograft tumor model by subcutaneous injection of HeLa cells into BALB/c nude mice. Before treatment, fluorescence and photoacoustic imaging was used to monitor the accumulation of PDA–MB in mouse bodies. Time-dependent in vivo fluorescence imaging of tumor-bearing mice showed that the fluorescence signal of MB was detected at the tumor site 2 h after injection and still existed at 24 h after injection (Fig. 8A). The distribution of PDA–MB in mouse organs was evaluated by harvesting the tumor and organs from sacrificed mice after 24 h, and most of the PDA–MB was accumulated at the tumor and lung sites at 24 h post-injection (Fig. 8A and S17†). The photoacoustic signals were detected at various times at the tumor site in the mice under 744 nm laser irradiation after intravenous injection with PDA–MB (Fig. 8B). It could be found that the photoacoustic signals were rapidly enhanced and the signal intensity reached the maximum at 6 h (Fig. S18†). The results of fluorescence and PA imaging implied that PDA–MB could effectively target and accumulate at the tumor site within 6 h. Further in vivo analysis monitored using an infrared thermal camera revealed that upon 808 nm laser irradiation, the mice intravenously injected with PDA–MB had a great temperature increase at the tumor site compared with the mice injected with PBS (Fig. S19A and B†). Thus, the comparison of the in vivo photothermal images indicated an effective photothermal ablation of tumors resulting from specific distribution.Guided by the results of the multimodal imaging, the tumor-bearing mice were then randomly divided into five groups with different treatments to evaluate the in vivo efficacy of the phototherapy. Background controls of the first two groups using mice injected with PBS (group 1) and PDA–MB (group 2) received no laser irradiation. Two groups of mice were injected with PDA–MB and separately exposed to 660 nm (group 3) and 808 (group 4) nm laser irradiation at 6 h and 12 h post-injection. In the fifth of the assigned groups, the mice were injected with PDA–MB, and then were irradiated with 808 and 660 nm laser light (Fig. 8C). The tumor growth was investigated for 15 days, and the tumor volume, weight, and size were measured as shown in Fig. 8D and S20.† Comparison of different treatments implied that significant inhibition of tumor growth was achieved for groups 3, 4, and group 5, with the synergistic PDT and PTT treatment producing the most effective antitumor benefits. Furthermore, vascular endothelial growth factor (VEGF), terminal deoxynucleotidyl transferase-mediated deoxyuridine triphosphate nick-end labeling (TUNEL), and hematoxylin and eosin (H&E) staining of tumor slices harvested from mice after 15 days of different treatments were investigated to determine the efficacy of the therapy. Immunohistochemistry analysis revealed that synergistic phototherapy minimized the VEGF level, demonstrating a prominent inhibition of tumor progression. The TUNEL assay illustrated strong green fluorescence from the tissues of group 5, implying serious apoptosis of the tumor cells. Histological characteristics of tumor tissues were studied by H&E staining. Compared with other groups, group 5 had more evident destruction of membrane integrity and deformation and shrinking of nuclei, which suggested a high level of apoptosis (Fig. 8E). In addition, DCFH-DA (ROS probe) staining of the tumor slices indicated that the PDT treatment with PDA–MB induced abundant ROS (Fig. S21†). To verify the critical role of PDA in eliminating the in vivo ROS scavenging system that resists PDT (exogenous ROS), we measured the GSH/GSSG level at the tumor site in mice with different treatments, and acquired the tumor tissue homogenate at 24 h post-injection for analyzing the GSH/GSSG ratio (Fig. S22†). The data showed that the nanotherapeutic could downregulate the GSH/GSSG level to the utmost in tumors, revealing that it was the inhibition of the homeostatic feedback that amplified ROS. Taken together, these findings establish that the PDA–MB nanoplatform is capable of amplifying PDT by modulating oxidation stress and serves as an efficient phototherapy for cancer suppression.
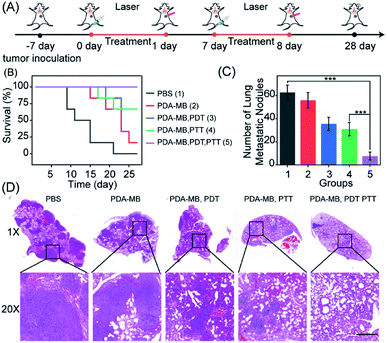
Tumor cells will increase their antioxidant capacity to withstand the cellular oxidative stress they experience, as they travel through the bloodstream and initiate new metastatic lesions.41 It has been reported that oxidative stress is a barrier to distant metastasis in tumor cells,42 and the use of pro-oxidants and inhibitors of the antioxidant response would overcome the cellular antioxidant capacity of cancer cells and prevent metastases.44 Thus, the inhibition of antioxidants and amplified oxidative stress with PDA–MB may be favorable for treating lung metastatic breast cancer. To confirm the in vivo antimetastasis efficacy of phototherapy with PDA–MB, 4T1 cells were planted into mammary fat pads of BALB/c mice to establish a xenograft breast cancer model. Following the set-up to investigate metastasis (Fig. 9A), we recorded the mouse survival rate to monitor the therapeutic effect. In the mice treated only with PBS, the tumors grew quickly and resulted in their death within 28 days. In contrast, the tumors were greatly inhibited or even eliminated in the mice treated with PDA–MB plus PDT and PTT, and all mice in this group survived over 28 days (Fig. 9B). Because of the high capillary vasculature, the lungs are often the target site of metastatic tumor cells at later stages. The representative photographs of lung tissues in different groups of mice are displayed in Fig. S23.† As expected, distinct tumor metastasis occurred in the PBS group, whereas the mice treated with PDA–MB plus PTT and PDT had no noticeable lung metastasis. By calculating the number of metastatic node on the surface of the lungs, it could be seen that the treatment exploring PDA–MB plus PDT and PTT effectively decreased the number of metastatic node in the lungs (Fig. 9C). In addition, the representative H&E staining image of lung slices showed fewer metastasis tumors in the PDA–MB plus laser group (Fig. 9D). These results demonstrated that PDA–MB could effectively prevent breast cancer metastasis in vivo.
In vivo safety profile of PDA–MB
Biosafety of nanoparticles or phototherapy is essential for biomedical applications; therefore, the biosafety of PDA–MB was evaluated systematically by a hemolytic test, biochemical indexes, and H&E assay. The hemolysis ratio shown in Fig. S24† is lower than 3%, which indicates that PDA–MB has excellent hemocompatibility. Then the pharmacokinetics profiles of PDA–MB and MB were examined. PDA–MB and MB were intravenously injected at a dose of 10 mg kg−1 MB. The blood concentration of MB was acquired via measuring the fluorescence of MB. As shown in Fig. S25,† the group treated with PDA–MB showed 2.2-fold blood clearance half-life. The pharmacokinetics profiles of both PDA–MB and free MB consistently suggested that the MB-loaded PDA particles could elongate their blood circulation time and enhance their accumulation at the tumor site. After tumor treatment, the mice were monitored by measuring the levels of various biomarkers, and a normal range was obtained for each blood index (Fig. S26†). The H&E staining of major organs including the heart, liver, spleen, lungs, and kidneys demonstrated that no obvious toxicity occurred (Fig. S27†). These findings demonstrate that the PDA–MB has good biocompatibility besides possessing high phototherapeutic efficacy, and thus holds great promise for cancer treatment.Conclusion
In summary, we present a highly effective phototherapy with biocompatible PDA–MB through regulation of redox homeostasis. The constructed nanoplatforms can load and deliver the photosensitizer efficiently to tumor cells, release the drug in the GSH-overexpressed tumor environment for effective PDT, deplete GSH and disturb antioxidant defense leading to the elevation of the intracellular ROS levels and amplification of PDT in vitro and in vivo. The systematically explored mechanism and exploited versatility enable enhanced photodynamic and photothermal therapy, as well as fluorescence, photothermal and photoacoustic imaging-guided cancer treatment. To our knowledge, this approach constitutes the first example of amplified phototherapy to inhibit both primary and metastatic tumors by modulating redox balance, and may inspire the design and use of nanomedicines regulating oxidative stress for antimetastasis. We envision that our strategy can be extended readily to other ROS-involved therapies, paving the way to a safe and effective strategy for cancer treatment.All animal experiments were carried out according to the Principles of Laboratory Animal Care (People's Republic of China). The animal protocol was approved by The Institutional Animal Use and Care Committee of Wuhan University.
Conflicts of interest
There are no conflicts to declare.Acknowledgements
This work is supported by the National Natural Science Foundation of China (81602610) and Fundamental Research Funds for the Central Universities (No. 2042018kf1006).Notes and references
- P. Di Mascio, G. R. Martinez, S. Miyamoto, G. E. Ronsein, M. H. G. Medeiros and J. Cadet, Chem. Rev., 2019, 119, 2043–2086 CrossRef CAS.
- X. Li, S. Lee and J. Yoon, Chem. Soc. Rev., 2018, 47, 1174–1188 RSC.
- S. H. Yun and S. J. J. Kwok, Nat. Biomed. Eng., 2017, 1, 0008 CrossRef CAS.
- J. Shi, P. W. Kantoff, R. Wooster and O. C. Farokhzad, Nat. Rev. Cancer, 2017, 17, 20–37 CrossRef CAS.
- Q. Wu, G. Chen, K. Gong, J. Wang, X. Ge, X. Liu, S. Guo and F. Wang, Matter, 2019, 1, 496–512 CrossRef.
- D. van Straten, V. Mashayekhi, H. S. de Bruijn, S. Oliveira and D. J. Robinson, Cancer, 2017, 9, 1–54 Search PubMed.
- G. Saravanakumar, J. Kim and W. J. Kim, Adv. Sci., 2016, 4, e1600124 CrossRef.
- H. Wang, Y. Chen, H. Wang, X. Liu, X. Zhou and F. Wang, Angew. Chem., Int. Ed., 2019, 58, 7380–7384 CrossRef CAS.
- L. Wu, Y. Sun, K. Sugimoto, Z. Luo, Y. Ishigaki, K. Pu, T. Suzuki, H. Chen and D. Ye, J. Am. Chem. Soc., 2018, 140, 16340–16352 CrossRef CAS.
- B. Yang, Y. Chen and J. Shi, Chem. Rev., 2019, 119, 4881–4985 CrossRef CAS.
- Z. Zhou, J. Song, L. Nie and X. Chen, Chem. Soc. Rev., 2016, 45, 6597–6626 RSC.
- P. Poprac, K. Jomova, M. Simunkova, V. Kollar, C. J. Rhodes and M. Valko, Trends Pharmacol. Sci., 2017, 38, 592–607 CrossRef CAS.
- Y. Shen, Y. Sun, R. Yan, E. Chen, H. Wang, D. Ye, J. Xu and H. Chen, Biomaterials, 2017, 148, 31–40 CrossRef CAS.
- J. F. Lovell, T. W. Liu, J. Chen and G. Zheng, Chem. Rev., 2010, 110, 2839–2857 CrossRef CAS.
- D. Wang, L. Niu, Z. Y. Qiao, D. B. Cheng, J. Wang, Y. Zhong, F. Bai, H. Wang and H. Fan, ACS Nano, 2018, 12, 3796–3803 CrossRef CAS.
- R. An, X. Cheng, S. Wei, Y. Hu, Y. Sun, Z. Huang, H. Chen and D. Ye, Angew. Chem., Int. Ed., 2020, 59, 2–11 CrossRef.
- L. Jiang, H. Bai, L. Liu, F. Lv, X. Ren and S. Wang, Angew. Chem., Int. Ed., 2019, 131, 10770–10775 CrossRef.
- M. Pan, Q. Jiang, J. Sun, Z. Xu, Y. Zhou, L. Zhang and X. Liu, Angew. Chem., Int. Ed., 2019, 59, 1897–1905 CrossRef.
- M. De Palma, D. Biziato and T. V. Petrova, Nat. Rev. Cancer, 2017, 17, 457–474 CrossRef CAS.
- H. Sies, C. Berndt and D. P. Jones, Annu. Rev. Biochem., 2017, 86, 715–748 CrossRef CAS.
- Y. Dai, C. Xu, X. Sun and X. Chen, Chem. Soc. Rev., 2017, 46, 3830–3852 RSC.
- R. J. DeBerardinis and N. S. Chandel, Sci. Adv., 2016, 2, e1600200 CrossRef.
- L. He, T. He, S. Farrar, L. Ji, T. Liu and X. Ma, Cell. Physiol. Biochem., 2017, 44, 532–553 CrossRef.
- C. Gorrini, I. S. Harris and T. W. Mak, Nat. Rev. Drug Discovery, 2013, 12, 931–947 CrossRef CAS.
- J. L. Jiang, A. A. Shestov, P. Swain, C. Yang, S. J. Parker, Q. A. Wang, L. S. Terada, N. D. Adams, M. T. McCabe, B. Pietrak, S. Schmidt, C. M. Metallo, B. P. Dranka, B. Schwartz and R. J. DeBerardinis, Nature, 2016, 532, 255–258 CrossRef.
- R. Ballaro, F. Penna, F. Pin, M. C. Gomez-Cabrera, J. Vina and P. Costelli, Cancers, 2019, 11, 285 CrossRef CAS.
- F. Zhou, B. Feng, H. Yu, D. Wang, T. Wang, Y. Ma, S. Wang and Y. Li, Adv. Mater., 2019, 31, e1805888 CrossRef.
- O. M. Ighodaro and O. A. Akinloye, Alexandria J. Med., 2018, 54, 287–293 CrossRef.
- S. Prasad, S. C. Gupta and A. K. Tyagi, Cancer Lett., 2017, 28, 95–105 CrossRef.
- J. Morry, W. Ngamcherdtrakul and W. Yantasee, Redox Biol., 2017, 11, 240–253 CrossRef CAS.
- J. Bai, X. D. Jia, W. Y. Zhen, W. L. Cheng and X. E. Jiang, J. Am. Chem. Soc., 2018, 140, 106–109 CrossRef CAS.
- C. M. Hartshorn, M. S. Bradbury, G. M. Lanza, A. E. Nel, J. Rao, A. Z. Wang, U. B. Wiesner, L. Yang and P. Grodzinski, ACS Nano, 2018, 12, 24–43 CrossRef CAS.
- H. Kong and N. S. Chandel, J. Biol. Chem., 2018, 293, 7499–7507 CrossRef CAS.
- N. Gong, X. Ma, X. Ye, Q. Zhou, X. Chen, X. Tan, S. Yao, S. Huo, T. Zhang, S. Chen, X. Teng, X. Hu, J. Yu, Y. Gan, H. Jiang, J. Li and X. J. Liang, Nat. Nanotechnol., 2019, 14, 379 CrossRef CAS.
- H. Fan, G. Yan, Z. Zhao, X. Hu, W. Zhang, H. Liu, X. Fu, T. Fu, X. Zhang and W. Tan, Angew. Chem., Int. Ed., 2016, 55, 5477–5482 CrossRef CAS.
- E. Ju, K. Dong, Z. Chen, Z. Liu, C. Liu, Y. Huang, Z. Wang, F. Pu, J. Ren and X. Qu, Angew. Chem., Int. Ed., 2016, 55, 11467–11471 CrossRef CAS.
- W. Zhang, J. Lu, X. Gao, P. Li, W. Zhang, Y. Ma, H. Wang and B. Tang, Angew. Chem., Int. Ed., 2018, 57, 4891–4896 CrossRef CAS.
- F. Ding, X. Gao, X. Huang, H. Ge, M. Xie, J. Qian, J. Song, Y. Li, X. Zhu and C. Zhang, Biomaterials, 2020, 245, 119976 CrossRef CAS.
- Q. Jiang, S. Zhao, J. Liu, L. Song, Z. Wang and B. Ding, Adv. Drug Delivery Rev., 2019, 147, 2–21 CrossRef CAS.
- J. Su, H. Sun, Q. Meng, Q. Yin, P. Zhang, Z. Zhang, H. Yu and Y. Li, Adv. Funct. Mater., 2016, 26, 7495–7506 CrossRef CAS.
- P. S. Steeg, Nat. Rev. Cancer, 2016, 16, 201–218 CrossRef CAS.
- E. Piskounova, M. Agathocleous, M. M. Murphy, Z. Hu, S. E. Huddlestun, Z. Zhao, A. M. Leitch, T. M. Johnson, R. J. DeBerardinis and S. J. Morrison, Nature, 2015, 527, 186–191 CrossRef CAS.
- J. Feng, Z. Xu, F. Liu, Y. Zhao, W. Yu, M. Pan, F. Wang and X. Liu, ACS Nano, 2018, 12, 12888–12901 CrossRef CAS.
- M. Peiris-Pages, U. E. Martinez-Outschoorn, F. Sotgia and M. P. Lisanti, Cell Metab., 2015, 22, 956–958 CrossRef CAS.
- Y. Chen, K. Ai, J. Liu, X. Ren, C. Jiang and L. Lu, Biomaterials, 2016, 77, 198–206 CrossRef CAS.
- J. Song, P. Yan, L. Luo, X. Qi, X. Rong, J. Zheng, B. Xiao, S. Feng, C. Wang, Y.-S. Hu, Y. Lin, V. L. Sprenkle and X. Li, Nano Energy, 2017, 40, 504–511 CrossRef CAS.
- J. L. Bolton and T. Dunlap, Chem. Res. Toxicol., 2017, 30, 13–37 Search PubMed.
- P. V. S. Oliveira and F. R. M. Laurindo, Clin. Sci., 2018, 132, 1257–1280 Search PubMed.
- S.-S. Wan, Q. Cheng, X. Zeng and X. Zhang, ACS Nano, 2019, 13, 6561–6571 CrossRef CAS.
- K. Dan, A. T. Veetil, K. Chakraborty and Y. Krishnan, Nat. Nanotechnol., 2019, 14, 252–259 CrossRef CAS.
- C. Gorrini, I. S. Harris and T. W. Mak, Nat. Rev. Drug Discovery, 2013, 12, 931–947 CrossRef CAS.
- W. Cheng, X. Zeng, H. Chen, Z. Li, W. Zeng, L. Mei and Y. Zhao, ACS Nano, 2019, 13, 8537–8565 CrossRef CAS.
- H. Zhang, Q. Hong, J. Li, F. Wang, X. Huang, S. Chen, W. Tu, D. Yu, R. Xu, T. Zhou and J. Zhang, Angew. Chem., Int. Ed., 2019, 58, 11752–11756 CrossRef CAS.
- T. Komatsu, K. Johnsson, H. Okuno, H. Bito, T. Inoue, T. Nagano and Y. Urano, J. Am. Chem. Soc., 2011, 133, 6745–6751 CrossRef CAS.
- M. Zhang, L. Zhang, Y. Chen, L. Li, Z. Su and C. Wang, Chem. Sci., 2017, 8, 8067–8077 RSC.
- Z. Yin, P. wang, D. Chen, J. Shao, Q. Zhang, L. Sun and W. Huang, Chem. Sci., 2018, 9, 2188–2194 RSC.
- E. D. Williams, D. Gao, A. Redfern and E. W. Thompson, Nat. Rev. Cancer, 2019, 19, 716–732 CrossRef CAS.
Footnote |
| † Electronic supplementary information (ESI) available: Additional material characterization and in vitro and in vivo analyses. See DOI: 10.1039/d0sc04983b |
| This journal is © The Royal Society of Chemistry 2021 |

