
The impact of representations of chemical bonding on students’ predictions of chemical properties
Ayesha
Farheen
 and
Scott E.
Lewis
*
and
Scott E.
Lewis
*
University of South Florida, USA. E-mail: slewis@usf.edu
First published on 23rd July 2021
Abstract
Representations are ubiquitous in chemistry. They are part of the chemistry language instructors use to communicate chemistry phenomenon to students. Literature calls in support of learning with multiple representations, but there is a pre-requisite for students to learn from a single representation. In this exploratory study, 1086 students in second semester general chemistry were randomly assigned to one of four representations showing bonding of sulfur dioxide: chemical formula, Lewis dot structure, an image of a ball and stick model, or an image of a space filling model. Students were asked to predict chemical properties of sulfur dioxide: relative bond length, molecular polarity, and the strongest intermolecular force with a water molecule. Using the lens of Multimedia Learning Theory on Learning with Text and Visual Representations, analyses of students’ prediction of chemical properties and the features cited when making predictions was conducted. Effect sizes were used to describe variations among representations in terms of how students predicted bond length, polarity and intermolecular forces. Meaningful differences were found across representations in students’ ability to correctly predict relative bond length and molecular polarity. These explorations generated the following hypotheses: (1) chemical formula leads students to depend on chemical conventions, (2) Lewis dot structure hinders predicting polarity when it shows an inaccurate shape, and (3) visual representations of ball and stick and space filling cue students to rely on visual estimations more than the other representations. Upon further testing, these hypotheses can inform instructors how to introduce representations and in the decision-making process of which representations to use to convey or assess a specific chemical property.
Introduction
Representations in chemistry instruction
Chemistry is the learning of abstract concepts and to understand these concepts, chemists developed representations that help them understand what they cannot see (Kozma and Russell, 1997; Schank and Kozma, 2002). Representations in chemistry can be symbols, chemical formula, equations, graphs, or two-dimensional and three-dimensional structures. Because they contain visual cues that can be used to explain chemistry phenomenon, they are part of the chemistry language where instructors use them to teach chemistry concepts (Hoffmann and Laszlo, 1991; Kozma and Russell, 1997; Wu and Shah, 2004). For students, being able to learn with representations effectively is positively correlated to early academic success in college-chemistry (Dickmann et al., 2019). It is therefore evident that representations play a key role in students’ understanding of chemistry concepts and research into how students learn with representations is necessary to support their growth in the effective learning of chemistry. Learning with representations requires a set of skills known as representational competency that involve the ability to focus on features of the representation and extract relevant information to solve problems (Kozma and Russell, 1997; Schnotz and Bannert, 2003; Rau et al., 2012; Rau et al., 2017). Features can be defined as physical characteristics of a representation that can be connected to a chemistry concept (Wu et al., 2001; Rau, 2017). Therefore, to understand chemistry concepts, students need to have the ability to focus on features of a representation and use those features effectively in their explanations of chemical phenomenon. Such features can be explicitly depicted in the representation with a visual cue, such as a ball and stick representation depicting the shape of a molecule. Features can also be implicit, without a visual cue, such as a ball and stick representation being used to determine the polarity of a molecule. Ball and stick representations explicitly depict molecular shape and atomic identity. By coupling this information with knowledge of differences in electronegativity and an ascertainment of the directionality and strength of polar bonds, students can predict the molecular polarity. Therefore, polarity is an implicit feature of a ball and stick representation where the feature can be deduced with information from the representation coupled with prior knowledge and skills.What one student perceives by focusing on the features of a representation is selective and this is in part due to the image they produce mentally (Gilbert, 2005). The image that the students produce is based on both their prior knowledge and the representation presented, thus instructors’ decisions of which representation to use during instruction is critical (Kozma, 1991; Schnotz and Bannert, 2003). The customary practice in chemistry during instruction is to use a variety of representations. However, instructors should not assume that students know how to use a representation in the way instructors intended students to (Harrison and Treagust, 2000; Wu and Puntambekar, 2012). Representations can complement each other by depicting the same content knowledge across a set of representations and there have been calls for using multiple representations to support student learning (Ainsworth, 2006; Ainsworth, 2008). However, the act of simply using more than one representation does not guarantee effective learning (Rau et al., 2009; Stieff et al., 2011), and this specific instance is not unique to chemistry but other sciences as well, such as in biology and physics, where learning with more than one representation is impacted by several factors and can at times be useful and at other times impeding to students’ learning (Eilam, 2013; Kohl and Finkelstein, 2017). Understanding a chemistry phenomenon depicted by a set of representations, involves mentally engaging with them (Gilbert and Treagust, 2009), and to do so, students need to focus on features of a single representation and be able to make connections of how those same features are shared across the other representations in the same set (Ainsworth, 2008). Therefore, prior to learning the chemistry phenomenon with a set of representations, there is a prerequisite for students to become effective in learning from a single representation (Wu and Puntambekar, 2012; Rau, 2017; Rau and Moore, 2020).
Wu and colleagues (2001) explored 11th grade students’ translation between two-dimensional representations (e.g. structural formulas), three-dimensional representations presented in two-dimensional images (e.g. a ball and stick or space filling representation portrayed on a screen), and three-dimensional manipulatives (e.g. a model of a molecule built with a model kit). To do so, they enacted an instructional intervention designed for students to engage in translating among the representation types. Using a pretest/posttest design, they found that students showed a gain on their abilities in the following: translate between two-dimensional and three-dimensional representations, translate between formula and structure, predict chemical properties, and assign nomenclature. Additionally, observations of students engaging with the materials showed that three-dimensional manipulatives were rotated to match two-dimensional images for comparisons. Finally, student interviews found that students preferred space filling representations as more realistic depictions of molecules than ball and stick representations, but space filling representations’ omission of bond order hindered students from identifying functional groups. This study highlights the challenges students face when learning with molecular representations, and also the opportunities possible in calling attention to representations during instruction.
To understand the limitations of a representation, cataloguing the features that are cued to students from a representation is the first step as seen in studies done with the Lewis dot structure representation (Cooper et al., 2010; Cooper et al., 2012; Cooper et al., 2013). These studies found that not all students use Lewis dot structures as intended by their instructors. More specifically, it has been shown that students struggle with relating features of a Lewis dot structure of a molecule to physical properties (e.g. relative boiling point) observed at the macroscopic scale (Cooper et al., 2010; Cooper et al., 2013). To investigate this issue, Cooper and colleagues developed the Implicit Information from Lewis Structures Instrument (IILSI) that catalogues a set of features either depicted in the Lewis dot structure explicitly such as number of valence electrons, or implicitly such as polarity (Cooper et al., 2012). Application of this instrument showed, when students selected on IILSI that molecular structure affects boiling point, they were three times more likely to use intermolecular forces and energy in their explanations of differing boiling points (Kararo et al., 2019). The conclusions of this study indicate that it is necessary for students receiving a representation to be cued to features of chemical bonding to improve their explanations of chemical and physical properties. The current work herein seeks to explore the role of differing representations by examining the features cued to students, so that a foundation can be laid-out that could potentially inform instructional choices on how to choose and introduce representations.
Rationale for study
Chemistry education researchers have investigated how students understand and learn with one type of representation such as graphs (Rodriguez et al., 2019; Rodriguez et al., 2020), two types of representations such as enzyme-substrate interactions (Linenberger and Bretz, 2014), and a set of representations that show bonding (Luxford, 2013). Instructors use representations depicting a variety of chemical phenomenon; however, for this study, representations that depict chemical bonding were chosen. Chemical bonding is foundational to learning chemistry because it describes connectivity between atoms in a molecule and thereby gives information about a molecule's structure (Özmen, 2004). Structure can be defined as information pertaining to the composition, geometry, and connectivity (Talanquer, 2018) and in this study the structure of a molecule is the focus. Molecular structure provides information on both chemical and physical properties where chemical properties are described as the properties manifest at the submicroscopic scale such as bond length or polarity, while physical properties are manifest at the macroscopic scale such as boiling point. More information about the structure of a molecule is expected to lead to better predictions of the molecule's chemical properties (Kararo et al., 2019). The focus of the current investigation is on the extent representations depicting chemical bonding in a molecular structure provide differing student predictions on chemical properties.The work herein seeks to build on the growing knowledge base of students’ interpretation of representations by examining the relative impact of a set of representations upon students’ accuracy in predicting chemical properties. To do so, a comparison will be conducted among the responses from students who each received one representation from a set, where each representation depicted chemical bonding of the same molecule. Additionally, the current study seeks to explore the relative impact of different representations upon the features that students invoked while predicting the molecule's chemical properties.
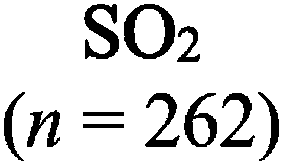
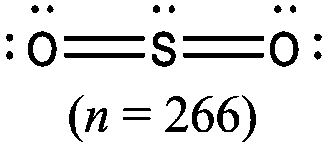
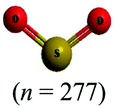
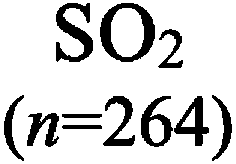
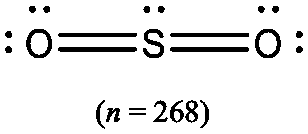
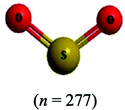
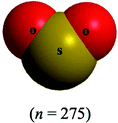
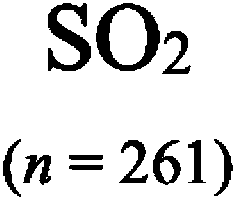
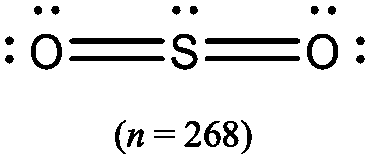
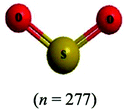
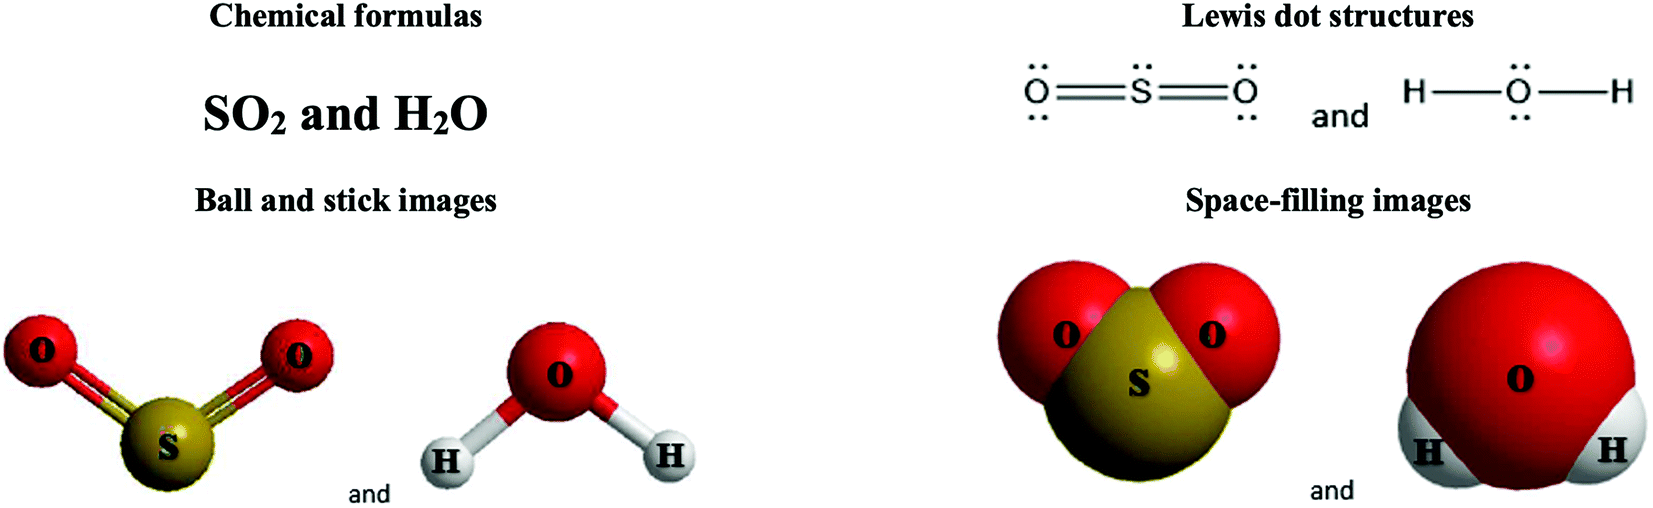
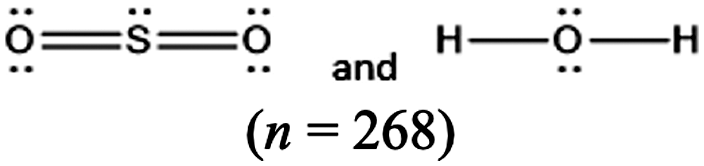
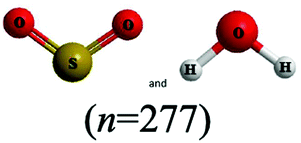
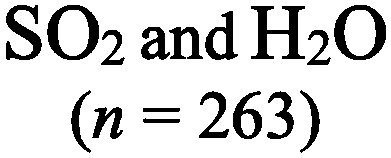
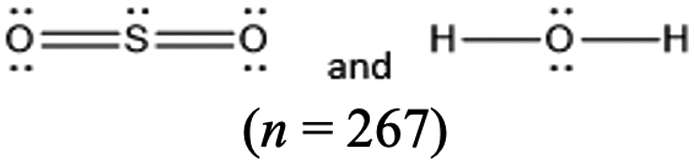
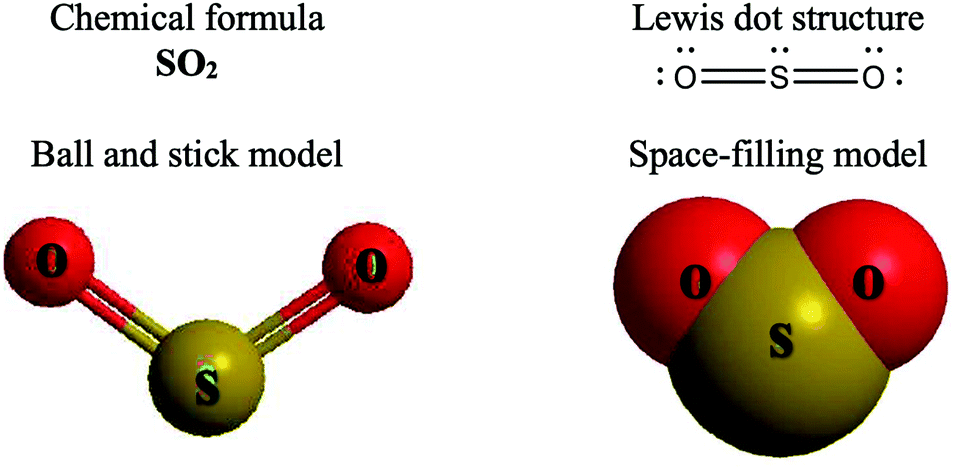
The representations used in this study were (1) chemical formula, which contains the symbols of elements and number of each atom in a molecule, (2) Lewis dot structure, which shows the connectivity between atoms, valence electrons, and lone pairs, (3) an image of a ball and stick model, which shows the connectivity as well as the shape of the molecule, and (4) an image of a space filling model, which shows the connectivity, shape of the molecule, and the relative atomic cloud sizes. The representations students received are shown in Fig. 1. This set of representations were chosen because they were the four most frequent representations illustrated in the textbook used with the student population of interest at the research setting (Flowers et al., 2019).
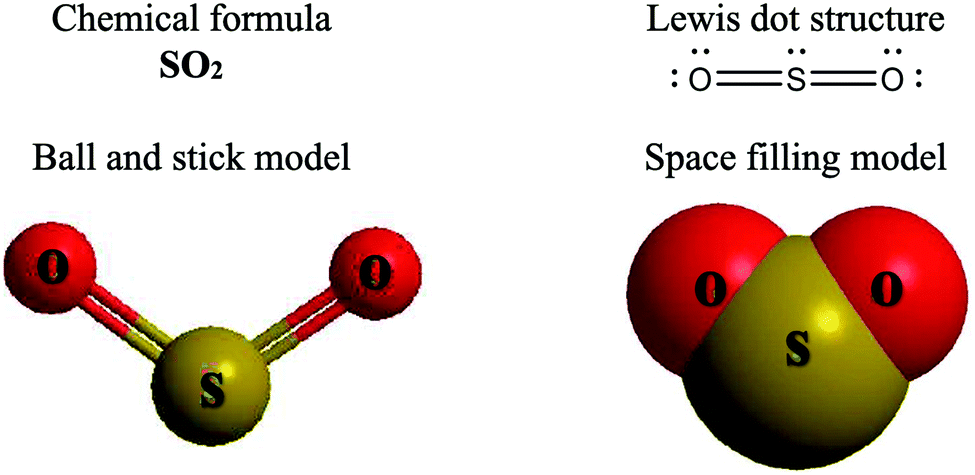 | ||
| Fig. 1 Representations used in each survey. | ||
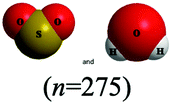
To narrow the study design, three chemical properties were selected: bond length, polarity, and intermolecular forces. Bond length was chosen owing to the role of bond order in predicting bond length, which is modeled explicitly in Lewis dot structure and ball and stick representations but not the other representations. Polarity and intermolecular forces were also chosen owing to their fundamental nature in understanding structure–property relationships among molecular compounds. It is also notable that bond length and polarity are directly attributable to a single molecule, while the property of intermolecular forces was selected to determine whether the influence of representations extended to the interactions of a pair of molecules. As the focus was on the role of differing representations, one chemical compound was selected and used across the set of representations. Sulfur dioxide was the chosen molecule as it has a single center atom matching the examples used at the research setting with the student population of interest. Further, this compound was thought to not be overly familiar to these students so they would not rely on memorized responses.
Theoretical framework
Multimedia Learning Theory on Learning with Text and Visual Representations, as summarized by Rau (2017), contrasts how learners perceive and learn from textual verses visual representations. All representations are intended to bring up an internal representation of a concrete or abstract concept called the referent. For example, a painting of Niagara Falls has a concrete referent of Niagara Falls. Textual representations, like chemical formulas, are a form of symbolic representation, where learners follow a convention-based mapping to understand the referent (Rau, 2017). For example, when a chemist is presented the alphanumeric representation of CH4, a series of conventions particular to chemistry can be used to map this representation onto a molecule with a carbon atom in the center surrounded by four hydrogen atoms, that the molecule has a tetrahedral geometry and so on. Text is processed in the verbal part of the working memory and learners engage in conceptual processes to analyze the structure of the text and form an internal representation that consists of symbolic propositions using past conceptual knowledge and chemical conventions.In contrast, visual representations have varying degrees of similarity-based mappings to the referent (Rau, 2017). Abstract visual representations, like reaction coordinate diagrams, have low similarity with the referent, where the referent is the relative energy of a system undergoing chemical reaction. In contrast, concrete visual representations, such as an image of a water molecule using a ball and stick representation, have a higher degree of similarity with the referent, which is the consensus model of the connectivity and shape of a water molecule. With visual representations, learners use perceptual processes to capture visuo-spatial patterns of the representations in working memory. In contrast to textual representations, visual representations, particularly concrete visual representations, do not require conceptual processes to form an internal representation. Instead, learners map the visual representations into their internal representation, a process reliant on the learners’ perceptions of the visual cues presented (Gilbert and Treagust, 2009; Stieff et al., 2011; Rau, 2017). That is, when a student is presented a chemical formula H2O and asked to determine the shape, the process requires a reliance on understanding chemical conventions to reach a conclusion; but when a student is presented a ball and stick image of a water molecule and asked to determine the shape the process requires a visual recognition of the shape, depicted in the representation. In this framework, Lewis dot structures may be thought of as a hybrid of textual (letters representing atoms) and visual (lines showing connectivity) representations and may call on students to enact both pathways in interpreting. Ball and stick or space filling representations provide more visual similarities to the referent than chemical formula or Lewis dot structure, although the ball and stick and space filling representations used in this study (see Fig. 1) also rely on textual symbols to identify the atomic identity. Thus, the chemical representations under consideration vary from textual with chemical formula, to a combination of textual and visual with Lewis dot structure, to visual with a text notation with ball and stick and space filling models.
Given the divergent paths learners are expected to take when encountering textual versus visual representations, it is expected that students receiving text versus visual representations will provide different responses when asked about the chemical properties related to the structure. Additionally, as visual representations rely on visual cues, differing visual representations provide different visual cues pertaining to the intended task and can result in different processes when engaging in an intended task. This learning theory provides an expectation that differing representations, including textual and visual, will invoke differing processes and differing rates of success in an intended task. However, the learning theory does not provide specific predictions on the relative ability of differing chemistry representations to promote students’ engaging in intended processes. Such predictions rely on students’ proficiency with chemistry conventions when engaging in textual representations and students’ proficiency in recognizing appropriate visual cues when engaging in visual representations. This work seeks to address this gap by exploring students’ relative proficiency in engaging in particular chemistry tasks when receiving a differing representation of the same molecule. As an exploratory work, the intent of this work is to generate testable hypotheses that can seed future research. This work is thus guided by the following research questions.
1. What impact do different representations of sulfur dioxide (chemical formula, Lewis dot structure, ball and stick, and space filling model) have on students’ correct prediction of chemical properties (relative bond length, polarity, and intermolecular forces with water)?
2. What impact do different representations of sulfur dioxide have on the features cued to students while predicting the chemical properties?
3. What relationship exists between citing a feature and correctly predicting a chemical property?
Methods
Participants and research setting
The participant sample for this study was comprised of second semester general chemistry students. The general chemistry sequence is the initial chemistry courses taken by the students at the research setting thus, this targeted population was chosen as their responses will provide insight into students’ early learning of chemistry properties with representations. Chemical formula and Lewis dot structures are prominent representations in instruction, practice materials and assessments at the research setting. Ball and stick and space filling are used in the course textbook, which was the reason for their inclusion but there were no instances of using these representation types within student assessments. Further, to the best of the researchers’ knowledge ball and stick or space filling representations were not used during instruction and no formal instruction was dedicated to the topic of interpretating representations in chemistry. This study took place at a research-intensive university in the southeastern United States of America. This university offered seven classes of second semester general chemistry course during the semester of data collection. These classes are coordinated using a common syllabus, a common textbook and receiving common homework assignments and common exams. Across these seven classes there were 1584 students enrolled.To investigate the impact of representations, an experimental design was enacted where students were randomly assigned to receive one representation among the set of four: chemical formula, Lewis dot structure, ball and stick image, or space filling image. To enact the random assignment, a set of five surveys were created. Each survey contained only one of the four representations and a fifth survey contained all four representations concurrently. To focus on the impact of a single representation, this work analyzed only the first four surveys. Students at the setting were randomly assigned to one of the five surveys. The random assignment occurred within each class so that each set of survey responses include students from all seven classes and thus instructor or class effects were controlled when comparing survey responses. The surveys were available on each class's learning management software, posted two weeks before the end of the term and students had five days to complete their assigned survey. Students received extra credit worth 0.5% of their overall grade for completing the survey, independent of the number questions answered correctly. Of the 1584 students enrolled, 1086 students completed one of the four surveys that will be the focus of this work.
Ethical statement
This research was reviewed and approved by the university's institutional review board in accordance with institutional and local policies. A waiver of informed consent was granted as this research involved an analysis of deidentified data that was collected in an educational setting.Survey
Each survey had ten prompts, and seven of the prompts relevant to the investigation are shown in Table 1 (see Appendix 1 for the full survey). The set of four surveys differed only by the representation shown in Fig. 1 and a brief instruction to explain the space filling image, that the spheres depict the relative size of the atomic clouds, was given. The instruction was only provided for space filling since it was presumed students were not familiar with this feature of the representation. Revision of these surveys took place in a series of rounds to assure the font style, images of the representations, and the language was comprehendible by the intended participants. Peer leaders who worked with second semester general chemistry students piloted the surveys, and their feedback informed a modification of the prompt that asked students to name the strongest type of intermolecular force between sulfur dioxide and water molecule. It is also of note that the options to the multiple-choice prompts seen in Table 1 were randomly shuffled for each student.| Consider the model of a molecule [insert representation of sulfur dioxide] |
| Bond length |
| Prompt 1. (Multiple-choice) |
| Are the bonds between sulfur and oxygen the same length? |
| Option 1: The bonds between sulfur and oxygen are NOT the same length |
| Option 2: The bonds between sulfur and oxygen are the same length |
| Prompt 2. (Open-ended) |
| Explain what factors you considered while determining whether the bonds between sulfur and oxygen were the same. |
| Polarity |
| Prompt 4. (Multiple-choice) |
| Do you think this molecule is polar or nonpolar? |
| Option 1: The molecule is POLAR |
| Option 2: This molecule is NON-POLAR |
| Prompt 5. (Open-ended) |
| Explain what factors you considered while determining the polarity of the molecule. |
| Consider the two molecules [insert representation of sulfur dioxide AND insert same representation of water] |
| Intermolecular forces |
| Prompt 7. (Multiple-choice) |
| What is the strongest type of intermolecular force to exist between the two molecules? |
| Option 1: Dipole–dipole interaction |
| Option 2: Ion–dipole interaction |
| Option 3: Hydrogen bonding |
| Option 4: Covalent bonding |
| Option 5: London dispersion forces |
| Prompt 8. (Multiple-choice) |
| Between which two atoms would the strongest type of intermolecular force exist? |
| Option 1: Between S in SO2 and O in SO2 |
| Option 2: Between two of the same atoms |
| Option 3: Between O in H2O and H in H2O |
| Option 4: Between O in SO2 and H in H2O |
| Option 5: Between S in SO2 and H in H2O |
| Prompt 9. (Open-ended) |
| How do the given [representations] inform your answer about the atoms between which the strongest type of intermolecular force exists? |
Survey response analysis
Analysis of the students’ responses to the four surveys took place in three stages: (1) quantitative analysis of the responses to the multiple-choice prompts using SPSS, (2) qualitative analysis of the responses to the open-ended prompts to generate codes using NVivo, and (3) quantitative analysis of the frequency with which the codes appeared in the data using SPSS. Prior to beginning the analysis process, a check for duplicate surveys resulted in the identification of two students who responded to two surveys each, instead of one owing to an error in survey assignment. A decision was made to keep only each student's first response to the survey. Given the exploratory nature of the work, statistical tests were conducted primarily to describe the nature of the differences observed in the context of the variations in responses observed. As a result, the analyses will rely primarily on effect sizes metrics instead of measures of statistical significance and no claims are made about the extent the observed results might generalize to a broader population of students.In the surveys given to students, there were two types of open-ended prompts each for bond length and polarity. One prompt asked each student to explain the factors they considered while responding to the multiple-choice prompts (prompts 2 and 5 shown in Table 1), and another asked how the given representation informed the same decision (not shown in Table 1, see Appendix 1 for prompts 3 and 6). By reviewing random responses of students to both these prompts, it was observed that students were more responsive to the prompts that asked them to explain their prediction, and thus the qualitative analysis focused only on responses to the open-ended prompts where students cited the features they considered while predicting bond length and polarity. There was only one open-ended prompt (prompt 9 shown in Table 1) which was analyzed for intermolecular forces.
A constant-comparison method was used to develop separate codebooks for the features cited by students in their prediction of the relative bond length and polarity of sulfur dioxide. The first step in the analysis of these responses was to list all the features observed by the researchers. To create this list, one researcher coded 200 student responses, sampling evenly from the four surveys. This process occurred in two to three rounds until the researcher did not observe new features. The setting up of this list included all the features observed in the students’ responses and the features that held similarity in chemistry content were combined. For example, a feature called bond order resulted from the combination of terms such as number of bonds, bond order, and single, double or triple bonds. Following this, two researchers independently applied the codebook to ten responses from each survey (40 responses in total) and came together to modify the codebook. This step occurred in three to five rounds, until no further modification to the codebooks was necessary. The last step in the analysis of the students’ responses to the open-ended prompts occurred when the same researchers independently applied the codebook to all the responses (N = 1086) and discussed discrepancies until they reached 100% agreement on all the responses. This analysis process occurred first with the responses to bond length and then with responses to polarity, followed by responses to intermolecular forces. The codebooks for bond length and polarity along with a partial list of student terms are shown in Tables 2 and 3 respectively; for a full list of student terms and the codebook for intermolecular forces please see Appendix 2.
| Feature | Partial list of student terms | Quotes (bold text added for emphasis) |
|---|---|---|
| Bond order | Number of bonds/double, single, or triple bonds | “In order to figure out that the bond length are the same is to recognize that the bonds are double bonds ” |
| Lewis dot structure | Lone pairs/valence electrons | “…the oxygens have two lone pairs each and the sulfur atom has one lone pair ” |
| Resonance | Resonance/hybrid structure | “…they are actually the same length because of resonance …” |
| Polarity | Electronegativity/polar | “Then I looked at the electronegativity so I can determine…” |
| Shape of molecule | Geometry/linear/bent | “I looked at the geometry to determine…” |
| Size of atom | Atomic size/relative size | “First I would assess the relative size as given in the description…” |
| Same pair of atoms | Same atom/same type of atoms on both sides | “Since it is the same atom on both sides…” |
| Nature of bonds | Type of bond/sharing of electrons | “The type of bond because that would determine the length of the bond…” |
| Nature of elements/atoms | Location on the periodic table/properties | “…and the location of each atom on the periodic table ”. |
| Visual estimation | Picture provided/color of balls or spheres | “I looked at the picture provided . S is yellow and O is red and I looked to see how long their bonds are…” |
| Feature | Partial list of student terms | Quotes (bold text added for emphasis) |
|---|---|---|
| Electronegativity | Comparing electronegativities/difference in electronegativities | “The O atom is more electronegative then the S atom…” |
| Lewis dot structure | Lone pair/valence electrons/charge of the atom | “There is a lone pair in the molecule configuration which allows for the determination that the molecule is in fact polar.” |
| Nature of polar bonds | Dipole moment/unequal pull | “…which should exert a stronger pull than the oxygen” |
| Nature of nonpolar bonds | Equal sharing of electrons/bonds are not polar | “This molecule is a nonpolar, because there is equal sharing of bonds in the electrons.” |
| Bent shape | Bent/trigonal planar | “Because it's electron geometry is a trigonal planar and it is bent, so it is polar.” |
| Linear shape | Linear | “The molecule is linear and based on molecular shape it cannot be polar.” |
| Ambiguous shape | Molecular geometry/electron geometry/asymmetrical/symmetrical | “One factor is molecular geometry because it is asymmetrical .” |
| Net dipole moment nonzero | Vectors do not cancel/bonds do not cancel |
“…The bond
dipoles
of the two s![[double bond, length as m-dash]](https://www.rsc.org/images/entities/i_char_e001.gif) o bonds
do not cancel
.” o bonds
do not cancel
.”
|
| Net dipole moment zero | Dipole moments cancel out/charges cancel out | “…But when the oxygen molecules come together with the sulfur, the dipole forces cancel each other out making the structure of the molecule non-polar.” |
| Unclear dipole moment | Distribution of electrons or charges/pull on electrons | “I considered the charge distribution and…” |
| Bond order | Single, double, or triple bonds/length of bonds | “There is a double bond between one of the oxygens and the sulfur…” |
| Nature of elements/atoms | Locations of elements in periodic table/non-metal | “I looked at the periodic table to see how close they were together.” |
| Size of atom | Atomic radius | “…the electron clouds around each of them would be the same size .” |
| Same pair of atoms | Each side of the molecule has the same atom | “The two oxygen atoms are the same on each side of the sulfur atom…” |
| Visual estimation | Picture of molecule/diagram provided | “I believe the molecule is polar because the picture depicts the molecule being…” |
To discuss the criteria for trustworthiness in qualitative research, each of the four criteria were examined as they pertain to the methods employed (Shenton, 2004). The coding process was developed by a graduate student and faculty member each engaged in chemistry education research with a complete code lists presented in Appendix 2 to support the credibility of the code assignments. The research setting, including the chemistry course the participants enrolled in, is described to allow an evaluation of the transferability of the results. The use of consensus coding supports the dependability of the coding assignments. Finally, the proportion of features cued by each representation are presented to support confirmability of the inferences drawn from the data, while acknowledging a limiting assumption that students’ relative use of a feature across the representations is indicative of the relative rate that a representation cues a feature.
Results
Bond length
The chemical conventions expected for students to ascertain relative bond length of each sulfur to oxygen bond in sulfur dioxide was to identify that each bond involved a pair of S and O atoms so that atomic sizes within each bonds were equal and that each S to O bond had a bond order of two. With equal atomic sizes and bond order, the bond length of each S to O bond can be predicted to have the same length.Table 4 shows the percentages of students in each survey (group) who predicted that the relative bond length between each S to O bond was the same. Students receiving a Lewis dot structure representation outperformed all other groups (χ2 = 14.1; p < 0.001; Cohen's w = 0.114). To interpret effect sizes, Cohen's recommendation of w = 0.1 as a small effect size and w = 0.3 as a medium effect size will be used (Cohen, 1992). The two visual representations (ball and stick and space filling images) also had a notable difference, with students receiving the ball and stick image having a larger percent correct than students receiving the space filling image (χ2 = 7.85; p = 0.005; w = 0.112). Thus, the impact of changing among these four representations appears to meaningfully impact students’ correct predictions of relative bond length.
|
|
|
|
|
|---|---|---|---|
| 85.3% | 94.1% | 89.5% | 81.1% |

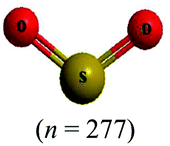
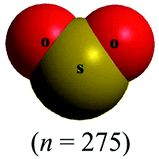
Table 5 shows the percentages with which features were observed among the 1080 responses to the open-ended prompt that asked students to explain their relative bond length prediction. Several other features were also observed in the responses that were not chemically relevant to bond length including polarity (15.5%), shape of molecule (14.8%), nature of bonds (11.8%), and nature of elements/atoms (6.6%). It was assumed that the relative proportion of students citing a particular feature as described in Table 5, indicated the relative extent students were cued to that feature by the representation. Hereafter, we described what features were cued by representations to answer the second research question.
| Feature (percent of 1080) |
|
|
|
|
|---|---|---|---|---|
| a Not relevant to bond length. | ||||
| Bond order (58.1%) | 65.3% | 67.7% | 56.3% | 44.0% |
| Lewis dot structure (36.6%) | 50.4% | 38.7% | 23.5% | 34.5% |
| Polaritya (15.5%) | 14.5% | 14.7% | 17.7% | 14.9% |
| Shape of moleculea (14.8%) | 8.4% | 19.9% | 15.2% | 15.6% |
| Nature of bondsa (11.8%) | 9.9% | 12.8% | 14.4% | 9.8% |
| Same pair of atoms (7.4%) | 6.5% | 6.8% | 9.4% | 6.9% |
| Size of atom (6.7%) | 5.0% | 0.8% | 5.1% | 15.6% |
| Nature of elements/atomsa (6.6%) | 5.3% | 4.9% | 7.6% | 8.4% |
| Visual estimation (5.8%) | Not applicable | 1.5% | 10.5% | 5.5% |
| Resonance (4.1%) | 7.3% | 1.9% | 2.9% | 4.4% |

Students with chemical formula were more often cued to Lewis dot structures (χ2 = 28.4; p < 0.001; w = 0.162) and resonance (χ2 = 8.94; p = 0.003; w = 0.091) compared to students receiving the other representations. Also, students with chemical formula cited bond order more often than students with ball and stick and space filling images (χ2 = 16.3; p < 0.001; w = 0.142). Students with Lewis dot structure were cued to bond order higher than students with the other representations (χ2 = 13.1; p < 0.001; w = 0.110) and students with space filling were cued to bond order lower than students with the other representations (χ2 = 30.3; p < 0.001; w = 0.168). This evidence supports that when predicting bond length, Lewis dot structure representation cues students to the underlying chemistry concept of bond order more than the other three representations. It is also of note that students with Lewis dot structure rarely mentioned the size of the atoms as a relevant feature, although size of atoms was infrequently mentioned across three of the representations with the space filling image as the exception. Students with space filling image were more often cued to the size of the atom, relative to the other representations (χ2 = 47.7; p < 0.001; w = 0.210). The survey prompt that had the image of space filling representation included instructions that the spheres in the space filling image depicted the relative size of atomic clouds, which might justify why the students were more likely to cite this feature.
Students with the ball and stick and space filling images were cued to use a visual estimation more often than students with Lewis dot structures (χ2 = 13.592; p < 0.001; w = 0.129). The visual estimation code described a prediction of the bond length by using the provided image. For example, students mentioned looking at the image to predict how long the bonds were, or the color of the balls/spheres corresponding to the image. This code was not applied to chemical formula as there are no visual markers for bond length that can be estimated through visual inspection. In addition, students with the two visual images were less likely to mention bond order (χ2 = 29.4; p < 0.001; w = 0.165) or use Lewis dot structure (χ2 = 28.0; p < 0.001; w = 0.161) while predicting bond length. Thus, students with ball and stick and space filling images were more likely to predict relative bond length by relying on a visual estimation, rather than relying on the underlying chemistry concept of bond order.
Among the 1080 students who responded to the open-ended prompts, 945 students (87.5%) predicted correctly that the relative bond lengths of each S to O bond was the same. Table 6 shows the percentages of students who predicted bond length correctly dependent on whether they cited the feature. These percentages address the third research question about the likelihood of citing a specific feature and predicting bond length correctly, thus they can inform the importance of citing a specific feature as it pertains to the likelihood of predicting relative bond length correctly. It was found, when students cited bond order in their responses, they were more likely to predict relative bond length correctly than those who did not cite this feature (χ2 = 46.3; p < 0.001; w = 0.207). The representation Lewis dot structure cued students to bond order the highest compared to students with other representations and since citing bond order in responses increased the likelihood of predicting bond length correctly, this offers a potential reason why students with Lewis dot structure had the highest percent correct in predicting relative bond length. The only feature that had a deleterious effect of note was size of atom (χ2 = 34.8; p < 0.001; w = 0.180), a feature that was predominantly cued by the space filling image, thus this evidence offers a potential reason as to why students with space filling image had the lowest percent correct to predicting relative bond length. If so, the lower percent correct when the size of atom feature was cued would support a possible explanation that students’ reliance on visual estimations can result in inaccurate predictions of bond length. That is, instead of applying underlying chemistry concepts such as bond order, students may attempt a visual estimation of the length and predict that the bonds are of different lengths based on what their visual estimation of length from the image provided in the representation.
| Feature | Percent correct when cited feature | Percent correct when NOT cited feature |
|---|---|---|
| a Not relevant to bond length. | ||
| Bond order | 93.3% (586 of 628) | 79.4% (359 of 452) |
| Lewis dot structure | 89.6% (354 of 395) | 86.3% (591 of 685) |
| Polaritya | 79.0% (132 of 167) | 89.0% (813 of 913) |
| Shape of moleculea | 93.8% (150 of 160) | 86.4% (795 of 920) |
| Nature of bondsa | 89.0% (113 of 127) | 87.3% (832 of 953) |
| Same pair of atoms | 100.0% (80 of 80) | 86.5% (865 of 1000) |
| Size of atom | 65.3% (47 of 72) | 89.1% (898 of 1008) |
| Nature of elements/atomsa | 73.2% (52 of 71) | 88.5% (893 of 1009) |
| Visual estimation | 83.3% (40 of 48) | 87.7% (905 of 1032) |
| Resonance | 79.5% (35 of 44) | 87.8% (910 of 1036) |
To examine the impact of representations on students using multiple features, the dataset was also analyzed for cooccurrence of features. Approximately half of the student responses (50.6%) were coded with more than one feature, but only one pairing of features was present in at least 10% of student responses. The features Lewis dot structure and bond order cooccurred in 25.2% of student responses. The use of this combination of features varied by representation (χ2 = 35.2; p < 0.001; w = 0.181) with students receiving chemical formula using these two features simultaneously most often (36.3% of responses) and ball and stick image the least often (14.1%). A cooccurrence of these two features was also associated with a higher percent correct (χ2 = 7.6; p = 0.006; w = 0.084), where students who cited both features predicted bond length correctly 92.3% of the time compared to 85.9% of those who did not cite both features. Only 1.5% of the sample cited both bond order and atomic size, the expected features based on chemical conventions.
Polarity
The chemical convention expected for determining polarity of sulfur dioxide is to use the relative placement on the periodic table and trends in electronegativity to determine that sulfur and oxygen atoms differ in electronegativity and thus the S to O bond is polar. Second, the number of electron pairs (bonded and unbonded) on the central sulfur atom is used with valence shell electron pair repulsion (VSEPR) theory to predict a bent shape for the molecule. Finally, by associating the polar bonds with the bent shape of the molecule, one can determine that the direction of dipole moments do not cancel out and conclude the molecule has a net dipole moment.The percentages in Table 7 are the students in each survey (group) who selected that the sulfur dioxide molecule was polar. The most substantive difference was between the two visual representations, students receiving the space filling image representation had a higher rate of correct prediction than students receiving the ball and stick image representation (χ2 = 5.68; p = 0.017; w = 0.101). A similar difference was observed between students receiving the space filling image and students receiving the Lewis dot structure (χ2 = 5.31; p = 0.021; w = 0.099). The differences observed among the representations with polarity are not as pronounced as the differences observed with the bond length prompt.
|
|
|
|
|
|---|---|---|---|
| 87.5% | 84.0% | 83.8% | 90.5% |
The percentage with which features were observed in each survey where students were asked to explain how they predicted molecular polarity of sulfur dioxide are shown in Table 8. The observed features in students’ responses that were not chemically relevant to polarity were: bond order (4.3%), nature of elements/atoms (2.5%), net dipole moment zero (1.8%), nature of nonpolar bonds (1.1%), same pair of atoms (.5%), and size of atom (0.3%). The percentages from Table 8 provide an insight to the features cued by the representations. The differences among the features cued with the polarity prompt were more subdued than the differences observed with the bond length prompt, matching the trend observed in the percent of correct predictions.
| Feature (percent of 1081) |
|
|
|
|
|---|---|---|---|---|
| a Not relevant to polarity. | ||||
| Lewis dot structure (47.6%) | 51.3% | 50.7% | 45.5% | 43.3% |
| Ambiguous shape (33.4%) | 32.6% | 32.8% | 38.3% | 29.8% |
| Electronegativity (33.3%) | 36.8% | 29.9% | 37.9% | 28.7% |
| Bent shape (30.4%) | 30.3% | 32.1% | 28.9% | 30.5% |
| Nature of polar bonds (23.0%) | 26.1% | 22.0% | 24.2% | 20.0% |
| Net dipole moment nonzero (4.7%) | 6.5% | 3.7% | 3.2% | 5.5% |
| Bond ordera (4.3%) | 5.0% | 3.7% | 5.1% | 3.6% |
| Unclear dipole moment (2.7%) | 3.8% | 1.1% | 2.2% | 3.6% |
| Nature of elements/atomsa (2.5%) | 2.7% | 1.5% | 3.2% | 2.5% |
| Net dipole moment zeroa (1.8%) | 1.9% | 2.6% | 1.4% | 1.1% |
| Linear shape (1.5%) | 1.5% | 3.4% | 0.4% | 0.7% |
| Visual estimation (1.5%) | Not applicable | 0.0% | 2.2% | 3.6% |
| Nature of nonpolar bondsa (1.1%) | 1.5% | 0.4% | 1.4% | 1.1% |
| Same pair of atomsa (0.5%) | 0.0% | 0.0% | 1.1% | 0.7% |
| Size of atoma (0.3%) | 0.0% | 0.0% | 0.0% | 1.1% |

The most prominent difference observed was between chemical formula and Lewis dot structure representations leading to a higher rate of citing Lewis dot structure feature than the representations of ball and stick and space filling images (χ2 = 4.80; p = 0.029; w = 0.067). After this difference, some differences were observed among the infrequent codes of linear shape and visual estimation. Students with Lewis dot structures were more likely to cite a linear shape than the other representations (χ2 = 8.62; w = 0.089; statistical significance is not reported as the expected cell count is less than 5). This relationship is likely attributed to the Lewis dot structure providing a visual marker of a linear shape, but it should be noted that only 3.4% of students explicitly noted a linear shape. Students with the space filling image representation were more likely to cite visual estimation than students with Lewis dot structure or ball and stick image representations (χ2 = 6.142; w = 0.087).
Among the 1081 students who explained how they predicted polarity, 935 students (86.5%) predicted correctly that sulfur dioxide is a polar molecule. The percentages in Table 9 show the students who cited a specific feature and predicted polarity correctly and students who did not cite a specific feature but predicted polarity correctly. It was found that when students cited bent shape (χ2 = 47.0; p < 0.001; w = 0.208), nature of polar bonds (χ2 = 13.8; p < 0.001; w = 0.113), or Lewis dot structures (χ2 = 24.1; p < 0.001; w = 0.149), they were more likely to predict polarity correctly. No students citing linear shape made a correct polarity prediction (χ2 = 104; w = 0.310) and as expected students describing a net dipole moment of zero (χ2 = 82.8; w = 0.277) or nonpolar bonds (χ2 = 50.6; w = 0.216) had markedly lower percent correct although the sample size citing each feature was small.
| Feature | Percent correct when cited feature | Percent correct when NOT cited feature |
|---|---|---|
| a Not relevant to polarity. | ||
| Lewis dot structure | 91.8% (473 of 515) | 81.6% (462 of 566) |
| Ambiguous shape | 86.1% (311 of 361) | 86.7% (624 of 720) |
| Electronegativity | 90.3% (325 of 360) | 84.6% (610 of 721) |
| Bent shape | 97.3% (320 of 329) | 81.8% (615 of 752) |
| Nature of polar bonds | 93.6% (233 of 249) | 84.4% (702 of 832) |
| Net dipole moment nonzero | 98.0% (50 of 51) | 85.9% (885 of 1030) |
| Bond ordera | 74.5% (35 of 47) | 87.0% (900 of 1034) |
| Unclear dipole moment | 69.0% (20 of 29) | 87.0% (915 of 1052) |
| Nature of elements/atomsa | 81.5% (22 of 27) | 86.6% (913 of 1054) |
| Net dipole moment zeroa | 15.8% (3 of 19) | 87.8% (932 of 1062) |
| Linear shape | 0.0% (0 of 16) | 87.8% (935 of 1065) |
| Visual estimation | 87.5% (14 of 16) | 86.5% (921 of 1065) |
| Nature of nonpolar bondsa | 16.7% (2 of 12) | 87.3% (933 of 1069) |
| Same pair of atomsa | 40.0% (2 of 5) | 86.7% (933 of 1067) |
| Size of atoma | 100% (3 of 3) | 86.5% (932 of 1078) |
As seen in responses to bond length, the polarity responses were also analyzed for cooccurrence of features. The majority of students’ responses (57.4%) were coded with more than one feature. The most common pairing was Lewis dot structure and bent shape (18.1%), although other pairings were also well represented including Lewis dot structure with either ambiguous shape, electronegativity, or nature of polar bonds, and electronegativity paired with either ambiguous shape, bent shape or nature of polar bonds (all greater than 9.4%). The only relationship found between representation and pairing of features was with the combination of electronegativity and ambiguous shape (χ2 = 10.9; p = 0.012; w = 0.100), a combination used in 13.2% of responses to those who received chemical formula but only 5.5% of the responses to those with space filling. In general, pairing of features was associated with a higher percent predicting polarity correctly. In particular, pairing of bent shape with either Lewis dot structure or electronegativity had higher percent correct and the pairing of nature of polar bonds with either Lewis dot structure or electronegativity also had higher percent correct (w ranged from 0.079 to 0.151).
Intermolecular forces
The chemical conventions for determining intermolecular forces are to first enact the conventions listed for polarity for each molecule. Next, one would identify that the hydrogen in a water molecule exhibits a particularly strong, partial positive charge and the oxygen in the sulfur dioxide molecule exhibits a partial negative charge. Given the strength of the charge on hydrogen, and the principle of opposite charges attract, and the attraction is proportional to the strength of the charges, the strongest intermolecular force is identified as between the hydrogen in water and the oxygen in sulfur dioxide. Finally, the strongest intermolecular forces can be characterized using definitions of intermolecular force types as hydrogen bonding.There were two prompts analyzed to investigate the impact of different representations on the correct prediction of intermolecular forces between sulfur dioxide and water. Fig. 2 shows the representations of the two molecules students were provided in each survey. Since students were randomly assigned to one representation, they received the same representation type as they did from Fig. 1. The first prompt asked students to identify the strongest type of intermolecular force to exist between the two molecules. The percentages of students in each survey (group) who selected hydrogen bonding as the strongest type of intermolecular force are shown in Table 10. The largest difference was observed between students receiving a space filling image and students receiving chemical formula, however the difference was not statistically significant and the effect size did not reach a small effect (χ2 = 2.89; p = 0.089; w = 0.073). Thus, no substantive impact of the four representations on students predicting the strongest type of intermolecular force correctly was observed. In reviewing the distractors choice selected among the incorrect responses, students receiving chemical formula were more likely to select dipole–dipole interaction (41.4%) than students from the other representations (ranging from 21.7% to 35.7%).
 | ||
| Fig. 2 Representations for the prompts about intermolecular forces. | ||
|
|
|
|
|
|---|---|---|---|
| 49.0% | 53.4% | 53.1% | 56.4% |


The second prompt asked students to identify the location of the strongest type of intermolecular force between sulfur dioxide and water. The percentages shown in Table 11 are of the students who selected that the strongest type of intermolecular forces exists between hydrogen in water and oxygen in sulfur dioxide. No statistically significant difference was found among the four groups of students on identifying the correct location and the effect size failed to meet the threshold of a small effect. Thus, the impact of these different representations on the location of the strongest type of intermolecular force between sulfur dioxide and water was not meaningful. The most common distractor selected for the location was “between O in H2O and H in H2O”; this shows that students mistake an intermolecular force for an intramolecular bond. Students with space filling images were more likely to select this distractor (33.5%) than students with chemical formula (25.5%) with the other representations in the middle (Lewis dot structure at 30.3% and ball and stick image at 30.7%). Given that the four representations did not have an observable impact on the prediction of the strongest type or location of intermolecular force between sulfur dioxide and water, the exploration into the features cued to students by the representations is in the Appendix 3. In summary, the findings match the trend that students receiving the textual representations were more likely to invoke features associated with the expected chemical conventions than students receiving the visual representations.
|
|
|
|
|
|---|---|---|---|
| 52.9% | 49.4% | 53.4% | 50.2% |
Discussion
The Multimedia Learning Theory on Learning with Text and Visual Representations describes the different presumed processes with textual versus visual representations. In this theory, textual representations rely on learners’ use of chemistry conventions to make predictions, while visual representations rely on learners’ visual perceptions of the representations to bring forth the internal representation they will use for making predictions. Among visual representations, attention should be paid to the extent a visual representation is a concrete or abstract visual representation. Concrete representations provide explicit features thus being more similar to the referent. In the context of relative bond length, relevant features are the size of the pair of atoms involved in each bond, and the bond order between the pair of atoms involved in each bond. In reviewing the representations, the size of atoms is explicitly modeled in only the space filling image and bond order is explicitly modeled in both Lewis dot structure and ball and stick image. In the context of polarity, relevant features are the shape of the molecule, the presence and direction of polar bonds and the net dipole moment in the molecule. The shape of the molecule is explicit in the ball and stick image and space filling image. All of the relevant features not described as explicit are implicit to each representation and can be inferred from the representation by applying knowledge of chemical conventions.Chemical formula, as a textual representation, had no explicit depiction of the relevant features. Student success with chemical formula in making correct predictions can then be attributed to proficiency with relevant chemical conventions. The features cued by chemical formula support this as students were more often cued to Lewis dot structure, bond order, and polarity while making prediction of the three chemical properties, when receiving this representation. Finding the rate of correct predictions with chemical formula in the middle of the range for all prompts except for identification of intermolecular force type provides an indication of students’ success with chemical conventions. One possible explanation for the predictive accuracy in the middle of all representations is two-fold: (1) the reliance on chemical conventions provides more opportunity for making mistakes in creating Lewis dot structures and identifying the relevant features and (2) cueing students to chemical conventions may also call attention to relevant chemical conventions that may be overlooked in other representations, such as bond order when determining bond length. An example of reliance on chemical conventions leading to potential mistakes is the higher rate of citing resonance with chemical formula than other representations. Similarly, past work has shown that students misinterpret chemical formulas and textbooks have chemical formulas, where visual representations can be used (Kozma and Russell, 1997; Wu and Shah, 2004; Nyachwaya and Wood, 2014). This proposed explanation provides a reason for how chemical formulas can support some students while failing to support other students in generating correct predictions.
Lewis dot structures are presented as a hybrid textual and visual representation as it carries elements of both. This representation features an explicit depiction of connectivity in the molecule and bond order, which were both implicit in chemical formula. The presence of these explicit features can explain why students with Lewis dot structures had the highest rate of correct prediction on relative bond length compared to all other representations. In particular, students with Lewis dot structure cited the feature of bond order as a relevant feature at a higher rate than all other representations as well. Molecular shape is implicit in Lewis dot structure and this can explain why students with Lewis dot structure underperformed students with space filling image on predicting polarity; however it does not explain the comparable performance on this task between students with the Lewis dot structure and students with the ball and stick image. One important area to note is the potential for students to incorrectly presume molecular shape is an explicit feature of Lewis dot structure. In the current study, only 3.4% of students receiving Lewis dot structure described a linear shape, but all of those students made an inaccurate prediction on the polarity of the molecule.
The two visual representations, ball and stick image and space filling image, had more explicit features than the prior two representations. Both visual representations explicitly depict connectivity and molecular shape. In contrasting the two, the ball and stick image explicitly depicts bond order and the space filling image explicitly depicts the relative size of the atoms. Students with the ball and stick image outperformed students with the space filling image on correctly predicting bond length and correspondingly students with the ball and stick image were more often cued to bond order in their response. Students with space filling were more likely to predict molecular polarity than students with the ball and stick image though there is no clear explanation in terms of presence of external features or the citing of relevant cues. Neither visual representation appeared to be advantageous toward identifying the strongest type of intermolecular force or its location, possibly owing to the amount of information needed in addition to the representation to determine intermolecular forces.
Both visual representations were more likely to rely on a visual estimation than students with chemical formula or Lewis dot structure. It is notable that students who were cued to visual estimation performed no better on the bond length, polarity, or intermolecular forces prompts. At the current research setting the visual representations were not incorporated into the instruction and assessments to the extent of the other representations. Prior literature indicates promoting students engagement with the representation can boost performance on tasks (Talanquer, 2017), thus it is possible that promoting student engagement with these representations can improve students correct prediction of chemical properties when provided these representations. It is also possible that the enactment of visual estimations can lead to incorrect predictions as students might make an inaccurate visual estimate of the representation given or may be cued to features that are unrelated to the chemical property. The lack of a sizable difference in percent correct when students cited the feature visual estimation does not support this, but the code visual estimation was conservatively applied to only the responses that made a clear description particular to the image provided. One piece of supportive evidence for inaccuracy among visual estimations is that students who were cued to size of the atoms were less likely to make correct predictions on bond length and this feature was primarily cited among students who were provided a space filling image.
Across the set of data there is a mixed relationship of students citing features explicit to the representation. With bond length, students receiving Lewis dot structure were more likely to cite bond order but students receiving ball and stick were not. Across all the chemical properties, students receiving the representations that explicitly showed the shape of the molecule were no more likely to cite shape of molecule than the other representation. This stands in contrast to past work where novice chemistry major students focused on structural features while classifying representation, which in here are operationalized as explicit features (Stains and Talanquer, 2007). It may be the case that some students were not apt to note explicit features in their responses because these features were already demonstrated in the representation.
As an exploratory work, the results point to the following hypotheses each of which will require future testing to determine the accuracy and utility. First, students are more likely to engage in chemical conventions, such as determining bond order when solving bond length or determining polarity when solving intermolecular forces, when given chemical formulas compared to visual representations. Second, a small proportion of students attribute molecular shape as an explicit property of Lewis dot structures which hinders making chemical predictions reliant on shape. This hypothesis is consistent with past research literature documenting student challenges in determining molecular shape from Lewis structures (Cooper et al., 2010; Wang and Barrow, 2013). Third, some students receiving visual representations, and in particular students receiving the space filling image, rely on visual estimations of the image to make chemical predictions. This hypothesis matches Wu and colleagues (2001) finding that students described that space filling images are more realistic depictions of molecules. Fourth, students enacting visual estimations can make inaccurate estimates, including for features that are depicted explicitly in the representation. For example, in the bond length prompt, students receiving the space filling representation were more likely to cite the size of the atoms as a relevant feature but students citing this feature were less likely to indicate the bonds were equal length. A possible explanation advanced by Wu and Shah (2004) in a review article described how studies have found students' struggle with translating between two-dimensional and three-dimensional representations owing to the difficulties in manipulating depth and visual cues; i.e. struggles with visual perceptions. Our future work seeks to test these hypotheses by exploring their feasibility across a set of molecules.
Implications
Instructional implications from this work are to call attention to how representations are utilized during instruction, particularly upon their first introduction to students. The delineation of explicit and implicit features from each representation plays an important role in how students utilize the representation and instructors should make this delineation a component of instruction. Following the delineation of explicit and implicit features, attention should be given to the interaction between structure of a molecule and the effects structure has on properties as suggested by Defever and colleagues (2015). Students’ knowledge of structure can be compartmentalized (Stains and Talanquer, 2007; Defever et al., 2015) and thus instruction and assessment may benefit by calling attention to the explicit and implicit features in a representation to determine the overall structure as a means to predict properties. Student assessments that utilize representations should consider the intended process for students in the assessment as different representations cue students to different features and thus processes. For example, if an assessment seeks to measure students’ utilization of chemical conventions to make an accurate prediction, chemical formula or Lewis dot structures may be chosen over visual representations. Finally, if instructors find it important for students to enact chemical conventions from visual representations, it is likely necessary for instructors to enact this skill. This enactment can include presenting exemplars of deriving chemical conventions from visual representations (e.g. using a ball and stick model to generate a Lewis dot structure), engaging students to enact the process and providing feedback on students’ proficiencies with this skill.Limitations
This study is limited in scope by its reliance on a single molecule. While the choice of utilizing a single molecule throughout removed possible confounding explanations, it remains unknown to what extent the observations are dependent upon the molecule chosen. Additionally, this study is reliant on an assumption that the relative proportion of students who described a feature is a proxy for the extent students were cued to that feature by that representation. It is plausible that students might be cued to a particular feature and not explicitly mention it in response to the prompt. Additionally, the methodology enacted of survey collection of a large group of students offered only a description of which features were cited in students’ responses and did not offer an opportunity to explore students’ reasoning patterns further. As a result, no claims can be made on the reasoning patterns students engaged in or the prior conceptual knowledge with which they entered the survey with that pertains to each representation. Finally, as exploratory work, no claims for generalizability of the findings can be made. Instead, the trends observed and hypotheses advanced are better purposed as seeds for future research projects. The methodology enacted herein, utilizing random assignment of students to representations, offers a potential direction for advancing such future research projects.There is also a concern with the space filling images presented in Fig. 2 that depict a sulfur dioxide and water molecule adjacent. Unintentionally, the two molecules appear approximately the same size in this image and the actual relative size of one molecule to the other is not accurately depicted. This image was only presented to students upon receiving the questions pertaining to intermolecular forces. The impact of the relative size of the molecules on student responses to intermolecular force type and location cannot be fully known, however in reviewing the open-ended responses to these prompts the relative size of the molecules was very rarely described. It is also worth noting that the survey design did not allow students to return to past questions so there is no anticipated impact of this figure on the responses to bond length and polarity.
Conclusions
The results presented demonstrate that the representations presented to students impact the features cued to students and the likelihood students make correct predictions regarding chemical properties. Understanding how representations impact the features cued to students and the processes students engage in has the potential to develop an evidence base that can support how to introduce representations within instruction, which representations to select when introducing chemical concepts to students, and which representations to utilize when assessing student knowledge. As exploratory work, the results led to a set of hypotheses which can inform future work to generate such an evidentiary base. Additionally, the methodology of random assignment of representations and comparing the processes students engage can be expanded to additional molecules and chemical properties to further develop such an evidentiary base.Conflicts of interest
There are no conflicts of interest to declare.Appendix
Appendix 1
The complete survey given to students is presented in Table 12.| Consider the model of a molecule [insert representation of sulfur dioxide] |
| Bond length |
| Prompt 1. (Multiple-choice) |
| Are the bonds between sulfur and oxygen the same length? |
| Option 1: The bonds between sulfur and oxygen are NOT the same length |
| Option 2: The bonds between sulfur and oxygen are the same length |
| Prompt 2. (Open-ended) |
| Explain what factors you considered while determining whether the bonds between sulfur and oxygen were the same. |
| Prompt 3. (Open-ended) |
| How does the given [representation name] inform your answer about the bond legnth between sulfur and oxygen? |
| Polarity |
| Prompt 4. (Multiple-choice) |
| Do you think this molecule is polar or nonpolar? |
| Option 1: The molecule is POLAR |
| Option 2: This molecule is NON-POLAR |
| Prompt 5. (Open-ended) |
| Explain what factors you considered while determining the polarity of the molecule. |
| Prompt 6. (Open-ended) |
| How does the given [representation] inform your answer about the polarity of the molecule? |
| Consider the two molecules [insert representation of sulfur dioxide AND insert same representation of water] |
| Intermolecular forces |
| Prompt 7. (Multiple-choice) |
| What is the strongest type of intermolecular force to exist between the two molecules? |
| Option 1: Dipole–dipole interaction |
| Option 2: Ion–dipole interaction |
| Option 3: Hydrogen bonding |
| Option 4: Covalent bonding |
| Option 5: London dispersion forces |
| Prompt 8. (Multiple-choice) |
| Between which two atoms would the strongest type of intermolecular force exist? |
| Option 1: Between S in SO2 and O in SO2 |
| Option 2: Between two of the same atoms |
| Option 3: Between O in H2O and H in H2O |
| Option 4: Between O in SO2 and H in H2O |
| Option 5: Between S in SO2 and H in H2O |
| Prompt 9. (Open-ended) |
| How do the given [representations] inform your answer about the atoms between which the strongest type of intermolecular force exists? |
| Consider the four ways to represent a molecule below: |
|
| Prompt 10. (Open-ended) |
| Would you change any of your responses to the previous questions about bond length, polarity, or intermolecular force? If yes, please explain why. |
Appendix 2
The following section includes the codebooks with complete list of student terms for bond length (Table 13), polarity (Table 14), and intermolecular forces (Table 15).| Feature | List of student terms |
|---|---|
| Bond order | Bond order |
| Number of bonds | |
| Double, single, or triple bonds | |
| 1.5 bonds | |
| Number of bonded/shared electrons | |
| Lewis dot structure | Lewis dot structure |
| Dots and lines | |
| Charge of atom or molecule | |
| Formal charge | |
| Number of electrons | |
| Number of valence electrons | |
| Bonding to achieve octet | |
| Expanded octet | |
| Lone pairs or non-bonding electrons | |
| Only for survey with chemical formula | |
| sulfur is the central atom | |
| Two oxygens bonded to sulfur | |
| Resonance | Presence of resonance within the structure |
| Hybrid structures | |
| Polarity | Electronegativity values |
| Polar or non-polar molecule | |
| Dipole moment | |
| Pull of the atom on electrons | |
| Partial charge | |
| Shape of molecule | Molecular Shape |
| Linear or bent | |
| Molecular geometry | |
| Electron geometry | |
| Symmetry within the molecule | |
| Size of atom | Size of atom |
| Relative size of atomic cloud | |
| Nature of bonds | Attraction between atoms |
| Minimized repulsion between atoms | |
| Sharing of electrons | |
| Bond is between non-metals | |
| Covalent bond | |
| Type of bond | |
| Nature of elements/atoms | Location of elements in the periodic table |
| Specify chemical or physical properties (not including electronegativity or atomic size) of elements without note of them Being the same or their size | |
| Description of elements such as non-metals or generic mention of their strength | |
| Atomic weight | |
| Same pair of atoms | Each bond has the same pair of atoms or elements. |
| Same atoms are bonded to the central atom | |
| If the student mentions two oxygens, this response is not sufficient to get this code. | |
| Visual estimation | Only for surveys with Lewis dot structure, ball and stick, and space filling model |
| Color of the balls or sphere | |
| Estimating using the image given on the screen such as measuring with a finger | |
| Bonds appear to be similar in the picture on the screen | |
| Picture of the molecule |
| Feature | List of student terms |
|---|---|
| Electronegativity | Electronegativity of atoms |
| Comparing electronegativities | |
| Difference in electronegativities | |
| Lewis dot structure | Lewis dot structure |
| Lone pairs | |
| Valence electrons | |
| Octet | |
| Amount of electrons | |
| Formal charge | |
| Charge of the atom | |
| Only for survey with chemical formula | |
| Central atom is sulfur, position of atoms in the structure | |
| Nature of polar bonds | Dipole moment |
| Partial charges | |
| Imbalance in charges | |
| Charge separation at the ends of bonds | |
| Unbalance in the charge distribution | |
| Unequal share of electrons | |
| Bond is polar | |
| Unequal pull | |
| Nature of nonpolar bonds | Equal sharing of electrons |
| Bonds are not polar | |
| No dipole moment | |
| Bent shape | Bent |
| Trigonal planar | |
| ≤120 degrees | |
| Linear shape | Linear |
| Ambiguous shape | Molecular or electron geometry |
| Asymmetrical molecule | |
| Symmetrical molecule | |
| Bond angle | |
| Tetrahedral | |
| Lone pair/bond pair repulsion | |
| Unbalanced geometry | |
| Angular geometry | |
| Net dipole moment nonzero | Vectors do not cancel |
| Charges do not cancel | |
| Bonds do not cancel | |
| Net dipole moment zero | Dipole moments cancel out |
| Arrows cancel each other out | |
| Equal and opposite pull on neighboring atom | |
| Charges cancel out | |
| Bonds cancel out/polarity of each bond cancel | |
| Unclear dipole moment | Pull on electrons |
| Vague description of pull on neighboring atom | |
| Distribution of electrons/charges | |
| Bond order | Number/amount of bonds between atoms |
| Bond order | |
| Number of electrons shared | |
| Length of bonds | |
| Nature of elements/atoms | Non-metal |
| Location of elements of periodic table | |
| Type of atom | |
| Electron affinity | |
| Electron configuration | |
| Atomic/molar mass | |
| Electronic configuration | |
| Compare location in electronegativity table | |
| Size of atom | Atomic radius |
| Same pair of atoms | Each side of the molecule has the same atom |
| Equal and opposite pull by the same atom | |
| Visual estimation | Only for surveys with Lewis dot structure, ball and stick, and space filling model |
| Student drew a straight line through the image of the molecule | |
| Picture of molecule | |
| Looked at the diagram (has to be an explicit mention of the image shown on the survey) | |
| Used the drawing provided |
| Feature | List of student terms | Quotes (bold text added for emphasis) |
|---|---|---|
| Reference to image | Visualize the hydrogen bond | “ Looking at these two chemical formulas, I can see that they are two different molecules…” |
| Model shows | ||
| Model illustrates | ||
| See the model to visualize how the hydrogen bond takes place | ||
| Visualize molecules | ||
| Student can see | ||
| When looking | ||
| Student making a reference to the pictorial representation | ||
| Strength of bond/intermolecular force | Hydrogen bond is stronger than dipole–dipole forces | “… hydrogen bonding is stronger than dipole–dipole and dispersion…” |
| Strength of bond | ||
| Hydrogen bond is strong | ||
| Strong intermolecular force | ||
| Student mentioned strength/strong | ||
| Hydrogen bond – ambiguous | Hydrogen bond is between hydrogen and oxygen | “A bond is a hydrogen bond if H is connected to N,F,O .” |
| Hydrogen bond is between H and N,O,F | ||
| Hydrogen bond as intra and intermolecular force | ||
| Student mentions hydrogen bonding without specifying location | ||
| Code not applied if student only lists the forces and does not apply to the molecules | ||
| Hydrogen bond – intramolecular | SO2 has contains hydrogen bond | “The strongest intermolecular force in hydrogen bonding within the H 2 O molecule with an H and an O…” |
| Water contains hydrogen bond | ||
| Hydrogen bond – intermolecular | Dipole–dipole is between water and SO2 | “ Hydrogen bonding is one of the strongest intermolecular forces that exist, and it is the strongest one between these two molecules .” |
| Dipole–dipole is between SO2 and another molecule | ||
| Dipole–dipole forces – ambiguous | Dipole–dipole is present | “Both are polar, therefore Dipole–Dipole attractions exist .” |
| Student mentions dipole–dipole without mentioning location | ||
| Code not applied if student only lists the forces and does not apply to the molecules | ||
| Dipole–dipole forces – intramolecular | H2O has dipole–dipole | “The strongest bond found in SO 2 is dipole–dipole .” |
| SO2 contains dipole–dipole | ||
| Dipole–dipole forces – intermolecular | Dipole–dipole is between water and SO2 | “ Dipole–dipole forces occur between the positive and negative ends of polar molecules. In this case, that would be between the S in SO 2 and O in H 2 O .” |
| Dipole–dipole is between SO2 and another molecule | ||
| London dispersion forces | London dispersion forces | “SO 2 has LDF …” |
| LDF | ||
| Code not applied if student only lists the forces and does not apply to the molecules | ||
| Lewis dot structure | Lewis dot structure | “It precisely shows how atoms are connected to each other …” |
| Lone pairs | ||
| Valence electrons | ||
| Structure | ||
| Connectivity between atoms | ||
| Charge on the atom | ||
| Charge of the molecule | ||
| Ion | ||
| Number of bonds | ||
| Double or single bonds | ||
| Number of atoms | ||
| Polarity | Water is polar | “ SO 2 is a bent and is polar … H 2 O is the same as SO 2 in that it is bent and is polar …” |
| SO2 is polar | ||
| There are polar molecules | ||
| There are nonpolar molecules | ||
| Partial charges | ||
| Dipole moments | ||
| Poles | ||
| Electronegativity | ||
| Attraction | Opposite charges attract | “…that the negative pole of sulfur would be most attracted to the positive pole of hydrogen in water.” |
| Dipoles attract | ||
| Atoms attract | ||
| Poles attract | ||
| Pull on atom | ||
| Pull on molecule | ||
| Hydrogen and oxygen attract each other | ||
| Shape of molecule | Bent shape | “Sulfur dioxide has a bent structure …” |
| Molecular geometry | ||
| Geometry | ||
| Bond angle | ||
| Symmetry | ||
| Orientation of atoms | ||
| Orientation of molecules | ||
| Size of atom | Atomic size | “The size of the oxygen atom shows that…” |
| Sphere size | ||
| Atomic orbitals | ||
| Type of element | Type of element | “I can see what elements make up each molecule…” |
| Types of molecules | ||
| “Identity of element” | ||
| Elements/atoms present | ||
| Nonmetal | ||
| Type of bond | Type of bond | “The type of bonds present…” |
| Covalent bond | ||
| Type of imforce |
Appendix 3
The following section includes the results and analyses of the features cued to students while predicting intermolecular forces and the likelihood of predicting correctly when citing a feature.Students responded to the open-ended prompt that asked them how the given representation helped them in determining the atoms between which the strongest type of intermolecular force exists. Features were determined using the same open coding process described with the earlier prompts. To understand the impact of representations on features cued, Table 16 shows the percent frequency with which features were observed in students’ responses by survey.
| Feature (percent of 1070) |
|
|
|
|
|---|---|---|---|---|
| a Not relevant to intermolecular forces. | ||||
| Strength of bond/intermolecular force (43.1%) | 41.3% | 43.3% | 45.2% | 42.3% |
| Reference to image (33.5%) | 23.9% | 31.1% | 43.4% | 34.9% |
| Polarity (29.2%) | 39.0% | 25.8% | 26.5% | 25.7% |
| Hydrogen bonding – intermolecular (27.1%) | 28.6% | 27.0% | 27.2% | 25.7% |
| Hydrogen bonding – intramolecular (16.7%) | 18.5% | 18.4% | 15.4% | 14.7% |
| Hydrogen bonding – ambiguous (16.6%) | 16.2% | 15.4% | 16.9% | 18.0% |
| Lewis dot structure (14.3%) | 19.3% | 22.1% | 10.3% | 5.9% |
| Dipole–dipole forces – intramolecular (10.3%) | 14.7% | 9.7% | 7.7% | 9.2% |
| Shape of moleculea (8.3%) | 8.9% | 6.4% | 9.6% | 8.5% |
| Dipole–dipole forces – ambiguous (6.2%) | 9.3% | 5.2% | 5.5% | 4.8% |
| Type of elementa (4.8%) | 5.0% | 3.4% | 5.1% | 5.5% |
| Type of bonda (4.5%) | 4.2% | 5.2% | 4.4% | 4.0% |
| Attraction (4.4%) | 4.2% | 3.7% | 5.9% | 3.7% |
| Dipole–dipole forces – intermolecular (4.1%) | 4.2% | 3.0% | 4.4% | 4.8% |
| Size of atoma (2.4%) | 0.8% | 0.0% | 1.5% | 7.4% |
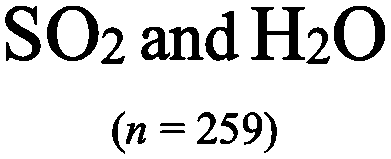
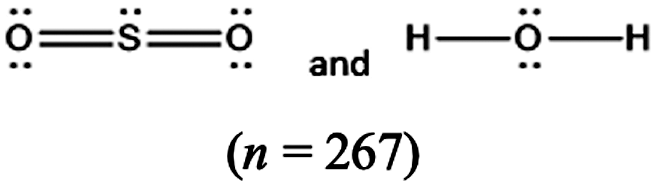
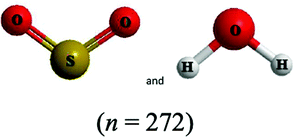
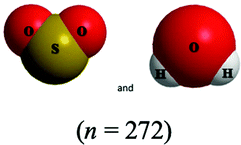
In their responses about how the given representation helped them, students receiving ball and stick or space filling images referred to the image higher than those receiving the other two representations (χ2 = 23.5; p ≤ 0.001; w = 0.148). Another feature observed with a small to medium effect was student with the chemical formula or Lewis dot structure representation were more likely to cite the feature Lewis dot structure than students with the other representations (χ2 = 34.8; p ≤ 0.001; w = 0.180). The students with chemical formula representation were also more likely than the other representations to discuss polarity (χ2 = 16.0; p ≤ 0.001; w = 0.122) and dipole–dipole forces – intermolecular (χ2 = 7.145; p ≤ 0.008; w = 0.82) in their responses. These findings match the trend of the textual representations prompting more attention to chemical conventions than the visual representations. Students receiving the space filling representation more often cited the size of atoms in their response than the other three representations (χ2 = 37.283; p ≤ 0.001; w = 0.187). This could be a reflection of either a reliance on visual features or a reflection of the prompt which included information that the spheres in the space filling image were relative atomic cloud sizes.
Of the 1070 responses to the open-ended prompt for intermolecular forces, 374 (35.0%) predicted correctly that the strongest type of intermolecular force between sulfur dioxide and water is hydrogen bonding that exists between hydrogen in water and oxygen in sulfur dioxide. Table 17 shows the likelihood of making correct predictions about intermolecular forces when citing or not citing a feature. As expected, it was observed that when students cited hydrogen bonding – intermolecular they were more likely to predict the type and location of the strongest intermolecular force correctly (χ2 = 232.166; p ≤ 0.001; w = 0.466). Alternatively, if they cited hydrogen bond – intramolecular, or any of the three dipole–dipole forces features, they were less likely to predict the type and location of the strongest intermolecular force correctly. Finding minimal relationships between representation type and the citation of many of the features that describe type and location of intermolecular force in Table 16 can explain why representation type was not found to relate to students correct prediction of the strongest type of intermolecular force in Table 10 or location of this intermolecular force in Table 11.
| Feature | Percent correct when cited feature | Percent correct when NOT cited feature |
|---|---|---|
| a Not relevant for intermolecular forces. | ||
| Strength of bond/intermolecular force | 32.1% (148 out of 461) | 37.1% (226 out of 609) |
| Reference to image | 40.5% (145 out of 358) | 32.2% (229 out of 712) |
| Polarity | 27.9% (87 out of 312) | 37.9% (287 out of 758) |
| Hydrogen bonding – intermolecular | 71.4% (207 out of 290) | 21.4% (167 out of 780) |
| Hydrogen bonding – intramolecular | 8.4% (15 out of 179) | 40.3% (359 out of 891) |
| Hydrogen bonding – ambiguous | 40.4% (72 out of 178) | 33.9% (302 out of 892) |
| Lewis dot structure | 33.3% (51 out of 153) | 35.2% (323 out of 917) |
| Dipole–dipole forces – intramolecular | 10.9% (12 out of 110) | 37.7% (362 out of 960) |
| Shape of moleculea | 18.0% (16 out of 89) | 36.5% (358 out of 981) |
| Dipole–dipole forces – ambiguous | 12.1% (8 out of 66) | 36.5% (366 out of 1004) |
| Type of elementa | 45.1% (23 out of 51) | 34.4% (351 out of 1019) |
| Type of bonda | 35.4% (17 out of 48) | 34.9% (357 out of 1022) |
| Attraction | 38.3% (18 out of 47) | 34.8% (356 out of 1023) |
| Dipole–dipole forces – intermolecular | 11.4% (5 out of 44) | 36.0% (369 out of 1026) |
| Size of atoma | 15.4% (4 out of 26) | 35.4% (370 out of 1044) |
Acknowledgements
The authors acknowledge the efforts of the students who completed the survey and instructors who supported the administration of the survey. In addition, the authors acknowledge Ying Wang and J. D. Young for assistance with the coding process.References
- Ainsworth S., (2006), DeFT: A conceptual framework for considering learning with multiple representations, Learn. Instr., 16, 183–198.
- Ainsworth S., (2008), in Gilbert J. K., Reiner M. and Nakhleh M. (ed.), Visualization: Theory and Practice in Science Education, Netherlands: Springer, pp. 191–208.
- Cohen J., (1992), A power primer, Psychol. Bull., 112, 155–159.
- Cooper M. M., Grove N., Underwood S. M. and Klymkowsky M. W., (2010), Lost in Lewis Structures: An Investigation of Student Difficulties in Developing Representational Competence, J. Chem. Educ., 87, 869–874.
- Cooper M. M., Underwood S. M. and Hilley C. Z., (2012), Development and validation of the implicit information from Lewis structures instrument (IILSI): do students connect structures with properties? Chem. Educ. Res. Pract., 13, 195–200.
- Cooper M. M., Corley L. M. and Underwood S. M., (2013), An investigation of college chemistry students' understanding of structure-property relationships, J. Res. Sci. Teach., 50, 699–721.
- Defever R. S., Bruce H. and Bhattacharyya G., (2015), Mental Rolodexing: Senior Chemistry Majors’ Understanding of Chemical and Physical Properties, J. Chem. Educ., 92, 415–426.
- Dickmann T., Opfermann M., Dammann E., Lang M. and Rumann S., (2019), What you see is what you learn? The role of visual model comprehension for academic success in chemistry, Chem. Educ. Res. Pract., 20, 804–820.
- Eilam B., (2013), in Treagust D. F. and Tsui C. (ed.), Multiple Representations in Biological Education, Netherlands: Springer, pp. 55–73.
- Flowers P., Theopold, K., Langley, R. and Robinson, W.R., (2019), Chemistry 2eOpenStax.
- Gilbert J. K., (2005), Visualization in Science Education, Netherlands: Springer, pp. 9–27.
- Gilbert J. K. and Treagust D., (2009), Introduction: Macro, Submicro and Symbolic Representations and the Relationship Between Them: Key Models in Chemical Education, Netherlands: Springer.
- Harrison A. G. and Treagust D. F., (2000), Learning about atoms, molecules, and chemical bonds: A case study of multiple-model use in grade 11 chemistry, Sci. Educ., 84, 352–381.
- Hoffmann R. and Laszlo P., (1991), Representation in Chemistry, Angew. Chem., Int. Ed. Engl., 30, 1–16.
- Kararo A. T., Colvin R. A., Cooper M. M. and Underwood S. M., (2019), Predictions and constructing explanations: an investigation into introductory chemistry students’ understanding of structure–property relationships, Chem. Educ. Res. Pract., 20, 316–328.
- Kohl P. B. and Finkelstein N., (2017), in Treagust D. F., Duit R. and Fischer H. (ed.), Multiple Representations in Physics Education, Netherlands: Springer, pp. 231–254.
- Kozma R. B., (1991), Learning with Media, Rev. Educ. Res., 61, 179–211.
- Kozma R. B. and Russell J., (1997), Multimedia and understanding: Expert and novice responses to different representations of chemical phenomena, J. Res. Sci. Teach., 34, 949–968.
- Linenberger K. J. and Bretz S. L., (2014), Biochemistry students' ideas about shape and charge in enzyme-substrate interactions, vol. 42, pp. 203–212.
- Luxford C. J., (2013), Use of Multiple Representations to Explore Students’ Understandings of Covalent and Ionic Bonding as Measured by the Bonding Representations Inventory, Miami University.
- Nyachwaya J. M. and Wood N. B., (2014), Evaluation of chemical representations in physical chemistry textbooks, Chem. Educ. Res. Pract., 15, 720–728.
- Özmen H., (2004), Some Student Misconceptions in Chemistry: A Literature Review of Chemical Bonding, J. Sci. Educ. Technol., 13, 147–159.
- Rau M. A., (2017), Conditions for the Effectiveness of Multiple Visual Representations in Enhancing STEM Learning, Educ. Psychol. Rev., 29, 717–761.
- Rau M. A. and Moore J. W., (2020), Active Learning in College Science, Berlin: Springer International Publishing, pp. 567–582.
- Rau M. A., Aleven V. and Rummel N., (2009), Intelligent Tutoring Systems with Multiple Representations and Self-Explanation Prompts Support Learning of Fractions, Amsterdam, Netherlands, 2009.
- Rau M. A., Aleven V., Rummel N. and Rohrbach S., (2012), Intelligent Tutoring Systems, Berlin: Springer, pp. 174–184.
- Rau M. A., Aleven V. and Rummel N., (2017), Making connections among multiple graphical representations of fractions: sense-making competencies enhance perceptual fluency, but not vice versa, Instr. Sci., 45, 331–357.
- Rodriguez J.-M. G., Hux N. P., Philips S. J. and Towns M. H., (2019), Michaelis–Menten Graphs, Lineweaver–Burk Plots, and Reaction Schemes: Investigating Introductory Biochemistry Students’ Conceptions of Representations in Enzyme Kinetics, J. Chem. Educ., 96, 1833–1845.
- Rodriguez J.-M. G., Stricker A. R. and Becker N. M., (2020), Students’ interpretation and use of graphical representations: insights afforded by modeling the varied population schema as a coordination class, Chem. Educ. Res. Pract., 21, 536–560.
- Schank P. and Kozma R., (2002), Learning chemistry through the use of a representation-based knowledge building environment, J. Comput. Math. Sci. Teach., 21, 253–279.
- Schnotz W. and Bannert M., (2003), Construction and interference in learning from multiple representation, Learn. Instr., 13, 141–156.
- Shenton A. K., (2004), Strategies for ensuring trustworthiness in qualitative research projects, Educ. Inf., 22, 63–75.
- Stains M. and Talanquer V., (2007), Classification of Chemical Substances using Particulate Representations of Matter: An analysis of student thinking, Int. J. Sci. Educ., 29, 643–661.
- Stieff M., Hegarty M. and Deslongchamps G., (2011), Identifying Representational Competence With Multi-Representational Displays, Cogn. Instr., 29, 123–145.
- Talanquer V., (2017), Concept Inventories: Predicting the Wrong Answer May Boost Performance, J. Chem. Educ., 94, 1805–1810.
- Talanquer V., (2018), Progressions in reasoning about structure–property relationships, Chem. Educ. Res. Pract., 19, 998–1009.
- Wang C.-Y. and Barrow L. H., (2013), Exploring conceptual frameworks of models of atomic structures and periodic variations, chemical bonding, and molecular shape and polarity: a comparison of undergraduate general chemistry students with high and low levels of content knowledge, Chem. Educ. Res. Pract., 14, 130–146.
- Wu H.-K. and Puntambekar S., (2012), Pedagogical affordances of multiple external representations in scientific processes, J. Sci. Educ. Technol., 21, 754–767.
- Wu H.-K. and Shah P., (2004), Exploring visuospatial thinking in chemistry learning, Sci. Educ., 88, 465–492.
- Wu H.-K., Krajcik J. S. and Soloway E., (2001), Promoting understanding of chemical representations: Students' use of a visualization tool in the classroom, J. Res. Sci. Teach., 38, 821–842.
| This journal is © The Royal Society of Chemistry 2021 |