Analysis of biochemistry students’ graphical reasoning using misconceptions constructivism and fine-grained constructivism: why assumptions about the nature and structure of knowledge matter for research and teaching
Jon-Marc G. Rodriguez *a and
Marcy H. Towns
 b
b
aDepartment of Chemistry, University of Iowa, Iowa City, Iowa 52242-1294, USA
bDepartment of Chemistry, Purdue University, West Lafayette, Indiana 47907, USA
First published on 16th July 2021
Abstract
In this work, we discuss the importance of underlying theoretical assumptions in research, focusing on the conclusions reached when analyzing data from a misconceptions constructivist (stable, unitary) perspective in contrast to a fine-grained constructivist (resources, knowledge-in-pieces) perspective. Both frameworks are rooted in the idea that students construct knowledge based on experiences, but differ in terms of assumptions about the nature and structure of knowledge. Importantly, we argue that misconceptions constructivism and fine-grained constructivism represent different models that can be used to draw conclusions about student reasoning in order to modify instruction. To this end, we present the results of a qualitative study that focused on how students reasoned graphically, analyzing biochemistry student exam responses (n = 50) using both the misconceptions constructivist framework and the fine-grained constructivist framework. The prompts analyzed were two open-ended exam questions administered in a biochemistry course, with the questions requiring students to draw conclusions about rate and reason about how graphs (such as a typical Michaelis–Menten plot) are constructed. As part of this work, themes emerged related to (1) alternative conceptions for reaction rate, reaction order, and Michealis–Menten plots (misconceptions constructivist interpretation), as well as (2) perceptual cuing that lead students to attend to less relevant surface features (fine-grained constructivist interpretation).
Introduction
As a theory about knowledge, rather than viewing an individual's knowledge as reflections of an objective transmitted reality, constructivism acknowledges that individuals try to make sense of content within the context of their own experiences and prior knowledge, that is, students are not simply provided a photocopy of transmitted information (Bodner, 1986). Having roots in Piaget's work in developmental psychology (Piaget, 1964; Herron, 1975; Good et al., 1978), constructivism has implications for research and teaching, particularly in terms of shifting the focus toward having students explain their reasoning in order to better understand personal mental models (Herron, 1978). There are variations of constructivism—“many forms”—that differ in terms of how they emphasize the role of the individual (personal constructivism) or the role of others in constructing knowledge (social constructivism) (Bodner and Klobuchar, 2001). Nevertheless, in the current work we focus more on the nature of the knowledge constructed, addressing the relative grain size of cognitive units and related assumptions.The primary argument discussed in this work is elegantly presented in a paper by Elby (2000) that outlines a critical distinction between a misconceptions constructivist perspective and a fine-grained constructivist perspective. The misconceptions constructivist view frames students’ knowledge in terms of relatively large, stable concepts that are typically applied across contexts, with instruction involving identifying and replacing non-normative ideas. Thus, conceptual change involves guiding students in recognizing the inconsistencies related to their current conception and highlighting the plausibility and potential utility of an alternative conceptualization (Posner et al., 1982). Contrastingly, a fine-grained constructivist view frames students’ knowledge in terms of small cognitive units that are context-dependent, with instruction involving understanding the organization of students’ ideas, how they emerge, and how to productively leverage the knowledge students have (Hammer et al., 2005; diSessa et al., 2016). Within this model, conceptual change involves gradual modification of the overall knowledge structure by drawing connections between existing ideas and the incorporation of additional ideas into this knowledge structure. Additionally, a fine-grained constructivist perspective does not frame student use of ideas across contexts as an issue of transfer, because this implies a unitary view of knowledge acquisition and application; rather, an emphasis is placed on the emergent activation of resources as a result of focusing on salient features in a problem (Hammer et al., 2005).
Building on the discussion presented by Elby (2000), we posit different theoretical commitments associated with the use of different models related to student reasoning result in different interpretations and conclusions. It is within this context that we situate the current study, using chemical kinetics as the context to investigate students’ reasoning using different theoretical perspectives. To this end, we are interested in the guiding research question, How do students reason about graphs related to chemical kinetics and enzyme kinetics? This question is broad enough to lend itself to analysis involving misconceptions constructivism and fine-grained constructivism, with the presentation of the results emphasizing the ways in which the contrasting perspectives informed the conclusions reached.
Fine-grained constructivism
Overview
This paper emphasizes the differences between two related, but fundamentally different perspectives involving different theoretical commitments—fine-grained constructivism and misconceptions constructivism. For clarification, Elby (2000) used the term fine-grained constructivism to broadly refer to the ontological assumptions about knowledge described by knowledge-in-pieces (diSessa, 1993) and the resources framework (Hammer et al., 2005); likewise, we use the terms knowledge elements, resources, and cognitive units interchangeably to describe the pieces of knowledge described within the fine-grained constructivist view. Throughout our discussion, we prefer to use fine-grained constructivism and misconceptions constructivism as the operationalizable terms for this work because of the way it simultaneously emphasizes the similarities (i.e., shared roots in constructivism) while highlighting the differences related to the ontology of cognitive structure. In particular, we appreciate the descriptive nature of these terms, where fine-grained constructivism naturally suggests questions that are too often glossed over—What is grain size? How “fine” is fine-grained? In the sections that follow we seek to address these questions.What is “grain size”?
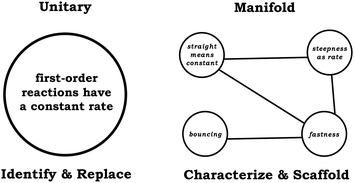
In the introduction section we provided a general overview of constructivism and the distinction between misconceptions constructivism and fine-grained constructivism. Here, we build on this discussion by highlighting what is meant when we discuss differences in grain size. To illustrate this idea in the context of chemical kinetics, consider a scenario where a student sees a linear [product] vs. time graph and (incorrectly) identifies the graph as involving a first-order reaction (Fig. 1). In this example, if we focus on a larger-grain size of knowledge and assume students’ reasoning is unitary and stable, then the students’ reasoning can be viewed as representing robust ideas that need to be modified. This is reflected in misconceptions-focused research related to graphing, which has documented common challenges such as conflation of slope and height and viewing the graph as a “picture” of the scenario modeled (McDermott et al., 1987; Beichner, 1994). Importantly, as a model for understanding students’ thinking, the misconceptions constructivist view provides minimal explanations of and predictions related to students’ reasoning. As stated by Elby (2000), misconceptions constructivism does not provide guidance regarding specific questions or contextual features that may influence student responses toward a particular answer; that is, it is unclear why students might have responded this way and we are unable to predict how students may respond on additional related tasks (e.g., other rate-related graphs or graphs in general).In contrast, viewing the example provided in Fig. 1 within the assumptions of fine-grained constructivism, there would be an emphasis on trying to understand the knowledge elements (and the relationship between these elements) that contribute to the overall larger statement made by the student. When reasoning about rate, students may bring in a variety of intuitive resources (Fig. 1), such as general ideas with a phenomenological basis like fastness (Parnafes, 2007) and bouncing (diSessa, 1993; Rodriguez et al., 2020c), or other knowledge elements related to graphical reasoning such as recognizing that the relative steepness provides information about rate (steepness as rate) or that a linear plot is related to a constant value or rate (straight means constant) (Rodriguez et al., 2018). The activation and use of these knowledge elements are not inherently right or wrong, but in some instances, they may be more relevant or productive and students may need support deciding when to use them. Moreover, the activation of these resources is the result of perceptual cuing, in which students focus on salient and prominent features of the problem-solving task (Elby, 2000).
This perceptual cuing allows us to make predictions; for the example in Fig. 1, the linearity of the plot is the most prominent feature, and thus, we can predict that for this prompt (and other graphical prompts) students will likely use straight means constant to draw conclusions, even when this is less productive for the context (i.e., regardless of the axes). Empirically, we have found this to be the case; a growing body of literature indicates students consistently associate the same ideas with specific graphical shapes and characterizing their application (or misapplication) as misconceptions does not adequately represent the data and it does not capture the nuances in students’ reasoning in a way that affords targeted instructional scaffolding (Rodriguez et al., 2018, 2019b, 2019c, 2020a, 2020b). Thus, as a model, fine-grained constructivism provides an explanatory account in a way misconceptions constructivism does not. Fine-grained constructivism affords us insight into students’ reasoning that allows us to characterize the salient features students were attending to in the task and acknowledge students’ productive inferences, such as correctly recognizing that a straight linear plot has a constant rate. Rather than identifying the students’ reasoning simply as wrong, we assert the challenge is related more to combining mathematical inferences (constant rate) with chemistry principles (considering which reaction order has a constant rate) (Bain et al., 2019a).
How “fine” is fine-grained?
Early work related to a fine-grained constructivist view involved a discussion of knowledge elements called phenomenological primitives—intuitive ideas having a phenomenological basis (diSessa, 1993). As discussed by diSessa (1993), phenomenological primitives are knowledge elements that can be used to construct explanations and require no additional justification. For example, dying away can be used to describe the observation that motion and sound tend to gradually dampen over time. Given their self-evident nature, phenomenological primitives can be considered good examples of prototypical fine-grained resources (i.e., it is unlikely there are knowledge elements relevant for education research that are smaller than this category of resources). However, as discussed by Wittmann (2006), resources within the fine-grained constructivist view could be fractal in nature, meaning you can “zoom” in or out and focus on resources of varying size. Thus, something characterized as a resource could be a group of resources. For example, in our previous work related to enzyme kinetics we used the resource-based model to describe students’ reasoning related to enzyme inhibition, which involved labeling statements such as binds allosteric site of enzyme as resources (Rodriguez and Towns, 2019b). Given the complex nature of ideas such as allosteric, enzyme, and other related terms, binds allosteric site of enzyme is far from being a self-evident, intuitive knowledge element, thus, this reflects a resource that is much larger in size than a phenomenological primitive.As an implication, critics may call into question whether large units of analysis are appropriate within the fine-grained constructivist perspective. That is, how fine does a fine-grained constructivist analysis have to be? Stated differently, is there a point where units characterized as resources are large enough that a fine-grained constructivist analysis becomes a misconceptions constructivist analysis? In short, the answer is no—we posit that fine-grained constructivism and misconceptions constructivism do not exist along the same continuum; this is because they are separate models that involve different assumptions. Even in the scenario where a group of students’ resources are consistently activated together or the unit of analysis or resource of interest is relatively large, we can expect that analysis informed by fine-grained constructivism will yield different results than if it were approached from a misconceptions constructivist view, with the differences in interpretation due to the differences in assumptions of each model. This has been shown to be the case in the extant literature. For example, in the previously discussed work in physics education, Elby (2000) illustrated the differences in conclusions reached when analyzing data from both perspectives, with a similar approach applied to support these claims in the context of the life sciences (Southerland et al., 2001; Gouvea and Simon, 2018; Lira and Gardner, 2020). Therefore, we reemphasize some of the key features and assumptions of fine-grained constructivism emphasized in this body of literature: (1) leveraging knowledge—students’ knowledge, the structure of their knowledge, and how that changes over time plays a different role in learning within fine-grained constructivism, focusing more on what students currently know instead of what they still have to be taught; (2) context over content—specific contextual features and presentation of the content is more important in dictating student responses than the content itself; (3) explanatory and predictive power—the conclusions reached and the inferences that move beyond the current dataset are different than those afforded using misconceptions constructivism. These ideas will be explored in more detail in this study.
What resources are relevant for the current study?
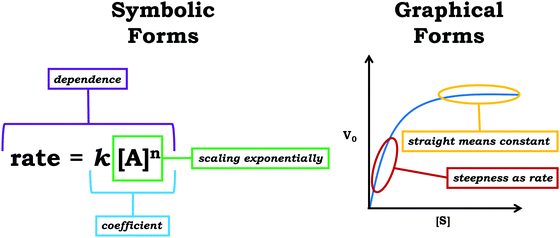
Within the fine-grained constructivist perspective, it is important to note that knowledge elements may reflect a variety of different types of knowledge, such as conceptual ideas or epistemological beliefs. One class of knowledge elements are symbolic forms, mathematical resources that reflect ideas about equations. Reasoning involving symbolic forms is characterized by associating mathematical ideas to a pattern in an equation (Sherin, 2001). In its original conception, the symbolic forms framework was developed as an analytic tool to characterize students’ mathematical reasoning during classical mechanics problem-solving in introductory physics (Sherin, 2001); as a result, most of the original symbolic forms discussed by Sherin (2001) involve simple algebraic manipulations—such as proportional reasoning—and context-specific ideas—such as the idea of balancing influences on opposite sides of an equation (e.g., forces). Nevertheless, the symbolic forms framework has been utilized in a variety of contexts to characterize reasoning related to advanced mathematics topics, including differentiation, integration, and eigenvectors (Izsak, 2004; Becker and Towns, 2012; Hu and Rebello, 2013; Jones, 2013, 2015b, 2015a; Von Korff and Sanjay Rebello, 2014; Dorko and Speer, 2015; Schermerhorn and Thompson, 2016; Dreyfus et al., 2017; Rodriguez et al., 2018). In our recent work, we have expanded the symbolic forms framework to characterize reasoning related to graphs, graphical forms, where reasoning involving graphical forms is characterized by associating mathematical ideas to a pattern in a graph (Rodriguez et al., 2019a); see Fig. 2 for an overview of symbolic forms and graphical forms. We have previously found the graphical forms framework to be a useful approach for characterizing students’ graphical reasoning (Rodriguez et al., 2018, 2019b, 2019c, 2020a, 2020b) and have decided to utilize this framework as part of the fine-grained constructivist analysis discussed in this paper.Methods
Research setting
Data for this study was collected from a large research-intensive university in the Midwestern United States, with all aspects of the project completed in accordance with the university's Institutional Review Board. That said, consent was obtained from students, students were informed that participation had no influence on their grade, and they were provided the opportunity to decline participation. The primary data source involved student exams, collected from a biochemistry course offered by a chemistry department. This course was intended primarily for second-year undergraduate life science majors and as prerequisite coursework, students were required to take general chemistry and two semesters of organic chemistry. In addition, the course used a commercially available textbook (Appling et al., 2016) and had three fifty-minute lectures each week during the semester. The exam data was collected in spring of 2019, sharing a data corpus discussed in a recent book chapter (Rodriguez et al., 2021) and we previously used this course context for student interviews in the spring of 2018 (Rodriguez and Towns, 2019b, 2020; Rodriguez et al., 2019b, 2019d).Data collection
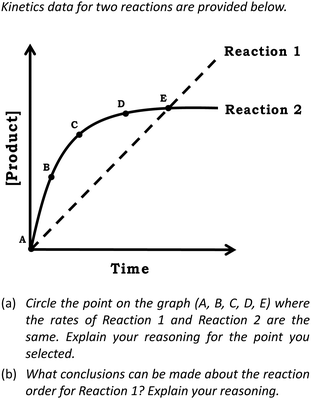
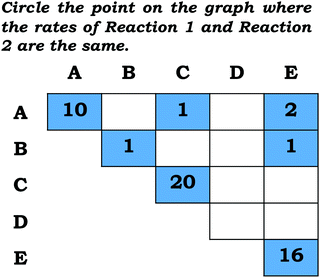
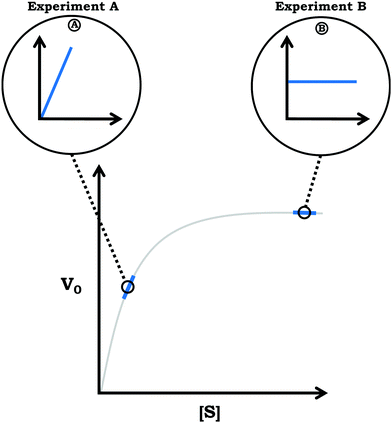
The primary data source involved students’ written responses to two questions, one taken from the students’ midterm exam and the other taken from their final exam. Both questions were developed through collaboration between the researchers and the course instructor. As shown in Fig. 3, for the midterm question, described from now on as Prompt 1, students were provided a graph with [product] vs. time and were prompted to draw conclusions about reaction rate in Item (a) and reason about reaction order in Item (b). Prompt 1 was developed, in part, by adapting a prompt from the physics education research literature, in which students were provided a distance vs. time graph showing the motion of two objects and students were asked to circle the point where the speed of the objects was equal (Madsen et al., 2012), see Fig. 4. To answer this prompt, students must attend to the relationship between the axes variables ([product] vs. time), approximate rate using the slope (Δx/Δy), and combine this information with knowledge about reaction order. In the case of the final exam question presented in Fig. 5, described from now on as Prompt 2, students were provided a Michaelis–Menten plot and were asked to draw a connection to how the graph was constructed in Item (a) and relate the graphs they drew to V0 in Item (b). This prompt requires students to recognize that V0 is a rate value associated with the individual [product] vs. time graphs. For context, the questions in Prompts 1 and 2 were constructed to build on some of the themes presented in our previous work involving qualitative interviews (Rodriguez and Towns, 2020). For example, we previously discussed some of the ideas students associated with graphical shapes and their connection to chemical kinetics (Rodriguez et al., 2019b), which is emphasized in Prompt 1 and we previously discussed how students reason about the construction of the Michaelis–Menten plot (Rodriguez et al., 2019d), which is emphasized in Prompt 2.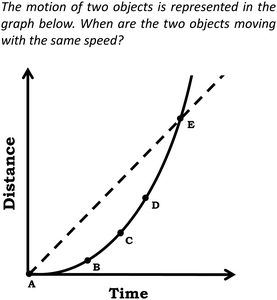 | ||
| Fig. 4 Prompt used in a study by Madsen et al. (2012), which was adapted to a chemistry context for this study (see Fig. 3 for the prompt used in the current study). | ||
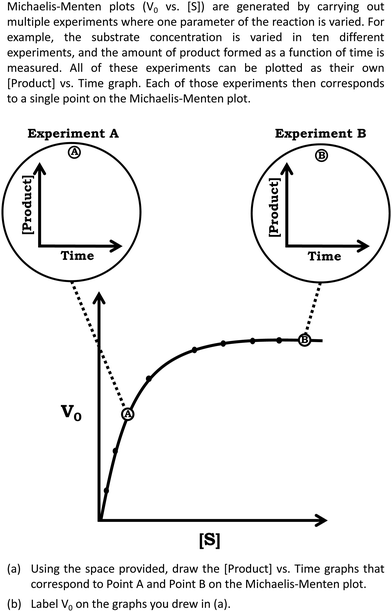 | ||
| Fig. 5 Prompt 2 used in the study, focuses on enzyme kinetics, specifically, the construction of the Michaelis–Menten plot. | ||
Using the underlying theoretical assumptions of fine-grained constructivism, we can make predictions about student responses based on salient features of the graphs. For example, in Prompt 1, we can predict more responses that involve focusing on the intersection, which has been previously reported as a key feature students tend to focus on in graphs (Elby, 2000; Madsen et al., 2012). In addition, linearity has prominence as a feature students attend to, which could be a problem if students are not coordinating this with the axis labels (Rodriguez et al., 2018, 2019b, 2019c; Rodriguez et al., 2020a). Lastly, given the importance of contextual features and framing within fine-grained constructivism, we can predict that the use of V0 instead of rate for the y-axis of Michaelis–Menten graphs could activate different ideas. As an example, previous research has shown that students may associate V0 with physics, which may inform their reasoning processes (Rodriguez et al., 2019d). Importantly, as previously stated in relation to Fig. 1, we reiterate that characterizing the responses listed here as misconceptions does not adequately consider the role of context in eliciting these ideas and it does not acknowledge the potential role these ideas have in contributing to expertise and knowledge development (Elby, 2000).
Data analysis
After photocopying the exams, students’ responses to Prompt 1 and Prompt 2 were transcribed, focusing on maintaining the fidelity of students’ written work; thus, we included any errors in the final transcriptions (e.g., syntax, spelling, and grammar, etc.). We then coded the exams using a combination of inductive and deductive coding and a constant comparison methodology (Strauss and Corbin, 1990). Within misconceptions constructivism, the development of codes typically focuses on the variation in students’ answers with subsequent interpretation of the data emphasizing the extent to which they reflect normative or non-normative reasoning. This involved codes that emerged inductively characterizing how students responded to an item (e.g., Point A Selected is a reference to a student circling Point A in the first item in Prompt 1), as well as codes that described the graphs students drew (e.g., Point A or Point B Graph is Non-Linear characterizes the graph students drew in response to the first item in Prompt 2). That is not to say these codes are not relevant for a fine-grained constructivist analysis, on the contrary, these codes are very useful for providing a general idea about student responses and noticing patterns in responses. However, analysis informed by fine-grained constructivism builds on these codes, interpreting the results from a different perspective and taking the analysis a step further to focus on relevant features such as the potential role of context in activating specific resources to explain the observed patterns. For the current study, in part, this involved deductive analysis using the list of graphical forms described in the literature (Rodriguez et al., 2019a). The complete coding scheme, organized by prompt and item, is provided in the Appendix.Although there were ∼200 students enrolled in the course, it is not necessary to code every exam, rather, analysis should emphasize reaching saturation of themes and making sure these themes were well-represented among the dataset (Saunders et al., 2018). As part of the process for reaching saturation, each exam was assigned a number (a random-number generator was used to select exams for analysis) and for application of codes we used the student response to each question as the unit of analysis (Campbell et al., 2013). We determined thematic saturation and representation was reached after coding n = 30 student exams, based on the lack of emergence of new codes, with subsequent analysis only further populating the code categories. Following initial coding of this dataset, in order to build a case for reliability (Watts and Finkenstaedt-Quinn, 2021), an independent researcher used our established coding scheme to code 20% of the dataset, resulting in a Kappa value of 0.96. As a final step, based on requests from reviewers, we coded additional exams, making the final sample n = 50. Pseudonyms were assigned to the students for the purposes of presenting the data.
Findings
Across each exam prompt we noted variation in student reasoning, with notable grouping around specific responses. In the sections that follow we present the findings by providing a general description of each exam item, followed by a discussion of the results for the items from a misconceptions constructivist perspective and a fine-grained constructivist perspective.Prompt 1, Item (a): graphical determination of rate
For the first item on Prompt 1, students were asked to indicate the point on the [product] vs. time graph where the two reactions had the same rate. By approximating rate using the slope, Point C is the best answer for this question. Although the intention was for students to only select a single point, some students selected more than one point for this item.| Point selected | Percentage (%) | Student response |
|---|---|---|
| A | 26 | Audrey: “at time = 0, nothing has happened, therefore both rates are equal to 0.0 = 0” |
| C | 42 | Helen: “The rate of a reaction can be determined by [product]/time, or in the case of the graph, it is the slope. At point C of Reaction 2 the slope is equal to the slope of reaction 2, therefore that is the point at which the reaction rates are equal.” |
| E | 38 | Walter: “At point E, both reactions have made the same [Product] in the same amount of time.” |
Prompt 1, Item (b): determination of reaction order
In the case of the second item in Prompt 1, students were asked to draw a conclusion about reaction rate given the data provided. From the graph we can infer that the rate of formation of the products is constant over time and thus it does not depend on the concentration of the reactants, suggesting the reaction is zero-order.Drake: “Reaction 1 is a first order reaction. It has a non-zero linear slope which means it is constantly making product at the same rate.”
Notably, student responses such as Drake's were nearly correct; in most cases having the correct reasoning, but not the correct initial claim (simply replacing “first” with “zero” would reflect a target student response with scientifically normative reasoning). Based on previous research, students tend to have difficulty describing zero-order reactions, specifically, what is happening at the particulate-level (Bain et al., 2018). This could be due to students likely being provided more opportunities to reason about other reaction types (first order, second order) without being prompted to consider the underlying mechanism behind zero-order reactions. Nevertheless, as discussed by Bain and colleagues (2018), students should be provided a variety of contexts related to different reaction orders in order to develop a more holistic and sophisticated conception of reaction order. That said, instruction should involve working through examples involving zero-order processes and even fractional reaction orders to discuss their implications for the phenomena modeled and the empirical basis of reaction order represented in the rate law.
Steve: “The reaction order of Reaction 1 is a first order. This can be concluded because the rate is constant and linear. A zero order reaction would have a horizontal line and second order has a exponential curve.”
Based on our collection of course artifacts and classroom observations from our previous study, students are likely thinking about a graph with different axes (Rodriguez et al., 2019b). Student responses such as Steve's were more explicit in terms of the reaction order the students assigned to specific shapes, which clarifies students were likely thinking about the shapes associated with rate vs. concentration graphs, as opposed to concentration vs. time graphs. As shown in Fig. 7, Steve's discussion (and other students that stated Reaction 1 was first order) makes sense if we consider an alternative way to model the data. That said, it is important to note that the students had productive resources for reasoning about reaction rate, including recognizing the constant rate. Indeed, there were only small differences when comparing the responses of students such as Drake and Steve with students that correctly identified the graph as zero order. As shown below, like Drake and Steve, Spencer noted that the rate was constant (graphical form straight means constant), but he made an explicit connection to the axes:
 | ||
| Fig. 7 Rate vs. concentration graphs, likely the graphs students were thinking about when responding to Prompt 1, Item (b); adapted from (Rodriguez et al., 2019b). | ||
Spencer: “Reaction one is zero order because the velocity would be at a consistent value due to the linear graph. [Product] increases the same amount per unit of time. Product/time would always be constant.”
One of the affordances of the fine-grained constructivist perspective is that we can see the ways in which students’ ideas are productive and can serve as a transition toward expert reasoning. As with the first item in Prompt 1, students such as Drake and Steve are bringing in useful ideas to reason about the prompt, with the problem being connecting these ideas to other relevant ideas and features in the graph. In both Prompt 1 items, the issue is focusing too much on salient features and not enough on the implications of the axes. In order to support students, instruction should draw attention to features such as the axes, helping students to view the axis as a key feature of the graph and how changing the axes changes the shape because of the relationship between the variables.
Prompt 2 Item (a) and Item (b): construction of a Michaelis–Menten plot
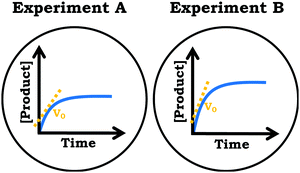
Whereas Prompt 1 focused on chemical kinetics broadly, Prompt 2 focused more explicitly on enzyme kinetics, requiring students to consider how the Michaelis–Menten plot is constructed. As part of the prompt used in this study, students were reminded that each point on the Michaelis–Menten plot corresponds to a concentration vs. time graph (Fig. 5). For the first part of Prompt 2, students were asked to draw graphs that corresponded to the indicated points along the Michaelis–Menten plot and in the second part they were asked to label V0 on the graph they constructed. With respect to scientifically normative reasoning, the expected student response would involve a curve for both experiments that is similar to the shape of the Michaelis–Menten plot. Moreover, V0 would be represented by a tangent line to the curve with the initial rate for Experiment B being higher than the initial rate for Experiment A, reflecting that Experiment B is associated with a larger V0 value; that is, the relative steepness related to the initial region for the concentration vs. time graph for Experiment B should be larger than that of Experiment A (Fig. 8).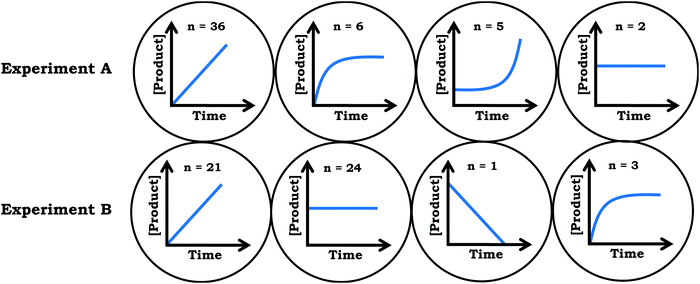 | ||
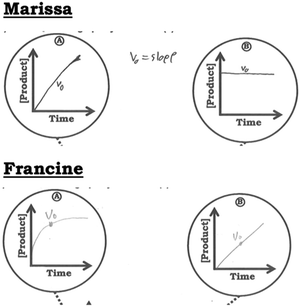
| Fig. 9 Summary of students’ responses to Prompt 2, Item (a). The values indicate how many students drew each general shape in response to the item. Note that not all students in this sample provided an answer for this item. See Fig. 8 for expected answer. | ||
Conclusions and implications
In this paper, we highlighted the importance of assumptions related to the nature and structure of knowledge, illustrating the differences in conclusions made when analyzing the data from a misconceptions constructivist perspective and a fine-grained constructivist perspective. Here, we summarize and contextualize the results from this study, framing the discussion by revisiting the previously discussed features related to fine-grained constructivism: leveraging knowledge, context over content, and explanatory and predictive power.Leveraging knowledge: what does this work tell us about students’ reasoning?
As discussed previously, students’ knowledge plays a different role within the fine-grained constructivist framework in comparison to the misconceptions constructivist framework. Given they are both rooted in constructivist ideas, both focus on the knowledge students have constructed; the difference is the implications that stem from the ontological assumptions related to the nature and structure of knowledge. If we assume students’ knowledge as consisting of stable and unitary concepts, the logical approach for interpreting data is to evaluate whether these concepts align with scientifically accepted ideas and focus on how to address a lack of alignment. As a result, data analyzed that operates within this framework tends to focus on cataloguing non-normative ideas and taking note of their frequency before and after instruction; however, this approach does not recognize the ways in which students’ current ideas—which may be categorized as incorrect—can contribute toward a more scientifically normative understanding. In the context of the current work, a few key alternative conceptions were discussed that emerged related to students’ reasoning, some of which have been previously discussed in the literature. First, most students did not utilize a ratio (Δx/Δy) conceptualization when comparing the rate of two different reactions, instead focusing on features such as the intersection of the curves. In part, this is related to covariational reasoning, in which students should be attending to the relationship between the variables (Carlson et al., 2002). Notably, previous challenges with rate-related ideas have been reported in the literature (Bain and Towns, 2016), especially with graphical representations of rate (Cakmakci et al., 2006; Bektaşli and Çakmakci, 2011); similarly, student difficulty with rate-related ideas is also apparent given the body of research on undergraduate mathematics education (White and Mitchelmore, 1996; Castillo-Garsow et al., 2013; Rasmussen et al., 2014). We also noted students misidentifying reaction order, with a tendency to state a linear [product] vs. time graph is a first-order reaction. Answering Item (b) in the first prompt involves recognizing the reaction is not dependent on concentration, suggesting a zero-order reaction. As discussed above, the mechanism of zero-order reactions are not intuitive (Bain et al., 2018), which is further complicated by research indicating students may have difficulty providing a definition for reaction order in general, even after a targeted learning intervention (Yalçınkaya et al., 2012). Lastly, we noted misconceptions related to the Michaelis–Menten plot and how it is constructed. Few students drew the expected graph for Prompt 2, with student responses potentially reflecting a subsection of the V0vs. [substrate] graph for the related [product] vs. time graph (Fig. 10), which builds on previous education literature on graphing related to students misinterpreting changes in height as an indication of changes in rate or misrepresenting the relationship between a process and the graphical representation of the process (McDermott et al., 1987; Beichner, 1994).On the other hand, if we assume a context-specific and manifold perspective of knowledge, subsequent analysis naturally raises questions regarding understanding how context influences emergence of ideas as well as the organization of ideas within a manifold structure. To this end, we focused on the features students attended to as they drew inferences about graphs related to reaction rate. Analysis indicated students utilized intuitive mathematical resources to interpret the [product] vs. time graph provided in Prompt 1 including: steepness as rate, intersection means same, and identity. Moreover, students also used steepness as rate when reasoning about Prompt 2. We argue that these cognitive resources are broadly useful for reasoning across contexts; however, issues arise when perceptual cuing results in the activation of less productive resources for a specific context (e.g., intersection means same). Prior research related to undergraduate mathematics education indicates students may view graphs as objects, to which ideas are assigned (Moore and Thompson, 2015). Although viewing the graph as an object and assigning ideas may sound analogous to graphical forms, the distinction is related to the nature of ideas assigned. Graphical forms involve assigning mathematical ideas to patterns in a graph, whereas viewing the graph as an object may involve assigning non-mathematical ideas, such as viewing a sigmoidal shape as an indicator that a titration occurred (even though the axes are concentration vs. time) (Rodriguez et al., 2019c). In the current dataset we noted instances in which students simply associated ideas with objects, such as when students tended to associate linearity with first order, reflecting an over-emphasis on surface features of the graphical representation. These results provide evidence in support of the generalizability of the results from our previously published small-scale study involving interviews with students, which indicated students tended to focus on the surface features of enzyme kinetics graphs and need more support unpacking how the Michaelis–Menten plot is constructed (Rodriguez and Towns, 2020). Based on these results, we suggest changes to instruction that consider students’ reasoning by focusing on the potential role the prompt plays in activating specific resources. This is discussed in more detail in the next section.
Context over content: what are the implications for instruction?
Given that misconceptions constructivism emphasizes the stability of ideas and their consistent application, changing the students’ conceptualization becomes the primary focus. Based on the findings discussed within the misconceptions constructivist interpretation, we know which content areas students struggled with related to the prompts. This is useful in the way it contributes to our collective knowledge of students, including our understanding of students’ challenges and cognitive development related to the target material (Shulman, 1986; Rodriguez and Towns, 2019a). Given this information, instructors can allot more time for the difficult concepts and potentially implement interventions to help students. Nevertheless, this analysis provides less direct and concrete suggestions for instructors and as stated by Elby (2000), “… since misconceptions are cross-contextually stable and inconsistent with expert knowledge, teachers cannot view them as contributing to expert understanding,” (p. 501).In contrast, the focus is shifted from the students’ conceptualization to the instructor's framing of the task within fine-grained constructivism as we focus on the role of perceptual cuing due to presentation of content. As discussed previously, changes to the prompt to help students focus on the importance of the axes would be useful for both items in Prompt 1 to activate relevant resources. Thus, instructors should leverage this information and provide opportunities for students to utilize productive resources with scaffolding. As an example, taking into account the features students focused on, we suggest specific changes to the prompt, such as adding a new initial item (before students select a point) that prompts them to begin thinking about the graphical determination of rate. This could be done by including a question that focuses on the definition of rate or relevant units to activate more productive resources such as steepness as rate. We have previously documented students’ tendency to use the graphical form steepness as rate across student samples and contexts—including two universities in the United States and one university in Sweden (Rodriguez et al., 2018, 2019b, 2019c, 2020a, 2020b)—suggesting a phenomenological basis and relatively high saliency. Thus, we posit that reminding students about rate within the prompt could support students in activating relevant resources. As another example, we noted students may inappropriately apply ideas such as intersection means same but recognizing this type of non-normative reasoning in a large-lecture classroom may be challenging. That said, one approach would be to employ collaborative student-centered learning, which provides opportunities for students to make their reasoning explicit (Becker and Towns, 2012), in addition to improving student learning outcomes across multiple dimensions (Freeman et al., 2014; Theobald et al., 2020). Additionally, one modification to subsequent versions of the prompt could be to use more precise language that specifies students should select a single point. We previously mentioned that Prompt 1 was adapted from a physics study, which is worth mentioning because in its original form the prompt was presented as a multiple-choice item, thus, students were forced to select a single response (Madsen et al., 2012). That said, given our version of the prompt was a free-response question, variation could be reduced by modifying the language for clarity.
Lastly, for Prompt 2, we noted students framing V0 as a single point, which may be the result of students incorporating ideas from other science courses. Interestingly, in our previous interviews related to enzyme kinetics, one of the students stated the y-axis of the Michaelis–Menten plot had the units of meters per second (an explicit reference to physics) and subsequently used this as part of her reasoning in interpreting the graph (Rodriguez et al., 2019d). This highlights the previously discussed importance of context and presentation, where the use of V0 may result in students potentially thinking about physics ideas. Consequently, we could predict students would be less likely to conceptualize V0 as a point and more likely to recognize it is related to slope if the y-axis were labled as rate instead of V0 (this is a claim we are particularly comfortable making given students’ demonstrated ability with regard to framing relative steepness as rate).
Explanatory and predictive power: what does this mean for future research?
Given the findings reported, we assert the need for more research that focuses on how to optimize the productive use of students’ intuitive ideas related to graphs. Research involving graphical forms has largely focused on chemical kinetics and ideas surrounding rate. We suggest other researchers utilize graphical forms to investigate students’ reasoning related to graphs, with a variety of contexts providing potentially productive avenues for future work. For example, we have previously suggested the utility of investigating topics such as wave-function graphs, plots typically generated in laboratory-based courses, or other quantitative topics related to advanced chemistry courses (Bain et al., 2019b). Additionally, given the emphasis placed on perceptual cuing within fine-grained constructivism, a limitation of this work is the fixed nature of exam responses, which do not provide the opportunity for follow-up questions to clarify students’ reasoning. That said, additional types of data such as eye-tracking during interviews would provide better evidence regarding the specific features attended to by the students allowing researchers to construct a more complete view of students’ reasoning processes.Moving forward, we would like to direct readers to one of the key assumptions that informed this work: depending on the theoretical commitments, frameworks influence the narrative of a research study (Abraham, 2008). As stated previously, misconceptions constructivism and fine-grained constructivism can be conceptualized as different models used to describe the same phenomena related to knowledge, reasoning, and learning. As chemists, we can appreciate both the use of models to describe phenomena that is not readily observable as well as the presence of multiple models to describe the same process (Taber, 2010). Arguably, evaluation of the utility of models related to students’ reasoning is subject to the same criteria used for scientific models (Passmore et al., 2016), that is, the model must be consistent with data and provide explanatory and predictive power. Stated differently, Elby (2000) emphasized that the distinction between the two frameworks moves beyond word choice (e.g., resources vs. concepts; unproductive resource vs. misconception, etc.):
“… the different cognitive structures posited by the two flavors of constructivism are not empty theoretical baggage; they lead to empirical differences … misconceptions constructivism and fine-grained constructivism, when taken seriously, do not disagree only about word choice, or about attitudes toward students, or about cognitive structures. They make different sets of predictions about students’ interpretations of representations,” (emphasis added, p. 500).
The fine-grained constructivist view allows us draw conclusions and make predictions about how cognitive units may be activated based on perceptual features—which was illustrated using our data. Based on the work reported herein and elsewhere, we emphasize the strong phenomenological basis of mathematical resources such as symbolic and graphical forms (Sherin, 2001; Rodriguez et al., 2019a). Outside of chemistry, in contexts such as physics and mathematics students learn fine-grained mathematical ideas such as the idea that the relative steepness of a graph provides information about rate, and it is likely these ideas are reinforced throughout their education. Thus, we can predict and expect that students will utilize these ideas across contexts based on the presence of specific graphical patterns. In contrast, part of the challenge with cataloging misconceptions is that they may be idiosyncratic, but even if a case can be built for their generalizability in a population, there is still little explanation as to why students may hold these ideas which makes it challenging to predict how students may use these ideas in different contexts.
Given chemistry education research is inherently an interdisciplinary field that has historically borrowed from other fields and traditions, our central claims build on the rich discussions across education research communities (diSessa, 1993; Elby, 2000; Southerland et al., 2001; Hammer et al., 2005; Gouvea and Simon, 2018; Lira and Gardner, 2020). As an implication for this work, we hope to continue a dialogue across the education community about the critical role of theoretical frameworks in discipline-based education research and the ways in which theoretical commitments influence the nature of the findings and implications.
Conflicts of interest
There are no conflicts to declare.Appendix
Code descriptions: Prompt 1, [Product] vs. time
| Code | Description |
|---|---|
| Item (a) | |
| Point A selected | Student selected Point A |
| Point B selected | Student selected Point B |
| Point C selected | Student selected Point C |
| Point E selected | Student selected Point E |
| Steepness as rate | Student describes relative steepness/slope as providing information about rate |
| Intersection means same | Student describes that values are equal or the same because they intersect; does not include student discussions of the origin (see “Identity”) |
| Identity | Student states that values are zero and are, thus, the same; often coded as a result of student selecting Point A for Item (a); may be coded with “Steepness as Rate” if students’ reasoning references slope/steepness |
| Item (b) | |
| Reaction 1 is first order | Student states Reaction 1 is a first-order reaction |
| Reaction 1 is zero order | Student states Reaction 1 is a zero-order reaction |
| Incomplete student response | Student did not state an order for Reaction 1 in Item (b) |
| Straight means constant | Student associates a straight line with something being constant; students must recognize that something (e.g., rate, slope, product formation, etc.) is constant or “steady”, it is not enough to simply state that the graph is linear |
Code descriptions: Prompt 2, V0vs. [Substrate]
| Code | Description |
|---|---|
| Item (a) | |
| Point A or Point B Graph is Linear, Positive Slope | Student drew a straight line with a positive slope (increasing over time) |
| Point A or Point B Graph is Linear, Negative Slope | Student drew a straight line with a positive slope (decreasing over time) |
| Point A or Point B Graph is Linear, Horizontal | Student drew a horizontal straight line |
| Point A or Point B Graph is Non-Linear | Student drew a curved graph |
| Item (b) | |
| V-naught is the Initial Data Point | Student labels the initial value (point) as V0 |
| V-naught is a Data Point (Not Initial) | Student labels a data point (not initial value) as V0 |
| V-naught is the Graph | Student labels the graph drawn as V0; in some cases, it is clear students recognized that V0 is supposed to be the slope of the plot, but if they drew a linear graph than V0 is essentially the whole graph |
| No V-naught Label | Student did not label V0 |
Acknowledgements
We wish to thank Leah Scharlott, Kevin Hunter, Alex Parobek, the Towns research group, and the Becker research group for their support and helpful comments on the manuscript.References
- Abraham M. R., (2008), Importance of a theoretical framework for research, in Nuts and Bolts of Chemical Education Research, Bunce D. M. and Cole R. S. (ed.), American Chemical Society, pp. 47–66.
- Appling D. R., Anthony-Cahill S. J. and Matthews C. K., (2016), Biochemistry: Concepts and Connections, 1st edn, Pearson Education, Ltd.
- Bain K. and Towns M. H., (2016), A review of research on the teaching and learning of chemical kinetics. Chem. Educ. Res. Pract., 17(2), 246–262.
- Bain K., Rodriguez J.-M. G. and Towns M. H., (2018), Zero-order chemical kinetics as a context to investigate student understanding of catalysts and half-life, J. Chem. Educ., 95(5), 716–725.
- Bain K., Rodriguez J.-M. G., Moon A. and Towns M. H., (2019a), Mathematics in chemical kinetics: Which is the cart and which is the horse? in It's just math: Research on students’ understanding of chemistry and mathematics, Towns M. H., Bain K. and Rodriguez J.-M. G. (ed.), ACS Symposium Series, American Chemical Society, pp. 25–46.
- Bain K., Rodriguez J.-M. G. and Towns M. H., (2019b), Chemistry and mathematics: Research and frameworks to explore student reasoning, J. Chem. Educ., 96(10), 2086–2096.
- Becker N. M. and Towns M., (2012), Students’ understanding of mathematical expressions in physical chemistry contexts: An analysis using Sherin's symbolic forms, Chem. Educ. Res. Pract., 13(3), 209–220.
- Beichner R. J., (1994), Testing student interpretation of kinematics graphs, Am. J. Phys., 62(8), 750–762.
- Bektaşli B. and Çakmakci G., (2011), Consistency of students’ ideas about the concept of rate across different contexts, Educ. Sci., 36(162), 273–287.
- Bodner G. M., (1986), Constructivism: A theory of knowledge, J. Chem. Educ., 63(10), 873–878.
- Bodner G. and Klobuchar M., (2001), The many forms of constructivism, J. Chem. Educ., 78(8), 1107.
- Cakmakci G., Leach J. and Donnelly J., (2006), Students’ ideas about reaction rate and its relationship with concentration or pressure, Int. J. Sci. Educ., 28(15), 1795–1815.
- Campbell J. L., Quincy C., Osserman J. and Pedersen O. K., (2013), Coding in-depth semistructured interviews: Problems of unitization and intercoder reliability and agreement, Soc. Meth. Res., 42(3), 294–320.
- Carlson M., Jacobs S., Coe E., Larsen S. and Hsu E., (2002), Applying covariational reasoning while modeling dynamic events: A framework and a study, J. Res. Math. Educ., 33(5), 352–378.
- Castillo-Garsow C., Johnson H. L. and Moore K. C., (2013), Chunky and smooth images of change, Learn. Math., 33(3), 31–37.
- Cooper M. M., Corley L. M. and Underwood S. M., (2013), An investigation of college chemistry students’ understanding of structure–property relationship, J. Res. Sci. Teach., 50(6), 699–721.
- diSessa A. A., (1993), Toward an epistemology of physics, Cogn. Instr., 10(2–3), 105–225.
- diSessa A. A., Sherin B. and Levin M., (2016), Knowledge analysis: An introduction, in Knowledge and interaction: A synthetic agenda for the learning sciences, diSessa A. A., Levin M. and Brown N. (ed.), Routledge, pp. 30–71.
- Dorko A. and Speer N., (2015), Calculus students’ understanding of area and volume units, Invest. Math. Learn., 8(1), 23–46.
- Dreyfus B. W., Elby A., Gupta A. and Sohr E. R., (2017), Mathematical sense-making in quantum mechanics: An initial peek, Phys. Rev. Phys. Educ. Res., 13(2).
- Elby A., (2000), What students’ learning of representations tells us about constructivism, J. Math. Behav., 19(4), 481–502.
- Eshach H., (2014), The use of intuitive rules in interpreting students’ difficulties in reading and creating kinematic graphs, Can. J. Phys., 92(1), 1–8.
- Freeman S., Eddy S. L., McDonough M., Smith M. K., Okoroafor N., Jordt H. and Wenderoth M. P., (2014), Active learning increases student performance in science, engineering, and mathematics, Proc. Natl. Acad. Sci. U. S. A., 111(23), 8410–8415.
- Good R., Mellon E. K. and Kromhout R. A., (1978), The work of Jean Piaget, J. Chem. Educ., 55(11), 688.
- Gouvea J. S. and Simon M. R., (2018), Challenging cognitive construals: A dynamic alternative to stable misconceptions, LSE, 17(2), ar34.
- Hammer D., Elby A., Scherr R. E. and Redish E. F., (2005), Resources, framing, and transfer, in Transfer of learning from a modern multidisciplinary perspective, Mestre J. P. (ed.), IAP, pp. 89–119.
- Herron J. D., (1975), Piaget for chemists: Explaining what “good” students cannot understand, J. Chem. Educ., 52(3), 147–150.
- Herron J. D., (1978), Piaget in the classroom: Guidelines for applications, J. Chem. Educ., 55(3), 165–170.
- Hu D. and Rebello N. S., (2013), Using conceptual blending to describe how students use mathematical integrals in physics, Phys. Rev. ST – Phys. Educ. Res., 9(2).
- Izsak A., (2004), Students’ coordination of knowledge when learning to model physical situations, Cogn. Instruct., 22(1), 81–128.
- Jones S. R., (2013), Understanding the integral: Students’ symbolic forms, J. Math. Behav., 32(2), 122–141.
- Jones S. R., (2015a), Areas, anti-derivatives, and adding up pieces: Definite integrals in pure mathematics and applied science contexts, J. Math. Behav., 38, 9–28.
- Jones S. R., (2015b), The prevalence of area-under-a-curve and anti-derivative conceptions over Riemann sum-based conceptions in students’ explanations of definite integrals, Int. J. Math Educ. Sci. Tech., 46(5), 721–736.
- Lira M. and Gardner S. M., (2020), Leveraging multiple analytic frameworks to assess the stability of students’ knowledge in physiology, CBE Life Sci. Educ., 18(3), 1–19.
- Madsen A., Larson A. M., Loschky L. C. and Rebello N. S., (2012), Differences in visual attention between those who correctly and incorrectly answer physics problems, Phys. Rev. ST – Phys. Educ. Res., 8(1), 010122.
- McDermott L. C., Rosenquist M. L. and van Zee E. H., (1987), Student difficulties in connecting graphs and physics: Examples from kinematics, Am. J. Phys., 55(6), 503–513.
- Moore K. C. and Thompson P. W., (2015), Shape thinking and students’ graphing activity, in Proceedings of the 18th Annual Conference on Research in Undergraduate Mathematics Education, Fukawa-Connelly T., Infante N., Keene K. and Zandieh M. (ed.), pp. 782–789.
- Parnafes O., (2007), What does “fast” mean? Understanding the physical world through computational representations, J. Learn. Sci., 16(3), 415–450.
- Passmore C., Schwarz C. V. and Mankowski J., (2016), Developing and using models, in Helping students make sense of the world using next generation science and engineering practices, Schwarz C. V., Passmore C. and Reiser B. J. (ed.), National Science Teachers Association, pp. 109–134.
- Piaget J., (1964), Part I: Cognitive development in children: Piaget development and learning, J. Res. Sci. Teach., 2(3), 176–186.
- Posner G. J., Strike K., Hewson P. W. and Gertzog W. A., (1982), Accommodation of a scientific conception: Toward a theory of conceptual change, Sci. Educ., 66(2), 211–227.
- Rasmussen C., Marrongelle K. and Borba M. C., (2014), Research on calculus: What do we know and where do we need to go? ZDM Math. Educ., 46(4), 507–515.
- Rodriguez J.-M. G. and Towns M. H., (2019a), Alternative use for the refined consensus model of pedagogical content knowledge: Suggestions for contextualizing chemistry education research, J. Chem. Educ., 96(9), 1797–1803.
- Rodriguez J.-M. G. and Towns M. H., (2019b), Analysis of student reasoning about Michaelis–Menten enzyme kinetics: Mixed conceptions of enzyme inhibition, Chem. Educ. Res. Pract., 20(2), 428–442.
- Rodriguez J.-M. G. and Towns M. H., (2020), Research on students’ understanding of Michaelis–Menten kinetics and enzyme inhibition: Implications for instruction and learning, Biophysicist, 1(2), 1–13.
- Rodriguez J.-M. G., Santos-Diaz S., Bain K. and Towns M. H., (2018), Using symbolic and graphical forms to analyze students’ mathematical reasoning in chemical kinetics, J. Chem. Educ., 95(12), 2114–2125.
- Rodriguez J.-M. G., Bain K. and Towns M. H., (2019a), Graphical forms: The adaptation of Sherin's symbolic forms for the analysis of graphical reasoning across disciplines. Int. J. Sci. Math. Educ.
- Rodriguez J.-M. G., Bain K. and Towns M. H., (2019b), Graphs as objects: Mathematical resources used by undergraduate biochemistry students to reason about enzyme kinetics, in It's just math: Research on students’ understanding of chemistry and mathematics, Towns M. H., Bain K. and Rodriguez J.-M. G. (ed.), ACS Symposium Series, American Chemical Society, pp. 69–80.
- Rodriguez J.-M. G., Bain K., Towns M. H., Elmgren M. and Ho F. M., (2019c), Covariational reasoning and mathematical narratives: Investigating students’ understanding of graphs in chemical kinetics, Chem. Educ. Res. Pract., 20(1), 107–119.
- Rodriguez J.-M. G., Hux N. P., Philips S. J. and Towns M. H., (2019d), Michaelis–Menten graphs, Lineweaver–Burk plots, and reaction schemes: Investigating introductory biochemistry students’ conceptions of representations in enzyme kinetics, J. Chem. Educ., 96(9), 1833–1845.
- Rodriguez J.-M. G., Harrison A. R. and Becker N. M., (2020a), Analyzing students’ construction of graphical models: How does reaction rate change over time? J. Chem. Educ., 97(11), 3948–3956.
- Rodriguez J.-M. G., Stricker A. R. and Becker N. M., (2020b), Exploring the productive use of metonymy: Applying coordination class theory to investigate student conceptions of rate in relation to reaction coordinate diagrams, J. Chem. Educ., 97(8), 2065–2077.
- Rodriguez J.-M. G., Stricker A. R. and Becker N. M., (2020c), Students’ interpretation and use of graphical representations: Insights afforded by modeling the varied population schema as a coordination class, Chem. Educ. Res. Pract., 21(2), 536–560.
- Rodriguez J.-M. G., Philips P. Sven J., Hux N. P. and Towns, M. H., (2021), Assessing system ontology in biochemistry: Analysis of students’ problem solving in enzyme kinetics, in Problems and problem solving in chemistry education, Tsaparlis G. (ed.), Royal Society of Chemistry.
- Saunders B., Sim J., Kingstone T., Baker S., Waterfield J., Bartlam B., et al., (2018), Saturation in qualitative research: Exploring its conceptualization and operationalization, Qual. Quant., 52(4), 1893–1907.
- Schermerhorn B. P. and Thompson J. R., (2016), Students’ use of symbolic forms when constructing differential length elements, in 2016 Physics Education Research Conference Proceedings, American Association of Physics Teachers, pp. 312–315.
- Sherin B. L., (2001), How students understand physics equations, Cogn. Instr., 19(4), 479–541.
- Shulman L. S., (1986), Those who understand: Knowledge growth in teaching, Educ. Res., 15(2), 4–14.
- Southerland S. A., Abrams E., Cummins C. L. and Anzelmo J., (2001), Understanding students’ explanations of biological phenomena: Conceptual frameworks or p-prims? Sci. Educ., 85(4), 328–348.
- Strauss A. and Corbin J., (1990), Basics of qualitative research: Grounded theory procedures and techniques, Sage Publications, Inc.
- Taber K. S., (2010), Straw men and false dichotomies: Overcoming philosophical confusion in chemical education, J. Chem. Educ., 87(5), 552–558.
- Theobald E. J., Hill M. J., Tran E., Agrawal S., Arroyo E. N., Behling S., et al., (2020), Active learning narrows achievement gaps for underrepresented students in undergraduate science, technology, engineering, and math, Proc. Natl. Acad. Sci. U. S. A., 1–8.
- Von Korff J. and Sanjay Rebello N., (2014), Distinguishing between “change” and “amount” infinitesimals in first-semester calculus-based physics, Am. J. Phys., 82(7), 695–705.
- Watts F. M. and Finkenstaedt-Quinn S. A., (2021), The current state of methods for establishing reliability in qualitative chemistry education research articles, Chem. Educ. Res. Pract., 10.1039/D1RP00007A.
- White P. and Mitchelmore M., (1996), Conceptual knowledge in introductory calculus, J. Res. Math. Educ., 27(1), 79.
- Wittmann M. C., (2006), Using resource graphs to represent conceptual change, Phys. Rev. ST Phys. Educ. Res., 2(2), 020105.
- Yalçınkaya E., Taştan-Kırık Ö., Boz Y. and Yıldıran D., (2012), Is case-based learning an effective teaching strategy to challenge students’ alternative conceptions regarding chemical kinetics? Res. Sci. Tech. Educ., 30(2), 151–172.
| This journal is © The Royal Society of Chemistry 2021 |

