
The current state of methods for establishing reliability in qualitative chemistry education research articles
Field M. Watts†
 * and
Solaire A. Finkenstaedt-Quinn†*
* and
Solaire A. Finkenstaedt-Quinn†*
Department of Chemistry, University of Michigan, Ann Arbor, Michigan 48109-1055, USA. E-mail: fieldmw@umich.edu; quinnsa@umich.edu
First published on 15th February 2021
Abstract
The tradition of qualitative research drives much of chemistry education research activity. When performing qualitative studies, researchers must demonstrate the trustworthiness of their analysis so researchers and practitioners consuming their work can understand if and how the presented research claims and conclusions might be transferable to their unique educational settings. There are a number of steps researchers can take to demonstrate the trustworthiness of their work, one of which is demonstrating and reporting evidence of reliability. The purpose of this methodological review is to investigate the methods researchers use to establish and report reliability for chemistry education research articles including a qualitative research component. Drawing from the literature on qualitative research methodology and content analysis, we describe the approaches for establishing the reliability of qualitative data analysis using various measures of inter-rater reliability and processes including negotiated agreement. We used this background literature to guide our review of research articles containing a qualitative component and published in Chemistry Education Research and Practice and the Journal of Chemical Education from the years 2010 through 2019 for whether they report evidence of reliability. We followed this by a more in-depth analysis of how articles from the years 2017 through 2019 discuss reliability. Our analysis indicates that, overall, researchers are presenting evidence of reliability in chemistry education research (CER) articles by reporting reliability measures, describing a process of negotiated agreement, or mentioning reliability and the steps taken to demonstrate it. However, there is a reliance on reporting only percent agreement, which is not considered an acceptable measure of reliability when used on its own. In addition, the descriptions of how reliability was established were not always clear, which may make it difficult for readers to evaluate the veracity of research findings. Our findings indicate that, as a field, CER researchers should be more cognizant of the appropriateness of how we establish reliability for qualitative analysis and should more clearly present the processes by which reliability was established in CER manuscripts.
Introduction
Chemistry education research (CER), and education research more broadly, can be divided into three general methodological traditions: quantitative, qualitative, and mixed methods (Creswell and Creswell, 2017). Qualitative studies in CER can range from analysing students’ and teachers’ experiences in classrooms and laboratories to how students think about topics spanning from bonding theories to reaction mechanisms. No matter the methodological tradition used to study these phenomena, it is important for researchers to demonstrate the use of appropriate approaches to address their specific research questions. One element of this is demonstrating the quality of the data analysis. The mode of demonstrating this may differ between the three methodological traditions, but in each it is important for researchers to provide evidence of the trustworthiness of their analysis.For establishing the trustworthiness of qualitative research, some researchers emphasize the need to provide quantitative measures of reliability while others focus on the need to adequately apply the trustworthiness criteria as described by Lincoln and Guba (1985). To illustrate the need for establishing trustworthiness for qualitative research, Armstrong et al. (1997) conducted a study where six experts in qualitative methodologies were tasked with analysing a transcript from a focus group and identifying up to five themes emerging from the data. The researchers then compared the themes that the experts identified. Armstrong et al. (1997) found that while the experts identified similar themes, they presented them differently. This indicates that there will be inherent differences in how researchers approach the same data set and that establishing some form of consistency during the data analysis process can support creating a cohesive interpretation. Ultimately, it is important for researchers to consider trustworthiness and reliability but up to the researcher to determine the appropriate approach for their data and intended analysis. It is also important for researchers to clearly present their analysis, including the important component of establishing reliability, so that readers can better understand and evaluate the results of the research (Phelps, 1994; Towns, 2013; Seery et al., 2019). However, there is currently no review in the literature examining how reliability is established for qualitative CER. As such, the goal of this methodological review is to provide an overview of how researchers establish and describe reliability for qualitative research in CER articles. This overview is intended to inform future directions for how the field considers reporting reliability for qualitative research.
Trustworthiness and reliability in qualitative research
Researchers tend to address trustworthiness through two different approaches (Lincoln and Guba, 1985). More conventionally, researchers may choose to consider external and internal validity, reliability, and objectivity. Others may take a more naturalistic approach which replaces these conventional considerations with Lincoln and Guba's (1985) four criteria. One of these criteria, dependability, aligns with the construct of reliability in that it captures the quality and consistency of the research process (Lincoln and Guba, 1985; Bretz, 2008). Dependability can be demonstrated in a number of ways. Foremost is by engaging a qualified person outside of the study in an “inquiry audit” of the research. By examining the process that the study followed, from methodological decisions to how the data is used and interpreted, the auditor can evaluate the dependability of the findings (Lincoln and Guba, 1985; Bretz, 2008).The primary focus of our methodological review—how chemistry education researchers demonstrate the reliability of their analysis in CER articles—aligns with one of the more conventional ways researchers may establish trustworthiness. Krippendorff (2004a) provides two definitions of reliability: that “a research procedure is reliable when it responds to the same phenomena in the same way regardless of the circumstances of its implementation” or “reliability is the degree to which members of a designated community agree on the readings, interpretations, responses to, or uses of given texts or data.” Krippendorff (2004a) describes three types of reliability: stability, reproducibility, and accuracy. Stability can be equated to intra-rater reliability, or how consistently an individual researcher analyses data when applying the same coding scheme over time. Reproducibility captures the consistency between two or more researchers applying the same codes to the same units of data. Accuracy involves comparing the coding of data to some standard that is deemed to correctly capture interpretations. While stability is limited by a single individual's conceptions and interpretations of the data, accuracy presupposes that there is a correct interpretation. Thus, reproducibility is the most commonly used type of reliability, which is often reported with quantitative inter-rater reliability (IRR) measures or through description of a consensus-making process between multiple researchers (Kenny, 1991; Krippendorff, 2004a; Garrison et al., 2006). This conceptualization of reliability may be especially useful in CER, as researchers must communicate their research that is rooted in subjectivist traditions with a disciplinary chemistry audience that is aligned with a more objectivist approach to the scientific process.
Goal of this review
It is necessary for CER, as a discipline, to examine issues of reliability as they pertain to both quantitative and qualitative education research traditions. Prior articles have reviewed the existing methods and standards for establishing reliability in quantitative CER studies (Arjoon et al., 2013; Komperda et al., 2018), where reliability is defined as the consistency of an instrument or measure when used with a population multiple times. Both studies found that a number of quantitative research articles that use an instrument do not report evidence of reliability and argue for a shift in how reliability evidence is reported (Arjoon et al., 2013; Komperda et al., 2018). There exists a gap of similar methodological reviews that provide an overview of how reliability is established in qualitative CER articles, though similar reviews exist for other disciplines (Hughes and Garrett, 1990; Riffe and Freitag, 1997; Lombard et al., 2002; Manganello and Blake, 2010). It is important to address this gap within CER, as the disciplinary traditions and areas of research inquiry shaping our field may have discipline-specific trends in how researchers approach reliability. This work addresses this gap in the literature by providing a review of the approaches for establishing reliability in qualitative CER.Qualitative research in the field of chemistry education provides a rich source of knowledge to both researchers and practitioners about how students learn chemistry, engage with various instructional tools and pedagogical interventions, and relate chemistry to their lives. Qualitative research designs most commonly include analysis of interviews (e.g., tasks and card sorts), observations (e.g., during laboratory activities or as students do group work), or artefacts (e.g., teaching documents or students’ work) (Bretz, 2008). This wide range of research designs is applied to study highly diverse phenomena (e.g., students’ understanding of molecular-level interactions, the development of chemistry knowledge from novice to expert, or instructors’ pedagogical content knowledge for specific chemistry subject matter). With the range of research designs and areas of inquiry, it is important for researchers to clearly describe how they are analysing their data. Additionally, because the qualitative CER tradition provides important findings about how instructors and students engage with the teaching and learning of chemistry, it is of upmost importance for researchers to consider the reliability of their research and to describe how they are doing so in published studies (Phelps, 1994; Towns, 2013; Seery et al., 2019).
The primary goals of this methodological review are to describe whether and how chemistry education researchers have demonstrated reliability in qualitative research articles, and to consider how this informs the ways we report reliability in the future as a field. An ancillary goal of this article is to provide a resource for future chemistry education researchers regarding the considerations for determining and reporting reliability. As such, to supplement the review of the content analysis literature guiding our methodological review, we provide a primer for reporting reliability in Appendix 1. This primer outlines the various considerations for demonstrating reliability when developing and applying a qualitative coding scheme (i.e., unitization of data, the reliability subsample, and reliability methodologies).
To achieve our goals for this review, we establish the methods by which researchers demonstrate reliability when presenting qualitative research in publications from two CER journals, Chemistry Education Research and Practice (CERP) and the Journal of Chemical Education (JCE), over the past ten years. In line with our goals, the review focuses primarily on reliability and does not provide a thorough analysis of other methods for demonstrating trustworthiness. Through an analysis of research publications between 2010–2019, with an in-depth focus on more recent publications from 2017–2019, we identify whether authors discuss establishing reliability and how they describe doing so (e.g., what IRR measures they use). This article is intended to inform CER researchers about the ways that reliability can and has been demonstrated. Furthermore, this review has the goal of describing the reliability concerns chemistry educators should be aware of when reading qualitative research.
Establishing reliability
This review is guided by the definition of reliability in line with the more conventional approaches to demonstrating trustworthiness, whereby reliability is demonstrated by either describing a process involving two independent researchers who reach consensus for the application of codes or whose application of codes can be used to calculate and report measures of IRR (Kenny, 1991; Krippendorff, 2004a; Garrison et al., 2006). When it comes to demonstrating trustworthiness of a research project through identifying the reliability of a coding scheme, there are two main stages at which researchers should consider reliability: when developing a coding scheme and during the final application of the coding scheme.A number of articles have described best practices for establishing reliability during the coding process and for reporting reliability in qualitative studies (Lombard et al., 2002; Krippendorff, 2004a; Campbell et al., 2013; Hammer and Berland, 2014). Reliability measures are useful for both developing a coding scheme and applying a finalized scheme to a dataset. To facilitate developing a coding scheme that can be applied in a reliable manner, qualitative researchers offer a number of suggestions. Once researchers begin applying a coding scheme, it is recommended that they take an iterative approach of coding, discussing discrepancies, and refining or revising codes and their definitions to increase the consistency with which codes are applied (Campbell et al., 2013; Miles et al., 2014). This may also entail dropping or combining unreliable codes, but not to the point that the coding scheme loses its ability to capture the themes of interest for the research. During this development process, researchers can use reliability measures as an indication of if and how their coding scheme should be revised (Campbell et al., 2013; Hammer and Berland, 2014). Furthermore, determining reliability measures during the coding scheme development process has the additional benefit of requiring researchers to sufficiently define codes so they can be applied similarly by another researcher. This lends itself to negotiations about whether the codes are accurately capturing the data as intended in a way that supports the analysis, serving to ultimately produce more reliable results (Hammer and Berland, 2014).
Beyond using reliability measures in the process of developing a coding scheme, researchers also calculate reliability measures to provide an indication of the reliability of a finalized coding scheme as it has been applied to the data (Krippendorff, 2004b). Researchers may decide to calculate a reliability measure for a percentage of the dataset—where coding 10–20% of the dataset is recommended—followed by a single researcher coding the remaining data, or they may decide to have multiple researchers code the entire dataset followed by resolving any discrepancies through consensus (Campbell et al., 2013; Neuendorf, 2017). To make this decision, it can be helpful for researchers to consider the reliability of the coding scheme. Specifically, if a coding scheme can be applied such that a high measure of IRR is obtained, there is merit for a single researcher to then apply the scheme to the full data set (Dunn, 1989; Campbell et al., 2013). However, if the researchers struggle to obtain an acceptable value of IRR, Campbell, et al. (2013) argue that it can be followed by each researcher coding the entire data set, then comparing their coding and resolving as many discrepancies as possible. The researchers should then provide a value indicating the inter-rater agreement. An alternative approach is coding by negotiated agreement, where researchers first independently code the data then meet to discuss the codes and decide the final application of the coding scheme for the entire dataset (Garrison et al., 2006). Determining the appropriate method to demonstrate reliability is important and depends to a certain extent on the data itself. For example, pursuing a high measure of reliability for complex data, such as semi-structured interviews, can lead to loss of validity as researchers attempt to simplify the coding scheme or avoid codes that require more interpretation (Krippendorff, 2004c; Campbell et al., 2013; Neuendorf, 2017). Thus, in such cases where the coding scheme is complex and more interpretation is required, utilizing inter-rater agreement or a consensus coding method may be merited (Garrison et al., 2006; Campbell et al., 2013).
After determining an approach to demonstrate reliability, researchers must consider the unitization of data and, if using a measurement to indicate reliability as opposed to negotiated agreement, select a measure appropriate for their coding process. Common measurements used for indicating reliability include percent agreement, correlation coefficients, and chance-corrected agreement coefficients (Neuendorf, 2017). Despite percent agreement being a popular measure, it has been critiqued for being inappropriate for describing reliability as it does not account for variation between coders or agreement due to chance (Lombard et al., 2002; Krippendorff, 2004a; Neuendorf, 2017). Correlation coefficients, such as Pearson's r and intraclass correlation coefficients (ICCs), account for the variation between coders. However, Pearson's r fails to account for actual agreement as it instead measures degree of linearity. As such, Pearson's r is suggested to be a less applicable correlation coefficient in comparison to ICCs (Neuendorf, 2017). Chance-corrected agreement coefficients, including the commonly-used Cohen's kappa and Krippendorff's alpha, adjust simple percent agreement calculations by considering the probability that researchers agree due to chance (Cohen, 1960; Krippendorff, 2004a). Hence, they are suggested to be the most applicable and accepted reliability measures (Krippendorff, 2004a; Neuendorf, 2017). More information about each of the common IRR measures, along with the concerns of unitizing data and determining the reliability subsample, is provided in Appendix 1. Within the appendix, we provide resources for how to calculate the various measures and describe the type of data they apply to, their limitations, and variations that have been developed for each. The guidelines for how to interpret each of the appropriate reliability measures are summarized in Table 1.
| Measure | Value | Interpretation | Extensions, variations, or alternatives |
|---|---|---|---|
| Intraclass correlation coefficients | 0.91–1.00 | Excellent | Lin's concordance correlation coefficient |
| 0.76–0.90 | Good | ||
| 0.51–0.75 | Moderate | ||
| 0.00–0.50 | Poor | ||
| Cohen's kappa | 0.91–1.00 | Almost perfect | Weighted kappa |
| 0.80–0.90 | Strong | Fleiss’ kappa and Light's kappa | |
| 0.60–0.79 | Moderate | Fuzzy kappa | |
| 0.40–0.59 | Weak | Gwet's AC1 | |
| 0.21–0.39 | Minimal | ||
| 0.00–0.20 | None | ||
| Krippendorff's alpha | 0.80–1.00 | Reliable value | N/A |
| 0.67–0.79 | Acceptable for tentative conclusions | ||
| 0.00–0.66 | Not acceptable | ||
Methods
This review encompasses articles submitted to the two established journals for publishing chemistry education research articles, CERP and JCE. We began selecting articles to include in the review by identifying and retrieving all potentially relevant articles published in these journals between 2010 and 2019, a range which provided a sufficiently large sample of articles for initial review. The criteria for retrieving articles at this stage was the inclusion of a qualitative research component. We retrieved both research articles and practice articles that included a qualitative evaluation. Due to the greater number and variety of contributions in JCE, only articles that were labelled as “Chemistry Education Research” or “Articles” by the journal were considered for retrieval. During this stage, 659 articles were retrieved and further selection criteria were developed.To narrow the scope of this review, we developed further selection criteria (see Fig. 1) to encompass only articles presented as qualitative or mixed methods chemistry education research. As such, articles that did not include information about study design and a qualitative research methodology were excluded from further analysis (N = 86). These included practice papers that primarily served to describe a pedagogical strategy or intervention that included students’ perceptions or experiences but, upon further examination, were deemed to not include a research-based evaluation. Articles that were removed at this stage also included chemistry education research articles that, upon closer examination, did not include a qualitative component. The remaining articles comprised those which included analysis of qualitative data sources (N = 573). The qualitative data sources represented in our sample included studies analysing semi-structured and think-aloud interviews, open-ended survey or exam questions, and drawn or written student artefacts, in alignment with the common types of qualitative data outlined by Bretz (2008). All of these articles were included in our analysis of whether reliability is being reported in CER articles. The subset of articles from 2017–2019 (N = 236) were subjected to more detailed evaluation guided by our analytical framework to address our second goal of understanding how reliability is reported in CER articles (Fig. 1). We conducted the more detailed analysis in reverse chronological order (i.e., starting with articles from 2019) and concluded the analysis when saturation was reached and we were no longer identifying additional trends in the data (Miles et al., 2014). As such, this second level of analysis focused on CER articles published in the last three years.
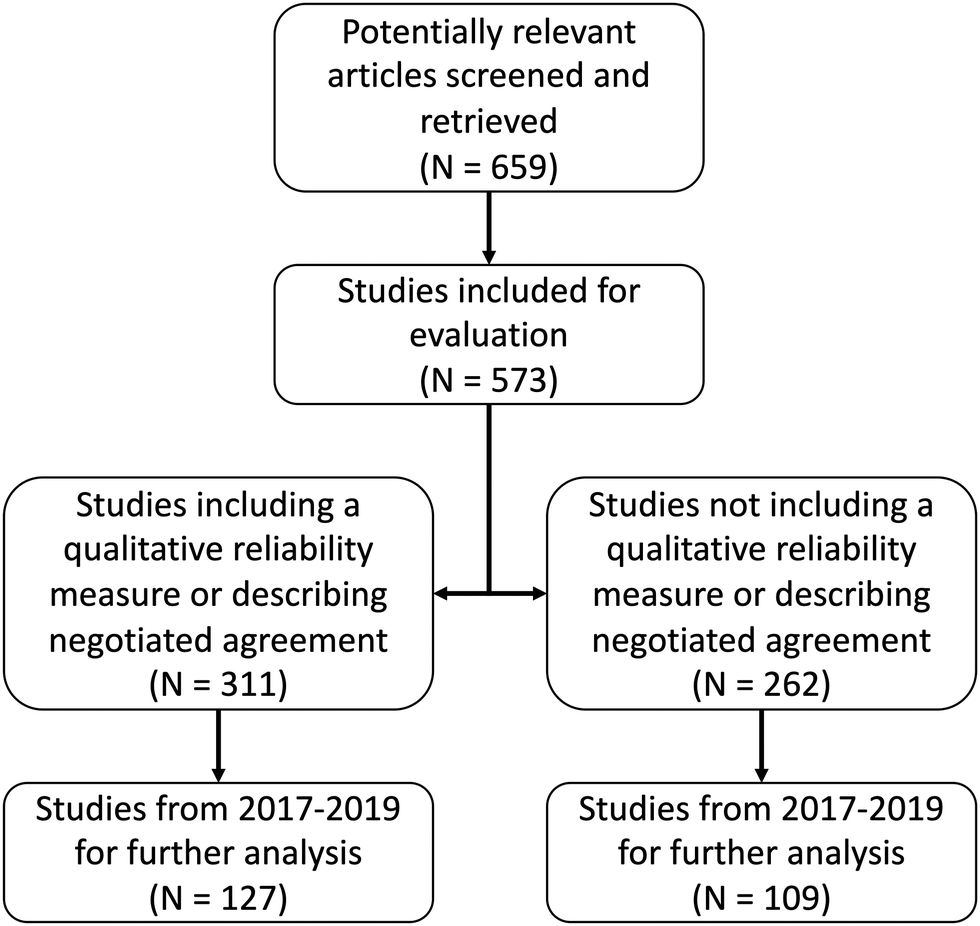 | ||
| Fig. 1 Overview of the article selection process. | ||
Analytical framework
Researchers have used a variety of ways to demonstrate reliability: specifically, researchers may appeal to the conventional approach by reporting a reliability measure and/or describing a negotiated agreement process, or they may appeal to a naturalistic approach by demonstrating Lincoln and Guba's (1985) trustworthiness criteria. As this review is focused on the former of these two approaches, we placed all articles from 2010–2019 that were still within our dataset (N = 573) into two categories which are in alignment with our review of the content analysis literature: (1) articles that included a reliability measure or described a negotiated agreement process (N = 311) and (2) articles that did not include qualitative reliability measures or descriptions of negotiated agreement (N = 262). For the articles which included a quantitative measure of qualitative reliability or described a negotiated agreement process (N = 311), we identified whether they contained a reliability measure, described complete consensus, or did both. For the articles from 2017–2019 that were subjected to further analysis (N = 127), we extracted additional pertinent information about the reported reliability procedures—specifically the type of measure reported and the reported values for each data source. Our analysis of the measures reported identified the common approaches for quantitatively reporting reliability as described in the content analysis literature: specifically, percent agreement, correlation coefficients, and chance-corrected agreement coefficients (Neuendorf, 2017). As outlined in Appendix 1, while not all of these measures are sufficient for demonstrating reliability, we characterized each to capture how researchers are reporting reliability in CER articles.For each article designated as not including qualitative reliability measures or descriptions of negotiated agreement (N = 262), we examined the portions of the methods section where developing and applying codes to the data was described. Within this section, we sought to identify mention of the terms “reliability” or “trustworthiness,” or descriptions of the researchers engaging in some process that could be viewed as establishing the reliability of their coding. This means that we did not necessarily identify articles using strategies such as triangulation or an inquiry audit to appeal to the trustworthiness criteria described by Lincoln and Guba (1985) unless these procedures were described as being done to establish trustworthiness or reliability of the coding process. We justify this decision because the focus of our analysis is trustworthiness as demonstrated through reliability. For the articles from 2017–2019 subjected to a more detailed analysis (N = 109), we extracted additional information about how reliability was mentioned and identified themes for how reliability was discussed (Braun and Clarke, 2006).
Statistical analysis
Trends in changes in the frequencies of the discussion of reliability across both categorizations of the articles were examined via chi-squared analysis performed using the software package Stata 15 (StatCorp, 2017). Specifically, differences in the approaches for demonstrating reliability between the time periods of 2010–2016 and 2017–2019 were examined. Statistical significance was set at α < 0.05.Reliability of the analysis for this review
We took a number of steps to ensure the reliability of our own analysis process. First, during the process of categorizing articles, we ensured the correct categorization of each article in two ways. During the initial categorization, the researchers alternated the years that they categorized (i.e., one author categorized odd years and the other categorized even years). For all the articles, each researcher then reviewed the categorization done by the other researcher to confirm the placement of each article. During the initial categorization process and the stage of confirming categories, if one of the researchers was unsure of the placement of an article or found the pertinent information to be extracted from an article ambiguous, they flagged the article for discussion. Through this process, each article we initially identified was examined at least twice and by both authors, thereby serving as consensus for its categorization. For extracting information, each article was assigned to one of the two researchers to identify and extract the aforementioned information pertaining to the description of reliability for the data analysis. If ambiguities arose, articles were flagged for discussion to ensure all relevant information was extracted. In addition, we also determined the reliability of our categorization using the appropriate IRR measures. We selected a randomized, stratified sample of 20% of the 2010–2019 data set for both authors to independently code. The sample was stratified to match the relative frequencies of articles by year in our full data set (e.g., 4% of our 20% reliability subsample were articles from 2010 because articles from 2010 made up 4% of the complete dataset). Both researchers coded each article for one of the five approaches: measure, consensus, both, mention, or no mention (Coding scheme – Appendix 2, Table 4). The IRR was calculated using percent agreement (79%), Cohen's kappa (0.72), and Krippendorff's alpha (0.72). These values indicate moderate agreement that is acceptable for tentative conclusions (Table 1). Our use of complete consensus additionally supports the reliability of our analysis.Results and discussion
Our review focuses on whether and how reliability is discussed in CER articles with a qualitative research component. We first present an overview of the ways that reliability is reported in articles from 2010–2019, followed by a more detailed description of the approaches described in articles from 2017–2019. Of the articles from 2017–2019, we first describe those that report a reliability measure or negotiated agreement. We then provide a thematic analysis of the articles which mention establishing reliability in some way but did not include an IRR measure or perform negotiated agreement. We intend for our analysis to serve as a description of how the CER community is presenting evidence of the reliability of their qualitative analysis in research articles and to provide considerations we should make concerning reliability as the field progresses. This can serve as a guide for researchers wishing to identify an appropriate mode for establishing reliability and how it should be presented in an article. Additionally, our analysis can help readers of CER who do not necessarily engage in research to understand the various reliability practices used within the field.Overview of the discussion of reliability in CER articles with a qualitative research component from 2010–2019
We identified 573 CER articles that contained qualitative data published in CERP and JCE between 2010–2019. For each, we examined whether reliability was described for the qualitative analyses and identified five approaches: (1) articles that reported a measure to quantify reliability, (2) articles that reported reaching complete consensus through negotiated agreement, (3) articles that reported both a reliability measure and reaching complete consensus through negotiated agreement, (4) articles that described or mentioned reliability in a different way, and (5) articles that had no discussion related to establishing reliability (Table 2 and Fig. 2). A third of the articles reported a reliability measure or measures in their discussion of how they treated the qualitative data sources (N = 181). Additional articles were categorized as containing a discussion of reaching complete consensus through negotiated agreement (N = 76) or reaching complete consensus on at least one complete source of qualitative data and reporting a reliability measure for the same or another qualitative data source (N = 54). The remaining articles included those with some description of the reliability of their analysis that did not incorporate IRR measures or a description of negotiated agreement (N = 85). Articles with an explicit discussion of trustworthiness were included in this group to more accurately capture the ways in which chemistry education researchers may think about treating qualitative data sources. The last set of articles, approximately a third of all articles included in the analysis (N = 177), did not contain any description about demonstrating or ensuring reliability in their qualitative data analysis.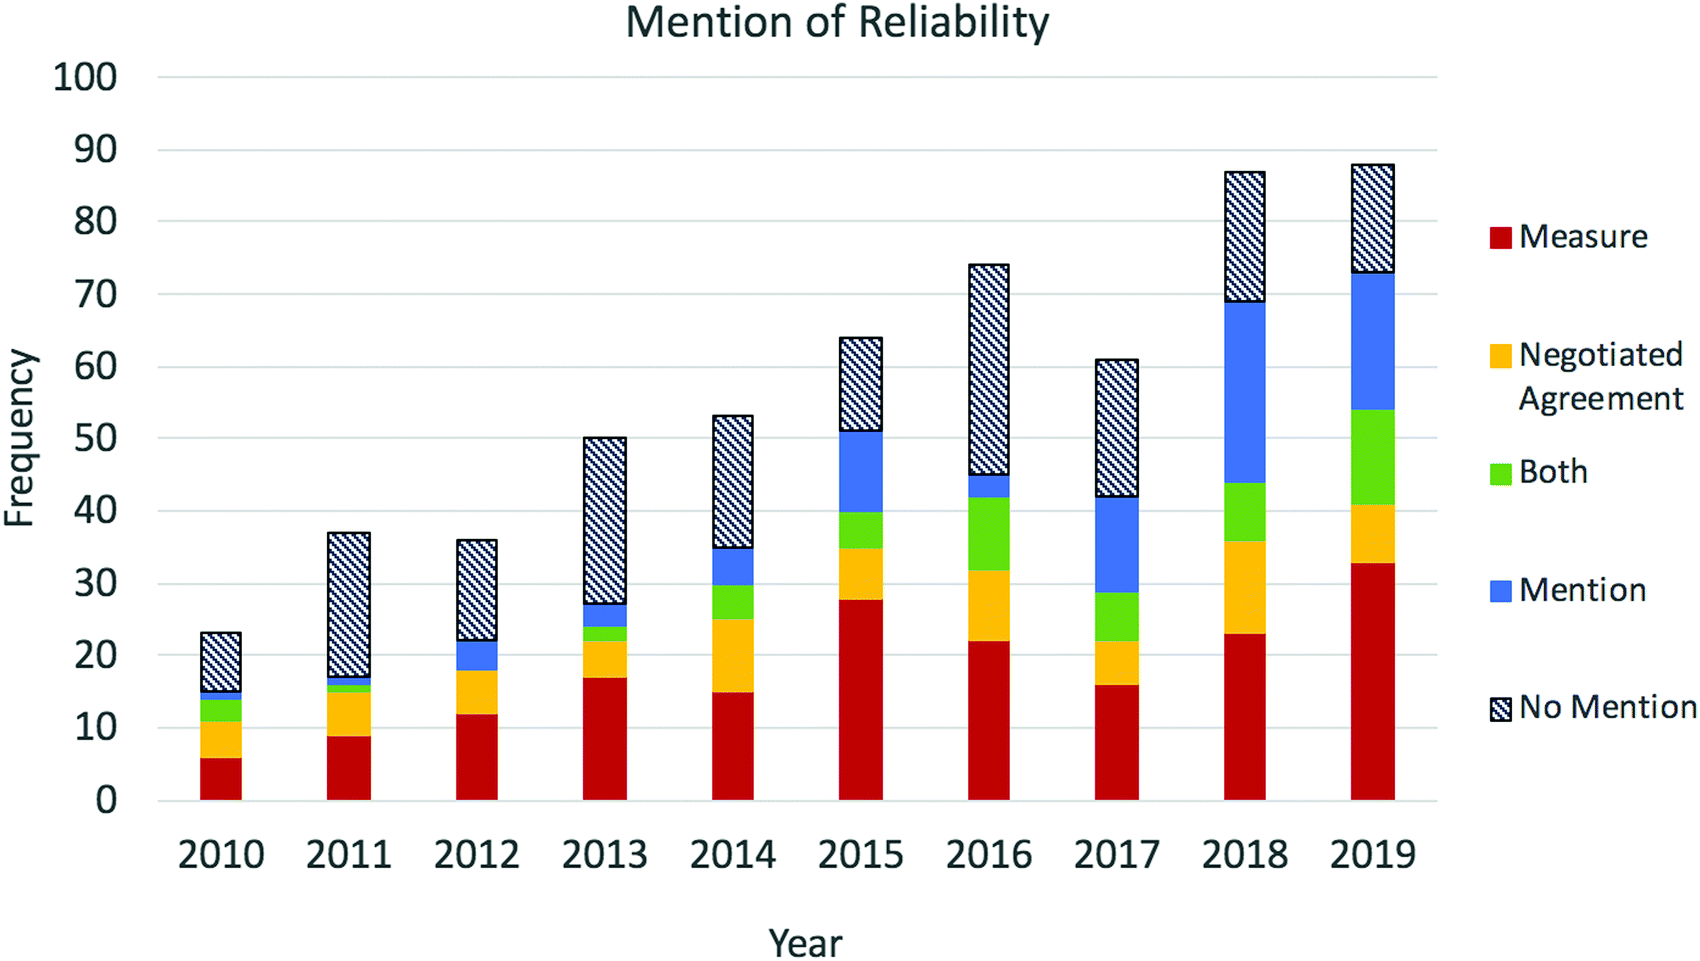 | ||
| Fig. 2 Discussion of reliability in CER articles containing qualitative data from 2010–2019 by year. Articles that explicitly discuss reliability are divided into three approaches: studies that included a reliability measure, studies that performed negotiated agreement for the complete set of qualitative data, or studies that both included a reliability measure and performed negotiated agreement. The remaining articles were categorized as either providing a mention of reliability or no mention of reliability. | ||
We also examined trends over time in whether and how reliability is presented. Of note, there appears to be a decrease in the fraction of articles that do not contain any discussion of reliability from 2010 to 2019 (Fig. 2). A chi-squared test comparing the number of articles assigned to each approach between 2017–2019 and 2010–2016 indicates that there is a statistically significant difference in the frequencies between the two time ranges across the five categories (chi-squared = 37.3656, p < 0.001). Exemplified by Table 2, this shift may align with an increase in the fraction of articles that we identified as containing some mention of reliability other than providing a measure or describing complete consensus and a corresponding decrease in the fraction of articles that did not contain any mention of reliability.
In-depth analysis of CER articles with a qualitative research component from 2017–2019
| Measure | Other measure | N | Mean | St. dev. | Min. | Med. | Max. |
|---|---|---|---|---|---|---|---|
| Consensus only | — | 37 | — | — | — | — | — |
| Percent agreement only | — | 44 | 0.91 | 0.07 | 0.70 | 0.92 | 1 |
| Percent agreement with another measure | Cohen's kappa | 10 | 0.92 | 0.04 | 0.85 | 0.91 | 1 |
| Krippendorff's alpha | 1 | 0.95 | — | — | — | — | |
| Percent agreement with another measure followed by consensus | Cohen's kappa | 2 | 0.97 | 0.04 | 0.94 | 0.97 | 1 |
| Krippendorff's alpha | 1 | 0.92 | — | — | — | — | |
| Percent agreement followed by consensus | — | 17 | 0.86 | 0.08 | 0.75 | 0.87 | 1 |
| Percent agreement (all) | — | 75 | 0.90 | 0.07 | 0.7 | 0.91 | 1 |
| Pearson's r | — | 1 | 0.99 | — | — | — | — |
| Intra-class correlation (ICC) | — | 4 | 0.87 | 0.08 | 0.75 | 0.90 | 0.92 |
| Cohen's kappa only | — | 20 | 0.87 | 0.11 | 0.50 | 0.90 | 0.99 |
| Cohen's kappa with another measure | Percent agreement | 10 | 0.82 | 0.06 | 0.74 | 0.80 | 0.90 |
| Cohen's kappa with another measure followed by consensus | Percent agreement | 2 | 0.69 | 0.37 | 0.43 | 0.69 | 0.95 |
| Cohen's kappa followed by consensus | — | 1 | 0.77 | — | — | — | — |
| Cohen's kappa (all) | — | 33 | 0.84 | 0.12 | 0.43 | 0.88 | 0.99 |
| Krippendorff's alpha only | — | 5 | 0.86 | 0.06 | 0.78 | 0.88 | 0.92 |
| Krippendorff's alpha with another measure | Percent agreement | 1 | 0.80 | — | — | — | — |
| Krippendorff's alpha with another measure followed by consensus | Percent agreement | 1 | 0.84 | — | — | — | — |
| Krippendorff's alpha (all) | — | 7 | 0.85 | 0.05 | 0.78 | 0.84 | 0.92 |
| Measure not specified | — | 3 | 0.94 | 0.03 | 0.91 | 0.94 | 0.97 |
| Measure not specified followed by consensus | — | 1 | 0.80 | — | — | — | — |
| Measure not specified (all) | — | 4 | 0.91 | 0.07 | 0.80 | 0.93 | 0.97 |
| No measure or consensus (in article that provides measure or consensus for another data source) | — | 21 | — | — | — | — | — |
| Total data sources | — | 182 | — | — | — | — | — |
Percent agreement was the most commonly reported reliability measure across the articles from 2017–2019 and the overall average percent agreement reported was 90% (Table 3). For 13 data sources, researchers described following the reliability process suggested by Campbell et al. (2013) but did not reach complete consensus at the inter-rater agreement stage. Researchers did report a percent agreement value followed by reaching complete consensus for 17 data sources, aligning with the process of negotiated agreement reported by Garrison et al. (2006) or the process of inter-rater agreement described by Campbell et al. (2013). Researchers reported percent agreement alongside a chance-corrected reliability measure (either Cohen's kappa or Krippendorff's alpha) in 14 data sources, and in three of these instances they also reported reaching consensus. The different percent agreement values reported for each combination with different IRR measures or negotiated agreement are presented in Table 3. The prevalence of researchers reporting percent agreement alone is to be noted, as percent agreement is often cited as being inappropriate for demonstrating the reliability of a coding scheme (Krippendorff, 2004a; Neuendorf, 2017). However, the number of data sources for which percent agreement is reported alongside another measure or in conjunction with researchers performing consensus may indicate that researchers are recognizing that percent agreement is not viewed as an acceptable stand-alone measure for indicating reliability (Krippendorff, 2004a; Neuendorf, 2017). Furthermore, this trend aligns with shifts in other fields (Hughes and Garrett, 1990; Lombard et al., 2002). The move away from percent agreement originates from its inability to account for variation in researchers’ application of codes or the possibility of agreement by chance (Krippendorff, 2004a; Neuendorf, 2017). Hence, percent agreement is not recommended for reporting IRR unless accompanied by an IRR measure (Neuendorf, 2017).
The second-most commonly reported measure of IRR was Cohen's kappa or a variation of the kappa statistic (Table 3). This aligns with reports in other disciplines, which also identify Cohen's kappa as the most commonly reported statistic for measuring reliability (Riffe and Freitag, 1997; Lombard et al., 2002; Manganello and Blake, 2010). The overall average reported kappa value of 0.84 (Table 3) falls within the range of “strong” agreement for interpreting kappa (Table 1). For 13 data sources, researchers also reported other approaches to demonstrate the reliability of their analysis (Table 3). It is a positive result that the second-most reported reliability measure is one that accounts for agreement by chance, as measures within this class are thought to best reflect reliability for content analysis. However, as the most commonly reported chance-corrected reliability measure within CER, it is worth noting that Cohen's kappa has many limitations—including that it only allows for two coders, one code per unit of analysis, and that it can produce values which do not accurately reflect agreement when there are skewed distributions of applied codes or when coders have similar distributions of applied codes (Gwet, 2002; Krippendorff, 2004a; Warrens, 2010; Neuendorf, 2017). There may be some movement to address these limitations within CER, as exemplified by a small number of researchers within the discipline utilizing extensions that overcome these limitations. Specifically, extensions of Cohen's kappa were reported for three data sources, with one each reporting Light's kappa, fuzzy kappa, and Gwet's AC1 metric. Light's kappa allows for multiple coders, while fuzzy kappa allows for multiple codes to be applied to a single unit of analysis (Light, 1971; Kirilenko and Stepchenkova, 2016). Gwet's AC1 metric accounts for the problems inherent in the calculation of kappa and provides values that more accurately reflect agreement (Gwet, 2002). That researchers are utilizing these measures may indicate a positive shift in the field towards using measures which allow for different types of coding procedures that align with the research goals and that better reflect the agreement between researchers.
Few researchers reported a Krippendorff's alpha, with the measure reported for seven data sources (Table 3). Researchers also reported other approaches to demonstrate reliability for two of the data sources (Table 3). The values reported for Krippendorff's alpha generally fell above Krippendorff's suggested 0.80 cut-off for taking the results as reliable, with an overall average of 0.85 (Table 1). That few researchers reported using Krippendorff's alpha aligns with similar findings in other disciplines, where Cohen's kappa is the more frequently utilized chance-corrected agreement measure (Riffe and Freitag, 1997; Lombard et al., 2002; Manganello and Blake, 2010). However, it may be beneficial for more researchers to begin using Krippendorff's alpha, as it does not have many of the limitations of Cohen's kappa and is thus more broadly applicable to a range of coding procedures to address a range of research questions. This is an important benefit, as CER draws on diverse qualitative data sources that can range from open-ended exam questions to interview data, each of which may be analysed in different ways (e.g., ordinal coding for exam responses, or nominal coding for interview responses). Specifically, Krippendorff's alpha is useful for nominal, ordinal, or interval data, and is suitable for situations with small samples of coded data, multiple raters, or incomplete data (Krippendorff, 2004a). Furthermore, in contrast to Cohen's kappa, Krippendorff's alpha is not limited in situations when researchers have similar or skewed distributions of codes (Gwet, 2002; Krippendorff, 2004a; Warrens, 2010; Neuendorf, 2017).
Researchers reported correlation coefficients relatively infrequently, with only descriptions of analysis of five data sources including a correlation coefficient value to describe agreement between researchers. For these data sources, one reported a Pearson's r coefficient, while the other four reported an ICC value. This average reported ICC value was 0.87 and falls within the interpretation of achieving “good” reliability (Table 1). The minimal number of researchers reporting Pearson's r is promising, as the literature indicates it is not necessarily an appropriate correlation coefficient for demonstrating reliability (Krippendorff, 2004a; Watson and Petrie, 2010). The inappropriateness of Pearson's r is specifically because it responds to differences in linearity as opposed to differences in agreement between two researchers (Krippendorff, 2004a; Watson and Petrie, 2010; Neuendorf, 2017). That the majority of researchers reporting a correlation coefficient are reporting an ICC value is notable, as this value is a more acceptable measure of IRR (Watson and Petrie, 2010; Neuendorf, 2017). ICCs and similarly calculated correlation coefficients are thought to be more appropriate because they account for covariation between researchers’ applications of codes in addition to identifying deviance from perfect agreement (Neuendorf, 2017).
The average reported values for ICCs and both of the chance-corrected agreement coefficients were relatively high, indicating the standards of reliability across CER articles that include these measures. It is important to note the relatively high variation among some of these reported values, as indicated by the standard deviations presented in Table 3, which indicates that data analyses with values below the highest ranges on the interpretation scales (e.g., values below the ranges of “almost perfect” and “strong” for Cohen's kappa) are being published. The reported values below the highest interpretation ranges are nevertheless acceptable for making tentative conclusions (Krippendorff, 2004a). Additionally, the lower values could be an artefact of the acknowledged limitations and paradoxes associated specifically with Cohen's kappa (Krippendorff, 2004a; Krippendorff, 2004b; Warrens, 2010; Neuendorf, 2017). Thus, if researchers do obtain lower reliability values, they should consider possible justifications or implications for the lower values, the strength of the claims they can make, whether another measure is more appropriate for their coding procedure, or if it would be appropriate or feasible to perform negotiated agreement on the full data set. Some, but not all, of the researchers reporting lower IRR values within the analysed articles did report taking these additional measures.
While the reported IRR measures are generally within acceptable ranges, it is important to emphasize that the data sources for which ICCs or chance-corrected agreement measures were reported only made up 24% (N = 44) of the data sources within articles for which a measure was reported—while simple percent agreement alone or describing a consensus-making process without providing a reliability measure was more common (45%, N = 81). These findings indicate that while, on average, good reliability is being demonstrated when an agreement measure is reported, there is a need for researchers to report the appropriate IRR measures in CER articles.
Another key finding is that 30% (N = 55) of data sources did not report an ICC or chance-corrected agreement coefficient but did describe coding using consensus or negotiated agreement (Table 3). This methodology is useful for reducing errors in the analysis or minimizing the subjectivity imposed by a single researcher and can be useful for complex data that may be difficult to code in a reliable fashion (Garrison et al., 2006). However, it has been criticized for not directly appealing to the notion of reliability (Krippendorff, 2004a). Thus, if researchers decide that the consensus method is appropriate for their situation, they should keep in mind the different viewpoints in the content analysis literature regarding whether or not it accounts for reliability.
We also identified 21 qualitative data sources for which neither a measure nor consensus were reported despite reliability being demonstrated for other data sources in the articles. While these were primarily secondary data sources, it is still recommended that researchers demonstrate reliability for all components of their analysis. Lastly, there were four instances where researchers reported a value but did not specify the measure, which makes it difficult for the reader to assess the level of reliability of the analysis. Hence, it is important for researchers to provide sufficient detail pertaining to the steps taken to establish reliability so readers can evaluate the appropriateness of the reported procedure for the presented analysis (Towns, 2013; Seery et al., 2019). When choosing to report a measure of IRR, this includes specifying how the data was unitized, the amount of data that was coded to demonstrate reliability, if a process of negotiated agreement was used in tandem with calculating reliability measures, and only reporting percent agreement in conjunction with another measure or complete consensus.
About a third of the articles in this category mentioned trustworthiness either exclusively or as part of their discussion of reliability (N = 30). These contained descriptions of the researchers engaging in elements of trustworthiness such as discussion within the research team as analysis was being performed, triangulation of the analysis across data sources, member checking, and discussion with an external researcher about the coding scheme or themes derived from the analysis. Triangulation and discussion within the research team were most commonly described and are both modes that Lincoln and Guba (1985) describe for establishing dependability, the construct which they align with reliability. However, the strongest method for establishing dependability, as argued by Lincoln and Guba (1985), is engaging an external researcher to perform an “inquiry audit” of the research process. While the descriptions of discussion with an external researcher do align with the idea of an inquiry audit, as described they are not as all-encompassing or thorough as the audit process recommended by Lincoln and Guba (1985). Thus, if researchers determine the naturalistic approach for demonstrating trustworthiness to be appropriate for their research, it is important for them to carefully consider the necessary steps for doing so.
Limitations
Our analysis focused primarily on how reliability was reported in CER articles that utilized qualitative data over the past ten years, with a detailed analysis of only the last three years. This limits our analysis, as we cannot make claims about how the use of specific IRR measures may have changed over the last ten years. Additionally, our analysis is limited by what authors chose to report in their articles. As such, we recognize that authors may have engaged in efforts to establish the reliability of their analysis without reporting it. In addition, we did not characterize the different data sources that authors used and thus did not capture differences in the reliability approaches by data source. However, we argue that irrespective of the data source, researchers should provide appropriate measures of reliability, a description of negotiated agreement, or appeal to the naturalistic inquiry approaches to demonstrate trustworthiness. Additionally, while we included articles that used the term “trustworthiness” in our analysis, we may not have captured articles that applied the trustworthiness criteria described by Lincoln and Guba (1985) without describing it using this term. As such, we cannot make larger claims about the role that the naturalistic principles of trustworthiness described by Lincoln and Guba (1985) play in qualitative CER.Conclusion and implications
This methodological review provides an indication of the past and current ways that researchers report establishing evidence of reliability in CER containing a qualitative component. As demonstrated by our analysis, there has been a shift towards incorporating a greater discussion of reliability in qualitative CER articles over the last ten years. This is a positive shift within the field. However, approximately a third of the articles analysed either do not discuss how they determined the reliability or trustworthiness of their analysis or do so to a limited extent. While this does not necessarily indicate that the research itself is not reliable, it can make it difficult for readers to evaluate for themselves the veracity of the researchers’ interpretations of the data.Our analysis does indicate a positive increase in the number of researchers providing measures of reliability or describing a process of negotiated agreement for the analysis of qualitative data. Furthermore, our detailed analysis of articles from 2017 through 2019 indicates that researchers are establishing reliability using a variety of IRR measures, including Cohen's kappa, Krippendorff's alpha, and ICCs. Despite the availability and use of a variety of IRR measures, however, many chemistry education researchers are reporting only simple percent agreement, a measure which is criticized by many researchers for not providing an accurate indication of reliability (Lombard et al., 2002; Krippendorff, 2004a; Neuendorf, 2017). While there is debate within the field of content analysis about the most appropriate measure for IRR, ICCs and the chance-corrected agreement coefficients—Cohen's kappa and Krippendorff's alpha—are generally accepted to be the most appropriate (Neuendorf, 2017). Researchers should thus carefully consider their coding process and the complexity of their data to determine whether using a measure or negotiated agreement process is more appropriate. If researchers choose to use a reliability measure, they should also consider the appropriate applications of each measure to determine which is most appropriate for their use and, if using Cohen's kappa, whether one of the variations is needed.
Of the articles that did not mention a reliability measure or engage in negotiated agreement for the full data set, only half mentioned considering the reliability or trustworthiness of their analysis. The majority of the articles that did contain some mention of these either described a process involving multiple researchers, triangulation, or discussing the coding with an external researcher. While engaging in these processes are beneficial for coding scheme development, researchers must determine whether engaging in and describing these processes is sufficient for establishing the reliability of their analysis. However researchers choose to establish reliability or trustworthiness—whether it be through calculating an IRR measure or describing the steps taken to determine reliability—it is key to consider if and how the chosen approach can influence the limitations of their research. This is important so practitioners and researchers can fully understand the approaches taken during data analysis to arrive at the results of a particular study.
It is also worth noting that, in our sample, the discussion of reliability was often difficult to identify, as exemplified by the IRR measures reported for our own analysis (79% agreement with Cohen's kappa of 0.72—indicating moderate agreement—and Krippendorff's alpha of 0.72—indicating agreement acceptable for tentative conclusions). Our approach of additionally engaging in negotiated agreement to reach complete consensus when analysing data for this review—an approach also present within articles in our data set—was hence useful for classifying ambiguous discussions of reliability. One implication of our moderate reliability values is that even a seemingly straightforward coding scheme can be difficult to apply and might warrant the use of consensus coding or negotiated agreement, especially when considering the complexity of data often analysed in CER. Additionally, our moderate agreement values indicate that the discussion of reliability within the articles included in our data set was not always clear or easy to identify. Relatedly, we note that in some articles it was ambiguous when researchers reported utilizing negotiated agreement during the coding process whether complete consensus was reached. As such, we suggest that details pertaining to reliability should be clearly discussed in the methods section of CER articles with clear indication of the specific IRR measures calculated, if any—which was not the case in all articles within our data set. As suggested in editorials for both CERP and JCE (Towns, 2013; Seery et al., 2019), incorporating clear demonstration of the steps taken to establish the reliability of qualitative analyses in CER will ultimately serve to strengthen the rigor of the field so both researchers and practitioners can make better sense of the ways they can incorporate key findings and results into their own future research or instructional practice.
Conflicts of interest
There are no conflicts to declare.Appendix
Appendix 1. A primer on considerations for reporting reliability measures.
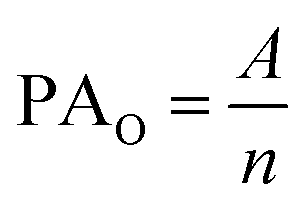
This appendix includes details to guide researchers when determining how to report reliability measures for qualitative analysis. First, we provide an overview of unitization and determining the reliability subset, important considerations as researchers begin coding their data. This is followed by a description of the commonly used measures to quantify reliability—namely percent agreement, correlation coefficients, and chance-corrected agreement measures. For each potential measure, we provide details for how to appropriately use and calculate the measure, its limitations, and its extensions. Finally, we describe negotiated agreement, another commonly used approach for demonstrating reliability.where PAO is the proportion of observed agreement, A is number of units where researchers agreed on the code, and n is the total number of units coded (Neuendorf, 2017). It ranges from 0.00 (complete disagreement) to 1.00 (complete agreement). Percent agreement is the most commonly used measure of IRR in CER, yet it is not considered an appropriate measure of reliability when presented alone (Krippendorff, 2004a; Neuendorf, 2017). While often simple to determine, it can be challenging to calculate in situations where researchers choose to apply more than one code per unit of analysis, when researchers do not both code the same units, or when more than two researchers are involved in the coding process. Furthermore, there are limitations in that it is typically useful only for nominal coding (Neuendorf, 2017). Holsti developed guidelines for handling situations where two researchers have not analysed the same units of analysis, termed Holsti's method (Holsti, 1969; Neuendorf, 2017). However, there is little guidance for calculating percent agreement in other situations, such as when multiple researchers are involved (Krippendorff, 2004a).
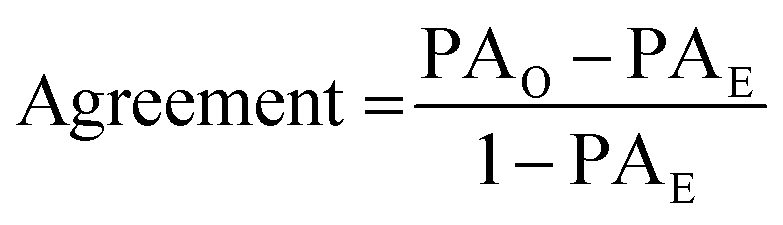
where PAO is the proportion of observed agreement and PAE is the proportion of agreement expected by chance (Neuendorf, 2017). There are a number of chance-corrected agreement coefficients, which differ in terms of how they calculate the proportion of agreement expected by chance. Some of the most common coefficients of this type include Scott's pi, Cohen's kappa, and Krippendorff's alpha (Scott, 1955; Cohen, 1960; Krippendorff, 2004a). Scott's pi, one of the earliest described measures, takes into account the joint distribution of applied codes to calculate the expected agreement (Scott, 1955). It has generally been replaced in practice by Cohen's kappa, Krippendorff's alpha, and modifications of kappa (Neuendorf, 2017).
Cohen's kappa. Cohen's kappa is a chance-corrected reliability measure that was developed to account for differences in researchers’ distributions of applied codes. It is one of the most commonly used measures of agreement for content analysis (Neuendorf, 2017). Procedures and examples for calculating Cohen's kappa can be found in Cohen's “A coefficient of agreement for nominal scales” (1960). It has various limitations: specifically, it is limited to nominal coding, allows for only two researchers, and requires researchers to assign one code per unit of analysis. However, extensions of Cohen's kappa have been developed to overcome these limitations: weighted kappa allows for ratio or interval coding, Fleiss’ kappa and Light's kappa each allow for more than two researchers, and fuzzy kappa allows for multiple codes to be applied to each unit of analysis (Cohen, 1968; Fleiss, 1971; Light, 1971; Kirilenko and Stepchenkova, 2016). Kappa and its modifications give values that range from −1.00 to 1.00, where zero indicates that the observed agreement is equal to chance, negative values indicate observed agreement less than expected by chance, and positive values indicate agreement beyond chance. Despite its popularity, there is debate over the appropriateness of kappa because of its inability to handle situations with largely skewed distributions of codes—e.g., one code appearing much more frequently than another (Gwet, 2002; Krippendorff, 2004a; Neuendorf, 2017). Furthermore, kappa has been shown to paradoxically penalize researchers with similar distributions of applied codes (Krippendorff, 2004a; Warrens, 2010; Neuendorf, 2017). To address these problems that lead to kappa values which do not accurately reflect agreement, Gwet (2002) has developed Gwet's AC1 metric as a modification to Cohen's kappa that is not affected by skewed distributions of codes. The commonly accepted interpretations for kappa values, and for the various measures derived from kappa, are provided in Table 1.
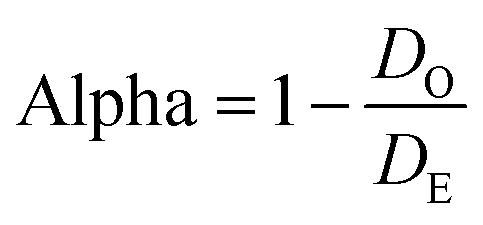
Krippendorff's alpha. Krippendorff's alpha is another commonly used chance-corrected reliability measure that avoids many of the limitations described for Cohen's kappa. Krippendorff's alpha can be used for nominal, ordinal, and interval coding. Krippendorff (2004b) also states that alpha is suitable for small reliability sample sizes, a consideration not addressed in descriptions of other measures. It is often calculated with the conceptual formula
where DO is observed disagreement and DE is expected disagreement (Krippendorff, 2004a). This formula is identical to the conceptual formula for Scott's pi and Cohen's kappa, written in terms of disagreements rather than agreement. Details for calculating alpha for various situations (e.g., more than two raters, different data types, or incomplete data) are described in Krippendorff's “Computing Krippendorff's Alpha-Reliability” (2011). Similarly to kappa, alpha ranges from −1.00 to 1.00, with positive values indicating agreement beyond chance. Krippendorff's suggestions for interpreting alpha are described in Table 1.
Appendix 2. Coding scheme
| Code | Definition |
|---|---|
| Measure | The article contains a description of the specific reliability measure used to determine IRR and provides the corresponding values. |
| Negotiated agreement | The article contains a description of researchers engaging in the process of negotiated agreement for the full set of data being analyzed. |
| Measure and negotiated agreement | The article contains a description of both a reliability measure and researchers engaging in negotiated agreement. This can be for the same data source or different sources of data in the same article. |
| Mention | The article contains a description of using some method to ascertain the reliability or trustworthiness of the analysis other than using a reliability measure or engaging in negotiated agreement for the full data set. |
| No mention | The article contains no description of reliability or trustworthiness. |
Acknowledgements
This material is based upon work supported by the National Science Foundation Graduate Research Fellowship Program under Grant No. DGE 1256260. The authors would additionally like to thank Ginger Shultz for discussions pertaining to the preparation of this manuscript.References
- Arjoon J. A., Xu X. and Lewis J. E., (2013), Understanding the State of the Art for Measurement in Chemistry Education Research: Examining the Psychometric Evidence, J. Chem. Educ., 90, 536–545.
- Armstrong D., Gosling A., Weinman J. and Marteau T., (1997), The place of inter-rater reliability in qualitative research: An empirical study, Sociology, 31, 597–606.
- Braun V. and Clarke V., (2006), Using thematic analysis in psychology, Qualitative Res. Psychol., 3, 77–101.
- Bretz S. L., (2008), Nuts and Bolts of Chemical Education Research American Chemical Society, ch. 7, vol. 976, pp. 79–99.
- Campbell J. L., Quincy C., Osserman J. and Pedersen O. K., (2013), Coding In-depth Semistructured Interviews: Problems of Unitization and Intercoder Reliability and Agreement, Sociological Methods & Res., 42, 294–320.
- Cohen J., (1960), A Coefficient of Agreement for Nominal Scales, Educ. Psychol. Meas., 20, 37–46.
- Cohen J., (1968), Weighted kappa: Nominal scale agreement provision for scaled disagreement or partial credit, Psychol. Bull., 70, 213–220.
- Creswell J. W. and Creswell J. D., (2017), Research design: Qualitative, quantitative, and mixed methods approaches, Sage publications.
- Dunn G., (1989), Design and analysis of reliability studies: The statistical evaluation of measurement errors, London, England: Edward Arnold Publishers, pp. viii, 198–viii, 198.
- Fleiss J. L., (1971), Measuring nominal scale agreement among many raters, Psychol. Bull., 76, 378–382.
- Garrison D. R., Cleveland-Innes M., Koole M. and Kappelman J., (2006), Revisiting methodological issues in transcript analysis: Negotiated coding and reliability, Internet Higher Educ., 9, 1–8.
- Gibbs G. R., (2007), Analyzing Qualitative Data, London, England: SAGE Publications, Ltd, pp. 90–104.
- Gwet K., (2002), Kappa Statistic is not Satisfactory for Assessing the Extent of Agreement Between Raters, Statistical Methods for Inter-rater Reliability Assessment, 1, 1–6.
- Hallgren K. A., (2012), Computing Inter-Rater Reliability for Observational Data: An Overview and Tutorial, Tutorials Quant. Methods Psychol., 8, 23–34.
- Hammer D. and Berland L. K., (2014), Confusing Claims for Data: A Critique of Common Practices for Presenting Qualitative Research on Learning, J. Learn. Sci., 23, 37–46.
- Holsti O. R., (1969), Content analysis for the social sciences and humanities, Reading, Mass.: Addison-Wesley Pub. Co.
- Hughes M. A. and Garrett D. E., (1990), Intercoder Reliability Estimation Approaches in Marketing: A Generalizability Theory Framework for Quantitative Data, J. Mark. Res., 27, 185–195.
- Kenny D. A., (1991), A general model of consensus and accuracy in interpersonal perception, Psychol. Rev., 98, 155–163.
- Kirilenko A. P. and Stepchenkova S., (2016), Inter-Coder Agreement in One-to-Many Classification: Fuzzy Kappa, PLoS One, 11, e0149787.
- Komperda R., Pentecost T. C. and Barbera J., (2018), Moving beyond Alpha: A Primer on Alternative Sources of Single-Administration Reliability Evidence for Quantitative Chemistry Education Research, J. Chem. Educ., 95, 1477–1491.
- Koo T. K. and Li M. Y., (2016), A Guideline of Selecting and Reporting Intraclass Correlation Coefficients for Reliability Research, J. Chiropractic Med., 15, 155–163.
- Krippendorff K., (2004a), Reliability in Content Analysis: Some Common Misconceptions and Recommendations, Hum. Commun. Res., 30, 411–433.
- Krippendorff K., (2004b), Content analysis: an introduction to its methodology, 2nd edn, Thousand Oaks, California: Sage, ch. 11.
- Krippendorff K., (2004c), Content analysis: an introduction to its methodology, 2nd edn, Thousand Oaks, California: Sage, ch. 5.
- Krippendorff K., (2011), Computing Krippendorff's alpha-reliability.
- Light R. J., (1971), Measures of response agreement for qualitative data: Some generalizations and alternatives, Psychol. Bull., 76, 365–377.
- Lincoln Y. S. and Guba E. G., (1985), Naturalistic inquiry, Beverly Hills, California: Sage Publications, p. 416.
- Lombard M., Snyder-Duch J. and Bracken C. C., (2002), Content Analysis in Mass Communication: Assessment and Reporting of Intercoder Reliability, Hum. Commun. Res., 28, 587–604.
- Manganello J. and Blake N., (2010), A Study of Quantitative Content Analysis of Health Messages in U.S. Media From 1985 to 2005, Health Commun., 25, 387–396.
- McHugh M. L., (2012), Interrater reliability: the kappa statistic, Biochem. Med., 22, 276.
- Miles M. B., Huberman A. M. and Saldana J., (2014), Qualitative Data Analysis: A Methods Sourcebook, Thousand Oaks, Califorinia: SAGE Publications, ch. 4.
- Neuendorf K. A., (2017), The Content Analysis Guidebook, 2nd edn, Thousand Oaks, California: SAGE Publications, Inc.
- Phelps A. J., (1994), Qualitative Methodologies in Chemical Education Research: Challenging Comfortable Paradigms, J. Chem. Educ., 71, 191.
- Potter W. J. and Levine-Donnerstein D., (1999), Rethinking validity and reliability in content analysis, J. Appl. Commun. Res., 27, 258–284.
- Riffe D. and Freitag A., (1997), A Content Analysis of Content Analyses: Twenty-Five Years of Journalism Quarterly, J. Mass Commun. Quart., 74, 873–882.
- Scott W. A., (1955), Reliability of content analysis: the case of nominal scale coding, Public Opin. Quart., 19, 321–325.
- Seery M. K., Kahveci A., Lawrie G. A. and Lewis S. E., (2019), Evaluating articles submitted for publication in Chemistry Education Research and Practice, Chem. Educ. Res. Pract., 20, 335–339.
- StatCorp, (2017), Stata Statistical Software: Release 15.
- Towns M. H., (2013), New Guidelines for Chemistry Education Research Manuscripts and Future Directions of the Field, J. Chem. Educ., 90, 1107–1108.
- Warrens M. J., (2010), A Formal Proof of a Paradox Associated with Cohen's Kappa, J. Classif., 27, 322–332.
- Watson P. F. and Petrie A., (2010), Method agreement analysis: a review of correct methodology, Theriogenology, 73, 1167–1179.
Footnote |
| † Both authors contributed equally to this work. |
| This journal is © The Royal Society of Chemistry 2021 |