
Visualizing chemistry teachers’ enacted assessment design practices to better understand barriers to “best practices”
Adam G. L.
Schafer
 ,
Victoria M.
Borland
and
Ellen J.
Yezierski
*
,
Victoria M.
Borland
and
Ellen J.
Yezierski
*
Department of Chemistry and Biochemistry, Miami University, Oxford, Ohio 45056, USA. E-mail: yeziere@miamioh.edu
First published on 1st February 2021
Abstract
Even when chemistry teachers’ beliefs about assessment design align with literature-cited best practices, barriers can prevent teachers from enacting those beliefs when developing day-to-day assessments. In this paper, the relationship between high school chemistry teachers’ self-generated “best practices” for developing formative assessments and the assessments they implement in their courses are examined. Results from a detailed evaluation of several high school chemistry formative assessments, learning goals, and learning activities reveal that assessment items are often developed to require well-articulated tasks but lack either alignment regarding representational level or employ only one representational level for nearly all assessment items. Implications for the development of a chemistry-specific method for evaluating alignment are presented as well as implications for high school chemistry assessment design.
Assessment is a complex process involving several interrelated decisions that impact a teacher's ability to draw inferences about the teaching and learning process. Several literature resources are available to high school teachers to assist with the complex decisions that go into designing assessments and evaluating assessment quality (Bell and Cowie, 2001; Martone and Sireci, 2009; Towndrow et al., 2010; Ruiz-Primo et al., 2012; Towns, 2014a; Harshman and Yezierski, 2017; Dini et al., 2020). Often, a teacher's personal goals for assessment design align well to the guidelines present in the literature (Sandlin et al., 2015; Schafer and Yezierski, 2020a). However, enacting personal goals and literature-suggested guidelines during assessment development can be difficult for high school chemistry teachers (Black and Wiliam, 1998; Mandinach et al., 2006; Sandlin et al., 2015). The barriers hindering enactment can cause misalignment between a teacher's goals and the assessments they generate. In this work, a “barrier” is defined as something preventing a teacher from enacting their personal goals. For example, a “barrier” could be a gap in knowledge, lack of awareness, or even a mismatch of resources. A better understanding of the relationship between chemistry teacher assessment goals and assessment products is necessary for helping teachers better design formative assessments.
Framework for study
Establishing goals is often considered the first step in initiating a cycle of formative assessment. Goals could be, for example, learning goals to describe expectations for student learning or even goals that establish practices the teacher will incorporate into formative assessment design. Essentially, the goals a teacher sets should guide the design of opportunities to collect evidence about the progress of student learning and the success of learning activities (Harshman and Yezierski, 2017). The evidence gathered can then inform new goals as teachers craft an instructional response, repeating the formative assessment cycle. This iterative formative assessment cycle has been given many names in the literature; here we are calling the iterative process data-driven inquiry (Harshman and Yezierski, 2017).The study described herein follows a cohort of high school chemistry teachers participating in a professional development designed to follow the process of data-driven inquiry (Fig. 1). The teachers started this professional development by generating a set of “best practices” for designing and interpreting formative assessments (Schafer and Yezierski, 2020a) before employing these “best practices” to guide the design of planned, formative assessments for their classrooms. Here, “best practices” are in quotations to reflect that these practices are the participating teachers’ proposed ideas about how to best design and interpret formative assessments, not necessarily evidence-based best practices from the literature, although the teacher-generated “best practices” were found to align with relevant literature for formative assessment design (Schafer and Yezierski, 2020a). This investigation uses the teacher-generated “best practices” to better understand the relationship between chemistry teacher assessment goals and design practices. Following data-driven inquiry, the “best practices” specified by the teachers should inform the design of formative assessments (i.e., the tools used to collect evidence) alongside any lesson-specific learning goals. What follows is a brief primer on formative assessments from the literature, a summary of the “best practices” generated by teachers in the earlier work (Schafer and Yezierski, 2020a), and literature that contextualizes and/or reinforces the high school chemistry teachers’ ideas.
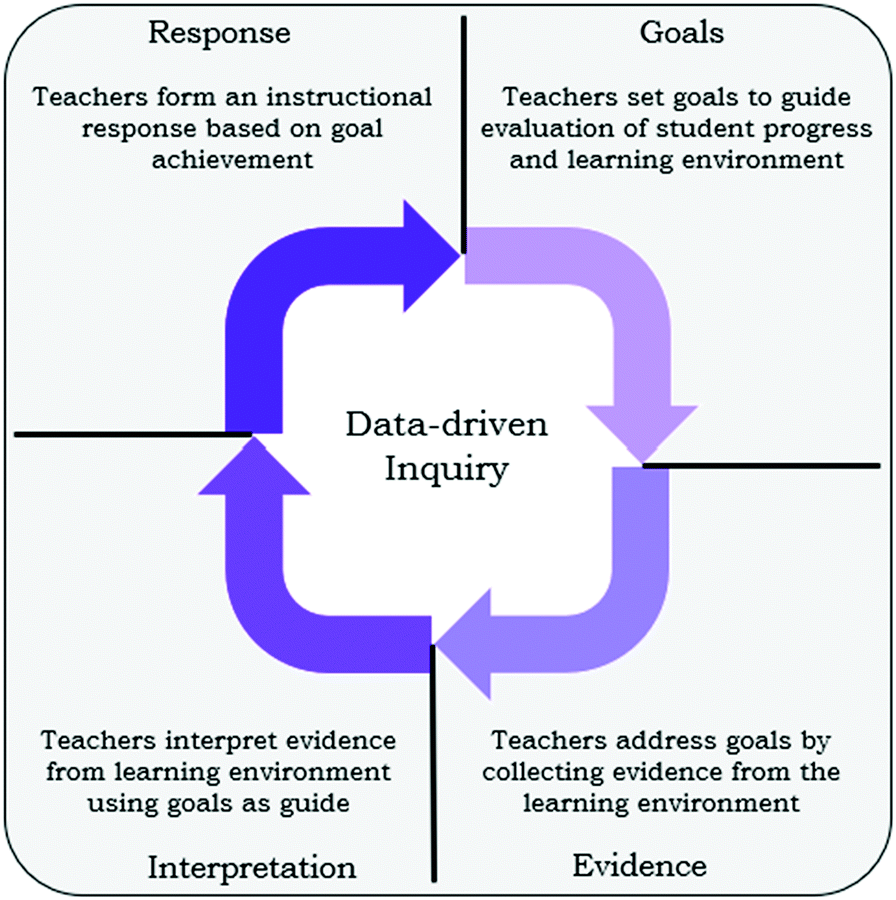 | ||
| Fig. 1 Data-driven inquiry cycle. | ||
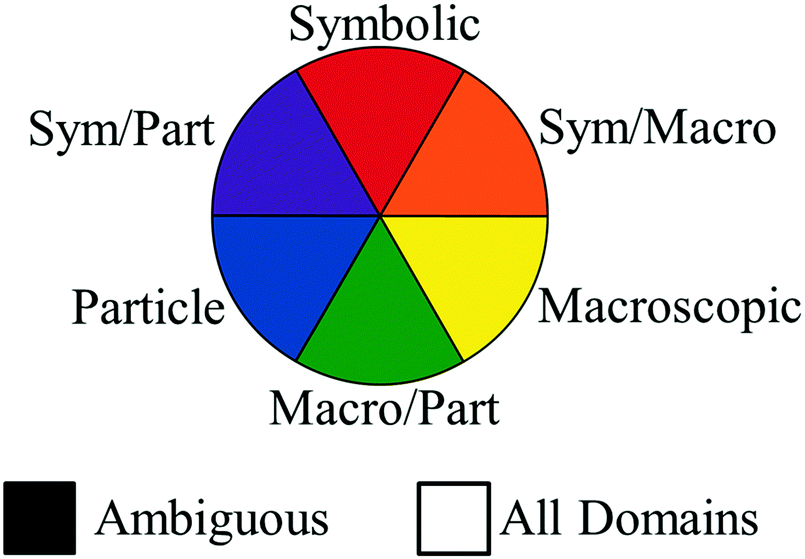 | ||
| Fig. 2 Representational level codes. | ||
Formative assessment best practices
Assessments that are used to inform continued instruction are considered formative assessments (Black and Wiliam, 1998; Irons, 2008; Clinchot et al., 2017). Formative assessments can range from spontaneous in-class questioning to planned quizzes. Planned, formative assessments allow the teacher to consider items that students will respond to in the future. When designing and evaluating the quality of planned, formative assessments, a teacher must enact a practical knowledge of the students and classroom alongside content knowledge to effectively generate an opportunity to judge student learning and the learning activity (Bell and Cowie, 2001; Remesal, 2011; American Chemical Society, 2012; DeLuca et al., 2018). How this knowledge is enacted by a teacher is informed by the beliefs they hold about assessment design. Arguably, a teacher will attempt to design assessment items in a way that agrees with what they believe to be the “best practices” to employ. A teacher's perception of what counts as a “best practice” is informed by several sources (e.g., peers, current literature, prior experiences, training, and content knowledge). However, many sources informing chemistry teachers’ perceptions of “best practices” create barriers for enacting beliefs about how an assessment should be designed by requiring a significant amount of interpretation by the teacher (Black and Wiliam, 1998). Although several studies propose best practices for assessment design, few have examined how literature-based practices that align with chemistry teachers’ personal assessment beliefs about best practices inform the decisions teachers make while generating planned, formative assessments.When Schafer and Yezierski (2020a) examined the discourse between a group of high school chemistry teachers generating a set of “best practices” for formative assessment design, they learned that the teachers collaboratively proposed and revised practices as critical friends (i.e., peers who were comfortable and had experiences collegially contributing to discourse and resolving disagreements) (Curry, 2008; Loughran and Brubaker, 2015; Schafer and Yezierski, 2020a). Among the teachers’ “best practices” were the considerations that an assessment should:
• articulate clearly what the student should do when responding to the assessment item,
• address a variety of conceptual and representational levels, and
• align assessment items to the instructional materials (e.g., learning goals).
Although this is not an exhaustive list of the “best practices” generated by the teachers, the stated practices represent those specific to barriers high school chemistry teachers may face when designing planned, formative assessments. The same chemistry teachers who generated the practices in the bulleted list from Schafer and Yezierski are the participants in the study described herein. While generating the “best practices”, teachers had multiple opportunities to contribute, revise, and remove practices before agreeing on a final draft. As such, the “best practices” represent consensus ideas from the participating teachers. Employing the “best practices” generated by these teachers presents a unique opportunity to examine the relationship between chemistry teacher beliefs and practices about planned, formative assessment design. Before investigating the relationship between the chemistry teacher's beliefs about best practices and the practices they enact when designing planned, formative assessments, each of the teacher-generated “best practices” are described in further detail.
Assessments should articulate clearly what the student should do when responding to the assessment item of a task
The teacher-generated “best practice” of using clear articulations of what the student should do matches guidelines proposed in educational literature (National Research Council, 1999, 2001, 2014; Bell and Cowie, 2001; Stiggins, 2001; Gibbs and Simpson, 2004; Dwyer, 2007; Lyon, 2011). What the student is required to do is often referred to as the “task” of an assessment item (McDonald, 1964; Hoffman and Medsker, 1983; Jonassen et al., 1999; Merrill, 2007; Tomanek et al., 2008). Establishing an appropriate task is a key process teachers undergo when designing or selecting planned, formative assessment items, and literature guidance provides teachers with specific considerations in how to productively design tasks for assessments (Bell and Cowie, 2001; Tomanek et al., 2008; Kang et al., 2016; Schafer and Yezierski, 2020b). For example, teachers may ask students to calculate a value, explain a relationship, or select an appropriate answer from a set of choices. In these examples, the tasks are to calculate, explain, and select, respectively. Numerous methods for evaluating assessment quality employ task as a criteria, further highlighting the importance of establishing a specific, expected action to be performed by the student when responding to the assessment item (Webb, 1997; Porter and Smithson, 2001; Rothman et al., 2002; Martone and Sireci, 2009). Any task designed into an assessment item is inevitably informed by a teacher's goals for a given formative assessment cycle (Harshman and Yezierski, 2017).Assessments should address a variety of conceptual and representational levels
The National Research Council encourages teachers to provide students with opportunities to perform tasks that go beyond simple recall (National Research Council, 2014). Teachers can move past recall of facts by requiring students to apply their conceptual knowledge. However, a common pitfall teachers face is to include mainly recall tasks during assessment, potentially resulting in inadequate information about student understanding (Stiggins, 2001; Towns, 2014b; Schafer and Yezierski, 2020a). When designing assessments, items incorporating recall tasks should not be perceived as “bad” formative assessment items, although including only recall items may limit the data available to inform continued instruction. Many sources agree that collecting data from a variety of tasks can help teachers better judge student understanding (Bell and Cowie, 2001; Gearhart et al., 2006; National Research Council, 2014). If possible, teachers should collect multiple measurements, since the additional data can provide the teacher and student with insights about student-specific challenges and knowledge gained (Black and Wiliam, 1998; Bell and Cowie, 2001; National Research Council, 2001; Stiggins, 2001; Cizek, 2009). Arguably, an appropriate task is one that corresponds to similar items in the instructional materials and fulfills the goal(s) of the assessment (Harshman and Yezierski, 2017).Assessing student knowledge within a variety of representational levels was a “best practice” generated by the chemistry teachers in the study by Schafer and Yezierski, but is not a commonly cited practice in domain-general literature (Schafer and Yezierski, 2020a). Establishing an appropriate representational level has been found as a practice chemistry teachers engage in when developing formative assessment items (Schafer and Yezierski, 2020b). Although some teachers explicitly focus on representational level when designing assessment items, several investigations have documented student difficulties navigating between different representational levels (Gabel et al., 1987; Nakhleh, 1992; Russell et al., 1997; Gkitzia et al., 2020). As such, literature guidance suggests carefully scaffolding the number of representational levels per item when the goal is to assess student knowledge and abilities about representational level (Taber, 2013).
While representational levels have been accepted within chemistry as important descriptors of chemical information, other disciplines likely do not have the same need for describing chemical phenomena (Johnstone, 1991; Taber, 2013; Vilardo et al., 2017). Inevitably, many assessment practices are domain-general, while others are more discipline specific (Coffey et al., 2011). Few investigations focus on the role representational level plays in conjunction with other assessment item components (such as task); however, better understanding as to how these components are developed in unison could improve understanding of chemistry teacher assessment design practices.
Assessments should align assessment items to the instructional materials
Alignment refers to the degree to which learning goals, learning activities, and assessments are in agreement and mutually support students in learning what they are expected to know and do (Tyler, 1949; Webb, 1997; Martone and Sireci, 2009), although there is some disagreement as to what “alignment” means in studies regarding current science standards (Fulmer et al., 2018). In their review of studies about aligning to the Next Generation Science Standards (NGSS), Fulmer et al. (2018) acknowledge that the two main questions regarding alignment involve (1) What aspect of the NGSS are being considered? and (2) How is alignment being judged? Addressing these questions presents challenges unique to the discipline of chemistry that require teachers receive chemistry-specific support and guidance for developing skills aligning assessment and instruction. Unfortunately, a review of chemistry education literature reveals that few chemistry-specific methods exist for evaluating the alignment of an assessment to instruction; however, alignment methods are prevalent within domain-general education literature (e.g., Porter and Smithson, 2001; Rothman et al., 2002; Webb and Herman, 2006; Martone and Sireci, 2009; Kaderavek et al., 2015; Fulmer et al., 2018; Young et al., 2019). One instrument high school chemistry teachers may consider when evaluating lesson alignment is the EQuIP Rubric for Lessons and Units: Science (Achieve, 2016). The EQuIP rubric evaluates lessons sequences and units for NGSS alignment using three domains: a three-dimensional design, instructional supports, and monitoring student progress (Achieve, 2016). The rubric is extensive in its descriptions for NGSS-alignment; however, the comprehensiveness of the rubric can be challenging to use, especially for teachers new to the rubric (Fulmer et al., 2018). In response to teachers’ struggles using the EQuIP rubric, Achieve released a reduced version of the rubric (Achieve, 2016), but the reduced version is not meant to be used as a complete evaluator and requires a follow-up with the full EQuIP. Overall, the lack of chemistry-specific guidelines and methods burdens high school chemistry teachers with translating domain-general practices to their own context or employing comprehensive instruments that can be challenging to apply.Since assessment and instruction do not exist in isolation, improvements in learning are dependent upon the quality of alignment among assessments, curriculum, and instruction (Bell and Cowie, 2001; National Research Council, 2001, 2014; Broman et al., 2015). However, criteria for alignment specific to the discipline of chemistry (such as representational level) can increase the difficulty of designing and implementing formative assessment tasks that are tightly aligned to instructional materials. The interrelatedness between assessment and instruction implies that teachers cannot make valid inferences from assessment data without alignment to instruction (Datnow et al., 2007; Hamilton et al., 2009; Sandlin et al., 2015; Harshman and Yezierski, 2017). Although several investigations recognize the importance of alignment, there is not a consensus on the number of aligned criteria necessary for adequate measurement of student competency. Typically, studies suggest that between six and eight observations of students performing a task is sufficient for a reliable measurement (Webb, 2006; Martone and Sireci, 2009; Praetorius et al., 2014; Briggs and Alzen, 2019). Although the study presented herein does not seek to confirm or refute these values, we recognize that teachers should consider how many items are necessary to evidence a given learning goal when designing a planned, formative assessment. Inevitably, what is considered a sufficient number of ways and instances of assessing a learning goal must be decided by the assessment designer based on the purpose of the assessment (Kane, 2006; Webb, 2006; American Educational Research Association et al., 2014; Harshman and Yezierski, 2017). Processes such as data-driven inquiry can support teachers’ considerations of alignment by establishing goals which inform the design of tools to collect evidence and the conclusions drawn from the evidence collected (Harshman and Yezierski, 2017). Better understanding the relationship between teachers’ perceived “best practices” (such as alignment to instruction) and the assessments they design is essential for helping teachers improve formative assessment design practices.
Research questions
The purpose of this study is to investigate the nature of the relationship between high school chemistry teachers’ perceptions of “best practices” for formative assessment and the planned, formative assessments generated for their classrooms. The research questions guiding this study are:(1) How can the tasks and representational levels of planned, formative assessment items be diagrammed to allow for comparison with corresponding instructional materials (i.e., learning goals and learning activities)?
(2) What is the nature of the relationship between teachers’ self-generated “best practices” for formative assessments and the assessments they generate?
Methods
To address the research questions, the assessments, learning activities, and learning goals of a group of high school chemistry teachers were collected. This research was approved by the university's Institutional Review Board as an investigation into the alignment between high school chemistry teachers’ practices and beliefs about assessment. All methods were in compliance with the university's policies on ethics. Informed consent was obtained for all participants prior to participation.Sample
Five teachers participated in a long-term professional development program focused on improving assessment practices during the Spring/Summer of 2018. As part of the professional development program, all teachers generated an assessment for an inquiry activity implemented in their own classrooms. However, one teacher was unable to complete the professional development and another decided to generate a summative assessment. As this investigation focuses on planned, formative assessments, these two teachers were removed from the study. Demographic information for the three teachers included in this study is presented in Table 1.Data sources
As part of the professional development, the chemistry teachers were asked to provide the planned, formative assessment for a lesson as well as any learning goals and learning activities associated to the lesson to serve as artifacts for the study described herein. In this study, an artifact is defined as a singular document, such as the learning goals, a learning activity, or an assessment instrument, whereas an item is any singular task requested or question asked of the student within an artifact. Further information about the implementation of the lesson can be found in the results. For this work, the learning goals are the student expectations set by the teachers at the beginning of the lesson. All teachers recorded the learning goals on the materials provided to the students at the beginning of the lesson. Learning activities are any instructional materials used by the teachers throughout the lesson. Claude and Emmerson separately implemented laboratory activities while Celine implemented a lab along with two group work activities.Artifact analysis
Following the process of data-driven inquiry, the “best practices” generated by the teachers represent goals for designing formative assessment items. Although other goals likely contributed to their assessment design, the “best practices” should be evident in the tools that teachers designed and implemented to collect evidence. As such, the “best practices” generated by the teachers were distilled into distinct analysis categories. The analysis categories synthesized were task (referring to the practice of “clearly articulate what the student should do”), representational level (referring to the practice of “address a variety of conceptual and representational levels”), and chemistry content (referring to the practice of “align assessment items to the instructional materials”). The synthesis of each of these analysis categories is presented in further detail below.| Task code | Example tasks |
|---|---|
| Retrieval | Identify, recognize, calculate, complete, apply, demonstrate |
| Explanation | Explain, summarize |
| Representation | Draw, use models, represent, show |
| Analysis | Sort, categorize, differentiate, assess, critique, evaluate, diagnose |
| Knowledge utilization | Test, how would you determine, generate and test |
| Representational level codea | Representational level descriptions |
|---|---|
| a Mixtures of representational level codes are possible and are written as the two representational levels present in the item (e.g., macroscopic/symbolic). | |
| Macroscopic | Representation of species/events on a visible scale to communicate chemical ideas/events/species |
| Symbolic | The use of descriptive words, symbols, or values to communicate chemical ideas/events/species |
| Particle-level | Representation of species/events on an invisible scale to communicate chemical ideas/events/species |
| Ambiguous | No representational level communicated |
It is essential to establish trustworthiness of coding for any qualitative investigation (Patton, 2002). As such, evidence of trustworthiness was established by addressing the credibility, dependability, and transferability of the findings. All investigators have previous experience teaching at the high school level and facilitating professional development for high school chemistry teachers, granting credibility to the codes generated. To establish evidence of dependability, interrater agreement was conducted as well as frequent debriefings. Interrater agreement of task and representational level codes was established by having two researchers independently code items from one learning activity. Code applications were compared, with an agreement of 79%. Disagreements in code application were negotiated, code descriptions were collaboratively revised, and the codes were reapplied to the data set once complete agreement was established. Codes for chemistry content were generated by an individual researcher and were independent for each group of artifacts. Once chemistry content codes were generated, the descriptions were shared with other members of the research team and collaboratively revised until agreement was reached. Debriefings between the authors were held weekly. In addition, monthly debriefings were held with several graduate students and another chemistry education research faculty member who were not involved in the data collection. Transferability of the findings presented are limited but carefully defined; as a small group of high school chemistry teachers with several years of professional development. More generally, findings have the capacity to generate discussion and avenues for future studies as well as guidance for high school chemistry teachers and education researchers.
Assessment items were compared to items in the corresponding learning activity and learning goal to investigate for code co-occurrence. This comparison was facilitated through the use of a novel diagram called an “alignment plot.” These alignment plots illustrated each of the codes applied to the items within teacher artifacts. For this work, alignment is defined as the presence of code co-occurrence among all artifacts with regard to task and/or representation level within a particular chemistry content category. The alignment plots served to visualize the teachers’ enacted practices when designing planned, formative assessments. By organizing the features of the artifacts in the alignment plot, we were able to characterize how teachers designed their assessments as compared to how they thought assessments should be designed.
Results and discussion
Overall code occurrences
The first research question seeks to establish a means of diagramming teacher artifacts to illustrate how teachers enact their “best practices” during assessment design. To address this research question, a table quantifying the tasks and representational levels of all the items present in teacher artifacts was generated. The table helps to reveal code occurrence across learning goals, assessment items, and learning activity items.Table 4 communicates the total number of items that include each task, representational level, and chemistry content topic for Claude's artifacts. The learning goals for Claude's lesson were that the student would be able to:
| Category | Code | Learning goals | Assessment | Learning activity | Total |
|---|---|---|---|---|---|
| Task | Retrieval | 1 | 13 | 22 | 26 |
| Explanation | — | 1 | 13 | 14 | |
| Representation | 1 | 2 | 5 | 8 | |
| Analysis | 1 | — | 2 | 3 | |
| Knowledge utilization | — | — | — | 0 | |
| Representational level | Symbolic | 1 | 14 | 26 | 41 |
| Symbolic/particle | — | — | — | 0 | |
| Particle | 1 | 1 | 3 | 5 | |
| Particle/macroscopic | — | — | — | 0 | |
| Macroscopic | — | 1 | 11 | 12 | |
| Macroscopic/symbolic | — | — | 1 | 1 | |
| Ambiguous | 1 | — | 1 | 2 | |
| Chemistry content | Static chemical system | 3 | 7 | 28 | 38 |
| Chemical phenomena | — | 4 | 7 | 11 | |
| Electron count and movement | — | 5 | 2 | 7 | |
| Observations | — | — | 4 | 4 | |
| All content areas | — | — | 1 | 1 | |
| Total | 3 | 16 | 42 | ||
1. Identify a redox reaction based on symbolic representations.
2. Represent particulate level representations of redox reactions.
3. Predict products of redox reactions.
Claude generated one assessment and one learning activity to address these learning goals. Students in Claude's classes were provided one day to complete the learning activity, taking the assessment the following day.
Claude's artifacts addressed three chemistry topics within oxidation and reduction reactions with an additional code for items that call for in-lab observations. One item in Claude's learning activity asked students to summarize what happens during a redox reaction. This item addressed all content codes and thus was given its own content code (shown in Table 4 as “All Content Areas”). Example items from Claude's artifacts are shown in Fig. 3. The tasks articulated in Claude's items were mainly retrieval (26 total) with fewer explanation (14 total), representation (8 total), and analysis (3 total) tasks. Additionally, Claude's artifacts addressed a variety of representational levels; however, the symbolic representational level was emphasized much more than others with 41 items out of 61 total. The items in Claude's artifacts meet the self-imposed requirements of articulating specific tasks to complete while also incorporating a variety of conceptual and representational levels, although the symbolic representational level was disproportionately emphasized.
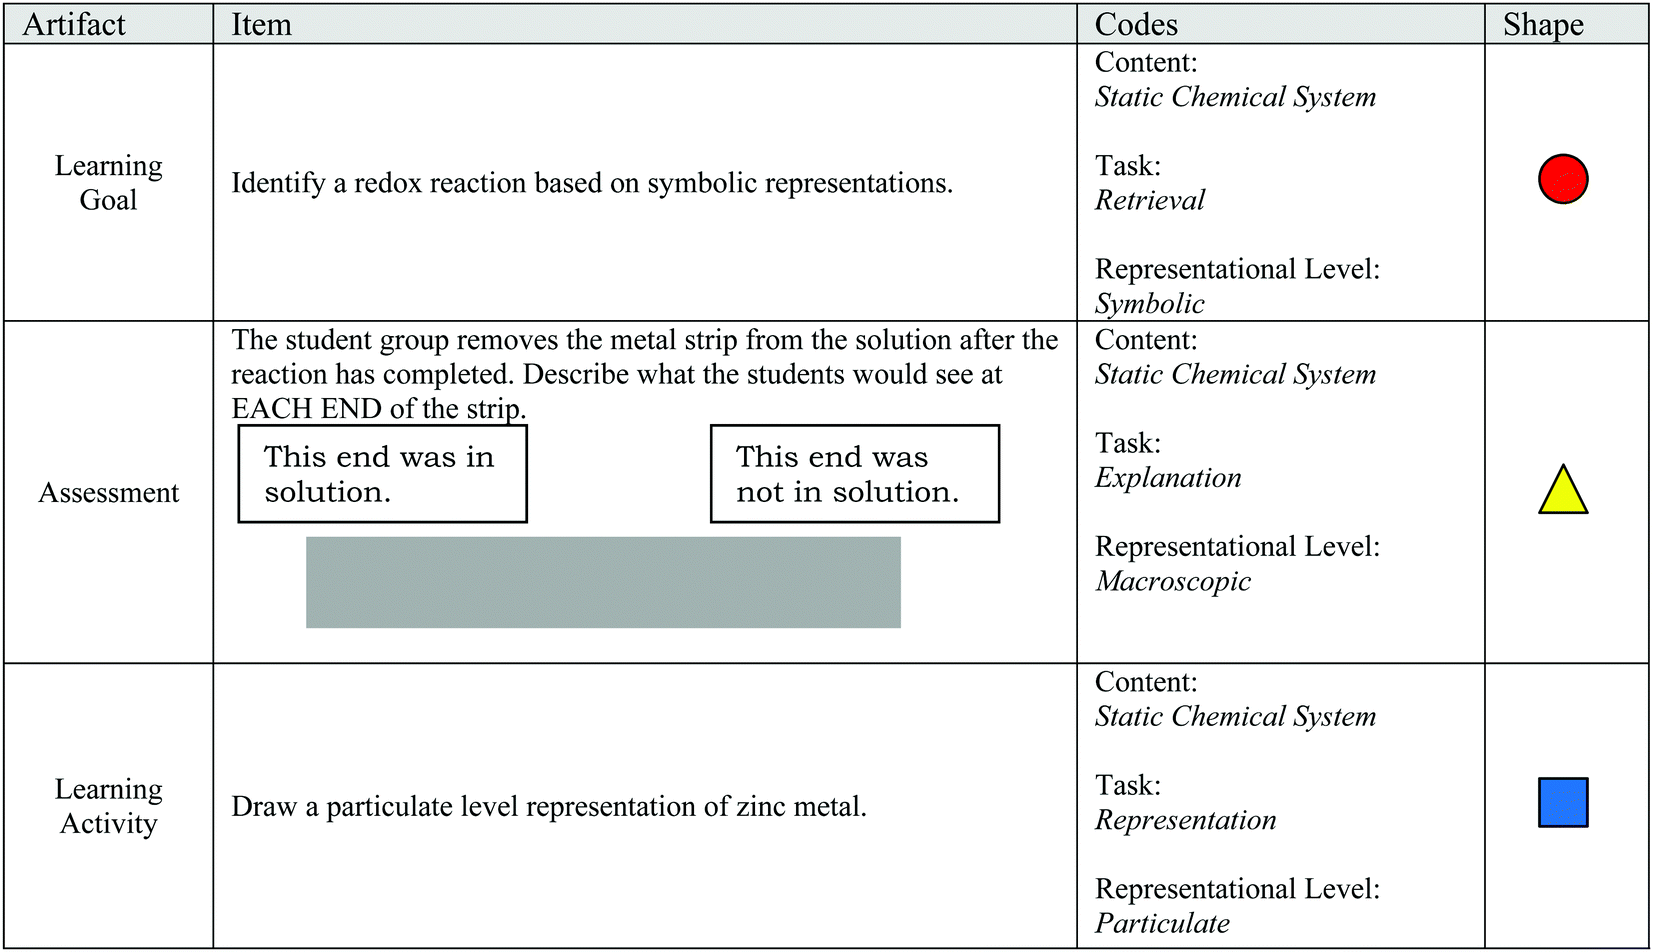 | ||
| Fig. 3 Example items, codes, and alignment plot identifiers from Claude's artifacts. | ||
Table 5 communicates the total number of items that include each task, representational level, and chemistry content topic found in Celine's artifacts. The learning goals for Celine's lesson were that students will be able to:
| Category | Code | Learning goals | Assessment | Learning activity | Total |
|---|---|---|---|---|---|
| Task | Retrieval | 2 | 6 | 40 | 48 |
| Explanation | 1 | — | 3 | 4 | |
| Representation | — | 1 | — | 1 | |
| Analysis | — | — | — | 0 | |
| Knowledge utilization | — | — | — | 0 | |
| Representational level | Symbolic | 3 | 5 | 42 | 50 |
| Symbolic/particle | — | — | — | 0 | |
| Particle | — | — | — | 0 | |
| Particle/macroscopic | — | 1 | — | 1 | |
| Macroscopic | — | — | 1 | 1 | |
| Macroscopic/symbolic | — | 1 | — | 1 | |
| Ambiguous | — | — | — | 0 | |
| Chemistry content | Element and number relation | 3 | 3 | 27 | 33 |
| Element comparison | — | 4 | 2 | 6 | |
| Periodic table | — | — | 7 | 7 | |
| Math knowledge | — | — | 6 | 6 | |
| Observations | — | — | 1 | 1 | |
| Total | 3 | 7 | 43 | ||
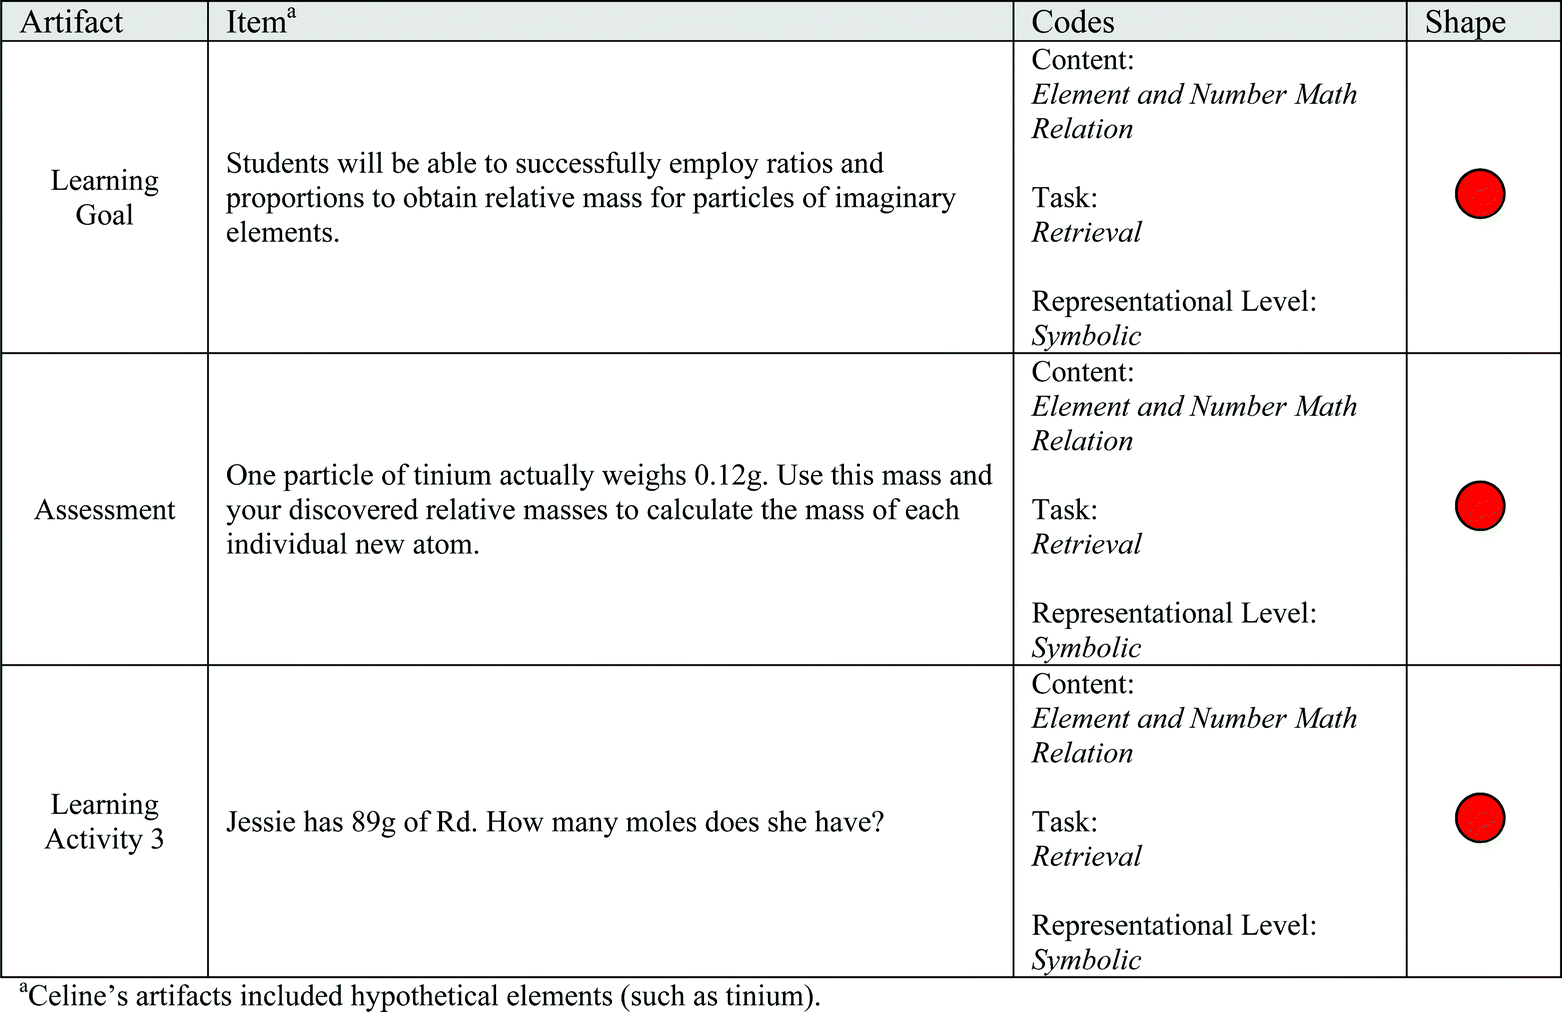
1. Successfully employ ratios and proportions to obtain relative mass for particles of imaginary elements.
2. Successfully explain how Avogadro's law allows scientists to assign mass to particles as tiny as atoms.
3. Use ratio relationships and reasoning to assign a relative mass to an unknown particle, based on given information.
Celine generated one assessment and three learning activities to address these learning goals. Students in Celine's classes were provided one day to complete each learning activity, taking the assessment the day after the third learning activity.
Celine's artifacts addressed four chemistry topics within a lesson about isotopes and atomic mass, with an additional code for items about recording observations. Celine has multiple learning activities because she made in-class decisions about student progress, deciding that her students needed more in-class instruction before taking the assessment. Example items from Celine's artifacts are shown in Fig. 4. The tasks articulated in Celine's items were nearly all retrieval (48 total) with far fewer explanation tasks (4 total) and only one representation task. Similarly, nearly all items in Celine's artifacts incorporated the symbolic representational level (50 out of 53 total items). Celine's items were disproportionately retrieval tasks at the symbolic representational level, meaning that the self-imposed requirements of addressing a variety of conceptual and representational levels was not met.
 | ||
| Fig. 4 Guide for reading and interpreting the alignment plots. | ||
Table 6 communicates the total number of items that include each task, representational level, and chemistry content topic for Emmerson's artifacts. The learning goals for Emmerson's lesson were that the learner will be able to:
| Category | Code | Learning goals | Assessment | Learning activity | Total |
|---|---|---|---|---|---|
| Task | Retrieval | 1 | 10 | 43 | 54 |
| Explanation | — | — | 29 | 29 | |
| Representation | 1 | — | — | 1 | |
| Analysis | 2 | — | 5 | 7 | |
| Knowledge utilization | — | — | 6 | 6 | |
| Representational level | Symbolic | — | 3 | 6 | 9 |
| Symbolic/particle | — | 2 | — | 2 | |
| Particle | 2 | 3 | 5 | 10 | |
| Particle/macroscopic | — | — | 1 | 1 | |
| Macroscopic | — | — | 54 | 54 | |
| Macroscopic/symbolic | 1 | 2 | 12 | 15 | |
| Ambiguous | 1 | — | 5 | 6 | |
| Chemistry content | Reaction type | 1 | 6 | 17 | 24 |
| Reaction representation | 3 | 4 | — | 7 | |
| Lab knowledge | — | — | 1 | 1 | |
| Observations | — | — | 65 | 65 | |
| Total | 4 | 10 | 83 | ||
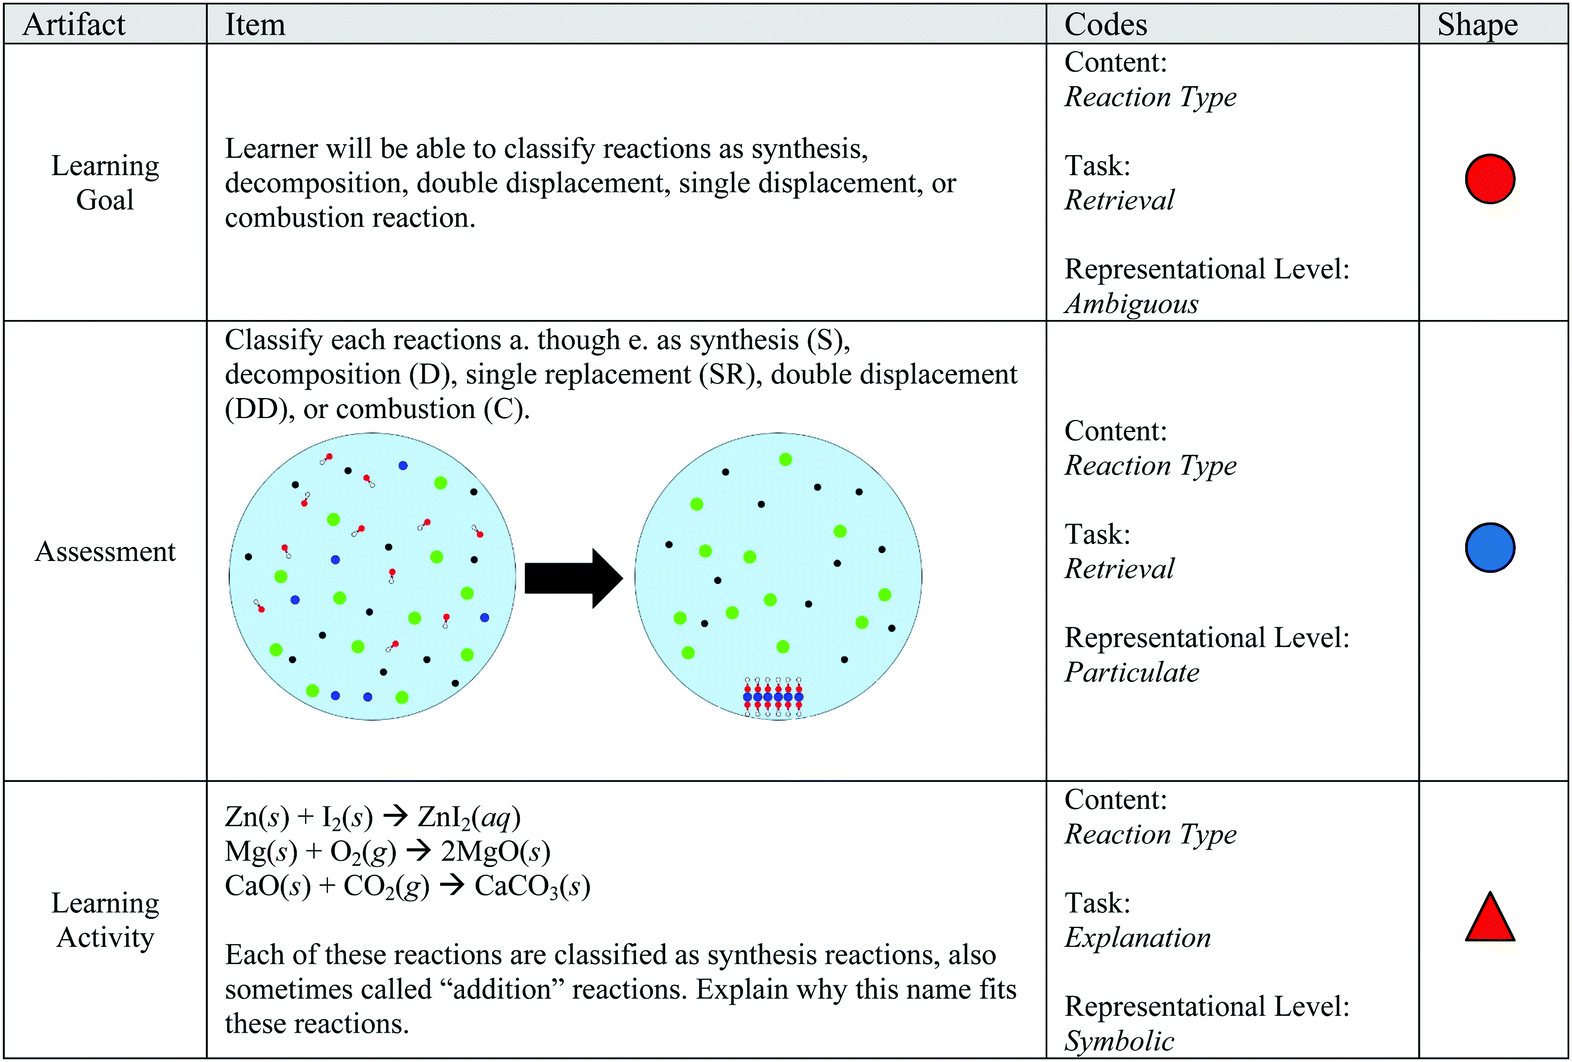
1. Classify reactions as a synthesis, decomposition, double displacement, single displacement, or combustion reaction.
2. Interpret symbolic representations of equations to make predictions of observable behaviors to link the macroscopic and symbolic levels of understanding according to Johnstone's triangle of chemical levels of thinking.
3. Analyze and develop sub-microscopic representations of reactions.
Emmerson generated one assessment and one learning activity to address these learning goals. Students in Emmerson's classes were provided two days to complete the learning activity, taking the assessment electronically the day after the learning activity.
Emmerson's artifacts included two chemistry content codes for a lesson about types of chemical reactions, with additional codes to represent items that asked students to make observations or employ their laboratory knowledge. Example items from Emmerson's artifacts are shown in Fig. 6. The tasks articulated in Emmerson's items were largely retrieval (54 total) with at least 1 assessment or learning activity item incorporating explanation, analysis, and knowledge utilization tasks. Although the learning activity incorporated a variety of tasks, the assessment included only retrieval tasks. The emphasis of retrieval tasks is likely a result of the number of observations in the learning activity, which also likely contributes to the emphasis on the macroscopic representational level (54 items). Even though the macroscopic representational level was disproportionately emphasized, the learning activity included at least one item from all other possible representational levels (excluding items including both symbolic and particle levels) and the assessment spanned a variety of representational levels. Emmerson's items met the self-imposed requirements of articulating a task for each item and incorporating a variety of conceptual and representational levels, although retrieval items at the macroscopic level were emphasized.
Although investigating individual code occurrences provided insight about overall trends in task and representational level use, the complex nature of the items is not illustrated. For example, an item coded as a retrieval task may include a different representational level than other retrieval tasks within the same chemistry content. Highlighting the co-occurrence of the tasks and representational levels of items within each chemistry content code allows for a more thorough characterization of alignment to instructional materials which is described in the following section.
Construction of the alignment plots
A two-dimensional diagram (called an alignment plot) was generated to allow for a synchronous characterization of the alignment of tasks and representational levels of items within teacher items from her/his artifacts. To compare individual items among assessment and instructional artifacts, every action within each learning goal, learning activity item, and assessment item was assigned a shape based on its task code (Table 7) and a color based on its representation level (Fig. 2). Fig. 2 illustrates the colors applied for each possible representational level code.| Task code | Shape on alignment plot |
|---|---|
| Retrieval | Circle |
| Explanation | Triangle |
| Representation | Square |
| Analysis | Pentagon |
| Knowledge Utilization | Star |
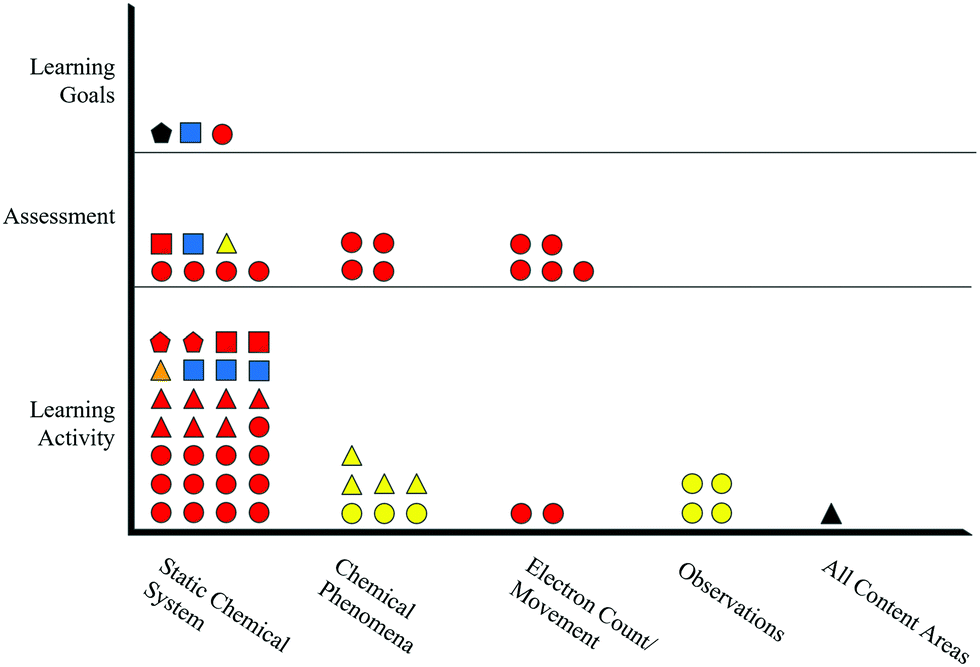
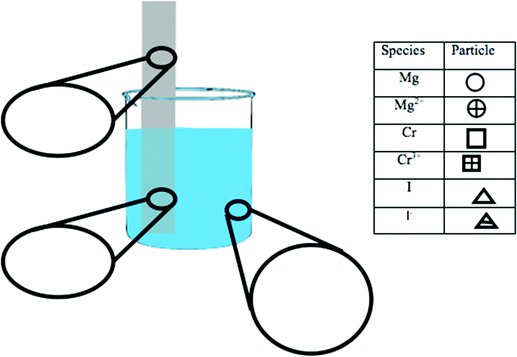
Example items from Claude's artifacts are shown in Fig. 3. The items in Fig. 3 align with the “Static Chemical System” chemistry content code, because they ask the student about a system that is assumed to be static (i.e., unmoving). The learning goal's task is depicted by a circle to show that students are asked to identify. The learning goal sets the requirement that, to demonstrate competency, students need to recognize the correct answer when critical information is provided. The circle is colored red to show the symbolic representational level communicated in the learning goal. The assessment item's task is depicted by a triangle to show that the item asks the student to explain. When responding to this assessment item, students are provided with the information that a portion of a magnesium strip is placed in a solution of chromium(III) iodide. From this information, the student would need to discern critical information from noncritical information to demonstrate that they understand where the reaction occurred and what observations would be evident. Since the item asks for a macroscopic description, the item's shape is colored yellow. The task of the learning activity item in Fig. 3 is depicted as a square because the student is asked to draw. To demonstrate competency for this item, the student would need to generate a representation. The color of the shape is blue, since a particle-level representation is to be generated by the student. Example items for each task and representational level can be found in Appendix A and B.
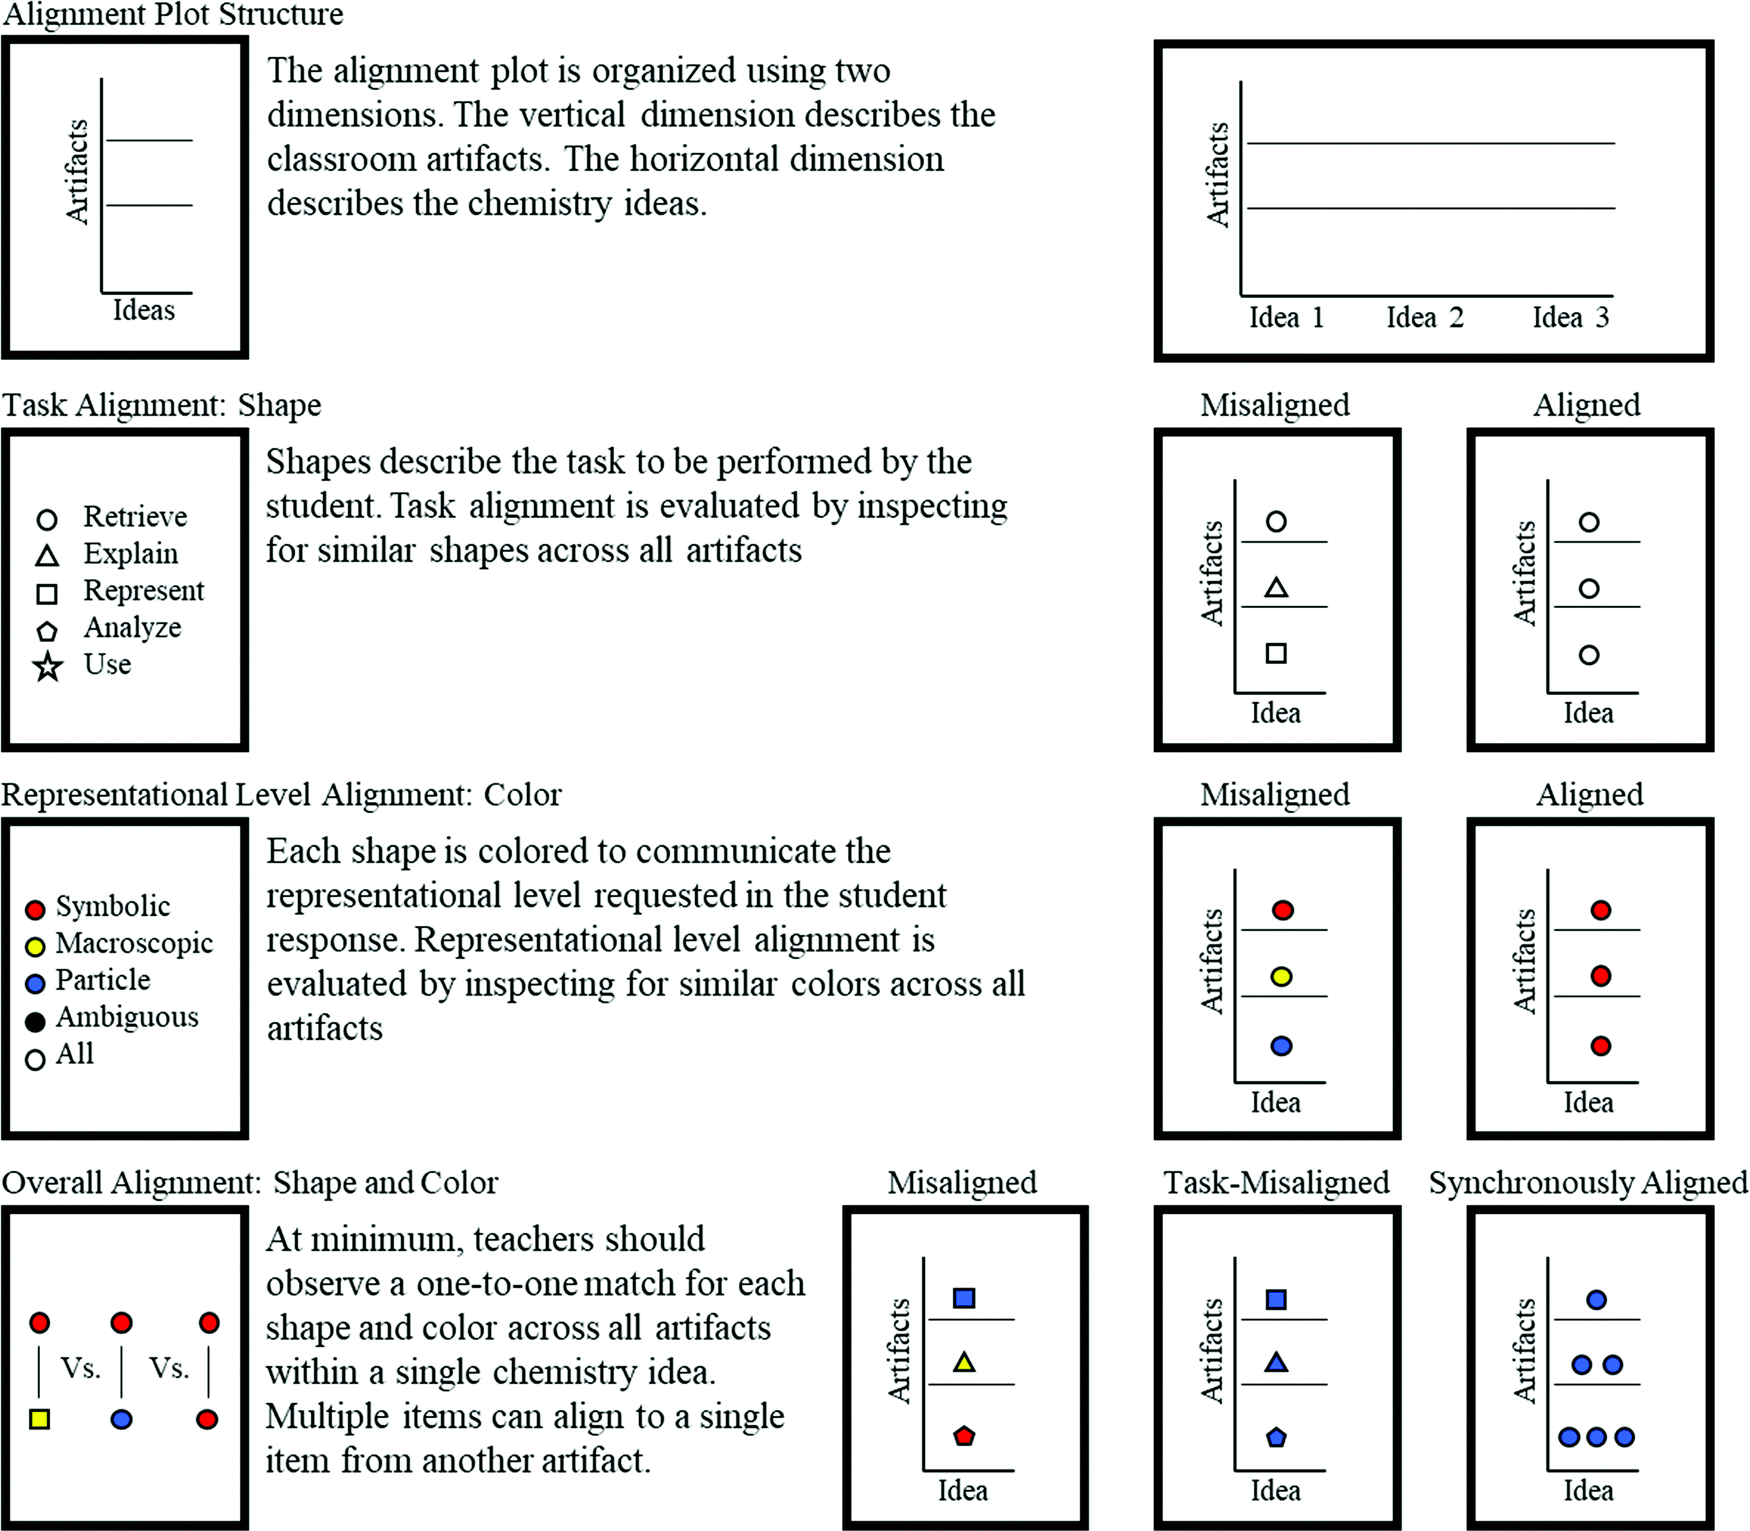
Inspection for matching shapes and colors within content categories of the alignment plots (vertically) allows for a more thorough investigation of alignment than comparison of tasks and representational levels separately. A guide for reading the alignment plot is provided in Fig. 4.
Alignment plots
 | ||
| Fig. 5 Claude's alignment plot. | ||
 | ||
| Fig. 6 Example items, codes, and alignment plot identifiers from Celine's artifacts. | ||
Inspecting only the shapes within Claude's alignment plot (Fig. 5) reveals that the artifacts exhibit instances of both alignment and misalignment regarding assessment tasks. The “Static Chemical System” content in Fig. 5 shows that retrieval (circles) and representation (squares) tasks are present in all artifacts, demonstrating alignment of tasks. However, analysis (pentagons) and explanation (triangles) tasks are not present in all artifacts, indicating misalignment of tasks. The other chemistry content areas shown in Fig. 5 do not contain learning goals and thus cannot have alignment among assessment and instructional materials.
A similar evaluation can be performed for the representational level alignment by comparing colors present in Claude's artifacts. Fig. 5 shows two learning goals with specified representational levels, one particle-level (blue color) and the other symbolic (red color), within the “Static Chemical System” content. The items are aligned with items in the assessment and learning activity, as indicated by the presence of red and blue shapes in both the assessment and learning activity for that content. Alternatively, the lone macroscopic-level (yellow) item in Claude's assessment for the “Static Chemical System” content is not matched with any learning goals or items in the learning activity for that content, indicating misalignment of representational level. Again, the lack of learning goals for the other content areas means that there is not an opportunity for alignment among the assessment and instructional materials.
Although evaluating task and representational level separately reveals valuable insights about Claude's assessment design practices, the alignment plot allows for these criteria to be evaluated synchronously. For example, one of Claude's learning goals is a symbolic/retrieval item (red/circle). This learning goal is exactly matched with four assessment items and 13 learning activity items within the same content. Similarly, another of Claude's learning goals is a particle-level/representation item (blue/square) that is exactly matched with one assessment item and three learning activity items. These exact matches represent the highest degree of alignment within Claude's artifacts.
 | ||
| Fig. 7 Celine's alignment plot. | ||
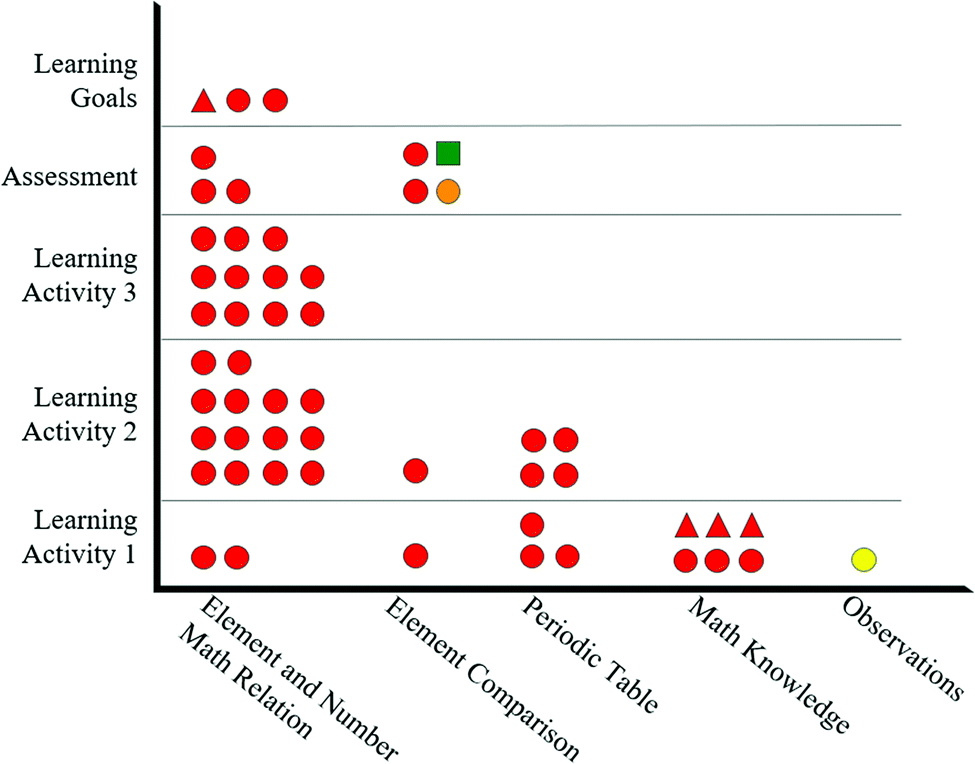
Beginning with the tasks (shapes) of Celine's artifacts in Fig. 7, nearly all of the items require a retrieval (circle) task. Although retrieval tasks (circles) are present throughout all content categories, alignment is only observed for the “Element and Number Math Relation” content, since this is the only content with learning goals. Additionally, the lone explanation (triangle) learning goal is misaligned with items in the assessment and learning activity since there are no corresponding shapes within the same chemistry content. Evaluating the representational level (color) of the artifacts in Fig. 7 reveals a similar trend. Nearly all the items are at the symbolic level (red color). However, since the learning goals are only within the “Element and Number Math Relation” content, only these are considered aligned.
Again, the alignment plot's true value stems from the ability to compare task (shape) and representational level (color) synchronously. Celine's artifacts show complete alignment within the “Element and Number Math Relation” content for items that involve symbolic/retrieval (red/circles) tasks as these items are present throughout all artifacts for this content.
 | ||
| Fig. 8 Example items, codes, and alignment plot identifiers from Emmerson's artifacts. | ||
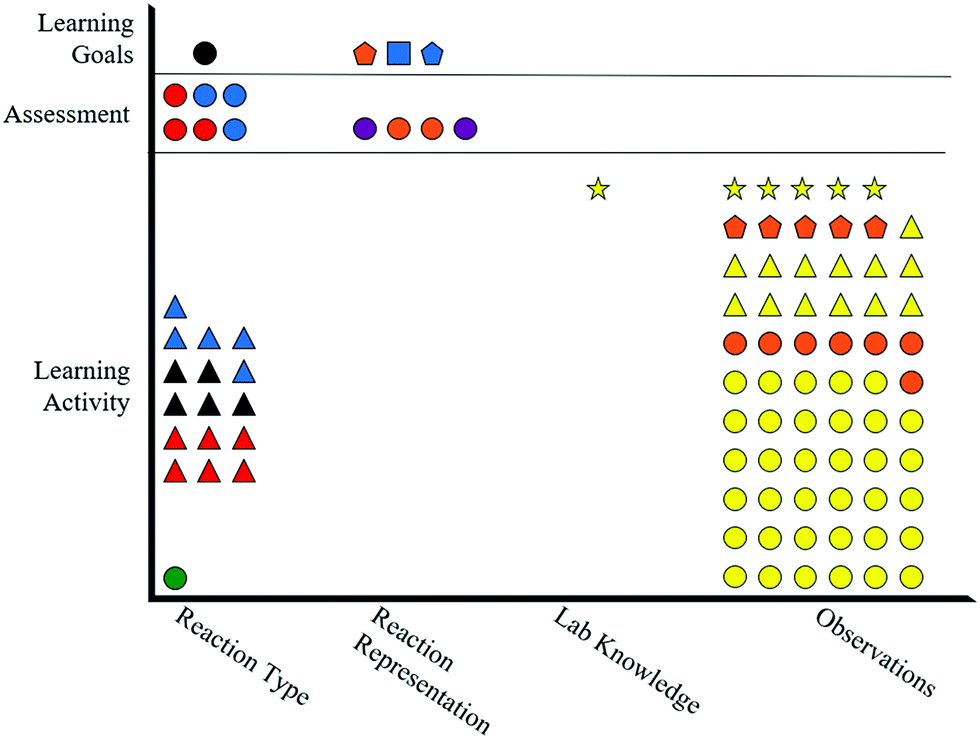 | ||
| Fig. 9 Emmerson's alignment plot. | ||
Fig. 9 shows the tasks (shapes) in Emmerson's artifacts only exhibit alignment within the chemistry content “Reaction Type” for retrieval (circles) tasks, since all artifacts in that content include a circle. Emmerson's learning goals also incorporate representation (squares) and analysis (pentagons) tasks within the “Reaction Representation” content; however, the assessment and learning activity do not include corresponding shapes, indicating misalignment of tasks. Although Emmerson's artifacts incorporate a variety of representational levels (colors), the colors are not consistent throughout the artifacts, leading to no instances of representational level alignment within any chemistry content categories (i.e., one color is not present in each the learning goals, assessment, and learning activity for any particular content category). Without any instances of alignment in regard to representational level, Emmerson's artifacts do not exhibit any instances of matching task and representational level (shape and color) for the evaluated lesson.
The alignment plots allow for a synchronous evaluation of the items across instructional and assessment artifacts; however, it is unrealistic for a teacher to generate an alignment plot when designing every planned, formative assessment. Nonetheless, these alignment plots may be useful for teachers who wish to evaluate the quality of select planned, formative assessments.
Relationship between “best practices” and assessment design
The second research question guided the investigation of the relationship between the “best practices” for formative assessments generated by these teachers and the actual assessments they generated. The alignment plots illustrated teachers’ enacted design practices for their planned, formative assessments. Comparing these enacted practices to the teachers’ “best practices” allows for a characterization of the relationship between the tools teachers use to collect classroom evidence and their beliefs about how planned, formative assessments should be designed. In a research context, the alignment plots configure the codes from teachers’ artifacts into a format that allows a comparison among the enacted practices, “best practices,” and the literature. This comparison reveals the barriers that teachers encounter when designing planned, formative assessments. As such, the rest of the manuscript leverages assessment design practices illustrated in the alignment plots to uncover the relationship between teachers’ enacted practices and perceived “best practices”.The first teacher-generated “best practice” states that an assessment item should clearly articulate a task for the student to perform. Other investigations have found teachers often consider the specific action to be performed by students when designing and selecting assessment items (Tomanek et al., 2008; Kang et al., 2016; Schafer and Yezierski, 2020b). Teachers have a significant body of literature to draw from when considering how to design productive tasks for their learning environment (e.g., Harris et al., 2016). A task was able to be assigned for each assessment item within the assessments generated by this group of teachers. Additionally, each learning goal and learning activity item was also able to have a specific task assigned. As such, few barriers seem to exist preventing teachers from enacting the “best practice” of stating a specific task for students to perform.
The second listed “best practice” for formative assessments by these teachers was to assess a variety of conceptual and representational levels. Assessing content in a variety of ways can help the teacher triangulate student competency (Sadler, 1989; National Research Council, 2001; Means et al., 2011). Of the teachers in this study, Claude's assessment included the greatest variety of tasks, which were considered synonymous with “conceptual levels” for the purpose of this study. Claude included retrieval, explanation, and representation tasks in his assessments, as shown in Fig. 5 and Table 4. Celine included retrieval and representation tasks in her assessment, as shown in Fig. 7 and Table 5. Emmerson included only retrieval tasks in his assessment, as shown in Fig. 9 and Table 6. It is important to recognize that any particular task is not necessarily more conceptually difficult or challenging than other by default (National Research Council, 1999, 2014; Wauters et al., 2012). For example, students may have opportunities to consistently practice generating representations for a chemical phenomenon without being able to reason about the atomic-level events that explain why the phenomenon occurs. Additionally, the assessments provided were formative, meaning that each serves the purpose to inform continued instruction. As such, the assessments may be situated near the beginning of a unit of instruction, limiting the opportunity to include several conceptually challenging items. Either way, the greater variety of tasks on Claude's assessment more likely addresses a range of conceptual difficulties and potentially better equips him to judge the upper limit of his students’ understanding.
Also included in the second “best practice” is the suggestion to include a variety of representational levels. Several investigations document student struggles navigating among representational levels (Gabel et al., 1987; Nakhleh, 1992; Russell et al., 1997; Gkitzia et al., 2020). Thus, when triangulating student understanding, teachers could benefit from assessing competency using a variety of ways of perceiving chemical information (National Research Council, 1999). However, literature guidance suggests that carefully scaffolding items assessing representational level and that limiting the number of representational levels per task may be beneficial (Taber, 2013). Table 6 and Fig. 9 reveal that Emmerson addressed the greatest variety of representational levels by including four separate levels in his assessment. However, Claude and Celine both included three separate representational levels throughout their assessment items. All teachers seemed to meet the self-generated “best practice” of addressing a variety of representational levels in their assessments. Few barriers seem to exist preventing teachers from enacting the “best practice” of incorporating a variety of representational and conceptual levels. However, incorporating a variety of representational levels requires teachers to consider their students’ prior knowledge and experience, making enactment a more complex process compared to “clearly state a task.” Such considerations are commensurate with the process of data-driven inquiry, as employing data-driven methods must consider the needs their students and learning environment when designing tools for gathering evidence that are aligned with their goals (Harshman and Yezierski, 2017).
The final relationship evaluated to address the second research question was that of the “best practice” of aligning assessment and instructional materials. Assessment and instruction do not exist in isolation and are intertwined throughout the learning process, especially formative assessments. Assessing tasks and concepts not addressed during instruction can unjustly increase the cognitive demand of an item (National Research Council, 2014; Kang et al., 2016). While assessments in this study exhibited instances of alignment and misalignment regarding task or representational level, none were completely aligned or misaligned regarding task or representational level. The results from evaluating alignment of each teachers’ assessment are shown in Table 8.
| Teacher | Tasks aligned | Representational levels aligned | Tasks and representational levels synchronously aligned (shown as representational level/task) |
|---|---|---|---|
| Claude | Retrieval, representation | Symbolic, particle | Symbolic/retrieval, particle/representation |
| Celine | Retrieval | Symbolic | Symbolic/retrieval |
| Emmerson | Retrieval |
For this investigation, an assessment was considered “aligned” if one instance of a specified criterion was present in each of the included artifacts. This one-to-one definition of alignment is commonly employed by methods used to evaluate alignment for state-level artifacts (Martone and Sireci, 2009), but may not be suitable for evaluating formative assessments. Indeed, several works recognize that a teacher may need to make between six and eight observations of student behavior to reliably judge student competency (Webb, 2006; Martone and Sireci, 2009; Praetorius et al., 2014; Briggs and Alzen, 2019). The recommended six to eight observations of student observations come from investigations of assessment and instructional tasks, but not both. So, teachers may need to exercise caution when considering the number of assessment items necessary to reliably judge student knowledge. Teachers in this study generally included several assessment items to evaluate a single learning goal and even more learning activity items to address the assessment items. For example, Fig. 5 shows that Claude's artifacts included one learning goal that was symbolic/retrieval and matched to four symbolic/retrieval assessment items and 13 symbolic/retrieval learning activity items. There are currently no literature-based guidelines on the ratio of learning goals-to-assessment items-to-learning activity items recommended for a reliable judgement of student learning, and a specific ratio is unlikely to be generalizable across all learning environments. However, the previously mentioned guidelines about the number of student observations suggests that a structure similar to Claude's is more favorable than a 1-learning goal to 1-assessment item to 1-learning activity item ratio of co-occurrence.
Missing from the chemistry education literature is how representational level factors into evaluations of alignment. Results of synchronously evaluating task and representational level are included in Table 8. While Claude's assessment was aligned along the synchronous criteria of both symbolic-level/retrieval tasks and particle-level/representation tasks, Celine's assessment showed synchronous alignment regarding only symbolic-level/retrieval tasks and Emmerson's assessment showed no synchronous alignment of representational level and task. Considering students’ documented struggles navigating among representational levels (Gabel et al., 1987; Nakhleh, 1992; Russell et al., 1997; Gkitzia et al., 2020), developing a method for evaluating the alignment of chemistry formative assessments that incorporates task and representational level synchronously may be beneficial for research, teacher education, and teacher professional development. As such, significant barriers exist for chemistry teachers when evaluating alignment between assessment and instruction in terms of both (1) an appropriate ratio of learning goals-to-assessment items-to-learning activity items that can support reliable inferences from evidence; and (2) how to incorporate alignment criteria (such as task and representational level).
Conclusions and research implications
The first research question asks how tasks and representational levels of planned, formative assessment items can be diagrammed to allow for a synchronous evaluation of alignment between assessment and instruction. To address this question multiple representations were considered, ultimately resulting in the generation of an alignment plot for one lesson submitted by three high school chemistry teachers (three total lessons). The alignment plot is able to reveal the formative assessment design practices of the participating teachers by synchronously visualizing the assessment features of each assessment. In this way, the alignment plots may serve as a valuable tool to teachers seeking to evaluate the alignment between their assessment and instruction. Although the alignment plots are still extensive, teachers may find it less challenging to employ than other alignment evaluation tools, such as the EQuIP (Achieve, 2016; Fulmer et al., 2018). The ability of the alignment plot to reveal instances of alignment and misalignment within teacher assessments shows that the diagram may serve as a tool teachers may use to evaluate the alignment between their assessments and instructional materials.Findings from the second research question revealed relationships between high school chemistry teachers’ stated “best practices” for formative assessment design and the assessments they generated. The “best practices” developed by these teachers state that a formative assessment should articulate a specific task to be performed by the student, address a variety of conceptual and representational levels, and align assessment items to instructional materials. Results showed that teachers met the practices of articulating a task and including a variety of representational levels. However, only Claude's assessment incorporated a variety of conceptual levels (i.e., tasks). Teachers’ ability to consistently meet their “best practices” of articulating a task implies that there are few barriers to enacting this goal. Direct literature guidelines are available for designing learning activity and assessment tasks for science classrooms (Harris et al., 2016; Laverty et al., 2016; Penuel et al., 2019). Although teachers met the “best practice” of incorporating a variety of representational levels, the emphasis on symbolic items could indicate that barriers still hinder enactment of this goal. Overall, assessment items generally required retrieval tasks at symbolic representational levels, potentially limiting the amount of information about student competency available to the teacher for effectively interpreting student understanding (Stiggins, 2001; Towns, 2014b; Schafer and Yezierski, 2020a).
The third “best practice” generated by teachers required evaluating the extent that assessments aligned to instruction. For this study, a one-to-one ratio between items in instructional artifacts and assessment artifacts was used. While teachers were generally able to align some assessment tasks to instructional materials, representational levels of assessment items were frequently misaligned with instruction or only one representational level was employed for nearly all items. Synchronous alignment of tasks and representational levels to instructional materials was infrequently observed; however, Claude's assessment included several items that synchronously aligned task and representational level to instructional materials (while still employing a variety of tasks and representational levels). The instances of alignment revealed by the alignment plots indicate that even experienced teachers with several years attending professional development can still encounter significant barriers to aligning assessments to instructional materials. Although there is some literature-based guidance available to teachers for aligning assessment and instruction, most studies result in tools for teachers to use for evaluating alignment (e.g., Webb, 2007; Kaderavek et al., 2015; Achieve, 2016) which can be challenging for teachers to employ, given variations in learning environments and teacher goals. Additionally, literature about evaluating alignment has mixed guidance on what qualifies as “aligned” (Fulmer et al., 2018), variations in the criteria to use when considering alignment (Martone and Sireci, 2009; Fulmer et al., 2018), and disagreements in how many aligned criteria are necessary to assume a suitably reliable interpretation of student knowledge (Webb, 2006; Martone and Sireci, 2009; Praetorius et al., 2014; Briggs and Alzen, 2019). The existing barriers these teachers face for enacting their “best practice” of aligning assessment to instruction implies that teachers need more than tools for evaluating alignment. Chemistry teachers need guidance understanding the methodological and conceptual underpinnings of the available tools, interpreting the results from the tools employed, and appropriately adjusting classroom materials to better evaluate the success of the learning environment.
Limitations and future work
Although the findings presented are useful for better understanding high school chemistry teacher design practices, there are several limitations that bound the claims presented. To begin, the study described herein closely examines the physical artifacts from three individual lessons and extracted from teachers’ day-to-day practices. The focus on physical artifacts is not meant to imply that learning is paused during assessment and we recognize that chemistry teachers evaluating the alignment of their assessments will likely have access to more data, such as additional assessments, learning activities, classroom interactions, and knowledge of students. However, investigating a defined set of artifacts allowed for a closer inspection of the proposed measures, providing guidance for chemistry teachers as they interpret the alignment of their assessments. When interpreting alignment in this work, the reader is cautioned against perceiving misaligned items as “bad” items, and interpretation of the alignment plot should consider the overall structure of the instrument. For example, Claude included items with retrieval tasks to scaffold or support complementary tasks, such as developing a representation. However, well-designed, planned, formative assessments should include items that evaluate the stated goals. Future studies could expand upon this investigation to include more teachers and more data sources to better understand how teachers incorporate these many data sources into their evaluation of assessment quality.Certain limitations exist within the measures, as well. For example, Marzano's and Kendall's original framework sets knowledge categories as a hierarchy of knowledge levels (Marzano and Kendall, 2008). To exemplify the complexities of item difficulty, this study does not employ the hierarchical use of knowledge tasks. Future studies could investigate the extent to which individual knowledge categories are representative of item difficulty and depth of understanding.
A limitation of the analysis described herein is that each learning goal, learning activity, and assessment item were investigated according to what is asked of the student in the artifact, not the student's actual response to the item. This purposeful bounding of the investigation around the artifacts does not include response process validation from students. Additionally, the items generated by these teachers may not be deemed “high-quality” items by chemistry content experts. The items generated by the teachers were part of an ongoing professional development and reflect what was implemented in chemistry teacher classrooms during early sessions. During later professional development sessions, teachers collaboratively interpreted student responses to the assessment items presented and posited potential changes to planned, formative assessment design practices. Future studies may investigate the tasks that are asked of the student versus the task the student performs.
Implications for teachers
Although this work holds many implications for research, it may also serve to benefit teachers looking to improve their classroom practices. For example, chemistry teachers should consider the representations used to teach and assess knowledge in their classrooms. Overemphasis on a single representational level or misalignment between representations on assessment and instructional materials can impact the quality of interpretations of student knowledge. Teachers may also consider how tasks and representations are aligned between assessment and instruction. It is likely the one-to-one ratio between assessment and instructional items employed in this study is not sufficient and that teachers may benefit from using a ratio more like what is found in Claude's artifacts (1 learning goal: 4 assessment items: 13 learning activity items). The exact numbers are likely less important than having one learning goal, assessed multiple times, with even more student learning opportunities. The alignment plot can be employed in chemistry teacher education (focused on formative assessment practices) and chemistry teacher professional development as a tool to examine alignment in the discipline-specific manner.The “best practices” examined in this work were generated by high school chemistry teachers and align to high quality practices stated in relevant literature. The connection between these chemistry teachers’ goals and literature-backed practices implies that high school chemistry teachers may benefit from incorporating the stated “best practices” when developing formative assessments. The “best practices” were generated as goals for designing and interpreting formative assessments by a group of teachers knowingly using the process of data-driven inquiry (Schafer and Yezierski, 2020a). Chemistry teachers may similarly benefit by using processes like data-driven inquiry to scaffold their progression from designing goals, collecting classroom evidence, and forming an evidence-based instructional response. Additionally, we hope chemistry teachers are inspired to reflect on the alignment of the purpose and design of the assessments employed in their own classrooms and employ formal measures such as the alignment plot in their practice.
Conflicts of interest
There are no conflicts to declare.Appendix A – task codebook and example items
| Code | Description (demonstration of competency requires…) | Example task | Plot depiction |
|---|---|---|---|
| Retrieval | Identification or stating of standalone information without synthesis or analysis. | Identify, recognize, math functions, complete, apply, demonstrate | Circle (shape) |
| Explanation | Communication of critical/essential information from noncritical/nonessential information. | Explain, summarize | Triangle (shape) |
| Representation | Generation of a depiction of a chemical idea, phenomenon, or relationship | Draw, use models, represent, show | Square (shape) |
| Analysis | Processes that involve examining knowledge/content/observations with the intent of generating new conclusions (extending knowledge). | Sort, categorize, differentiate, assess, critique, evaluate, diagnose | Pentagon (shape) |
| Knowledge utilization | Processes that require the application or use of knowledge in a novel situation. | Test, how would you determine, generate and test | Star (shape) |
| Code | Example | Example source |
|---|---|---|
| Retrieval | Students will be able to successfully employ ratios and proportions to obtain relative mass for particles of imaginary elements. | Celine: learning goal |
| Explanation | Zn(s) + I2(s) → ZnI2(aq) | Emmerson: assessment item |
| Mg(s) + O2(g) → 2MgO(s) | ||
| CaO(s) + CO2(g) → CaCO3(s) | ||
| Each of these reactions are classified as synthesis reactions, also sometimes called “addition” reactions. Explain why this name fits these reactions. | ||
| Representation | A student group performs an experiment where a strip of magnesium of placed into a solution of chromium(III) iodide. A reaction occurs according to the following equation. | Claude: assessment item |
| Draw a particulate representation of the products in the space that follows. Use the symbols in the key provided. (Note that the zoom-out in the liquid represents species that are dissolved in the liquid.) | ||
|
||
| Analysis | Predict products of redox reactions | Claude: learning goal |
| Knowledge utilization | Calcium chloride (CaCl2) and sodium carbonate (Na2CO3) are ionic compounds that dissolve in water. When dissolved, these substances react as expressed by the following equation: | Emmerson: learning activity |
| CaCl2(aq) + Na2CO3(aq) → CaCO3(s) + 2NaCl(aq) | ||
| Suggest a technique or a combination of techniques that would allow you to “recover” and observe the other product if you do not currently have evidence for its formation. |
Appendix B – representational level codebook and example items
| Code | Description | Example | Plot depiction |
|---|---|---|---|
| Symbolic | The use of descriptive words, symbols, or values to communicate chemical ideas/events/species | Chemical equations | Red (shape) |
| Macroscopic | Representation of species/events on a visible scale to communicate chemical ideas/events/species | Observations | Yellow (shape) |
| Particulate | Representation of species/events on an invisible scale to communicate chemical ideas/events/species | Atomic-level particles in solution | Blue (shape) |
| Symbolic/macroscopic | Communication of chemical ideas/events/species includes combinations of individual representational levels | Equation paired with observation | Orange (shape) |
| Symbolic/particulate | Equation paired with atomic-level particle model | Purple (shape) | |
| Macroscopic/particulate | Atomic-level particles paired with observation | Green (shape) | |
| All | Communication of chemical ideas/events/species occurs at all representational levels | Answer incorporates all levels | White (shape) |
| Ambiguous | No representational level communicated | Representational level not specified | Black (shape) |
| Code | Example | Example source |
|---|---|---|
| Symbolic | Identify a redox reaction based on symbolic representations. | Claude: learning goals |
| Macroscopic | Sodium carbonate (NaHCO3) is a familiar household compound commonly referred to as baking soda. When heated, it reacts according to the following equation: | Emmerson: learning activity |
| 2NaHCO3(s) → Na2CO3(s) + H2O(g) + CO2(g) | ||
| Summarize your observations below. Be complete when you record these observations. This includes any observations obtained by sight, feel, odor, or sound. | ||
| Particulate | A student group performs an experiment where a strip of magnesium of placed into a solution of chromium(III) iodide. A reaction occurs according to the following equation. | Claude: assessment item |
| Draw a particulate representation of the products in the space that follows. Use the symbols in the key provided. (Note that the zoom-out in the liquid represents species that are dissolved in the liquid.) | ||

|
||
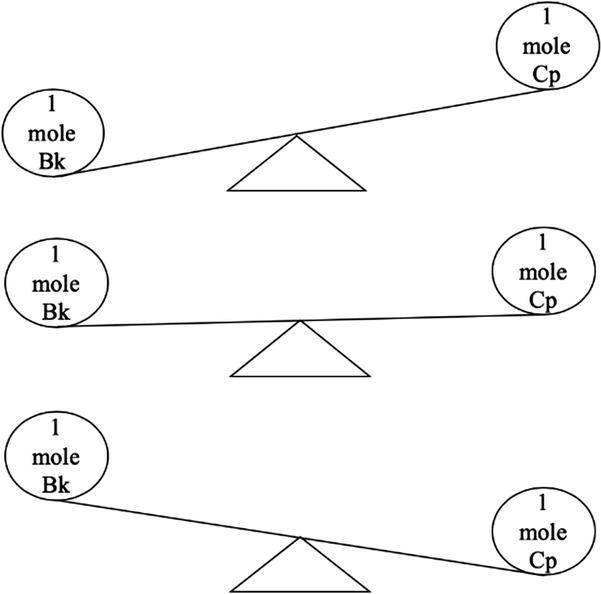
| Symbolic/macroscopic | Which of the following choices best shows the mass relationship between 1 mole of Blonko (Bk) and 1 mole of copperium (Cp)? | Celine: assessment |
|
||
| Symbolic/particulate | Which equation best represents the following particulate representation? | Emmerson: assessment |
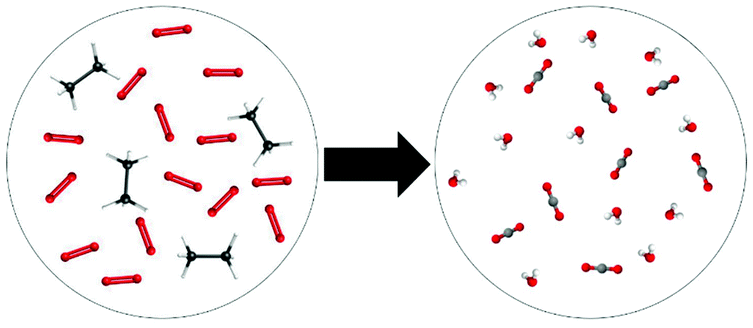
|
||
| a. 2C2H6(g) + 7O2(g) → 6H2O(g) + 4CO2(g) | ||
| b. 2C2H6(l) + 7O2(g) → 6H2O(l) + 4CO2(g) | ||
| c. C2H6(g) + O2(g) → H2O(g) + CO2(g) | ||
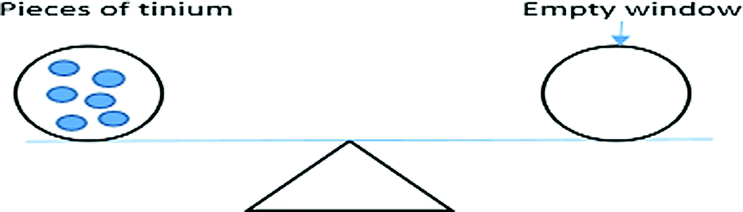
| Macroscopic/particulate | Copperium has a mass approximately 3 times heavier than tinium. In the diagram below the window on the left has 6 particles of tinium (TN). Draw how many pieces of copperium would be in the empty window on the right so that the mass would balance. | Celine: assessment |
|
||
| All | Did not occur in teacher artifacts. | N/A |
| Ambiguous | Predict products of redox reactions | Claude: learning goals |
Appendix C – content codebooks by teacher
| Code | Description |
|---|---|
| Static chemical system | Content includes information about what atoms/molecules/ions present in a system, their features, and location within the system |
| Chemical phenomena | Content includes information about changes that occur between provided species in a chemical system (including hypothetical, or predicted changes) |
| Electron count and movement | Content includes information regarding electrons in a specified system |
| Observations | Content is dependent upon an in-lab observation |
| Code | Description |
|---|---|
| Mathematical relation between an element and a number | Content involves mathematical relationships and operations between values and their meanings in a chemistry context |
| Element comparison | Content requires the consideration of features/ideas/information of multiple elements (includes hypothetical elements) |
| Periodic table information | Content is sourced from general periodic table knowledge |
| Mathematical knowledge | Content includes knowledge about mathematical operations and principles |
| Observations | Content is dependent upon an in-lab observation |
| Code | Description |
|---|---|
| Reaction type | Content includes tasks specific to the type of reaction included in the item |
| Reaction representation | Item requires student to use the information embedded within a representation |
| Laboratory knowledge | Content includes general laboratory knowledge at the high school level |
| Observations | Content is dependent upon an in-lab observation |
Acknowledgements
We thank the high school chemistry teachers for participating in this project. We also thank the Yezierski and Bretz research groups at Miami University for their feedback and guidance. This material is based upon work supported by the U. S. National Science Foundation under Grant No. DRL-1118749.References
- Achieve, (2016), EQuIP rubric for lessons and units: Science, NGSS.
- American Chemical Society, (2012), ACS Guidelines and Recommendations for the Teaching of High School Chemistry, Washington, DC: American Chemical Society.
- American Educational Research Association, American Psychological Association, and National Council on Measurement in Education, (2014), Standards for Educational And Psychological Testing, Washington, DC: American Educational Research Association.
- Bell B. and Cowie B., (2001), The Characteristics of Formative Assessment in Science Education, Sci. Educ., 85(5), 536–553.
- Black P. and Wiliam D., (1998), Inside the Black Box: Raising Standards Through Classroom Assessment, Phi Delta Kappan, 80(2), 139–148.
- Bloom B. S., Engelhart M. D., Furst E. J., Hill, Walker H. and Krathwohl D. R. (ed.), (1956), Taxonomy of Educational Objectives: The Classification of Educational Goals, New York, NY: David McKay Company, Inc.
- Briggs D. C. and Alzen J. L., (2019), Making Inferences About Teacher Observation Scores Over Time, Educ. Psychol. Meas., 79(4), 636–664.
- Broman K., Bernholt S. and Parchmann I., (2015), Analysing task design and students’ responses to context-based problems through different analytical frameworks, Res. Sci. Technol. Educ., 33(2), 143–161.
- Cizek G. J., (2009), Reliability and validity of information about student achievement: Comparing large-scale and classroom testing contexts, Theory Pract., 48(1), 63–71.
- Clinchot M., Ngai C., Huie R., Talanquer V., Banks G., Weinrich M., et al., (2017), Better Formative Assessment: Making formative assessment more responsive to student needs, Sci. Teach., 84(3), 69–75.
- Coffey J. E., Hammer D., Levin D. M. and Grant T., (2011), The missing disciplinary substance of formative assessment, J. Res. Sci. Teach., 48(10), 1109–1136.
- Curry M. W., (2008), Critical Friends Groups: The Possibilities and Limitations Embedded in Teacher Professional Communities Aimed at Instructional Improvement and School Reform, Teach. Coll. Rec., 110(4), 733–774.
- Datnow A., Park V. and Wohlstetter P., (2007), Achieving with Data: How high-performing school systems use data to improve instruction for elementary students, Los Angeles, CA: Center on Educational Governance.
- DeLuca C., Valiquette A., Coombs A., LaPointe-McEwan D. and Luhanga U., (2018), Teachers’ Approaches to Classroom Assessment: A Large-Scale Survey, Assess. Educ. Princ. Policy Pract., 25(4), 355–375.
- Dini V., Sevian H., Caushi K. and Orduña Picón R., (2020), Characterizing the formative assessment enactment of experienced science teachers, Sci. Educ., 104(2), 290–325.
- Dwyer C. A., (2007), Assessment and Classroom Learning: theory and practice, Assess. Educ. Princ. Policy Pract., 5(1), 131–137.
- Fulmer G. W., Tanas J. and Weiss K. A., (2018), The challenges of alignment for the Next Generation Science Standards, J. Res. Sci. Teach., 55(7), 1076–1100.
- Gabel D. L., Samuel K. V. and Hunn D., (1987), Understanding the particulate nature of matter, J. Chem. Educ., 64(8), 695.
- Gearhart M., Nagashima S., Pfotenhauer J., Clark S., Schwab C., Vendlinski T., et al., (2006), Developing Expertise With Classroom Assessment in K-12 Science: Learning to Interpret Student Work Interim Findings From a 2-Year Study, Los Angeles, CA: Center for the Assessment and Evaluation of Student Learning (CAESL).
- Gibbs G. and Simpson C., (2004), Conditions Under Which Assessment Supports Students’ Learning, Learn. Teach. Higher Educ., 1(1), 3–31.
- Gkitzia V., Salta K. and Tzougraki C., (2020), Students’ competence in translating between different types of chemical representations, Chem. Educ. Res. Pract., 21(1), 307–330.
- Hamilton L., Halverson R., Jackson S., Mandinach E., Supovitz J. A., Wayman J. C., et al., (2009), Using Student Achievement Data to Support Instructional Decision Making, Washington, DC: National Center for Education Evaluation and Regional Assistance, Institute of Education Sciences, U.S. Department of Education.
- Harris C. J., Krajcik J. S., Pellegrino J. W., Mcelhaney K. W., Debarger A. H., Dahsah C., et al., (2016), Constructing Assessment Tasks that Blend Disciplinary Core Ideas, Crosscutting Concepts, and Science Practices for Classroom Formative Applications Center for Technology in Learning, Menlo Park, CA: SRI International.
- Harshman J. and Yezierski E., (2017), Assessment Data-driven Inquiry: A Review of How to Use Assessment Results to Inform Chemistry Teaching, Sci. Educ., 25(2), 97–107.
- Hoffman C. K. and Medsker K. L., (1983), Instructional analysis: The missing link between task analysis and objectives, J. Instr. Dev., 6(4), 17–23.
- Irons A., (2008), Enhancing Learning Through Formative Assessment and Feedback, New York, NY: Routledge.
- Johnstone A. H., (1991), Why is science difficult to learn? Things are seldom what they seem, J. Comput. Assist. Learn., 7(2), 75–83.
- Jonassen D. H., Tessmer M. and Hannum W. H., (1999), Task Analysis Methods for Instructional Design, Mahwah, New Jersey: Lawrence Erlbaum Associates.
- Kaderavek J. N., North T., Rotshtein R., Dao H., Liber N., Milewski G., et al., (2015), SCIIENCE: The creation and pilot implementation of an NGSS-based instrument to evaluate early childhood science teaching, Stud. Educ. Eval., 45, 27–36.
- Kane M., (2006), Content-Related Validity Evidence in Test Development, in Downing S. M. and Haladyna T. M. (ed.), Handbook of Test Development, Mahwah, New Jersey: Lawrence Erlbaum Associates, Inc., pp. 131–154.
- Kang H., Windschitl M., Stroupe D. and Thompson J., (2016), Designing, launching, and implementing high quality learning opportunities for students that advance scientific thinking, J. Res. Sci. Teach., 53(9), 1316–1340.
- Laverty J. T., Underwood S. M., Matz R. L., Posey L. A., Carmel J. H., Caballero M. D., et al., (2016), Characterizing college science assessments: The three-dimensional learning assessment protocol, PLoS One, 11(9), 1–21.
- Loughran J. and Brubaker N., (2015), Working with a Critical Friend: A Self-study of Executive Coaching, Stud. Teach. Educ., 11(3), 255–271.
- Lyon E. G., (2011), Beliefs, Practices, and Reflection: Exploring a Science Teacher's Classroom Assessment Through the Assessment Triangle Model, J. Sci. Teacher Educ., 22(5), 417–435.
- Mandinach E. B., Honey M. and Light D., (2006), A Theoretical Framework for Data-Driven Decision Making, Pap. Present. Annu. Meet. AERA, 1–18.
- Martone A. and Sireci S. G., (2009), Evaluating Alignment Between Curriculum, Assessment, and Instruction, Rev. Educ. Res., 79(4), 1332–1361.
- Marzano R. J. and Kendall J. S., (2008), Designing & assessing educational objectives: applying the new taxonomy, in Scott M. P. and Alpert D. (ed.), Thousand Oaks, California: Corwin Press.
- Maxwell J. A., (2013), Qualitative Research Design: An Interactive Approach, in Knight V. (ed.), 3rd edn, Thousand Oaks, California: SAGE Publications.
- McDonald F. J., (1964), Meaningful Learning and Retention: Task and Method Variables, Rev. Educ. Res., 34, 530–544.
- Means B., Chen E., Debarger A. and Padilla C., (2011), Teachers’ Ability to Use Data to Inform Instruction: Challenges and Supports, Washington, DC: Office of Planning, Evaluation and Policy Development, US Department of Education.
- Merrill M. D., (2007), A Task-Centered Instructional Strategy, J. Res. Technol. Educ., 40(1), 5–22.
- Nakhleh M. B., (1992), Why some students don’t learn chemistry: Chemical misconceptions, J. Chem. Educ., 69(3), 191.
- National Research Council, (1999), The Assessment of Science Meets the Science of Assessment: Summary of a Workshop, Washington, DC: The National Academies Press.
- National Research Council, (2001), in Pelligrino J., Chudowsky N. and Glaser R. (ed.), Knowing what students know: The science and design of educational assessment, Washington, DC: National Academy Press.
- National Research Council, (2014), Developing Assessments for the Next Generation Science Standards, Washington, DC: The National Academies Press.
- Patton M. Q., (2002), Qualitative Evaluation and Research Methods, Newbury Park, CA: SAGE Publications, Inc.
- Penuel W. R., Turner M. L., Jacobs J. K., Horne K. and Sumner T., (2019), Developing tasks to assess phenomenon-based science learning: Challenges and lessons learned from building proximal transfer tasks, Sci. Educ., 103(6), 1367–1395.
- Polikoff M. S. and Porter A. C., (2014), Instructional Alignment as a Measure of Teaching Quality, Educ. Eval. Policy Anal., 36(4), 399–416.
- Porter A. C. and Smithson J. L., (2001), Defining, developing, and using curriculum indicators. CPRE Research Report Series, Philadelphia, PA: Consortium for Policy Research in Education.
- Praetorius A. K., Pauli C., Reusser K., Rakoczy K. and Klieme E., (2014), One lesson is all you need? Stability of instructional quality across lessons, Learn. Instr., 31, 2–12.
- Remesal A., (2011), Primary and secondary teachers’ conceptions of assessment: A qualitative study, Teach. Teach. Educ., 27(2), 472–482.
- Rothman R., Slattery J. B., Vranek J. L. and Resnick L. B., (2002), Benchmarking and Alignment of Standards and Testing, (CSE Technical Report No. CSE-TR-566), Los Angeles, CA.
- Ruiz-Primo M. A., Li M., Wills K., Giamellaro M., Lan M. C., Mason H. and Sands D., (2012), Developing and Evaluating Instructionally Sensitive Assessments in Science, J. Res. Sci. Teach., 49(6), 691–712.
- Russell J. W., Kozma R. B., Jones T., Wykoff J., Marx N. and Davis J., (1997), Use of Simultaneous-Synchronized Macroscopic, Microscopic, and Symbolic Representations To Enhance the Teaching and Learning of Chemical Concepts, J. Chem. Educ., 74(3), 330.
- Sadler R. D., (1989), Formative assessment and the design of instructional systems, Instr. Sci., 18, 119–144.
- Sandlin B., Harshman J. and Yezierski E., (2015), Formative Assessment in High School Chemistry Teaching: Investigating the Alignment of Teachers’ Goals with Their Items, J. Chem. Educ., 92(10), 1619–1625.
- Schafer A. G. L. and Yezierski E. J., (2020a), Chemistry critical friendships: Investigating chemistry-specific discourse within a domain-general discussion of best practices for inquiry assessments, Chem. Educ. Res. Pract., 21(1), 452–468.
- Schafer A. G. L. and Yezierski E. J., (2020b), Investigating High School Chemistry Teachers’ Assessment Item Generation Processes for a Solubility Lab, Chem. Educ. Res. Pract., Advance Article.
- Stiggins R. J., (2001), The Unfulfilled Promise of Classroom Assessment, Educ. Meas. Issues Pract., 20(3), 5–15.
- Taber K. S., (2013), Revisiting the chemistry triplet: Drawing upon the nature of chemical knowledge and the psychology of learning to inform chemistry education, Chem. Educ. Res. Pract., 14(2), 156–168.
- Tomanek D., Talanquer V. and Novodvorsky I., (2008), What Do Science Teachers Consider When Selecting Formative Assessment Tasks? J. Res. Sci. Teach., 45(10), 1113–1130.
- Towndrow P. A., Tan A.-L., Yung B. H. W. and Cohen L., (2010), Science Teachers’ Professional Development and Changes in Science Practical Assessment Practices: What are the Issues? Res. Sci. Educ., 40(2), 117–132.
- Towns M. H., (2014a), Guide to developing high-quality, reliable, and valid multiple-choice assessments, J. Chem. Educ., 91(9), 1426–1431.
- Towns M. H., (2014b), Guide to developing high-quality, reliable, and valid multiple-choice assessments, J. Chem. Educ., 91(9), 1426–1431.
- Tyler R., (1949), Basic Principles of Currciulum and Instruction, Chicago, IL: University of Chicago Press.
- Vilardo D. A., MacKenzie A. H. and Yezierski E. J., (2017), Using Students’ Conceptions of Air To Evaluate a Guided-Inquiry Activity Classifying Matter Using Particulate Models, J. Chem. Educ., 94(2), 206–210.
- Wauters K., Desmet P. and Van Den Noortgate W., (2012), Item difficulty estimation: An auspicious collaboration between data and judgment, Comput. Educ., 58(4), 1183–1193.
- Webb N. L., (1997), Criteria for alignment of expectations and assessments in mathematics and science education, Res. Monogr. No. 6, (8), 1–46.
- Webb N. L., (2006), Identifying Content for Student Achievement Tests, in Downing S. M. and Haladyna T. M. (ed.), Handbook of Test Development, Mahwah, New Jersey: Lawrence Erlbaum Associates, pp. 155–180.
- Webb N. L., (2007), Issues Related to Judging the Alignment of Curriculum Standards and Assessments, Appl. Meas. Educ., 20(1), 7–25.
- Webb N. M. and Herman J., (2006), Alignment of Mathematics State-level Standards and Assessments: The Role of Reviewer Agreement CSE Report 685 Noreen Webb and Joan Herman University of California Norman Webb University of Wisconsin, Madison June 2006 National Center for Research on Eva, Los Angeles, CA.
- Young K., Lashley S. and Murray S., (2019), Influence of Exam Blueprint Distribution on Student Perceptions and Performance in an Inorganic Chemistry Course, J. Chem. Educ., 96(10), 2141–2148.
| This journal is © The Royal Society of Chemistry 2021 |