
Does the way charges and transferred electrons are depicted in an oxidation–reduction animation affect students’ explanations?
Martin H.
Cole
a,
Dana K.
Fuller
b and
Michael J.
Sanger
 *c
*c
aPhysical Sciences Department, Holyoke Community College, Holyoke, MA 01049, USA
bDepartment of Psychology, Middle Tennessee State University, Murfreesboro, TN 37132, USA
cDepartment of Chemistry, Middle Tennessee State University, Murfreesboro, Tennessee 37132, USA. E-mail: michael.sanger@mtsu.edu
First published on 14th September 2020
Abstract
This study compares students’ explanations of the oxidation–reduction reaction between silver nitrate and copper metal after viewing a chemical demonstration and one of four different particulate-level computer animations. The animations differed in the way the ionic charges were depicted (shown or omitted) and the way the transferred electrons were depicted (as discrete “e−” particles or as fuzzy electron “halos” around the metal atoms). Students viewing animations explicitly showing the ion charges were better at determining the number of electrons gained by each silver ion and lost by each copper atom and wrote more correct balanced chemical equations for the reaction than students viewing animations with charges omitted. Compared to students who viewed animations depicting the transferred electrons as halos around the metal atoms, students viewing animations depicting transferred electrons as discrete particles provided better explanations for the number of electrons gained by the silver ions and lost by the copper atoms and the relative sizes of the silver/copper atoms and their respective cations. Based on comments from student interviews, it appears that several students did not know the proper charges of the silver, copper(II), and nitrate ions and that animations showing ionic charges provided students with relevant visual information they could use to improve their pictorial models of the reaction, which led to improved student-generated balanced equations for this reaction. Student interview comments also suggested that animations depicting the transferred electrons as discrete particles provided more relevant visual images (the number of electrons being transferred between silver ions and copper atoms and the relative sizes of the metal atoms and their cations) that were not provided by animations depicting the transferred electrons as halos, and this led students to construct more accurate pictorial models of the oxidation–reduction reaction. The results of this study and previous research by our group suggest that, although showing or omitting water molecules in animations depicting simple oxidation–reduction reactions had little effect on students explanations of the oxidation–reduction process, showing ion charges and depicting transferred electrons as particles (instead of halos) led to significant improvement of students’ explanations of the oxidation–reduction process.
Introduction
Chemistry's focus on abstract concepts, along with the interrelated nature of these abstract concepts, makes learning chemistry difficult for many students (Burrows and Mooring, 2015; Loh and Subramaniam, 2018). Some of this difficulty can be attributed to the triad nature of chemistry—the interconnection between the macroscopic, particulate, and symbolic conceptual levels of the subject and the need for students to not only work proficiently at all three levels, but to also see and make connections among these levels (Tasker, 2005; Sirhan, 2007; Gilbert and Treagust, 2009; Johnstone, 2006, 2010; Talanquer, 2011). Although several content areas/concepts in chemistry have been identified as being difficult for students to learn (e.g., Sirhan, 2007, and the references within this paper), the concepts associated with oxidation–reduction reactions and electrochemistry are often listed as some of the most difficult for students to learn (Davies, 1991; Griffiths, 1994; De Jong and Treagust, 2002; Tsaparlis, 2018).Several student misconceptions in oxidation–reduction reactions and electrochemistry have been identified in the literature, including the notions that oxidation states can be assigned for molecules and polyatomic ions (Garnett and Treagust, 1992a; Brandriet and Bretz, 2014), the indirect reaction in a galvanic cell is different than the direct reaction (Sanger and Greenbowe, 1997a), the signs on the electrodes in an electrochemical cell represent electronic charges that direct the flow of electrons and ions (Garnett and Treagust, 1992a; Sanger and Greenbowe, 1997a; Schmidt et al., 2007; Loh and Subramaniam, 2018), oxidation and reduction half-reactions can occur separately and independently from each other (Garnett and Treagust, 1992a; Sanger and Greenbowe, 1997a), electricity flow causes electrolyte compounds to decompose into ions (Ogude and Bradley, 1996; Schmidt et al., 2007), free electrons can flow in aqueous solutions (Garnett and Treagust, 1992a; Sanger and Greenbowe, 1997a, 1997b; Schmidt et al., 2007; Loh and Subramaniam, 2018), positive and negative ions in an electrochemical cell carry electrons from one electrode to another (Garnett and Treagust, 1992a; Ogude and Bradley, 1996; Sanger and Greenbowe, 1997a; Schmidt et al., 2007; Loh and Subramaniam, 2018), the flow of electrons in the electrolyte solution causes the oxidation and reduction process to occur at each electrode (Loh and Subramaniam, 2018), and water molecules will not react or be electrolyzed in electrolytic cells (Garnett and Treagust, 1992b; Sanger and Greenbowe, 1997a; Tsaparlis, 2018). Several researchers have also made suggestions as to why students have difficulty learning oxidation–reduction and electrochemistry concepts, such as: The use of vague or misleading language by students and teachers in the classroom (Garnett et al., 1990; De Jong et al., 1995; De Jong and Treagust, 2002; Loh and Subramaniam, 2018) and by textbook authors (Ogude and Bradley, 1996; Sanger and Greenbowe, 1999; Özkaya, 2002; Schmidt et al., 2007), students misapplying concepts to new but inappropriate situations (Garnett et al., 1990; Loh and Subramaniam, 2018), students’ lack of appropriate prerequisite knowledge (Garnett and Treagust, 1992a; Özkaya, 2002; Tsaparlis, 2018), the use of the term/concept “electrical circuit” which causes students to think of electricity as the flow of electrons in an uninterrupted closed loop (Garnett et al., 1990; Schmidt et al., 2007; Loh and Subramaniam, 2018), the description of the “positive” and “negative” signs or poles for the electrodes in an electrochemical cell (Ogude and Bradley, 1996; Sanger and Greenbowe, 1999; Schmidt et al., 2007), and calculating the cell potential for an electrochemical cell using the “additive” method instead of the “difference” or European method (Sanger and Greenbowe, 1999; Tsaparlis, 2018). Loh and Subramaniam (2018) agreed with the Advanced Placement Chemistry Test examiner's reports from 2013 (quoted in that paper) that in order for students to truly understand the chemical processes occurring in galvanic and electrolytic cells, chemistry instructors need to teach students about these processes at the particulate level. Several chemistry education research studies, summarised by Tsaparlis (2018) and Cole et al. (2019), have also indicated that computer animations at the particulate level can be particularly effective in helping students develop and improve their conceptual understanding of electrochemistry topics.
In general, computer animations of chemical processes at the particulate level have proven effective in aiding student understanding of various chemical concepts (Williamson and Abraham, 1995; Russell et al., 1997; Sanger et al., 2000, 2001; Ardac and Akaygun, 2004; Kelly et al., 2004; Tasker and Dalton, 2006; Kelly and Jones, 2007, 2008; Sanger, 2009; Gregorious et al., 2010a, 2010b; Antonoglou et al., 2011; Williamson et al., 2012; Ryoo et al., 2018; Cole et al., 2019) and can even improve students’ spatial abilities (Williamson et al., 2013; Al-Balushi et al., 2017). Particulate-level animations have been shown to be effective in a wide variety of settings including whole classrooms (Williamson and Abraham, 1995; Russell et al., 1997; Sanger and Greenbowe, 2000; Kelly et al., 2004; Smetana and Bell, 2014; Herrington et al., 2017), small groups/pairs of students (Levy, 2013; Smetana and Bell, 2014; Yaseen, 2018), and individual students (Ardac and Akaygun, 2004; Sanger et al., 2007; Chang et al., 2014; Gregorious, 2017; Kelly et al., 2017). These animations have also been shown to be effective when they are student-generated (Chang et al., 2014; Williamson, et al., 2013; Akaygun, 2016; Yaseen, 2018) or researcher-generated (Williamson and Abraham, 1995; Russell, et al., 1997; Sanger and Greenbowe, 2000; Yang et al., 2003; Tasker and Dalton, 2006; Sanger et al., 2007; Levy, 2013; Gregorious, 2017; Kelly et al., 2017).
Both Tasker (2005) and Kelly et al. (2017) have compared student's interpretations of computer animations depicting the particulate-level behaviour of atoms, ions, and molecules in a scientifically accurate manner to animations with inaccurate or misleading visual images. Tasker (2005) included screen shots of animations created as part of the VisChem project that accurately depicted the cations and anions from an aqueous ionic salt as being separated from each other and hydrated by water molecules in the solution and compared them to screen shots of another animation depicting neutral “molecules” of HCl and NaOH existing in water that were not hydrated by the surrounding water molecules. Tasker also provided examples of student-generated images of an aqueous barium chloride solution that matched the inaccuracies shown in the second animation (barium chloride “molecules” existing in aqueous solutions; isolated barium and chloride ions not hydrated by water molecules) and suggested that the use of inaccurate visual images during instruction could lead to student misconceptions (Tasker, 2005). Kelly et al. (2017) asked students to compare an accurate animation of the oxidation–reduction reaction of silver nitrate and copper metal in which the silver ions reacted with copper metal atoms to an animation created that inaccurately depicted silver nitrate “molecules” reacting with the copper metal, making silver metal atoms and copper(II) nitrate “molecules”. Half of these students (9 of 17) indicated that they believed the animation without molecules was more scientifically accurate, but almost all students viewed both animations as being scientifically accurate and useful for students to understand the oxidation–reduction process. Even though a majority of students chose the animation without molecules as being more accurate, more students changed their self-generated images and explanations to include information consistent with the visual images depicted in the inaccurate animation than the accurate animation. Part of this could be due to the fact that the students felt more comfortable in their ability to understand the visual images in the simpler but inaccurate animation compared to the more complex visual images in the animation deemed more accurate.
Kelly and Jones (2007) and Rosenthal and Sanger (2012) provided qualitative comparisons of students’ explanations of a chemical reaction both before and after viewing two different animations of the reaction, both of which were animated to be scientifically accurate but using very different visual styles. Kelly and Jones (2007) asked students to explain the dissolving process of solid sodium chloride in water, while Rosenthal and Sanger (2012) asked students to explain the oxidation–reduction reaction occurring between aqueous silver nitrate and solid copper metal. Both studies had the same general format: students were asked to watch the macroscopic chemical demonstration and explain what was happening at the particulate level, then watch one of the animations and explain what was happening, and finally watch the second animation and explain what was happening, followed by a debriefing in which students were asked to provide their thoughts and opinions about the animations and the instructional intervention involving those animations. Both studies found that the animations helped many students improve their particulate explanations of the chemical reactions, although some misconceptions remained after viewing the animations and other new misconceptions appeared that may be the result of simplified or incorrect visual images depicted in one of the animations. Also, both sets of students overwhelmingly felt that the animations helped them understand the chemical reaction better and in greater detail (including relative atom and ion sizes), and their particulate explanations of the chemical reaction included specific comments related to the visual images they saw in these animations. Finally, both research groups indicated that students tend to interpret the visuals in animations rather literally and therefore suggested that simplifications depicting or implying incorrect concepts should be carefully avoided (Kelly and Jones, 2007; Rosenthal and Sanger, 2012).
More recently Cole et al. (2019) examined and quantitatively compared students’ explanations of the oxidation–reduction process between aqueous silver nitrate and solid copper metal after viewing two sets of particulate-level animations depicting the same chemical reaction in different ways. In the visual complexity study described in this paper, the animations viewed by the students differed in the complexity of images used to depict the reaction: the more complex animation depicted three-dimensional images and showed camera angle changes and a large number of water molecules; the more simplified animation depicted two-dimensional images with no camera angle changes and no water molecules. In addition, the more simplified animation showed ion charges, electrons as particles, and macroscopic colour changes of the blue background. Students who viewed the more simplified animation were better at identifying several key features in the oxidation–reduction reaction (a 1![[thin space (1/6-em)]](https://www.rsc.org/images/entities/char_2009.gif) :1 ratio of silver and nitrate ions, 2:1 reacting ratio of silver ions and copper atoms, size changes of the copper atom and silver ions, and the source of the blue colour in solution) and provided better explanations of the oxidation–reduction process (including the electron transfer process, the driving force of the reaction, and writing a symbolic balanced equation for the reaction) than the students who viewed the more complex animation. However, the way these two animations depicted the same reaction differed in so many aspects that it was difficult if not impossible to determine which of these differences led to the improvement of the students’ explanations of the oxidation–reduction process. In the second study presented in the Cole et al. (2019) paper, the only difference between the two animations was whether water molecules were shown or omitted in the animation. The results of this study indicated that showing or omitting water molecules from the animation did not affect students’ explanations of the oxidation–reduction process with the exception of identifying nitrate ions in the animation. Students who viewed the animation omitting water molecules were better at identifying nitrate ions in the animation than students who viewed the animation showing water molecules. As a result of this second study, the authors concluded that of the many differences in the way the visual information was presented in the more simplified and the more complex animations used in the visual complexity study, it was unlikely that showing or omitting water molecules in the animations had a significant impact on students’ explanations of the oxidation–reduction process (Cole et al., 2019).
:1 ratio of silver and nitrate ions, 2:1 reacting ratio of silver ions and copper atoms, size changes of the copper atom and silver ions, and the source of the blue colour in solution) and provided better explanations of the oxidation–reduction process (including the electron transfer process, the driving force of the reaction, and writing a symbolic balanced equation for the reaction) than the students who viewed the more complex animation. However, the way these two animations depicted the same reaction differed in so many aspects that it was difficult if not impossible to determine which of these differences led to the improvement of the students’ explanations of the oxidation–reduction process. In the second study presented in the Cole et al. (2019) paper, the only difference between the two animations was whether water molecules were shown or omitted in the animation. The results of this study indicated that showing or omitting water molecules from the animation did not affect students’ explanations of the oxidation–reduction process with the exception of identifying nitrate ions in the animation. Students who viewed the animation omitting water molecules were better at identifying nitrate ions in the animation than students who viewed the animation showing water molecules. As a result of this second study, the authors concluded that of the many differences in the way the visual information was presented in the more simplified and the more complex animations used in the visual complexity study, it was unlikely that showing or omitting water molecules in the animations had a significant impact on students’ explanations of the oxidation–reduction process (Cole et al., 2019).
The goal of this current study is to determine if students’ explanations of the oxidation–reduction process will be affected when two other variables (the way in which the ion charges are visually depicted and the way in which the transferred electrons are visually depicted) are changed but all other visual images within the animations remain unchanged.
Research questions
(1) Does showing or omitting the charges of all ions in the animation (silver, copper(II), nitrate ions) affect students’ ability to explain the oxidation–reduction process? (2) Does depicting the electrons being transferred to silver ions from copper atoms as “e−” particles or as a fuzzy cloud or halo affect students’ ability to explain the oxidation–reduction processes? (3) Is there an interaction effect between the way the ion charges and the transferred electrons are depicted on students’ explanations of the oxidation–reduction process?Theoretical framework
This study asked students to provide a particulate-level explanation and a symbolic-level balanced chemical equation after viewing a video of a macroscopic-level demonstration of the oxidation–reduction reaction between aqueous silver nitrate and solid copper metal and a single computer animation depicting the chemical reaction at the particulate level. As such, this study requires students to work with and interrelate three distinct, but related representational levels that chemists use to describe chemical reactions and other phenomena (Tasker, 2005; Johnstone, 2006, 2010; Gilbert and Treagust, 2009; Talanquer, 2011). These representational levels are the macroscopic (using visible and tangible information collected using the five senses), the particulate (using descriptions of atoms, ions, and molecules as well as their behaviours and interactions), and the symbolic (using the symbolic languages of numbers, chemical symbols, chemical formulas, balanced equations, etc.). While chemists can move effortlessly from one level to another and make meaningful connections among them all, students often have difficulty making connections between these three levels and instruction using all three levels at once can lead to cognitive overload in students (Johnstone, 2010). Often, the explicit goal in many modern chemistry classrooms is to help students improve their ability to move between the levels of chemistry described above as a way to understand the complexity of many chemical processes (Thomas, 2017), which is referred to as representational competence (Sanger, 2009). This is often the goal for using particulate-level computer animations in chemistry instruction as well (Suits and Sanger, 2013).Mayer's (2009) cognitive theory of multimedia learning indicates that multimedia presentations (such as computer animations) could be an effective educational tool in helping chemistry students make connections between the three levels and improve their conceptual understanding of chemistry. This theory was adapted from Paivio's dual-coding theory (Paivio, 1986), Baddeley's model of working memory (Baddeley, 1986) and cognitive load theory (Sweller, 1994, 1999). Mayer's cognitive theory of multimedia learning postulates that learners have two separate cognitive channels used for processing auditory (verbal) and visual (pictorial) information that each have limited processing capabilities, and that learners are actively engaged in the process of learning by attending to relevant information received, organising that information into their existing mental schema, and integrating any new knowledge with their pre-existing knowledge.
For meaningful learning to occur in a multimedia environment, Mayer (2009) asserted that the learner must be actively engaged in five cognitive processes: Selecting relevant words, selecting relevant images, organising selected words, organising selected images, and integrating word-based and image-based representations. Since the animations used in this study do not have written or spoken words in them, the specific cognitive processes that are pertinent for students in this study are the selection and organisation of relevant images in a multimedia presentation. Selection of relevant images by the learner of an animation occurs in the following manner: a picture impinges on the eyes producing a sensory image that does not require any effort on the part of the learner; this is followed by active processing at which time the learner must determine which images are important for making sense out of the animation; then the parts of the animation attended to by the learner will form a visual image base/mental representation in the working memory. During the cognitive process of organising relevant images, the mental representations in the working memory are organised into an understandable structure—a mental scheme or “pictorial model” of what was presented (Mayer, 2009). Because of the learner's limited processing capacity during the cognitive system, the learner can only select and pay attention to part of the visual images presented by the complex representations in the animation to produce his or her visual image base, and can only form a simple set of connections between the visuals in his or her image base in order to build a pictorial model. Due to these limitations, the learner is forced to judge which visual images are the most relevant for making sense of the animation and use those images to construct a simple visual mental representation that makes sense to the learner. The design of the animation, including how the visual images are presented and organised, can affect the extraneous cognitive load that the learner experiences and can overload the learner and hinder or prevent learning (Sweller, 1994; Sweller and Chandler, 1994; Clark et al. 2006; Mayer, 2009).
Furthermore, the use of visual signalling or cueing can aid learners in selecting and organising relevant visual information from a multimedia presentation. Visual cueing involves the addition of non-content visual information (e.g., arrows, distinctive colours, flashing images, etc.) to a multimedia presentation (Lin and Atkinson, 2011). As an example, Jeung et al. (1997) found that when the cognitive load associated with selecting relevant visual information from a geometry lesson was high, the addition of audio information to a visual lesson did not result in improved student performance but the addition of audio information along with flashing visual images did improve student performance. When the cognitive load associated with selecting relevant visual information from a geometry lesson was much lower, the addition of audio information improved student performance regardless of the use or omission of flashing visual images. The authors interpreted these results using cognitive load theory (Sweller, 1994, 1999) and hypothesised that the when the cognitive load of the lesson was high, the addition of audio information to the visual images was not helpful because the students were already overloaded by the visual images and had little load available to process the new audio information; they argued that the use of flashing images lowered the necessary cognitive load to interpret the visual images and this allowed the students to process the new audio information. When the cognitive load of the lesson was low, the authors hypothesised that the students were not overloaded and were able to process the new audio information regardless of whether the flashing visual images were incorporated or missing. In general, research on visual cueing (Jeung et al., 1997; Cao, 2005; Patrick et al., 2005; Schnotz and Rasch, 2005; Cook et al., 2011) indicates that visual cueing methods are successful in directing the learner's attention to (selecting) relevant information to be used in developing (organising) their mental models. Eye-tracking data collected by Ozcelik et al. (2009) demonstrated that learners who found relevant information in a multimedia lesson faster tend to spend more time processing this information compared to their peers who spent more time finding this information, and this resulted in better performance on a transfer test (and therefore, an improved pictorial model) for the more time-efficient students.
Lowe and co-workers (Lowe, 2004, 2014; Lowe and Boucheix, 2008) proposed a theory of learning from animated diagrams in response to their observation that the theoretical developments with respect to research on learning from animations lagged behind the more ubiquitous empirical research studies in this field. They also noted that learners are most susceptible to the negative affects of animation design when they are novices in the field and when the visual images being presented are complex. Unlike previous theories of learning with animations (e.g., Mayer, 2009), which focused only on the cognitive aspects, Lowe and Boucheix (2008) developed a five-phase model (the animation processing model) that addresses both the perceptual and cognitive processes, as well as bottom-up (stimulus driven) and top-down (knowledge driven) contributions required to develop a dynamic pictorial model of depicted content. Although the animation processing model has five stages, novices in the subject are heavily dependent on the use the first three phases that demonstrate the stimulus-driven bottom-up contributions to information processing. Phase 1 focuses on the learner's initial bottom-up processes in which the learner starts by processing neighbouring graphical images (often driven by the learner's opinions of the perceptual salience of these images); these processed graphical images and their behaviours/motions in the animation (called event units) serve as the raw material for Phase 2. In Phase 2 the learner starts to form regional structures known as “micro chunks” by linking the individual event units from Phase 1 into more coherent and complex structures based on similarities or perceived relationships between the event units. These micro chunks can be isolated from each other in space and time, are usually limited in scope, and are based on everyday world (i.e., not content-domain) knowledge. In Phase 3, the learner develops a comprehensive internal mental representation of the animation by bridging the often-isolated micro chunks from Phase 2 over space and time. Unlike Phase 2, Phase 3 requires the learner to exhibit domain-specific knowledge. Without this domain-specific knowledge, the learner may wrongly characterise observed behaviours and relationships based on everyday general terms, or the learner may miss visually subtle but crucial information with subsequent negative impact on their dynamic pictorial model of the animation (Lowe and Boucheix, 2008).
Methods
Overview
In this study, two sets of students were asked to view a chemical demonstration and then view a computer animation of an oxidation–reduction reaction that either showed or omitted the ion charges (‘Charges’ variable) and that either showed the transferred electrons in the oxidation–reduction process as either particles or “halos” (‘Electron’ variable). After viewing their version of the animation, students were asked to answer several conceptual questions about the oxidation–reduction process and were asked to write a balanced equation for the chemical reaction. While all students answered these questions using an online survey program, a small fraction of these students were also interviewed and audiotaped during this process. Students’ responses based on the two variables were compared quantitatively using statistical methods and qualitatively, by looking for explanatory quotes from the student interviews.Participants
College students at a comprehensive state university in the southeastern United States enrolled in first- (55.4% female and 44.6% male; average age = 22.0) and second-semester (60.0% female and 40.0% male; average age = 23.6) general chemistry courses, taught by different instructors, were recruited for this study. Students had received classroom instruction on oxidation–reduction reactions before participating in the study; the students involved in the interview process (who were taught by the last author) had received prior classroom instruction incorporating animations similar to those in this study, but none on the topic of oxidation–reduction reactions. The students who were not interviewed were asked to complete the survey during a laboratory session. Instead of completing the experiment scheduled for that day, these students were taken to a computer laboratory to complete the online survey. These participants (N = 117) received a laboratory score of 10/10 (with the permission from the laboratory coordinator); students who did not volunteer for this study performed the experiment (average scores for the laboratory reports = 9.0–9.5/10 for these classes). Students participating in the interviews were asked to complete the same online survey while they were being interviewed. Their instructor gave each interview participant (N = 29) a small amount of bonus points (10 bonus points in a class with 750 points). This research study was approved by the MTSU Institutional Review Board.Computer animations
For this study, we used the four animations depicted in Fig. 1. The animation shown in Fig. 1a was created by the third author as a 2-D particulate-level animation of the silver nitrate–copper metal oxidation–reduction reaction and was used in previous studies by our research group (Rosenthal and Sanger, 2012, 2013a, 2013b; Cole et al., 2019). This animation served as the basis for creating the other three animations, described below.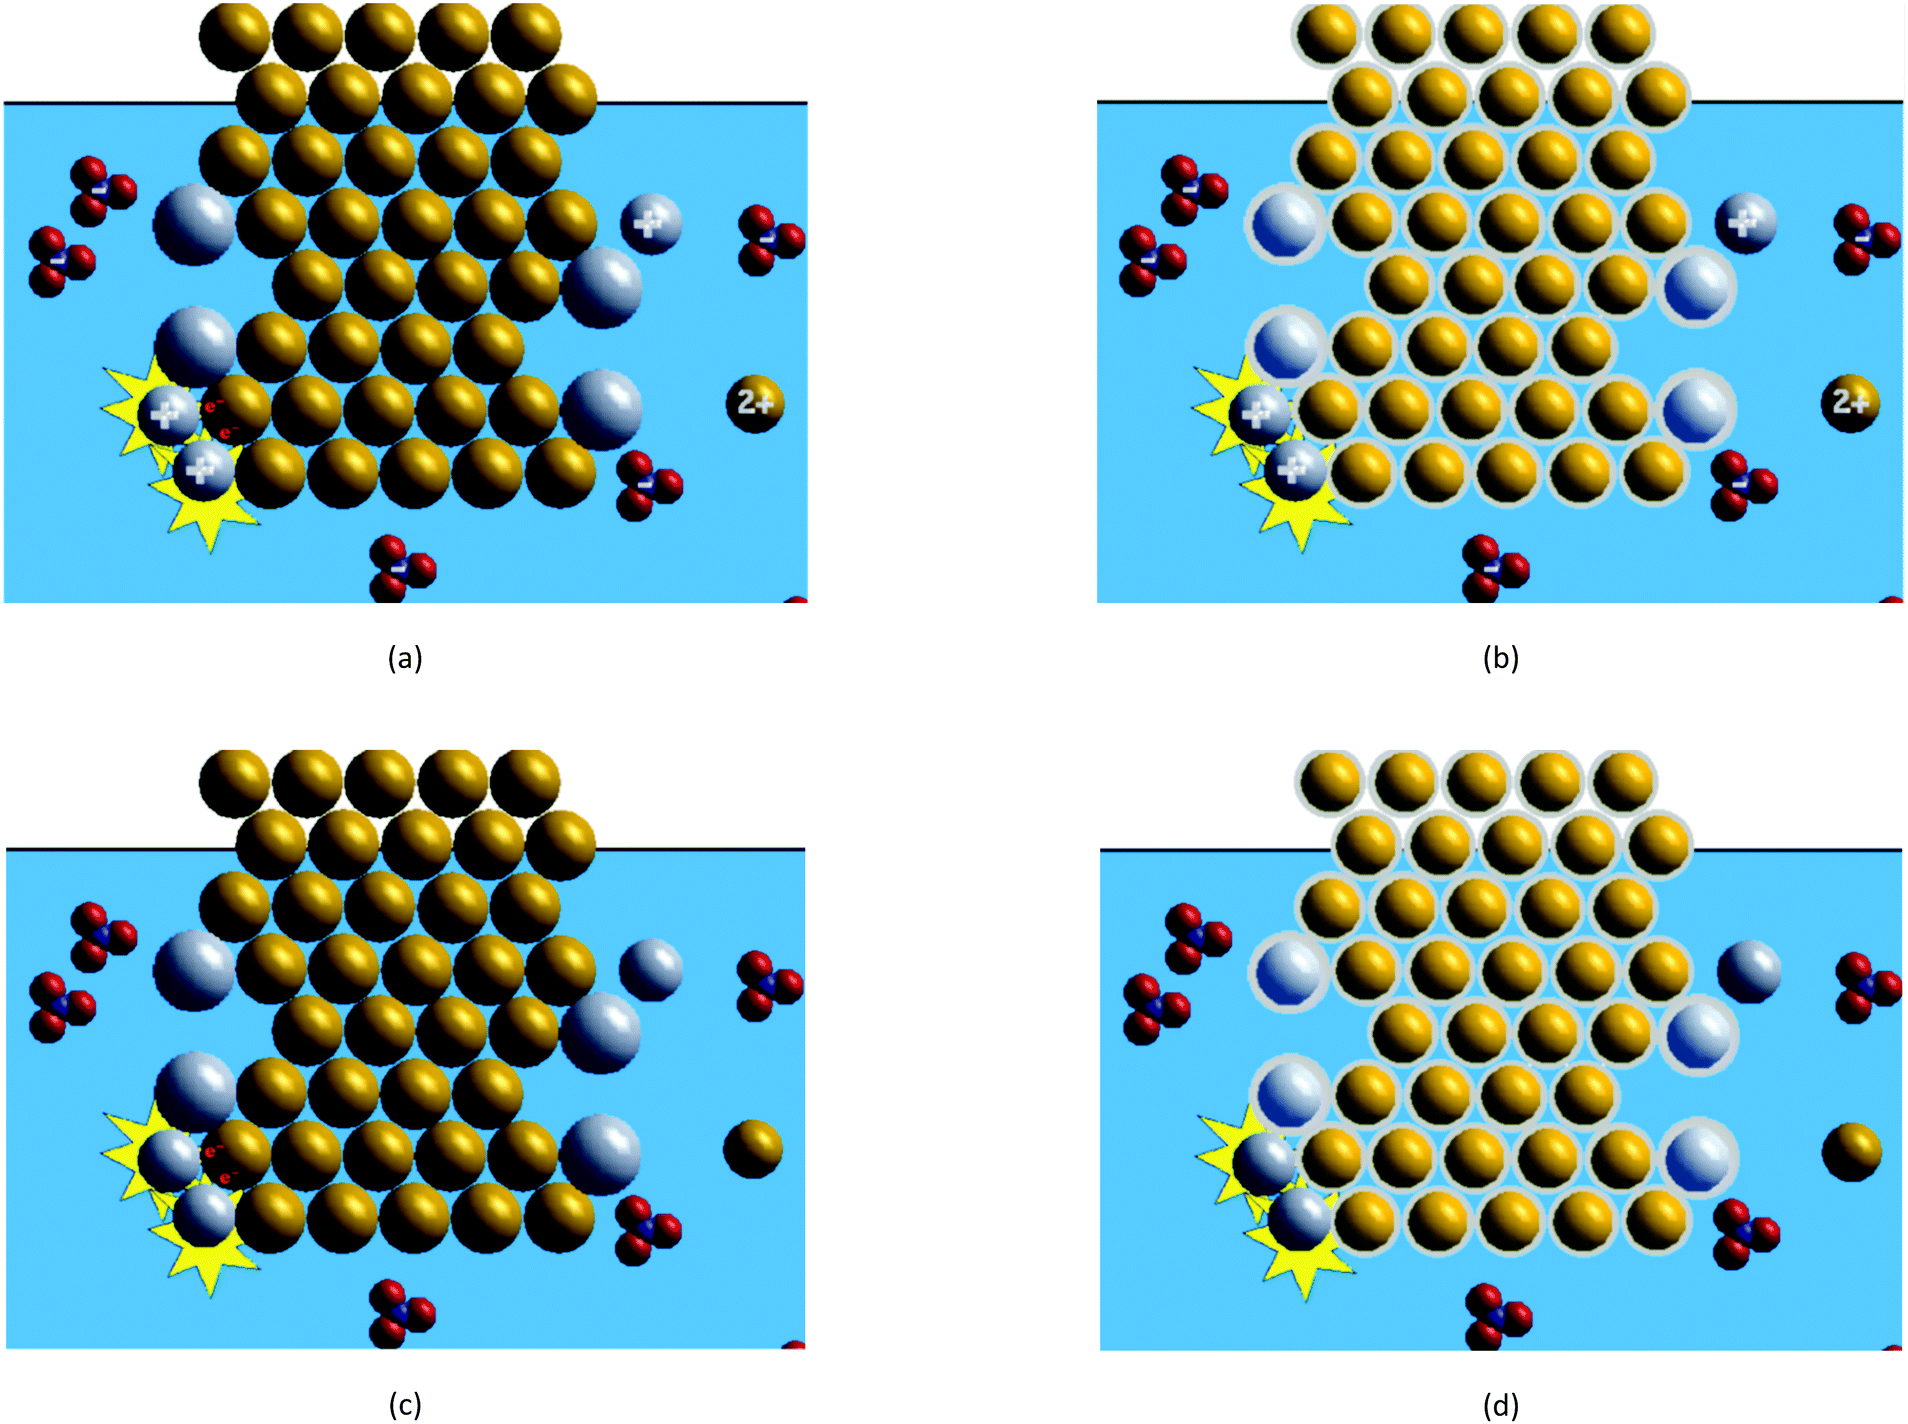 | ||
| Fig. 1 Screen shots from the four animations used in this study: (a) the animation with ion charges and transferred electrons as particles, WC_EP, (b) the animation with ion charges and transferred electrons as halos, WC_EH, (c) the animation with no ion charges and transferred electrons as particles, NC_EP, and (d) the animation with no ion charges and transferred electrons as halos, NC_EH. | ||
In this animation shown in Fig. 1a, the solid copper metal is represented by golden spheres packed together in an organised pattern. The silver ions are depicted as grey spheres with a positive (+) charge in the middle of the sphere that float in the aqueous solution represented by a blue background. The nitrate ions appear as triangular shaped molecules, consisting of one blue nitrogen sphere surrounded by three red oxygen spheres with a negative (−) charge in the middle, also floating in the blue background. When two positively charged silver ion spheres strike the same neutral copper atom sphere, a yellow “flash” appears behind the two silver ion spheres. When these three objects come in contact, two red electrons (e−) appear on the copper atom sphere and each of them is transferred from the copper atom sphere to one of the two silver ion spheres. When the electron transfer occurs, the copper atom sphere becomes smaller and positively charged (2+) and each silver sphere becomes larger and neutral (no charge). The two neutral silver atom spheres attach to the cluster of copper spheres while the positively charged copper ion sphere moves into the blue background. This process occurs four times throughout the animation; each time, the colour of the background is changed to a darker blue shade to indicate the presence of more copper(II) ions in solution. The blue/red clusters move throughout the blue background and collide with several other objects, but do not change during the animation.
All four animations depict the same chemical species (silver ions, nitrate ions, copper atoms, silver atoms, and copper(II) ions) appearing at the same time and in the same place on screen, they all run for 24 seconds, and they were all non-narrated. The four animations differ in the way that they depict the charges of the ionic species and the transferred electrons.
Two of the animations depict the charges of the silver, copper(II), and nitrate ions in the solution while the other two animations omit these ionic charges—this difference represents the ‘Charges’ variable. Two of the animations depict the electrons transferred during the oxidation–reduction process as red “e−” particles, moving from the copper atom to the silver ions; the other two animations depict the transferred electrons as light grey “halos” surrounding the copper and silver atoms. These atoms are depicted in the animation to appear lighter than their corresponding ions (an attempt to show that the halo completely surrounds the nucleus and core electrons within the atom). When the electron transfer occurs, the copper atom loses its halo and each silver ion gains a halo. This difference in the way the electrons are depicted represents the ‘Electrons’ variable.
Treatment groups
The four treatment groups in this study were based on which of the four animations the student viewed to answer the conceptual questions.• The animation in Fig. 1a shows the charges on each of the ions and shows the transferred electrons as red “e−” particles in the animation. This treatment group was labelled WC_EP (with ion charges, transferred electrons as particles) and included 7 interview and 30 non-interview students.
• The animation in Fig. 1b shows the charges on each of the ions, and the valence electrons on the silver and copper atoms are depicted as light grey outer halos. This treatment group was labelled WC_EH (with ion charges, transferred electrons as halos) and included 7 interview and 28 non-interview students.
• The animation in Fig. 1c omits the charges of the ionic species and shows the transferred electrons as red “e−” particles. This treatment group was labelled NC_EP (no ion charges, transferred electrons as particles) and included 8 interview and 29 non-interview students.
• The animation shown in Fig. 1d omits the charges of the ionic species and uses halos to depict the valence electrons transferred to the silver ions from the copper atoms. This treatment group was labelled NC_EH (no ion charges, transferred electrons as halos) and included 7 interview and 30 non-interview students.
Research instrument
For this study, the Qualtrics survey platform (Qualtrics, 2015, Provo, UT) was used to generate the online survey. This platform allowed us to embed a video of the chemical demonstration and one of the four animations from Fig. 1 within the survey and ask multiple-choice and open-response questions related to the demonstration and the animation in the survey. The questions in the research instrument (Fig. 2) used to create the online survey were adapted from the original research questions used in a previous study (Cole et al., 2019) to more explicitly address important and relevant concepts identified from that study. | ||
| Fig. 2 The research questions used in the online surveys in this study. The multiple-choice questions are marked with an asterisk; all other questions were open response. | ||
Research design
The interview and non-interview students were randomly divided into four equally sized groups. Each survey started with students watching a videotaped chemical demonstration of the silver nitrate–copper metal oxidation–reduction reaction online and answering the questions in Part 1 of the research instrument (Fig. 2). Following the video demonstration, the students were asked to watch one of the four animations and answer the questions in Part 2 of the research instrument used in the online survey. The students were permitted to view the video and animation as many times as they wanted during the online survey, but the surveys were designed so that once the students had completed the chemical demonstration portion of the survey, they could not return to it after viewing the computer animation. Once the students had answered the questions in Part 2 of the research instrument, they logged out of the Qualtrics program, and were free to leave.Interview protocol
The students who were interviewed completed the Qualtrics survey in the presence of the first and third researchers, using desktop computers in the third author's office. As these students worked through the survey, the researchers encouraged the students to clarify and elaborate on their thoughts regarding the silver nitrate–copper metal oxidation–reduction reaction. Interviews were digitally recorded and transcribed by the first author. The students who were not interviewed completed the same survey in a computer laboratory filled with other student participants and were not explicitly asked by the researchers to clarify or elaborate on their thoughts about the oxidation–reduction reaction. The semi-structured interviews lasted from 60–120 minutes; the students who were not interviewed worked on the online surveys for 20–60 minutes. It may appear that the interviewed students spent more “time-on-task” than the non-interviewed students, but most of this additional time was occupied by interview instructions and restating the questions (done by the interviewers) and student pauses to verbally articulate what they were thinking during the survey administration. The interviewed students were asked to provide their response to each question on the online survey before explaining their thought processes during the interview. When listening to the recorded interviews, we could find no instance of students changing any of their answers to the conceptual questions based on the articulations of their thoughts to the interviewers. Since it appears that the interview process did not substantially change these students’ responses, the researchers felt justified in combining the data for the interview and the non-interview participants in each of the four treatment groups.Data analysis
Student responses to the questions in Part 2 of the research instrument were obtained from the online Qualtrics survey and were analyzed by the first author. For questions 1–9, students were given a score of “1” if they provided the scientifically accepted answer; otherwise, they were given a score of “0”. Students’ answers to question 7 (the driving force of the reaction) were scored based on the categories identified for driving force in a previous publication from our research group (Cole et al., 2019)—only answers that focused on electronegativity or standard reduction potentials were given a score of “1”; all other answers were given a score of “0”. For question 10 (balanced equation), we used the same 20-point scale reported in previous research studies from our group (Rosenthal and Sanger, 2013a, 2013b; Cole et al., 2019). Several of these questions (1 and 3, 2 and 4, 5 and 6) measured similar concepts; in these cases, each student's scores for these pairs of questions were added together before performing a single statistical analysis, resulting in scores of “0”, “1”, or “2” (incorrect, partially correct, or correct).Binary logistic regression was performed for students’ responses to the single questions (scored as “0” or “1”). Multinomial logistic regression was used for the pairs of questions (scored as “0”, “1”, or “2”). Odds ratios were obtained by exponentiating the logistic regression analyses. Odds ratios below 1 were inverted prior to interpretation to facilitate understanding (Hosmer et al., 2013). A two-way analysis of variance (ANOVA) was used for the scores based on the students’ self-generated balanced equations that were scored from “1” to “20”. The depiction of charges (omitted, shown) and the depiction of transferred electrons (halos, particles) were the independent variables for all analyses. Interaction effects were also included in the models to determine if there were any interaction effects between the students’ interpretations of way the charges and the transferred electrons were depicted in each animation.
Results and discussion
Students’ responses after viewing the chemical demonstration and one of the four animations were analysed for the following concepts: determining which species gained or lost electrons, determining the number of electrons gained or lost by the silver ions and copper atoms, comparing atom and ion sizes for the same metal, explaining the driving force of the reaction, recognising a 1:1 ratio between silver ions and nitrate ions in solution, recognising a 2:1 reacting ratio between the silver ions and copper atoms, and writing a balanced equation for the reaction. Table 1 provides a summary of the logistic regression statistical analyses for all of these comparisons except the balanced equation. Although there were several significant main effects identified, none of the interaction effects were found to be statistically significant. Odds ratios and 95% confidence intervals for the main effect comparisons appear in Table 2. According to Ferguson (2009), an odds ratio greater than 3.0 (or less than 0.33) represents a moderate effect while an odds ratio greater than 4.0 (or less than 0.25) represents a strong effect for social and behavioural sciences.
| Concept | Response | Main effects | Interaction effects | ||||
|---|---|---|---|---|---|---|---|
| Ion charges (reference = shown) | Transferred electrons (reference = particles) | Ion charges × transferred electrons | |||||
| χ 2(1) value | p value | χ 2(1) value | p value | χ 2(1) value | p value | ||
| a p < 0.05 corresponds to a significant difference between students’ responses to the question(s). | |||||||
| Identifying species oxidised and reduced | Correct vs. incorrect | 0.254 | 0.614 | 0.504 | 0.478 | 0.118 | 0.732 |
| Partially correct vs. incorrect | 0.320 | 0.572 | 1.467 | 0.226 | 0.417 | 0.519 | |
| Determining the number of electrons gained or lost | Correct vs. incorrect | 4.643 | 0.031 | 3.869 | 0.049 | 0.339 | 0.561 |
| Partially correct vs. incorrect | 5.828 | 0.016 | 1.714 | 0.190 | 1.243 | 0.265 | |
| Comparing atom and ion sizes | Correct vs. incorrect | 0.167 | 0.683 | 2.695 | 0.101 | 0.003 | 0.955 |
| Partially correct vs. incorrect | 0.402 | 0.526 | 4.997 | 0.025 | 0.214 | 0.644 | |
| “Atoms and ions are the same size” (MISC) | No misc vs. two misc | 0.395 | 0.530 | 3.508 | 0.061 | 0.078 | 0.779 |
| One misc vs. two misc | 0.000 | 1.000 | 4.100 | 0.043 | 0.238 | 0.626 | |
| Identifying the reaction's driving force | Correct vs. incorrect | 0.273 | 0.601 | 0.024 | 0.876 | 0.274 | 0.601 |
| Recognising the 1:1 silver/nitrate ratio |
Correct vs. incorrect | 0.000 | 1.000 | 0.000 | 1.000 | 0.240 | 0.624 |
| Recognising the 2:1 silver/copper ratio |
Correct vs. incorrect | 0.230 | 0.632 | 0.450 | 0.502 | 0.417 | 0.519 |
| Concept | Response | Ion charge main effect (reference = shown) | Transferred electrons main effect (reference = particles) | ||
|---|---|---|---|---|---|
| Odds ratio | 95% CI for OR | Odds ratio | 95% CI for OR | ||
| a Odds ratio significantly different than 1 (p < 0.05); since the odds ratios are all less than 1, they were inverted (1/OR) to make interpretation easier in the text. | |||||
| Identifying species oxidised and reduced | Correct vs. incorrect | 1.339 | [0.430, 4.169] | 0.667 | [0.218, 2.043] |
| Partially correct vs. incorrect | 1.607 | [0.310, 8.322] | 2.500 | [0.568, 11.011] | |
| Determining the number of electrons gained or lost | Correct vs. incorrect | 0.255 | [0.074, 0.884] | 0.267 | [0.072, 0.995] |
| Partially correct vs. incorrect | 0.200 | [0.054, 0.739] | 0.424 | [0.118, 1.532] | |
| Comparing atom and ion sizes | Correct vs. incorrect | 0.778 | [0.233, 2.599] | 0.379 | [0.119, 1.207] |
| Partially correct vs. incorrect | 0.667 | [0.190, 2.334] | 0.233 | [0.065, 0.836] | |
| “Atoms and ions are the same size” (MISC) | No misc vs. two misc | 2.194 | [0.189, 25.402] | 0.210 | [0.041, 1.075] |
| One misc vs. two misc | 1.000 | [0.053, 18.915] | 0.063 | [0.004, 0.915] | |
| Identifying the reaction's driving force | Correct vs. incorrect | 0.760 | [0.271, 2.128] | 1.083 | [0.397, 2.954] |
| Recognising the 1:1 silver/nitrate ratio |
Correct vs. incorrect | 1.000 | [0.402, 2.489] | 0.997 | [0.395, 2.513] |
| Recognising the 2:1 silver/copper ratio |
Correct vs. incorrect | 0.794 | [0.310, 2.037] | 0.722 | [0.279, 1.869] |
Identifying which chemical species were oxidised/reduced
In the previous research studies from our research group based on similar oxidation–reduction animations (Rosenthal and Sanger, 2013a, 2013b; Cole et al., 2019), the students’ responses to first four questions in Part 2 of the research protocol (Fig. 2) were combined into one four-point score measuring students’ understanding of the oxidation–reduction process. In this study, we divided the oxidation–reduction process into two distinct concepts: determining which chemical species gained or lost electrons (questions 1 and 3) and determining the number of electrons gained or lost by each chemical species (questions 2 and 4). This was done to determine the effect of the ‘Charges’ and ‘Electron’ variables on students’ understanding of these two concepts.The statistical results in Table 1 show that there were no main effects based on how the charges or transferred electrons were depicted in the four animations (all p > 0.05) and that the students’ explanations for which chemicals gained or lost electrons were independent of the visual images used in the animations.
Whether the animation depicted transferred electrons as particles or as the appearance or disappearance of a halo, each method provided visual cues to students that the silver ions were gaining electrons (by gaining red “e−” symbols and a size increase, or the appearance of the electron halo) and copper atoms were losing electrons (via the loss of the red “e−” symbols and a size decrease, or the disappearance of the electron halo). Therefore, it is not surprising that how the transferred electrons were depicted did not have a significant impact on students’ answers to these questions. Showing or omitting the ions charges did not appear to provide any additional relevant or distracting information that affected students’ answers either. In general, it appears that students were able to organise the visual images used by the four animations into comparable pictorial models of the direction of electron flow in this reaction (Mayer, 2009).
How many electrons were lost/gained
Students’ responses regarding how many electrons were gained or lost during the reaction (questions 2 and 4), on the other hand, showed a significant effect based on how the animations depicted charges and how they depicted the transferred electrons. Students whose animations depicted ion charges had 3.92 times greater odds of providing correct and 5.00 times greater odds of providing partially correct answers than those students whose animations omitted ion charges. Students whose animations depicted transferred electrons as particles had 3.74 times greater odds of providing correct answers than students whose animations depicted transferred electrons by the appearance or disappearance of a halo.Students’ interview comments were analysed to explain why students viewing animations depicting ion charges were better at determining the number of electrons gained or lost by the silver ions and copper atoms than students viewing animations that omitted ion charges.
The comments below showed that this student used the depicted ion/atom charges of silver and copper to determine the number of electrons gained or lost by the two reactants.
Online Survey (Part 2): 2. How many electrons does each silver ion lose or gain? Enter a number below:
WC_EH Student: One because it's going from plus one to neutral… Copper… It loses electrons. And it loses two electrons
Interviewer: So can you see it losing electrons in the animation?
WC_EH Student: Yes, well… I mean… We see the charge changing. Yes.
Interviewer: Ok, so you don’t actually see the electrons…
WC_EH Student: Coming off, no.
Interviewer: But you can determine it because…
WC_EH Student: The change in the charge.
For this student viewing an animation omitting the ion charges, the first step the student took in trying to determine the number of electrons silver gained was to relate it back to the charges of the silver and copper ions, but the student was unsure of the charges of the silver and copper ions.
Interviewer: Can we tell how many electrons it's [silver ion] gained or lost?
NC_EH Student: From the video?
Interviewer: Yeah.
NC_EH Student: Um. Doesn’t the charge have to [do] with it? Like…
Interviewer: Mm-hmm.
NC_EH Student: Aren’t they both like 2+? Isn’t A… isn’t silver and copper 2+?
Interviewer: Ok, let's go with that and see if that helps us.
NC_EH Student: So it would be two [the number of electrons silver gained].
Based on these student comments, it appears that the animations showing ion charges provided additional visual information (ion charges) needed by students to successfully determine the number of electrons gained or lost, which allowed these students to develop a better pictorial model of the electron transfer process that might not be possible without this visual information (Mayer, 2009). For many students viewing the animations omitting ion charges, they were missing this information and instead had to rely on pre-existing (and in this case, faulty) domain-specific knowledge in order to interpret the animations without the ion charges depicted (Lowe and Boucheix, 2008; Lowe, 2014). The lack of appropriate prerequisite knowledge has been identified as one reason why students have difficulty learning oxidation–reduction concepts (Garnett and Treagust, 1992a; Özkaya, 2002; Tsaparlis, 2018).
Students who viewed animations depicting transferred electrons as particles were also better able to determine the number of electrons gained or lost than those who viewed animations depicting transferred electrons as the appearance or disappearance of a halo. Students viewing the electron particles were able to actually see the number of electrons gained or lost during the reaction because of the red “e−” symbols moving from the copper atom to the silver ions.
Some students who viewed animations depicting the transferred electrons as halos had a bit of difficulty determining how many electrons were transferred during this reaction. The student making the comments below hadn’t been given the charges of the metal ions or the number of electrons transferred (as the little red “e−” symbols), and without this information, the student was stuck. The student did notice the 2:1 reacting ratio of the silver ions and copper atom, but the student didn’t know what to do with that information.
NC_EH Student: I mean they [silver ions] have a reaction when they… when they reach the copper… So it's doing something. I’m just not too sure what it's doing.
Interviewer: And how do you see that in the animation?
NC_EH Student: Because it's… it does a little reaction [yellow flash] when it [silver ion] touches the copper… I think there's definitely a change because why would it have a little reaction [flash] when it hits. I think something changes. Well if the copper is losing something then I would think the silver was gaining something. I’m not completely…
Interviewer: And do you think that the loss and gain are electrons?
NC_EH Student: Possibly. So, I just wouldn’t know how many. I… So silver is gaining, so copper would be losing. Losing yeah. And… how many? I mean one of those guys is floating off for every two silver, but I don’t know what that means.
Interviewer: So do you think the two-to-one ratio is important?
NC_EH Student: Yes. I… I’m assuming it means that it has… it needs, ah, two silvers to make up for one copper, but…
The animations depicting the transferred electrons as particles explicitly show two red “e−” particles transferred to the silver ions from the copper atom, and students viewing this animation were able to use this information to develop a better visual pictorial model of the electron transfer process (Mayer, 2009). The animations depicting the transferred electrons as the appearance or disappearance of a halo, however, do not explicitly quantify the number of electrons transferred in this reaction, leaving out visual information that students could use to figure out the number of electrons transferred to the silver ions from the copper atom (Garnett and Treagust, 1992a; Özkaya, 2002; Tsaparlis, 2018). Based on this result, it appears that an important difference between depicting the transferred electrons as particles or halos is that depicting the transferred electrons as particles provided quantitative information that was not provided by the use of halos. As a result, students viewing the animations with halos were provided with less visual information and, missing this relevant information, were forced to rely on (often inaccurate) pre-existing domain-specific content knowledge to interpret the visual images within these animations (Lowe and Boucheix, 2008; Lowe, 2014).
The positive effect of providing relevant visual information (ion charges and the number of transferred electrons) on students’ explanations of the number of electrons gained or lost in this study may also have been enhanced by the use of visual cues in all four animations (Lin and Atkinson, 2011). In this study, visual cueing took the form of yellow-coloured “flashes” (appearing in the bottom left of each of the four animation screenshots in Fig. 1) highlighting the site where the reaction between the stationary copper atom and the incoming silver ions occurred in each animation.
So, why would the use of visual cueing that was identical in the four animations show differential effects on the students’ abilities to determine how many electrons were transferred to the silver ion from the copper atom? It is likely that in all four animations, the yellow flashes on the copper surface did help direct students’ attention to the images of the incoming silver ions and the stationary copper atom. When these animations depicted relevant information in this highlighted area (e.g., the changes in charges on the silver and copper species or the number of transferred electrons moving to the silver ions from the copper atom), then the students were more likely to pay attention to this relevant information and incorporate it into their pictorial model, yielding more correct responses. However, when these animations did not depict relevant information in this highlighted area (by omitting ion changes or by showing the electron transfer process as the appearance or disappearance of non-quantitative halos), even students who were paying more attention to this particular site in the animation did not receive additional relevant information, did not adapt their pictorial model to incorporate this information, and therefore did not provide more correct responses.
Comparing atom and ion sizes
Students’ responses for the relative sizes of atoms and ions indicated no significant difference among students whose animations showed or omitted ion charges. However, students whose animations depicted transferred electrons as particles had 4.28 times greater odds of providing a partially correct answer (as opposed to an incorrect answer) when determining relative atom and ion sizes than those students whose animations depicted the electron transfer through the appearance and disappearance of halos. The animations depicting transferred electrons as red “e−” symbols (Fig. 1a and 1c) represented the silver and copper atoms as solid spheres that are the same colour as the silver and copper ions, only larger. The animations depicting the outer electrons as halos (Fig. 1b and d), on the other hand, kept the size of the nucleus and core electrons the same, and added or removed the halo to make atoms or ions (respectively). The difficulty some students had is that they were not sure whether they should include the halo in the size of the atoms or not (Rosenthal and Sanger, 2012).Students viewing animations with the electron particles and explicit size changes did not seem to have difficulty in correctly comparing the sizes of the metal atoms and ions depicted in the animations. However, some students viewing animations with the electron halos incorrectly assumed that the halos did not affect the atom size, and therefore they expected the sizes of the metal atom and its ion to be the same. Interestingly, this student (and others in the interview pool) suggested that the reason the metal atom and ions are about same size is that electrons themselves are very small in mass or volume, and therefore shouldn’t affect the atom's or ion's sizes appreciably.
WC_EH Student: Which is bigger [copper ion or copper atom]…? They look about the same. Yeah, there is not very much space in an electron though, so… Ha. They’re about the same.
The statistical analysis for the “Comparing atom and ion sizes” in Tables 1 and 2 compared the number of correct responses (metal atoms are bigger than their cations) from students viewing the four animations; however, we were also interested in comparing the number of students providing responses consistent with the common misconception that the metal atoms and their cations are the same size. This is the next entry in Tables 1 and 2; for this analysis, students were given a score of “0” for the misconception that the sizes would be the same and a score of “1” if they said the atoms and ions would not be the same size. Students who viewed animations showing transferred electrons as particles had 16.01 times greater odds of demonstrating the misconception once rather than twice compared to students viewing animations showing transferred electrons as halos. In other words, students whose animations showed the transferred electrons as halos were more likely to consistently demonstrate the misconception compared to students whose animations showed the transferred electrons as particles.
These results are consistent with previous research done using more simplified and more complex animations of the same oxidation–reduction reaction (Cole et al., 2019). In this previous study, students viewing the more simplified animation (Fig. 1a), which depicted transferred electrons as particles, were better able to recognise the relative sizes of metal atoms and their ions than students viewing the more complex animation that depicted the valence electrons as halos, similar to Fig. 1b and d. This present study also supports our prior assertion (Cole et al., 2019) that students’ difficulties in answering questions related to atom and ion sizes after viewing the more complex animation stemmed from the way the valence electrons were depicted as halos in this animation. Students who viewed the transferred electrons as particles and as halos in the present study both described how their animation depicted the atom/ion sizes, so it does not appear that the different explanations from the two groups was based on a difference in selecting relevant images (Mayer, 2009). Instead, it appears that these differences were due to the way the two groups interpreted and organised these different selected images into their pictorial models. Although both methods of depicting valence electrons can be viewed as accurate and defensible, these studies have shown that students have fewer difficulties interpreting the images in terms of atom and ion sizes when the valence electrons are depicted as part of the atom's overall shape. However, it is entirely possible that the halo version of the atoms may be more helpful to students in explaining other behaviours of the atoms and ions.
Since showing or omitting ion charges did not affect how the relative sizes of the metal atoms and ions were depicted in these animations, we would not have expected there to be a significant main effect based on how the charges were depicted. These results suggest that adding or omitting ion charges did not provide any useful or detrimental information that affected students’ answers related to atom and ion sizes.
Identifying the reaction's driving force
Student responses in identifying the reaction's driving force were not significantly different when ion charges were shown or omitted in the animations or when transferred electrons were depicted as particles or as halos. In a previous study comparing students’ interpretations of more simplified and more complex animations of the same oxidation–reduction reaction (Cole et al., 2019), we found that students viewing the more complex animation were more likely to incorrectly assume that water molecules or nitrate ions were driving this reaction to occur. This was likely due to the fact that students had misinterpreted the more complex animation as suggesting that the water molecules depicted in the animation (sometimes misinterpreted by students as nitrate ions) were pulling the silver ions to the copper surface, and pulling copper(II) ions away from the copper surface (Tasker, 2005; Tasker and Dalton, 2006; Cole et al., 2019). These misinterpretations did not happen with the more simplified animation because there were no water molecules depicted in this animation. Since all four animations in this study did not depict water molecules and did not show the nitrate ions directly interacting with any of the metal cations, none of these animations should have affected students’ explanations of the driving force for this reaction.Recognising the 1![[thin space (1/6-em)]](https://www.rsc.org/images/entities/h3_char_2009.gif) :1 silver/nitrate ion ratio
:1 silver/nitrate ion ratio
Student recognition of the 1:1 silver/nitrate ion ratio before the reaction started also showed no significant difference when ion charges were depicted or omitted in the animations or when transferred electrons were depicted as particles or halos. All four animations in this study showed a 1:1 silver/nitrate ratio and were animated to have equal positive and negative charges in each screen shot. Since the number and type of cations and anions shown in each frame of the four animations were identical, there should be no reason to assume that changing how the charges or the transferred electrons were depicted would affect students’ responses to this question.
Recognising the 2:1 silver/copper ratio
As with the previous concept, there was no significant difference in student recognition of the 2:1 silver ion/copper atom reacting ratio when charges were shown or omitted in the animations or when the transferred electrons were depicted as particles or halos. All four animations in this study showed two silver ions reacting with one copper atom at the same time and at the same place on the copper surface. Since all four animations showed the oxidation–reduction reaction occurring in the same way, and happening at the same time and place, it makes sense that changing how the charges or the transferred electrons were depicted in the animations would not affect students’ responses to this question.
Writing a balanced equation for the reaction
Students whose animations depicted charges were significantly better at writing the balanced equation for the silver nitrate–copper metal reaction than students whose animations did not depict charges (13.195/20 for the students whose animations showed charges vs. 10.649/20 for students whose animations did not show charges, F(1, 142) = 5.149, p = 0.025, ηP2 = 0.035). Although this difference is classified as a small effect (defined as 0.01 < ηP2 < 0.06 by Cohen, 1988), it represents a difference in the average score for these two groups of just over one letter grade (53% vs. 66%). There was no significant difference in students’ abilities to write the balanced equation for the reaction based on whether the transferred electrons were depicted as particles or halos (F(1, 142) = 0.035, p = 0.851) and there was no interaction effect based on the two variables (F(1, 142) = 2.512, p = 0.115).These results are consistent with student quotes from the interviews before viewing the animations, which showed that most students started balancing the equations based on the charges of the atoms and ions in the equation.
NC_EP Student: Ok, do I need to put the charges and subscripts down? Can’t remember. Ag. I guess they are three-minus aren’t they? Both of them three-minus?
Interviewer: What are you having trouble with?
NC_EP Student: Just the charges on the stuff. So the solid [metal] forms would be neutral, I think, so.
Interviewer: So then… You’re not really sure about the charge on silver or nitrate, copper or nitrate in the products?
NC_EP Student: Yeah. We’ll call them neutral.
Interviewer: How confident are you about… that this [is] the right answer.
NC_EP Student: Ah, I’m really confident that this is the equation. As far as charges, I’m not sure at all.
Writing the balanced equation if the charges of all species were not known also negatively impacted some students who viewed animations without ion charges. In the following quote, the student determined that the nitrate ions were negative and the silver ions were positive. However, the student incorrectly guessed that the charge on the copper ion was two-minus, which made the charge of ‘CuNO3’ three-minus.
Interviewer: What are the charges on each of the objects in your equation? What's the charge of nitrate?
NC_EP Student: Negative. So [the] silver [ion] would probably be positive.
Interviewer: So then what about copper? So, in the copper nitrate what's the charge on copper then?
NC_EP Student: That would be… two-minus. Then, hmm… That means it's [CuNO3] three-minus.
Interviewer: Is that good, bad?
NC_EP Student: Well, if it's minus-three here wouldn’t it have to be minus-three on the left side as well in the reactant's side?
Interviewer: Ok… You’re putting a minus-three on copper [metal reactant] to balance the equation…
NC_EP Student: Yes.
Interviewer: Is that what copper… Is that what you think copper should have?
NC_EP Student: I’m not sure.
Interviewer: Ok. So, has the animation sort of changed your idea of the reaction?
NC_EP Student: Yes.
Interviewer: Um, has it made you more or less confident in your answer?
NC_EP Student: Less confident.
Students who viewed animations that showed the ion charges, on the other hand, had less difficulty in writing the balanced equation, and often mentioned the animation as being helpful in making any needed changes. The following quote shows that this student changed the formula for copper nitrate from CuNO3 after viewing the chemical demonstration to Cu(NO3)2 after viewing the animation showing ion charges.
Interviewer: So how did your equation change?
WC_EP Student: Well we changed the equation of copper… nitrate.
Interviewer: The formula for copper nitrate?
WC_EP Student: Yeah. We changed it because the NO3 is a negative-one charge. And then ah, but copper(II) since it was…
Interviewer: The copper was plus-two?
WC_EP Student: Yeah. And that was like determined from the video.
Interviewer: Ok.
WC_EP Student: At least for me, but then like once, yeah, we changed it [copper nitrate formula to Cu(NO3)2] and the equation on the ah, like the products side we had to balance out the equation so it changed everything.
Students viewing animations showing ion charges were able to write a more accurate balanced equation for the overall oxidation–reduction reaction. These quotes demonstrate that determining the chemical formulas of the reactants and products (based on atom and ion charges) seems to be the starting point for many students when writing the overall equation for this reaction. In general, it appears that the animations showing ion charges provided students with visual information (Mayer, 2009) needed to successfully determine the formulas of the ionic compounds in the reaction and that helped these students in converting the particulate information presented by the animation into the symbolic formulas needed for the balanced equation (Johnstone, 2006, 2010). Unfortunately, students who viewed animations without ion charges were not given this relevant information and instead were forced to use their pre-existing domain-specific content knowledge regarding these charges (that may or may not be correct) to create these symbolic formulas as part of their balanced chemical equations (Lowe and Boucheix, 2008; Lowe, 2014).
Conclusions
This study compared students’ explanations of the silver nitrate–copper metal oxidation–reduction process after viewing a single animation that differed in how the ion charges and the transferred electrons were visually represented. Students viewing animations that showed the ion charges were better at determining the number of electrons gained or lost by silver and copper and provided more accurate balanced chemical equations for the oxidation–reduction reaction compared to students viewing animations that did not show the ion charges. When the transferred electrons in the animations were depicted as red “e−” particles, students provided more correct responses for how many electrons were gained or lost by silver and copper and for the relative sizes of the silver and copper atoms and their respective cations compared to students viewing animations depicting the transferred electrons as a “halo of fuzziness” on the silver and copper metal atoms. The fact that there were no significant interaction effects suggests that how the students interpreted the visual images for the two variables (ion charges or transferred electrons) was independent of and unrelated to each other. Some of the concepts where no significant differences were found (e.g., recognising the 1:1 silver/nitrate ratio and the 2:1 silver/copper ratio) could be answered by students using the visual images that were identical in the four animations and therefore these non-significant results were not surprising.
Student comments from the interviews showed that depicting the ion charges provided students with useful information that they were able to use to determine the number of electrons gained or lost by these species in the oxidation–reduction reaction (by focusing on the changing charges of the silver ions and the copper atom) and to write the correct reactants and products in the balanced equation (by using the ion charges to get the proper formulas for silver nitrate and copper(II) nitrate). Student interview comments also indicated that depicting the transferred electrons as particles provided students with useful information not available from the depictions of the transferred electrons as halos that they were able to use to determine the number of electrons gained or lost by silver and copper in the oxidation–reduction reaction (by counting the number of red “e−” particles being gained by the silver ions and lost by the copper atom) and the relative sizes of the metal atoms and their respective ions (by noticing the explicit size change instead of needing to intuit that gaining or losing a halo represented a size change).
The superiority of the electron-particle images over the electron-halos and of showing ion charges over omitting them can be explained by Mayer's cognitive theory of learning (Mayer, 2009) and the animation processing model (Lowe and Boucheix, 2008; Lowe, 2014). According to Mayer's (2009) theory, which is based in part on cognitive load theory (Sweller, 1994; Sweller and Chandler, 1994), viewers of a non-narrated multimedia presentation must organise the viewed images into an understandable structure (mental representation). Based on the results of this study, it appears that animations depicting the ion charges and the red “e−” particles provided students with more relevant information to correctly construct their explanations of the oxidation–reduction process and the balanced equation for the reaction compared to the animations omitting the ion charges or using the electron-halo images. In the animation processing model (Lowe and Boucheix, 2008; Lowe, 2014), learners working to integrate internal mental models in space and time (stage 3 of this model) are largely dependent on their own domain-specific knowledge to help them refine their mental model without misinterpreting information presented in the animation or focusing on irrelevant but flashy perceptual cues. Student interview quotes reported in this study indicate that several students were lacking basic chemistry facts (e.g., the correct charges of the silver, copper(II), or nitrate ions; the number of electrons gained by a silver ion or lost by a copper atom in this reaction; etc.) that were depicted in the animations showing ion charges or the electrons as particles but were not present in the animations that omitted ion charges or showed electrons as halos. As a result, students lacking these basic facts could learn them by viewing the animations showing ion charges or the electrons as particles but they were forced to use their (possibly faulty) existing domain-specific knowledge when viewing the animations omitting ion charges or showing electrons as halos. These results are also consistent with other chemistry education research that identified students’ lack of appropriate prerequisite knowledge as a reason why students have difficulty learning oxidation–reduction and electrochemistry concepts (Garnett and Treagust, 1992a; Özkaya, 2002; Tsaparlis, 2018).
Other chemistry education researchers studying student misconceptions in oxidation–reduction and electrochemistry topics have noted that the use of vague or misleading language in the classroom (Garnett et al., 1990; De Jong et al., 1995; De Jong and Treagust, 2002; Loh and Subramaniam, 2018) and chemistry textbooks (Ogude and Bradley, 1996; Sanger and Greenbowe, 1999; Özkaya, 2002; Schmidt et al., 2007) can lead to student difficulties and misconceptions in learning these topics. The results of this study supports the conclusions of other researchers (Tasker, 2005; Kelly and Jones, 2007; Rosenthal and Sanger, 2012; Kelly et al., 2017) that these difficulties also apply to misleading visual images used in computer animations. Tasker (2005) and Kelly et al. (2017) demonstrated that, when presented with inaccurate visual images, students tend to accept these visual images at face value and do not question their authenticity or accuracy, especially when these images play into common (and perhaps pre-existing) misconceptions known to be popular among students. As a result, many of these students will incorporate the inaccurate information depicted by these visual images into their mental representations, resulting in incorrect knowledge or misconceptions. Kelly and Jones (2007) and Rosenthal and Sanger (2012) found that, even when only presented with visual images consistent with scientifically-accepted explanations, some students still misinterpreted the accurate visual images. These researchers noted that students often misinterpreted both visual images that were simplified to make them less distracting (Kelly and Jones, 2007; Rosenthal and Sanger, 2012) and visual images that were not simplified and appeared rather visually complex (Rosenthal and Sanger, 2012). These results, along with those found in this study, suggest that animators should avoid using inaccurate visual images whenever possible, animators should be careful when simplifying visual images, and that even accurate visual images should be scrutinised for how they may be interpreted by the students viewing them.
Our research group has been studying how students interpret the visual images depicted in different particulate-level animations showing the oxidation–reduction reaction of silver nitrate and copper metal (Rosenthal and Sanger, 2012, 2013a, 2013b; Cole et al., 2019). The results of these particular research studies have shown that: Students’ explanations for the oxidation–reduction process were better when viewing a more simplified animation rather than a more complex but realistic animation (Cole et al., 2019); showing or omitting water molecules in the aqueous solution of the animations had little to no effect on students’ explanations of the oxidation–reduction process (Cole et al., 2019); showing the charges on the silver, copper(II), and nitrate ions improved students’ explanations of the oxidation–reduction process (this study); and showing the transferred electrons as discrete particles (instead of as an outer halo on the metal atoms) improved students’ explanations of the oxidation–reduction process (this study).
Future studies
This study was performed using animations without narrations; it is possible that including narrations in these animations could lead to different research results. Although several theories of learning from visuals/multimedia (Baddeley, 1986; Paivio, 1986; Mayer, 2009) suggest that students will learn better with visual and verbal information (narrated animations) than from visual information alone (non-narrated animations), research by Jeung et al. (1997) found that if the cognitive load of selecting relevant visual images was high enough, the addition of written or spoken verbal information will not improve students’ performance but if the cognitive load of selecting relevant visual images was relatively low, the addition of written or spoken verbal information will improve students’ performance. Therefore, a study comparing students’ explanations after viewing narrated vs. non-narrated animations of the silver nitrate–copper metal oxidation–reduction reaction could shed some light on the extent of the cognitive load for organising relevant images in these animations. We also observed that when students wrote a balanced chemical equation for a simple oxidation–reduction reaction based on the particulate animations, they started with the initial and final charges of the reactants and products instead of looking at the number of electrons transferred during the oxidation–reduction process. To our knowledge, no other chemistry education researchers have looked at how students decide to write symbolic oxidation–reduction reactions (either based on a macroscopic chemical demonstration or a particle drawing or animation). It might be useful to perform a study asking student to describe the process used to write oxidation–reduction reactions, given a chemical demonstration or a particulate drawing (or animation), in order to help instructors better understand how students write these oxidation–reduction reactions and the types of difficulties these students encounter.Conflicts of interest
There are no conflicts to declare.References
- Akaygun S., (2016), Is the oxygen atom static or dynamic? The effect of generating animations on students' mental models of atomic structure, Chem. Educ. Res. Pract., 17, 788–807.
- Al-Balushi S. M., Al-Musawi A. S., Ambusaidi A. K. and Al-Hajri F. H., (2017), The effectiveness of interacting with scientific animations in chemistry using mobile devices on grade 12 students’ spatial ability and scientific reasoning skills, J. Sci. Educ. Technol., 26, 70–81.
- Antonoglou L. D., Charistos N. D. and Sigalas M. P., (2011), Design, development and implementation of a technology enhanced hybrid course on molecular symmetry: Students' outcomes and attitudes, Chem. Educ. Res. Pract., 12, 454–468.
- Ardac D. and Akaygun S., (2004), Effectiveness of multimedia-based instruction that emphasizes molecular representations on students’ understanding of chemical change, J. Res. Sci. Teach., 41, 317–337.
- Baddeley A. D., (1986), Working memory, Oxford: Oxford University Press.
- Brandriet A. R. and Bretz S. L., (2014), Measuring meta-ignorance through the lens of confidence: examining students’ redox misconceptions about oxidation numbers, charge, and electron transfer, Chem. Educ. Res. Pract., 15, 729–746.
- Burrows N. L. and Mooring S. R., (2015), Using concept mapping to uncover students’ knowledge structures of chemical bonding concepts, Chem. Educ. Res. Pract., 16, 53–66.
- Cao Y., (2005), Cueing strategies and instructional message design, in Simonson M. and Crawford M. (ed.), 2005 Annual Proceedings – Orlando: Volume #2, National Convention of the Association for Educational Communications and Technology, pp. 131–142, Retrieved from: https://files.eric.ed.gov/fulltext/ED499963.pdf.
- Chang H.-Y., Quintana C. and Krajcik J., (2014), Using drawing technology to assess students’ visualizations of chemical reaction processes, J. Sci. Educ. Technol., 23, 355–369.
- Clark R. C., Nguyen F. and Sweller J., (2006), Efficiency in learning: Evidence-based guidelines to manage cognitive load, San Francisco: Pfeiffer.
- Cohen J., (1988), Statistical power analysis for the behavioural sciences, New York: Routledge Academic.
- Cole M. H., Rosenthal D. P. and Sanger M. J., (2019), Two studies comparing students’ explanations of an oxidation-reduction reaction after viewing a single computer animation: The effect of varying the complexity of visual images and depicting water molecules, Chem. Educ. Res. Pract., 20, 738–759.
- Cook M., Wiebe E. and Carter G., (2011), Comparing visual representations of DNA in two multimedia presentations, J. Educ. Multi. Hyper., 20, 21–42.
- Davies A. J., (1991), A model approach to teaching redox, Educ. Chem., 28, 135–137.
- De Jong O., Acampo J. and Verdonk A., (1995), Problems in teaching the topic of redox reactions: Actions and conceptions of chemistry teachers, J. Res. Sci. Teach., 32, 1097–1110.
- De Jong O. and Treagust D. F., (2002), The teaching and learning of electrochemistry, in Gilbert J. K., De Jong O., Justi R., Treagust D. F. and Van Driel J. H. (ed.), Chemical education: Towards research-based practice, Dordecht: Kluwer, pp. 317–337.
- Ferguson C. J., (2009), An effect size primer: A guide for clinicians and researchers, Prof. Psychol.: Res. Pract., 40, 532–538.
- Garnett P. J., Garnett P. J. and Treagust D. F., (1990), Implications of research on students’ understanding of electrochemistry for improving science curricula and classroom practice, Int. J. Sci. Educ., 12, 147–156.
- Garnett P. J. and Treagust D. F., (1992a), Conceptual difficulties experienced by senior high school students of electrochemistry: Electric circuits and oxidation-reduction equations, J. Res. Sci. Teach., 29, 121–142.
- Garnett P. J. and Treagust D. F., (1992b), Conceptual difficulties experienced by senior high school students of electrochemistry: Electrochemical (galvanic) and electrolytic cells, J. Res. Sci. Teach., 29, 1079–1099.
- Gilbert J. K. and Treagust D. F., (2009), Towards a coherent model for macro, submicro, and symbolic representations in chemical education, in Gilbert J. K. and Treagust D. F. (ed.), Models and modeling in science education: Multiple representations in chemical education, Dordrecht, Springer-Verlag, pp. 333–350.
- Gregorius R. Ma., (2017), Performance of underprepared students in traditional versus animation-based flipped-classroom settings, Chem. Educ. Res. Pract., 18, 841–848.
- Gregorius R. Ma., Santos R., Dano J. B. and Guiterrez J. J., (2010a), Can animations effectively substitute for traditional teaching methods? Part I: Preparation and testing materials, Chem. Educ. Res. Pract., 11, 253–261.
- Gregorius R. Ma., Santos R., Dano J. B. and Guiterrez J. J., (2010b), Can animations effectively substitute for traditional teaching methods? Part II: Potential for differentiated learning, Chem. Educ. Res. Pract., 11, 262–266.
- Griffiths A. K., (1994), A critical analysis and synthesis of research on students’ chemistry misconceptions, in Schmidt H. J. (ed.), Proceedings of the 1994 international symposium on problem solving and misconceptions in chemistry and physics, Hong Kong: International Council of Association for Science Education Publications, pp. 70–99.
- Herrington D. G., Sweeder, R. D. and VandenPlas J. R., (2017), Students’ independent use of screencasts and simulations to construct understanding of solubility concepts, J. Sci. Educ. Technol., 26, 359–371.
- Hosmer D. W., Lemeshow S. and Sturdivant R. X., (2013), Applied logistic regression, 3rd edn, Hoboken, NJ: Wiley.
- Johnstone A. H., (2006), Chemical education research in Glasgow in perspective, Chem. Educ. Res. Pract., 7, 49–63.
- Johnstone A. H., (2010), You can’t get there from here, J. Chem. Educ., 87, 22–29.
- Jeung H.-J., Chandler P. and Sweller J., (1997), The role of visual indicators in dual sensory mode instruction, Educ Psychol., 17, 329–345.
- Kelly R. M., Akaygun S., Hansen S. J. R. and Villalta-Cerdas A., (2017), The effect that comparing molecular animations of varying accuracy has on students’ submicroscopic explanations, Chem. Educ. Res. Pract., 18, 582–600.
- Kelly R. M. and Jones L. L., (2007), Exploring how different features of animations of sodium chloride dissolution affect students' explanations, J. Sci. Educ. Technol., 16, 413–429.
- Kelly R. M. and Jones L. L., (2008), Investigating students’ ability to transfer ideas learned from molecular animations to the dissolution process, J. Chem. Educ., 85, 303–309.
- Kelly R. M., Phelps A. J. and Sanger M. J., (2004), The effects of a computer animation on students’ conceptual understanding of a can-crushing demonstration at the macroscopic, microscopic, and symbolic levels, Chem. Educ., 9, 184–189.
- Levy D., (2013), How dynamic visualization technology can support molecular reasoning, J. Sci. Educ. Technol., 22, 702–717.
- Lin L. and Atkinson R.K., (2011), Using animations and visual cueing to support learning of scientific concepts and processes, Comp. Educ., 56, 650–658.
- Loh A. S. L. and Subramaniam R., (2018), Mapping the knowledge structure exhibited by a cohort of students based on their understanding of how a galvanic cell produces energy, J. Res. Sci. Teach., 55, 777–809.
- Lowe, R. K., (2004), Animations and learning: value for money? in Atkinson R., McBeath C., Jonas-Dwyer D. and Phillips R. (ed.), Beyond the comfort zone: Proceedings of the 21st ASCILITE Conference, Perth: ACSILITE, pp. 558–561.
- Lowe R. K., (2014), Dynamic visualizations: A two-edged sword? in W. Huang (ed.), Handbook of human centric visualization, New York: Springer, pp. 581–604.
- Lowe R. K. and Boucheix J.-M., (2008), Learning from animated diagrams: How are mental models built? in Stapleton G., Howse J. and Lee J. (ed.), Diagrammatic representation and inference, Berlin: Springer, pp. 266–281.
- Mayer R. E., (2009), Multimedia learning, Cambridge, UK: Cambridge University Press.
- Ogude N. A. and Bradley J. D., (1996), Electrode processes and aspects relating to cell EMF, current, and cell components in operating electrochemical cells, J. Chem. Educ., 73, 1145–1149.
- Ozcelik E., Karakus T., Kursun E. and Cagiltay K., (2009), An eye-tracking study of how color coding affects multimedia learning, Comp. Educ., 53, 445–453.
- Özkaya A. R., (2002), Conceptual difficulties experienced by prospective teachers in electrochemistry: Half-cell potential, and chemical and electrochemical equilibrium in galvanic cells, J. Chem. Educ., 79, 735–738.
- Paivio A., (1986), Mental representations: A dual coding approach, New York: Oxford University Press.
- Patrick M. D., Carter G. and Wiebe E. N., (2005), Visual representations of DNA replication: Middle grades students' perceptions and interpretations, J. Sci. Educ. Technol., 14, 353–365.
- Qualtrics [software], (2015), Provo, UT, USA: Qualtrics. Retrieved from http://www.qualtrics.com.
- Rosenthal D. P. and Sanger M. J., (2012), Student misinterpretations and misconceptions based on their explanations of two computer animations of varying complexity depicting the same oxidation-reduction reaction, Chem. Educ. Res. Pract., 13, 471–483.
- Rosenthal D. P. and Sanger M. J., (2013a), How does the order of viewing two computer animations of the same oxidation-reduction reaction affect students’ particulate-level explanations? in Suits J. P. and Sanger M. J. (ed.), Pedagogic roles of animations and simulations in chemistry courses, Washington, DC: American Chemical Society, vol. 1142, pp. 313–340.
- Rosenthal D. P. and Sanger, M. J., (2013b), How does viewing one computer animation affect students’ interpretations of another animation depicting the same oxidation-reduction reaction? Chem. Educ. Res. Pract., 14, 286–296.
- Russell J. W., Kozma R. B., Jones T., Wykoff J., Marx N. and Davis J., (1997), Use of simultaneous-synchronized macroscopic, microscopic, and symbolic representations to enhance the teaching and learning of chemical concepts, J. Chem. Educ., 74, 330–334.
- Ryoo K., Bedell K. and Swearingen A, (2018), Promoting linguistically diverse students’ short-term and long-term understanding of chemical phenomena using visualizations, J. Sci. Educ. Technol., 27, 508–522.
- Sanger M. J., (2009), Computer animations of chemical processes at the molecular level, in Pienta N. J., Cooper M. M. and Greenbowe T. J. (ed.), Chemists' guide to effective teaching, Upper Saddle River, NJ: Prentice Hall, vol. II, pp. 198–211.
- Sanger M. J., Brecheisen D. M. and Hynek B. M., (2001), Can computer animations affect college biology students’ conceptions about diffusion and osmosis? Am. Biol. Teach., 63, 104–109.
- Sanger M. J., Campbell E., Felker J. and Spencer C., (2007), “Concept learning versus problem solving”: Does particle motion have an effect? J. Chem. Educ., 84, 875–879.
- Sanger M. J. and Greenbowe T. J., (1997a), Common student misconceptions in electrochemistry: Galvanic, electrolytic, and concentration cells, J. Res. Sci. Teach., 34, 377–398.
- Sanger M. J. and Greenbowe T. J., (1997b), Students’ misconceptions in electrochemistry: Current flow in electrolyte solutions and the salt bridge, J. Chem. Educ., 74, 819–823.
- Sanger M. J. and Greenbowe T. J., (1999), An analysis of college chemistry textbooks as sources of misconceptions and errors in electrochemistry, J. Chem. Educ., 76, 853–860.
- Sanger M. J. and Greenbowe T. J., (2000), Addressing student misconceptions concerning electron flow in aqueous solutions with instruction including computer animations and conceptual change strategies, Int. J. Sci. Educ., 22, 521–537.
- Sanger M. J., Phelps A. J. and Fienhold J., (2000), Using a computer animation to improve students’ conceptual understanding of a can-crushing demonstration, J. Chem. Educ., 77, 1517–1520.
- Schmidt H.-J., Marohn A. and Harrison A. G., (2007), Factors that prevent learning in electrochemistry, J. Res. Sci. Teach., 44, 258–283.
- Schnotz W. and Rasch T., (2005), Enabling, facilitating, and inhibiting effects of animations in multimedia learning: Why reduction of cognitive load can have negative results on learning, Educ. Technol. Res. Dev., 53(3), 47–58.
- Sirhan G., (2007), Learning difficulties in chemistry: An overview, J. Turkish Sci. Educ., 4, 2–20.
- Smetana L. K. and Bell R. L., (2014), Which setting to choose: Comparison of whole-class vs. small-group computer simulation use, J. Sci. Educ. Technol., 23, 481–495.
- Suits J. P. and Sanger M. J., (2013), Dynamic visualizations in chemistry courses, in Suits J. P. and Sanger M. J. (ed.), Pedagogic roles of animations and simulations in chemistry courses, ACS Symposium Series, Washington, DC: American Chemical Society, vol. 1142, pp. 1–13.
- Sweller J., (1994), Cognitive load theory, learning difficulty and instructional design, Learn. Instr., 4, 295–312.
- Sweller J., (1999), Instructional design in technical areas, Camberwell, Australia: ACER Press.
- Sweller J. and Chandler P., (1994), Why some material is difficult to learn, Cogn. Instr., 12, 185–233.
- Talanquer V., (2011), Macro, submicro, and symbolic: The many faces of the chemistry “triplet”, Int. J. Sci. Educ., 33, 179–195.
- Tasker R., (2005), Using multimedia to visualize the molecular world: Educational theory into practice, in Pienta N. J., Cooper M. M. and Greenbowe T. J. (ed.), Chemists' guide to effective teaching, Upper Saddle River, NJ: Prentice Hall, vol. I, pp. 195–211.
- Tasker R. and Dalton R., (2006), Research into practice: Visualisation of the molecular world using animations, Chem. Educ. Res. Pract., 7, 141–159.
- Thomas G. P., (2017), ‘Triangulation’: An expression for stimulating metacognitive reflection regarding the use of ‘triplet’ representations for chemistry learning, Chem. Educ. Res. Pract., 18, 533–548.
- Tsaparlis G., (2018), Teaching and learning electrochemistry, Isr. J. Chem., 58, 1–16.
- Williamson V. M. and Abraham M. R., (1995), The effects of computer animation on the particulate mental models of college chemistry students, J. Res. Sci. Teach., 32, 521–534.
- Williamson V. M., Lane S. M., Gilbreath T., Tasker R., Ashkenazi G., Williamson K. C. and Macfarlane R. D. (2012), The effect of viewing order of macroscopic and particulate visualizations on students’ particulate explanations, J. Chem. Educ., 89, 979–987.
- Williamson V. M., Watkins J. T. and Williamson III K. C., (2013), The effect of student-constructed animations versus storyboards on students’ mental rotation ability, equilibrium content knowledge, and attitudes, in Suits J. P. and Sanger M. J. (ed.), Pedagogic roles of animations and simulations in chemistry courses, Washington DC: American Chemical Society, vol. 1142, pp. 293–311.
- Yang E., Andre T., Greenbowe T. J. and Tibell L., (2003), Spatial ability and the impact of visualization/animation on learning electrochemistry, Int. J. Sci. Educ., 25, 329–349.
- Yaseen Z., (2018), Using student-generated animations: the challenge of dynamic chemical models in states of matter and the invisibility of the particles, Chem. Educ. Res. Pract., 19, 1166–1185.
| This journal is © The Royal Society of Chemistry 2021 |