
Evaluation of the students’ understanding of models in science (SUMS) for use in undergraduate chemistry
Katherine
Lazenby
 and
Nicole M.
Becker
*
and
Nicole M.
Becker
*
University of Iowa – Chemistry, University of Iowa, Iowa City, Iowa 52242, USA. E-mail: nicole-becker@uiowa.edu
First published on 26th August 2020
Abstract
As chemistry education, and science education more broadly, have shifted to emphasize realistic scientific practices as an important component of education, a number of researchers have used the Students’ Understanding of Models in Science (SUMS) instrument to assess students’ knowledge about scientific models and modelling. SUMS has also been used in a number of studies to assess the efficacy of models- and modelling-focused curricular interventions on students’ epistemic knowledge of models and modelling in several contexts. In this study, we examine the functioning of the SUMS instrument in an introductory university-level chemistry context and present evidence regarding the validity of data produced using SUMS in this context. Data collected from university chemistry students were used to examine students’ response patterns. We also present results from factor analyses, which were used to investigate the internal structure of the SUMS. The results suggest that SUMS cannot be used to support claims about undergraduate chemistry students’ epistemic knowledge of scientific models and modelling.
Introduction
In the last several decades, educational researchers and policymakers have endorsed a shift toward more authentic engagement in scientific practices in educational settings. As part of this “practice turn” (Forman, 2018), the National Research Council's (2012) Framework for K-12 Science Education highlighted eight scientific practices, or activities that scientists engage in as part of scientific inquiry, as an important component of science education. One such practice highlighted in The Framework is that of developing and using scientific models.In an effort to engage students in the practice of scientific modelling, a number of researchers have developed models- and modelling-focused instructional resources across science disciplines which are intended to support students’ ability to use scientific models to think about real world phenomena (Casanova, 1993; Tien et al., 1999; Crawford and Cullin, 2005; Schwarz and White, 2005; Liu, 2006; Tien et al., 2007; Brewe et al., 2009; Brewe et al., 2010; Barlow et al., 2014; Park et al., 2017; Burgin et al., 2018). An additional goal of many models- and modelling-focused curricular resources and interventions is to support students’ development of an understanding of the epistemic nature of scientific models and the practice of modelling. This goal is reiterated in The Framework:
Understanding how science functions requires a synthesis of content knowledge, procedural knowledge, and epistemic knowledge… Engagement in modeling … invites and encourages students to reflect on the status of their own knowledge and their understanding of how science works. And as they involve themselves in the practices of science and come to appreciate its basic nature, their level of sophistication in understanding how any given practice contributes to the scientific enterprise can continue to develop. (National Research Council, 2012, p. 79).
The “practice turn” in science education warrants the need for assessments that can be used to make claims about the efficacy (or lack thereof) of practices-focused curricula (National Research Council, 2014; Forman, 2018). Measurement of student gains in understanding the epistemic nature of scientific models and modelling has received significant attention in the research literature (e.g., Crawford and Cullin, 2005; Danusso et al., 2010; Gogolin and Krüger, 2016, 2018; Lazenby et al., 2019; Mathesius and Krell, 2019).
One instrument in particular, the Students’ Understanding of Models in Science (SUMS) instrument, has been used in a number of studies to measure students’ epistemic understanding of scientific models (Treagust et al., 2002). Some of the empirical studies which administered the SUMS were conducted in contexts dissimilar to that in which the instrument was developed (Australian secondary students) and the question of the validity and reliability of data produced by the SUMS in such contexts remains.
In our own work, we have developed modelling-focused collaborative learning activities at the undergraduate level, and we, too, are interested in assessing students’ learning gains related to epistemic knowledge of models and modelling. Thus, this work is motivated by our own efforts to assess the validity and reliability of data generated using the SUMS instrument in a new population of students – that of undergraduate chemistry students. Here, we investigate the psychometric properties of the SUMS in an undergraduate chemistry context and share our experiences in trying to use the SUMS for assessment of university students’ epistemic knowledge of modeling.
In the present manuscript, we describe our study related to the research question:
What validity and reliability evidence supports the use of SUMS for assessment of undergraduate chemistry students’ understanding of models and modelling?
Literature review
Students’ understanding of models in science (SUMS) instrument
Treagust et al. (2002) developed the SUMS to gain insight into students’ conceptions of the role of scientific models in learning science. The authors developed the SUMS based on data from a study into the use of chemical models in teaching organic chemistry (Treagust et al., 2001) and from (Grosslight et al., 1991) study into students’ understanding of models and their use in science. SUMS, as originally published, is comprised of 27 Likert response format items intended to assess students’ understanding of “what a model is, the role of models in science, including how and why models are used and what causes models to be changed” (Treagust et al., 2002, p. 359). The sample in the original study is described as “228 students from two government, non-selective, co-educational high schools in Perth, Western Australia, involved 69 (30.3%) Year 8 students (age 13 years), 44 (19.3%) Year 9 students (age 14 years), and 115 (50.4%) Year 10 students (age 15 years). The students had received no special teaching about scientific models in science, so the responses reflect their understanding based on the general science curriculum they have experienced” (Treagust et al., 2002, p. 358). There is limited information reported about how the items on the SUMS were developed. For analysis, responses to SUMS items were assigned a value from 1–5, based on a five-point Likert scale, strongly disagree (1), disagree (2), not sure (3), agree (4) and strongly agree (5).In the authors’ initial work to provide validity and reliability evidence related to the instrument, they used factor analysis and identified five subscales within the SUMS: Models as multiple representations (MR), Models as exact replicas (ER), Models as explanatory tools (ET), the Uses of scientific models (USM), and the Changing nature of models (CNM). Based on the data provided, it may be assumed that the authors used the eigenvalues-greater-than-one rule proposed by Kaiser (1960) to determine the number of factors to retain. The factors are comprised of three to eight items. The authors note that three items (5, 14, and 15) load on multiple subscales, but implications of this for interpretation of data generated using the SUMS are not addressed (Treagust et al., 2002). The authors also report means and standard deviations for each of 27 items and each of 5 subscales as well as Cronbach's alpha values for each sub-scale; the authors also report bi-variate correlations of each of the five sub-scales as evidence that “students’ responses to each scale are related and consistent” (p. 361).
Use of SUMS in prior research studies
A search of the Web of Science database reveals 150 citations (accessed May 2019) of the manuscript in which SUMS was initially presented (Treagust et al., 2002). Of those, we identified 15 empirical studies which are written in English by researchers other than the original authors and which report use of the SUMS for data collection (Liu, 2006; Everett et al., 2009; Levy and Wilensky, 2009; Gobert et al., 2011; Chang and Chang, 2013; Park, 2013; Cheng et al., 2014; Wei et al., 2014; Cheng and Lin, 2015; Campos et al., 2016; Underwood et al., 2016; Derman and Kayacan, 2017; Park et al., 2017; Pierson et al., 2017; Burgin et al., 2018).Though it would be expected that there might be trends in the ways in which age and instructional intervention contribute to students’ scores on the SUMS, in our literature review of studies which have used or adapted the SUMS, we found that no discernable patterns in the ways that models- and modelling-focused curricular interventions and resources impact student knowledge, as measured by SUMS (Table 1). We also found no discernable pattern in the relationship between students’ SUMS scores and other measures of content or practices-based knowledge (Table 2). There also seemed to be no patterns in SUMS scores (or change in scores pre-/post-) based on the age or grade-level of student populations investigated, which ranged from grade 8 to undergraduate.
| SUMS administered pre-/post-intervention | |||||||||
|---|---|---|---|---|---|---|---|---|---|
| Sample | Purpose of study | MR | ER | ET | USM | CNM | Validity evidence reported | Reliability evidence reported | |
| Park et al. (2017) | High school chemistry, USA | Assess efficacy of intervention: Connected Chemistry (computer models) vs. traditional instruction | No significant difference in gain scores with increased use of computer models = | Significant increase in gain scores with increased use of computer models ↑ | Significant increase in gain scores with increased use of computer models ↑ | Significant increase in gain scores with increased use of computer models ↑ | Significant increase in gain scores with increased use of computer models ↑ | N/A | Cronbach's alpha values for each sub-scale |
| Gobert et al. (2011) | High school chemistry, biology, and physics, USA | Assess efficacy of intervention, Modeling across the Curriculum, (MAC): Connected Chemistry, BioLogica™ (biology), Dynamica™ (physics) | Number of model-focused activities is a significant predictor of MR post-test score, controlling for pre-test score ↑ | Number of model-focused activities is not a significant predictor of ER post-test score, controlling for pre-test score = | Number of model-focused activities is a significant predictor of ET post-test score, controlling for pre-test score ↑ | Number of model-focused activities is a significant predictor of USM post-test score, controlling for pre-test score ↑ | Number of model-focused activities is a significant predictor of CNM post-test score, controlling for pre-test score ↑ | N/A | Cronbach's alpha values for each sub-scale, in chemistry, biology, and physics |
| Burgin et al. (2018) | High school biology, USA | Assess efficacy of intervention, Visual Molecular Dynamics, as a tool for viewing and analyzing the results of molecular dynamics simulations | Significant pre-/post-mean difference, small effect size ↑ | No significant pre-/post-mean difference = | Significant pre-/post-mean difference, small effect size ↑ | Significant pre-/post-mean difference, small effect size ↑ | Significant pre-/post-mean difference, small effect size ↑ | N/A | N/A |
| Chang and Chang (2013) | Eighth grade general science, Taiwan | Assess efficacy of curriculum: three rounds of critiquing models | No significant difference in pre-/post-scores = | Significant difference in pre-/post-scores ↑ | No significant difference in pre-/post-scores = | No significant difference in pre-/post-scores = | No significant difference in pre-/post-scores = | N/A | Cronbach's alpha value (overall survey) |
| Cheng et al. (2014) | Undergraduate non-science majors, Taiwan | Assess efficacy of intervention: computer simulations, reflection on modeling criteria | Significant pre-/post-mean difference ↑ | No significant pre-/post-mean difference = | Significant pre-/post-mean difference ↑ | Significant pre-/post-mean difference ↑ | No significant pre-/post-mean difference = | N/A | Range of Cronbach's alpha values for each sub-scale |
| Everett et al. (2009) | Pre-service elementary teachers, USA | Determine the utility of various assessments of pre-service teachers' growth in knowledge of models over the course of a Science Capstone course | Significant pre-/post-mean difference ↑ | No significant pre-/post-mean difference = | Significant pre-/post-mean difference ↑ | Significant pre-/post-mean difference ↑ | Significant pre-/post-mean difference ↑ | N/A | N/A |
| Levy and Wilensky (2009) | High school chemistry, USA | Assess efficacy of intervention: Connected Chemistry | Significant pre-/post-mean difference, small effect size ↑ | Significant pre-/post-mean difference, small effect size ↑ | Significant pre-/post-mean difference, small effect size ↓ | No significant pre-/post-mean difference = | No significant pre-/post-mean difference = | N/A | N/A |
| Single administration | |||||||||
|---|---|---|---|---|---|---|---|---|---|
| Sample | Purpose of study | MR | ER | ET | USM | CNM | Validity evidence reported | Reliability evidence reported | |
| Park (2013) | Tenth grade general science, South Korea | Explore relationship between students understanding of models (SUMS) and content knowledge of lunar phases | No significant relationship w/measure of content knowledge of lunar phases = | No significant relationship w/measure of content knowledge of lunar phases = | Significant relationship w/measure of content knowledge of lunar phases ↑ | Significant relationship w/measure of content knowledge of lunar phases ↑ | Significant relationship w/measure of content knowledge of lunar phases ↑ | N/A | N/A |
| Cheng and Lin (2015) | Ninth grade general science, Taiwan | Explore relationship between students understanding of models (SUMS) and ability to construct models | Significant correlation with ability to generate models and science learning interest ↑ ↑ | No significant correlation with model-generation ability or science learning interest = = | Significant correlation with ability to generate models and science learning interest ↑ ↑ | Significant correlation with ability to generate models and science learning interest ↑ ↑ | Significant correlation with science learning interest, not sig. with model-generation ability ↑ = | N/A | Range of Cronbach's alpha values for each sub-scale |
| Derman and Kayacan (2017) | Pre-service science teachers, Turkey | Explore relationship between views on scientific models and achievement on the topic of the atom | No significant relationship with achievement of Atomic Achievement Test = | Bi-variate correlations of SUMS sub-scales | Cronbach's alpha value (overall survey) | ||||
| Liu (2006) | High school chemistry, USA | Efficacy of intervention: Probeware-based laboratory vs. internet-based computer modeling laboratory | No sig. correlation with knowledge of particulate model of gases = | Sig. correlation with knowledge of particulate model of gases ↓ | No sig. correlation with knowledge of particulate model of gases = | No sig. correlation with knowledge of particulate model of gases = | No sig. correlation with knowledge of particulate model of gases = | N/A | N/A |
| Campos et al. (2016) | Pre-service elementary teachers, Spain | Modification and translation of SUMS for use in Spanish | Most students presented acceptable overall views of MR | Most students presented acceptable overall views of ER | Most students presented acceptable overall views of ET | Most students presented acceptable overall views of USM | Most students presented acceptable overall views of CNM | Cluster analysis to ID items (13) that group according to SUMS sub-scales | Cronbach's alpha values for each sub-scale, overall |
| Wei et al. (2014) | Grade 9–10 general science, China | Apply a Rasch model to validate SUMS in new population | Suggest (1) some easier and more difficult items need to be added (2) the category 3 (“not sure”) needs to be deleted (3) fifteen items need to be improved based on item-level statistics (4) the reliabilities of the dimensions are moderate, but further improvement is necessary | Rasch analysis | EAP/PV reliabilities of each sub-scale | ||||
| Pierson et al. (2017) | Eighth grade general science, USA | Compare level metamodeling knowledge assigned to students based on SUMS and a modeling learning progression | Items reassigned to constructs in learning progression (salience-generality, audience/user, evidence, mechanistic-generative, revision): suggest that SUMS overestimated sophistication of students’ ideas across constructs | N/A | N/A | ||||
| Underwood et al. (2016) | Undergraduate general chemistry, USA | Compare control and experimental groups prior to intervention | No significant difference between mean scores of control/experimental groups prior to intervention | No significant difference between mean scores of control/experimental groups prior to intervention | No significant difference between mean scores of control/experimental groups prior to intervention | No significant difference between mean scores of control/experimental groups prior to intervention | No significant difference between mean scores of control/experimental groups prior to intervention | N/A | N/A |
We also found that most studies that used or adapted SUMS provided little or no evidence of validity or reliability, despite adapting the instrument in different contexts and languages (Tables 1 and 2). Most of the studies (7 of 8) which did provide information about the reliability of the data produced using SUMS report only Cronbach's alpha values; while alpha is a commonly reported index of reliability in chemistry education research, it is not necessarily the most appropriate index, given its underlying assumptions (Komperda et al., 2018).
Two studies which did investigate the psychometric properties (both validity and reliability) of SUMS in novel contexts (Wei et al., 2014; Campos et al., 2016) found that the SUMS in its original form could not support valid or reliable claims about students’ epistemic knowledge of models and modelling. Wei et al. (2014) administered SUMS to Chinese students in grades 9 and 10; the work of Campos et al. (2016) took place in a university-level teacher training context in Spain. To address validity concerns, Campos et al. (2016) chose to regroup a subset of 13 of the original 27-items, while Wei et al. (2014) suggested adding additional items, improving others, and altering the Likert scale response options to improve the instrument's function for its intended purpose.
In summary, we have found that there is limited evidence in either the original study (Treagust et al., 2002) or subsequent adaptations that SUMS data can be validity and reliably interpreted. Since to date, we have found no studies that examine the validity and reliability of the SUMS instrument in undergraduate chemistry contexts similar to our own (large enrolment general chemistry course for STEM majors at a large midwestern university), and because of our own interest in assessing students’ ideas about models and modelling, here we present an analysis of the psychometric properties of SUMS in an undergraduate chemistry context.
Methods
Participants and setting
Participants for this study were recruited from a first-semester university-level introductory chemistry course in Fall 2016 and Fall 2017 semesters. The course was the first of a two-semester sequence for science majors at a research-intensive university in the Midwestern United States. The course was delivered primarily through instructor lecturing, and course material and homework were based on the text for the course: the 12th edition of Chemistry: The Central Science by Brown et al. (2012). Student participants were enrolled concurrently in discussion, laboratory, and case study sections of the course. Discussion sections were led by graduate teaching assistants and were designed to provide students with opportunities to practice solving problems like those on the homework and exams. The case study component of the course included opportunities for students to apply concepts from the course to real-world phenomena; the case study also served as a pre-lab preparatory space. The course did not include any explicit instruction on models and modelling.Data collection
We administered the Students Understanding of Models in Science (SUMS) survey via Qualtrics in the week before final exams in Fall 2016 and Fall 2017 (SUMS items shown in Table 3). Therefore, the findings we present here represent students’ responses to SUMS items after completing nearly one full semester of undergraduate introductory chemistry. Students who completed the optional survey received three points of extra credit; students had the option to decline to participate in the research study and received extra credit regardless of whether they declined or consented for research participation.| Mean | Std deviation | Min | Max | Median | Skewness | Kurtosis | ||
|---|---|---|---|---|---|---|---|---|
| 1. Many models may be used to express features of a science phenomenon by showing different perspectives to view an object. | F16 | 4.43 | 0.63 | 1 | 5 | 4 | −0.85 | 2.75 |
| F17 | 4.38 | 0.61 | 1 | 5 | 4 | −1.03 | 3.26 | |
| Original study | 3.56 | 0.96 | ||||||
| 2. Many models represent different versions of the phenomenon | F16 | 4.10 | 0.75 | 1 | 5 | 4 | −0.97 | 1.68 |
| F17 | 4.21 | 0.76 | 1 | 5 | 4 | −0.97 | 1.17 | |
| Original study | 3.33 | 0.97 | ||||||
| 3. Models can show the relationship of ideas clearly. | F16 | 4.25 | 0.73 | 1 | 5 | 4 | −1.21 | 2.71 |
| F17 | 4.34 | 0.77 | 1 | 5 | 4 | −1.34 | 2.07 | |
| Original study | 3.67 | 0.97 | ||||||
| 4. Many models are used to show how it depends on individual's different ideas on what things look like or how they work. | F16 | 3.67 | 1.02 | 1 | 5 | 4 | −0.63 | −0.24 |
| F17 | 3.61 | 1.07 | 1 | 5 | 4 | −0.45 | −0.76 | |
| Original study | 3.56 | 0.91 | ||||||
| 5. Many models may be used to show different sides or shapes of an object. | F16 | 4.12 | 0.83 | 1 | 5 | 4 | −1.32 | 2.64 |
| F17 | 4.15 | 0.83 | 1 | 5 | 4 | −1.15 | 1.52 | |
| Original study | 3.6 | 0.86 | ||||||
| 6. Many models show different parts of an object or show the objects differently. | F16 | 4.14 | 0.79 | 1 | 5 | 4 | −1.20 | 2.39 |
| F17 | 4.14 | 0.85 | 1 | 5 | 4 | −1.23 | 1.77 | |
| Original study | 3.44 | 0.93 | ||||||
| 7. Many models show how different information is used. | F16 | 4.01 | 0.83 | 1 | 5 | 4 | −1.01 | 1.41 |
| F17 | 4.08 | 0.94 | 1 | 5 | 4 | −1.10 | 0.96 | |
| Original study | 3.51 | 0.93 | ||||||
| 8. A model has what is needed to show or explain a scientific phenomenon. | F16 | 3.87 | 0.91 | 1 | 5 | 4 | −0.99 | 0.82 |
| F17 | 4.06 | 0.84 | 1 | 5 | 4 | −0.96 | 0.96 | |
| Original study | 3.52 | 0.93 | ||||||
| 9. A model should be an exact replica. | F16 | 2.34 | 0.99 | 1 | 5 | 2 | 0.99 | 0.46 |
| F17 | 2.27 | 0.80 | 1 | 5 | 2 | 1.01 | 0.68 | |
| Original study | 3.14 | 1.17 | ||||||
| 10. A model needs to be close to the real thing. | F16 | 3.68 | 1.01 | 1 | 5 | 4 | −0.91 | 0.12 |
| F17 | 3.70 | 1.05 | 1 | 5 | 4 | −0.81 | −0.16 | |
| Original study | 3.74 | 1.10 | ||||||
| 11. A model needs to be close to the real thing by being very exact, so nobody can disprove it. | F16 | 2.65 | 1.14 | 1 | 5 | 2 | 0.49 | −0.75 |
| F17 | 2.66 | 1.18 | 1 | 5 | 2 | 0.43 | −0.87 | |
| Original study | 3.35 | 1.09 | ||||||
| 12. Everything about a model should be able to tell what it represents. | F16 | 3.69 | 0.97 | 1 | 5 | 4 | −0.75 | −0.10 |
| F17 | 3.76 | 0.99 | 1 | 5 | 4 | −0.73 | −0.17 | |
| Original study | 3.61 | 0.94 | ||||||
| 13. A model needs to be close to the real thing by being very exact in every way except for size. | F16 | 2.99 | 1.20 | 1 | 5 | 3 | 0.00 | −1.18 |
| F17 | 2.90 | 1.20 | 1 | 5 | 3 | 0.20 | −1.16 | |
| Original study | 3.57 | 1.11 | ||||||
| 14. A model needs to be close to the real thing by giving the correct information and showing what the object/thing looks like. | F16 | 3.93 | 0.92 | 1 | 5 | 4 | −1.12 | 1.21 |
| F17 | 3.93 | 0.97 | 1 | 5 | 4 | −1.07 | 0.71 | |
| Original study | 3.83 | 0.99 | ||||||
| 15. A model shows what the real thing does and what it looks like. | F16 | 3.81 | 0.88 | 1 | 5 | 4 | −1.01 | 0.69 |
| F17 | 3.91 | 0.84 | 1 | 5 | 4 | −1.12 | 1.34 | |
| Original study | 3.69 | 0.91 | ||||||
| 16. Models show a smaller scale size of something. | F16 | 3.32 | 1.13 | 1 | 5 | 4 | −0.39 | −0.92 |
| F17 | 3.13 | 1.22 | 1 | 5 | 3 | −0.14 | −1.21 | |
| Original study | 3.77 | 1.06 | ||||||
| 17. Models are used to physically or visually represent something. | F16 | 4.43 | 0.61 | 1 | 5 | 4 | −1.16 | 3.12 |
| F17 | 4.47 | 0.60 | 1 | 5 | 5 | −1.22 | 3.83 | |
| Original study | 3.85 | 0.95 | ||||||
| 18. Models help create a picture in your mind of the scientific happening. | F16 | 4.43 | 0.58 | 2 | 5 | 4 | −0.62 | 0.74 |
| F17 | 4.52 | 0.59 | 1 | 5 | 5 | −1.25 | 3.03 | |
| Original study | 3.55 | 1.06 | ||||||
| 19. Models are used to explain scientific phenomena. | F16 | 4.38 | 0.65 | 1 | 5 | 4 | −1.06 | 2.23 |
| F17 | 4.47 | 0.62 | 2 | 5 | 5 | −1.13 | 1.97 | |
| Original study | 3.36 | 0.88 | ||||||
| 20. Models are used to show an idea. | F16 | 4.39 | 0.63 | 2 | 5 | 4 | −0.90 | 1.34 |
| F17 | 4.43 | 0.68 | 2 | 5 | 5 | −1.23 | 1.92 | |
| Original study | 3.8 | 1.02 | ||||||
| 21. A model can be a diagram or a picture, a map, graph, or a photo. | F16 | 4.40 | 0.71 | 1 | 5 | 4 | −1.45 | 3.42 |
| F17 | 4.44 | 0.76 | 1 | 5 | 5 | −1.64 | 3.19 | |
| Original study | 3.46 | 1.11 | ||||||
| 22. Models are used to help formulate ideas and theories about scientific events. | F16 | 4.14 | 0.74 | 1 | 5 | 4 | −1.11 | 2.28 |
| F17 | 4.18 | 0.80 | 1 | 5 | 4 | −1.23 | 1.88 | |
| Original study | 3.41 | 0.87 | ||||||
| 23. Models are used to show how they are used in scientific investigations. | F16 | 3.86 | 0.82 | 2 | 5 | 4 | −0.54 | −0.07 |
| F17 | 3.91 | 0.88 | 1 | 5 | 4 | −0.72 | 0.31 | |
| Original study | 3.46 | 0.95 | ||||||
| 24. Models are used to make and test predictions about a scientific event. | F16 | 4.06 | 0.80 | 1 | 5 | 4 | −0.92 | 1.10 |
| F17 | 4.01 | 0.93 | 1 | 5 | 4 | −1.02 | 0.66 | |
| Original study | 3.35 | 0.90 | ||||||
| 25. A model can change if new theories or evidence prove otherwise. | F16 | 4.46 | 0.62 | 2 | 5 | 5 | −0.99 | 1.34 |
| F17 | 4.62 | 0.60 | 1 | 5 | 5 | −2.05 | 6.94 | |
| Original study | 3.82 | 0.90 | ||||||
| 26. A model can change if there are new findings. | F16 | 4.50 | 0.58 | 2 | 5 | 5 | −0.95 | 1.34 |
| F17 | 4.62 | 0.57 | 1 | 5 | 5 | −1.77 | 5.78 | |
| Original study | 3.79 | 0.90 | ||||||
| 27. A model can change if there are changes in data or belief. | F16 | 4.37 | 0.66 | 1 | 5 | 4 | −0.94 | 1.48 |
| F17 | 4.40 | 0.74 | 1 | 5 | 5 | −1.50 | 3.13 | |
| Original study | 3.62 | 0.90 |
| Degrees of freedom | Chi-square | TLI | CFI | RMSEA 95% confidence interval | |
|---|---|---|---|---|---|
| CFA 27-item, 5-factor | 314 | 1551 | 0.905 | 0.915 | 0.075–0.082 |
| CFA 27-item, 4-factor | 318 | 1763 | 0.891 | 0.901 | 0.080–0.088 |
| CFA 23-item, 4-factor | 224 | 1175 | 0.920 | 0.929 | 0.077–0.086 |
In Fall 2016, we collected 937 complete response sets (all items answered) to the SUMS from students enrolled in the course. The response sets of fifteen students under the age of eighteen and sixty-five students who declined to participate in the study were removed from the data set. We included four additional items in the survey which asked students to select a specific response (e.g. “Please select ‘Strongly Agree’”) in order to identify participants who selected answers randomly; we removed 175 response sets which answered any one of these four items incorrectly. After the removal of the response sets from underage, non-consenting, and students who answered incorrectly to the check items, the Fall 2016 data set is composed of 682 usable response sets (57% of total students enrolled at end of semester).
In Fall 2017, we collected 807 complete response sets to the SUMS from students enrolled in the course. After the removal of the response sets from underage, non-consenting, and students who answered incorrectly to the check items, the Fall 2017 data set is composed of 585 usable response sets (55% of total students enrolled at end of semester). In the Fall 2017 dataset, we collected some demographic information from survey respondents. Participants were mostly 18–21 years old (92%) and in their first semester of college (81%). Students’ gender identification was representative of the class as a whole; 42% identified as male, 54% identified as female, 1% identified as non-binary, and 4% did not respond to the question. We did not collect demographic information from survey respondents in Fall 2016.
We also conducted response process interviews with students from the course (Spring 2020; N = 11). Interviews were conducted using an online video conferencing platform, and the interviews were video recorded. Participants received a $20 gift card as compensation for their time. During the interviews, students were asked to respond to each of the items on the SUMS, describing their thought process aloud as they did so. Students were also prompted to comment on statements or language that they found confusing or vague.
All data were collected with approval from the university's institutional review board.
Data processing
For data analysis, we assigned numerical values to each Likert response option: strongly disagree (1), disagree (2), not sure (3), agree (4), and strongly agree (5). In this manuscript, we treat these levels as ordinal, meaning that strongly agree (5) represents a stronger agreement to the statement by a participant than agree (4), but this difference is not necessarily equivalent to the difference between, for example, agree (4) and not sure (3). In our analysis, we will generally use non-parametric statistical procedures, which are more appropriate for analysis of ordinal data than parametric procedures. However, some scholars argue that Likert-type categories constitute interval-level measurement (e.g., Norman, 2010), and because Treagust et al. (2002) report descriptive statistics such as means and standard deviations, which are generally more appropriate for normally-distributed or interval data, we will also report these values for the purpose of comparison to the original study.All items were assigned values 1–5 for Likert response options Strongly Disagree – Strongly Agree. Though others who have used the SUMS (e.g., Gobert et al., 2011) have reverse coded some items (assigned a value of 5 to Strongly Disagree, 4 to Disagree, etc.), for the purpose of comparing to Treagust et al.'s (2002) original study (which, to our knowledge, did not reverse score any items), we did not reverse score any items in our investigation of students’ response patterns or the internal structure of the SUMS. It is important to consider, then, that a higher level of agreement to each statement does not necessarily constitute a higher level of understanding of models and their role in science. For example, on Item 9 (“A model should be an exact replica”), students with a high level of understanding of the nature of models would likely disagree with the statement.
Data analysis
We combined the Fall 2016 (n = 682) and Fall 2017 (n = 585), datasets and randomly split the data into two sets to be used for the exploratory and confirmatory factor analyses (n = 643 and n = 642, respectively). We used a Levene test for equality of variances to verify the assumption that the variances of the two data sets are equivalent and could be combined and randomly split (p = 0.48) (Levene, 1961). We performed a robust diagonally weighted least squares (WSLMV) on the 27 items from SUMS. The WSLMV estimation was based on a polychoric correlation matrix, which is most appropriate for ordinal data (Holgado-Tello et al., 2010). Our goal was to identify a set of factors that summarize the relationships between items which could be supported by statistical evidence and which was also theoretically reasonable. Using the Kaiser-Guttman rule (Kaiser, 1960), we identified four factors with eigenvalues greater than 1. The four factors were rotated using oblimin rotation. Factor rotation is used to simplify interpretation of the factor structure. Oblimin rotation is an oblique rotation, meaning the factors are allowed to be correlated, which is theoretically reasonable, since we expect students’ ideas about different elements of knowledge about models to be correlated (Costello and Osborne, 2005).
We used the factor loading values to determine which individual items were loading on exactly one factor. Items that had at least one loading value greater than or equal to 0.35, and no more than one loading value greater than or equal to 0.35 were retained. We identified items which did not load on any factor (no loadings ≥ 0.35) as well as items that loaded on more than one factor (cross-loading; more than one factor loading ≥ 0.35) (Costello and Osborne, 2005). We removed items which did not load on any factor or which cross-loaded on multiple factors; we repeated the exploratory factor analysis until we identified a factor structure for which all items loaded significantly on exactly one factor. We conducted our EFA using the R package psych (version 1.9.12.31) (Revelle, 2014).
Several model fit indices and their criteria were used to examine the goodness-of-fit of the model identified in the exploratory factor analysis. We computed the Tucker-Lewis Index (TLI), comparative fit index (CFI), and root mean square error of approximation (RMSEA). The fit indices TLI and CFI are considered incremental fit indices; these indices range from 0 to 1, where values closer to 1 indicate that the proposed model (from the EFA) is an improvement upon the null model, that is, the model in which all measured variables (items) are uncorrelated. Values larger than 0.95 can be interpreted as acceptable model fit (Cangur and Ercan, 2015).
The fit index RMSEA indicates the degree to which the observed data covariance matrix differs from the hypothesized covariance matrix (based on the model from the EFA). RMSEA values smaller than 0.05 indicate a small difference between the observed and hypothesized matrices, that is, a good fit of the model; RMSEA values between 0.05 and 0.08 can be said to indicate “close to good” model fit (Cangur and Ercan, 2015). We report the 95% confidence intervals for the RMSEA index. RMSEA confidence intervals which include 0.05 will be considered indicative of acceptable model fit.
Findings
Response patterns
Table 3 contains the minimum, maximum, median, mean, standard deviation, skewness, and kurtosis values for all items in the Fall 2016 and Fall 2017 datasets. For comparison, the mean and standard deviation values reported in Treagust et al. (2002) are also included in Table 3. According to Treagust et al. (2002), a higher level of agreement (closer to 5) to items 1–8 and 17–27 indicates a higher level of understanding, while disagreement (closer to 1) to items 9–16 is considered to indicate a higher level of understanding.For most items, students did use the entire scale (at least one respondent chose each option from 1 to 5) with the exception of items 18, 20, 23, 25, and 26 in Fall 2016 and items 19 and 20 in Fall 2017. However, there was little variation in student responses on most items, and students responded primarily with “Agree” (4) or “Strongly Agree” (5). No students selected the same answer option for every item (i.e., no straight-line responses).
The difference in means in the F16 and F17 datasets were less than 0.20 for all items, and the medians were within one point for all items. The difference in means between the F16/F17 datasets and those in Treagust's original study tended to be larger (maximum difference of 1.11, average difference of 0.60). Generally, the standard deviation responses of the students in F16 and F17 was smaller than in Treagust's original study (exceptions items 4, 11, 12, 13, 16 for both sets and 7 and 24 in F17 only).
Most items have skewness values that indicate non-normal distribution (values with absolute value greater than 1 indicate a highly skewed distribution, and absolute value greater than 0.50 indicate a moderately skewed distribution). The kurtosis (or peaked-ness) values for most items is also positive for most items, which means that most students are in the “peak,” that is, there is little variation in students’ responses to these items.
The limited variation in student responses in F16 and F17 datasets is further illustrated in the response distribution plots (Fig. 1–5). From the response distribution plots, it is even more apparent that students rarely selected responses strongly disagree (1), disagree (2), or not sure (3) on most of the items (MR, ET, USM, and CNM scales). Note that while Treagust et al. (2002) administered the SUMS using a five-point Likert scale, they reported results on a three-point scale, collapsing strongly disagree (1) & disagree (2) and agree (4) & strongly agree (5), and this is reflected in the response distribution plots.
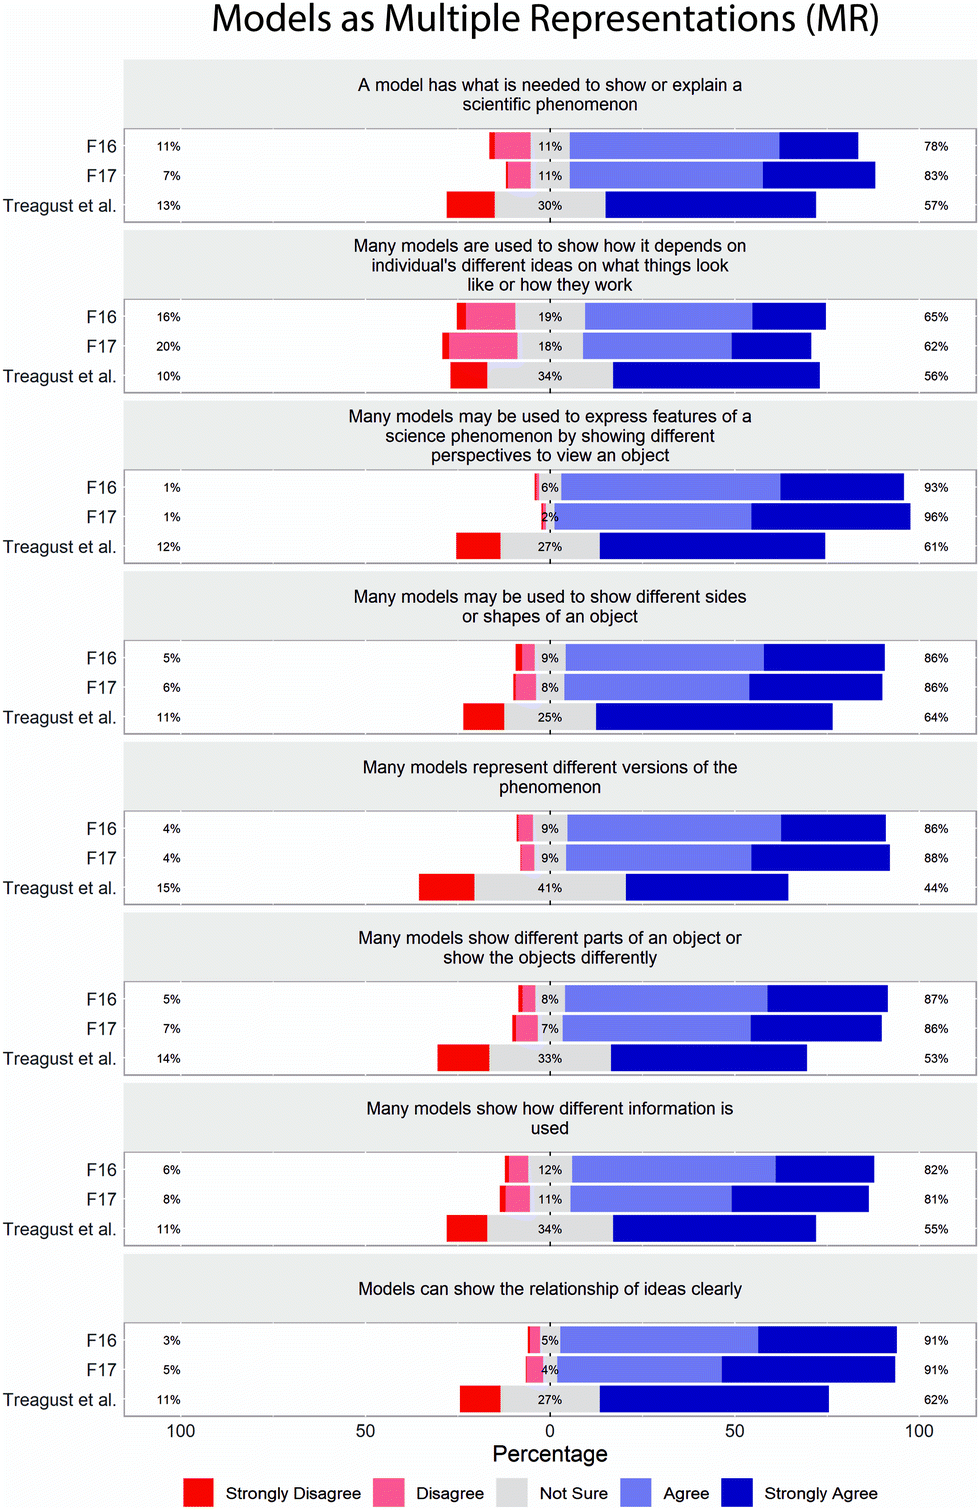 | ||
| Fig. 1 Distribution of student responses by item on SUMS, MR subscale. Percentages represent the percent of students in each category: strongly disagree (1) and disagree (2) are combined; agree (4) and strongly agree (5) are combined in the percents reported. | ||
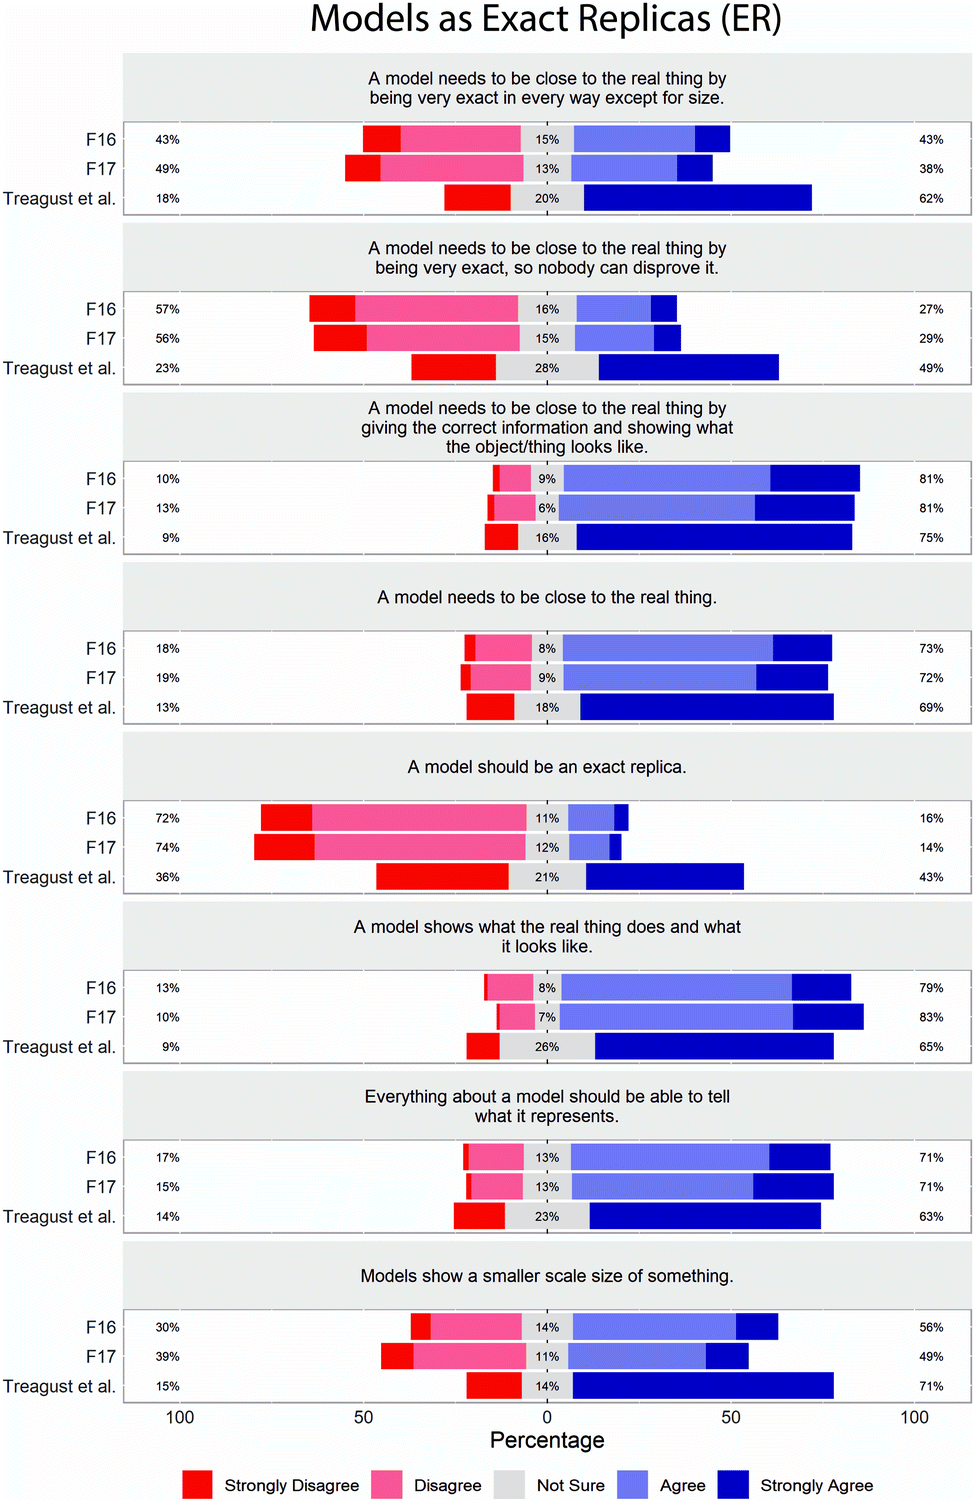 | ||
| Fig. 2 Distribution of student responses by item on SUMS, ER subscale. Percentages represent the percent of students in each category: strongly disagree (1) and disagree (2) are combined; agree (4) and strongly agree (5) are combined in the percents reported. | ||
 | ||
| Fig. 3 Distribution of student responses by item on SUMS, ET subscale. Percentages represent the percent of students in each category: strongly disagree (1) and disagree (2) are combined; agree (4) and strongly agree (5) are combined in the percents reported. | ||
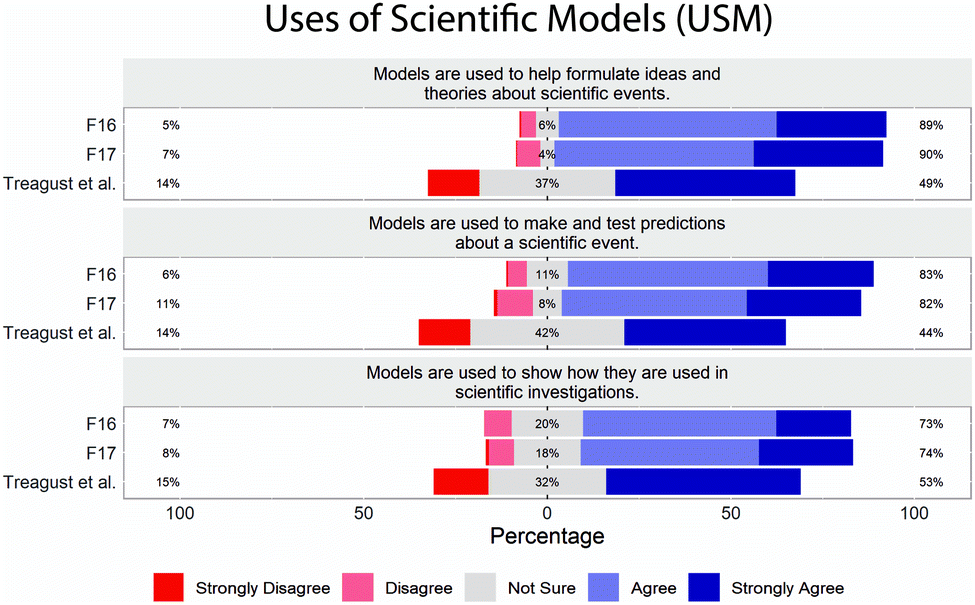 | ||
| Fig. 4 Distribution of student responses by item on SUMS, USM subscale. Percentages represent the percent of students in each category: strongly disagree (1) and disagree (2) are combined; agree (4) and strongly agree (5) are combined in the percents reported. | ||
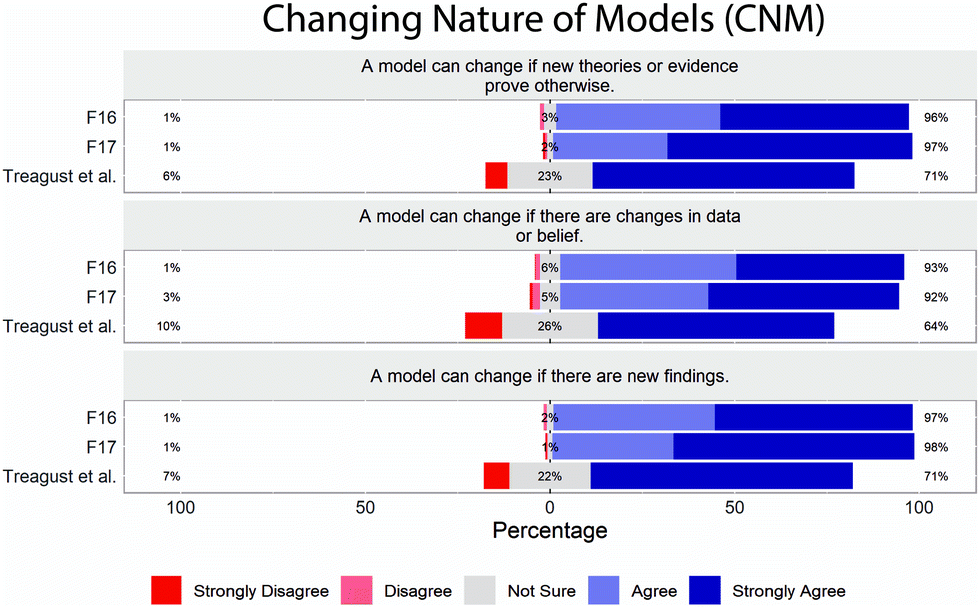 | ||
| Fig. 5 Distribution of student responses by item on SUMS, CNM subscale. Percentages represent the percent of students in each category: strongly disagree (1) and disagree (2) are combined; agree (4) and strongly agree (5) are combined in the percents reported. | ||
There is more variation (less bunching) in student responses on items 9–16 (ER subscale). Items 9–16 have been reverse scored by some SUMS users because students with a high level of understanding of the nature of models would be expected to disagree with the statements. In general, the undergraduate students in our sample were more likely to disagree with the statements on ER scale than the high school students in the original study, which is to be expected. However, on items 9–16, the mean differences between the F16/F17 data and Treagust's data were smaller than on any other scale, perhaps indicating a smaller difference in understanding between the samples.
Exploratory factor analysis
To investigate the internal structure of the SUMS instrument, we conducted an exploratory factor analysis (WLSMV estimation, oblimin rotation, polychoric correlations). We retained four factors, based on the number of eigenvalues which were greater than unity (1), an approach first suggested by (Kaiser, 1960). The scree plot and the first five eigenvalues are shown in Fig. 6.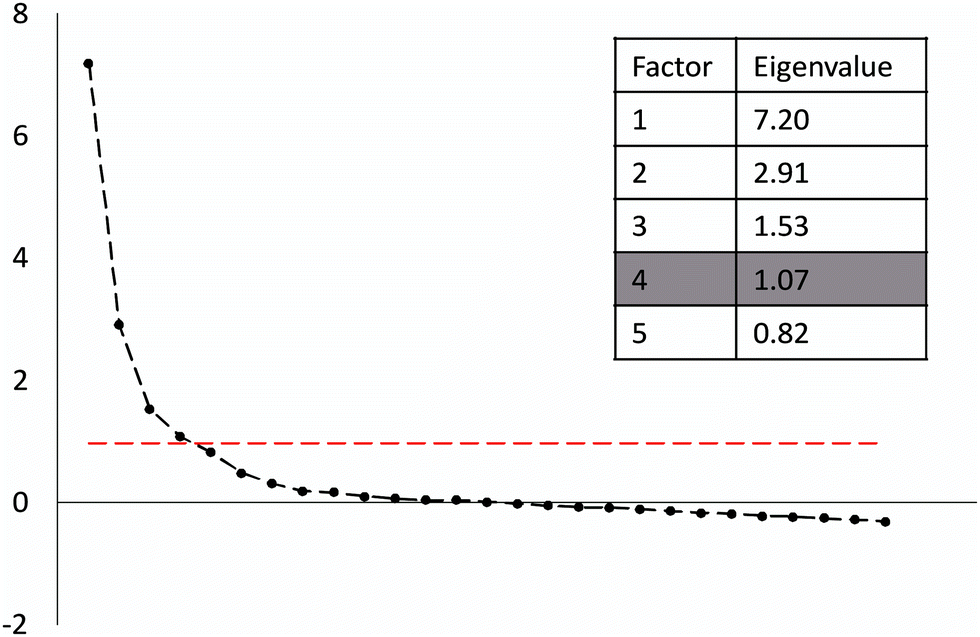 | ||
| Fig. 6 Scree plot and the first five eigenvalues, used to determine that a four-factor model should be used. | ||
The retention of four factors deviates from the five-factor model proposed by Treagust et al. (2002). Though generally, items loaded onto the factors that Treagust et al. (2002) proposed, the factors of ET (explanatory tools) and USM (uses of scientific models) collapsed into a single factor in our analysis. Since scientific models are defined as explanatory and predictive tools (Schwarz et al., 2017), we find it theoretically reasonable to collapse the ET and USM scales into a single factor. We refer to the collapsed/combined sub-scale as USM* for the remainder of our analysis.
In our EFA, items 8 (a model has what is needed to show or explain a scientific phenomenon), 16 (models show a smaller scale size of something), and 23 (models are used to show how they are used in scientific investigations) did not load significantly (≥0.35) onto any factor, shown in Fig. 7. Item 15 (a model shows what the real thing does and what it looks like) cross-loaded onto both the ER and USM* factors (factor loadings on both of these factors was >0.35) (Fig. 7). Loading values can be found in Table 5 in the Appendix.
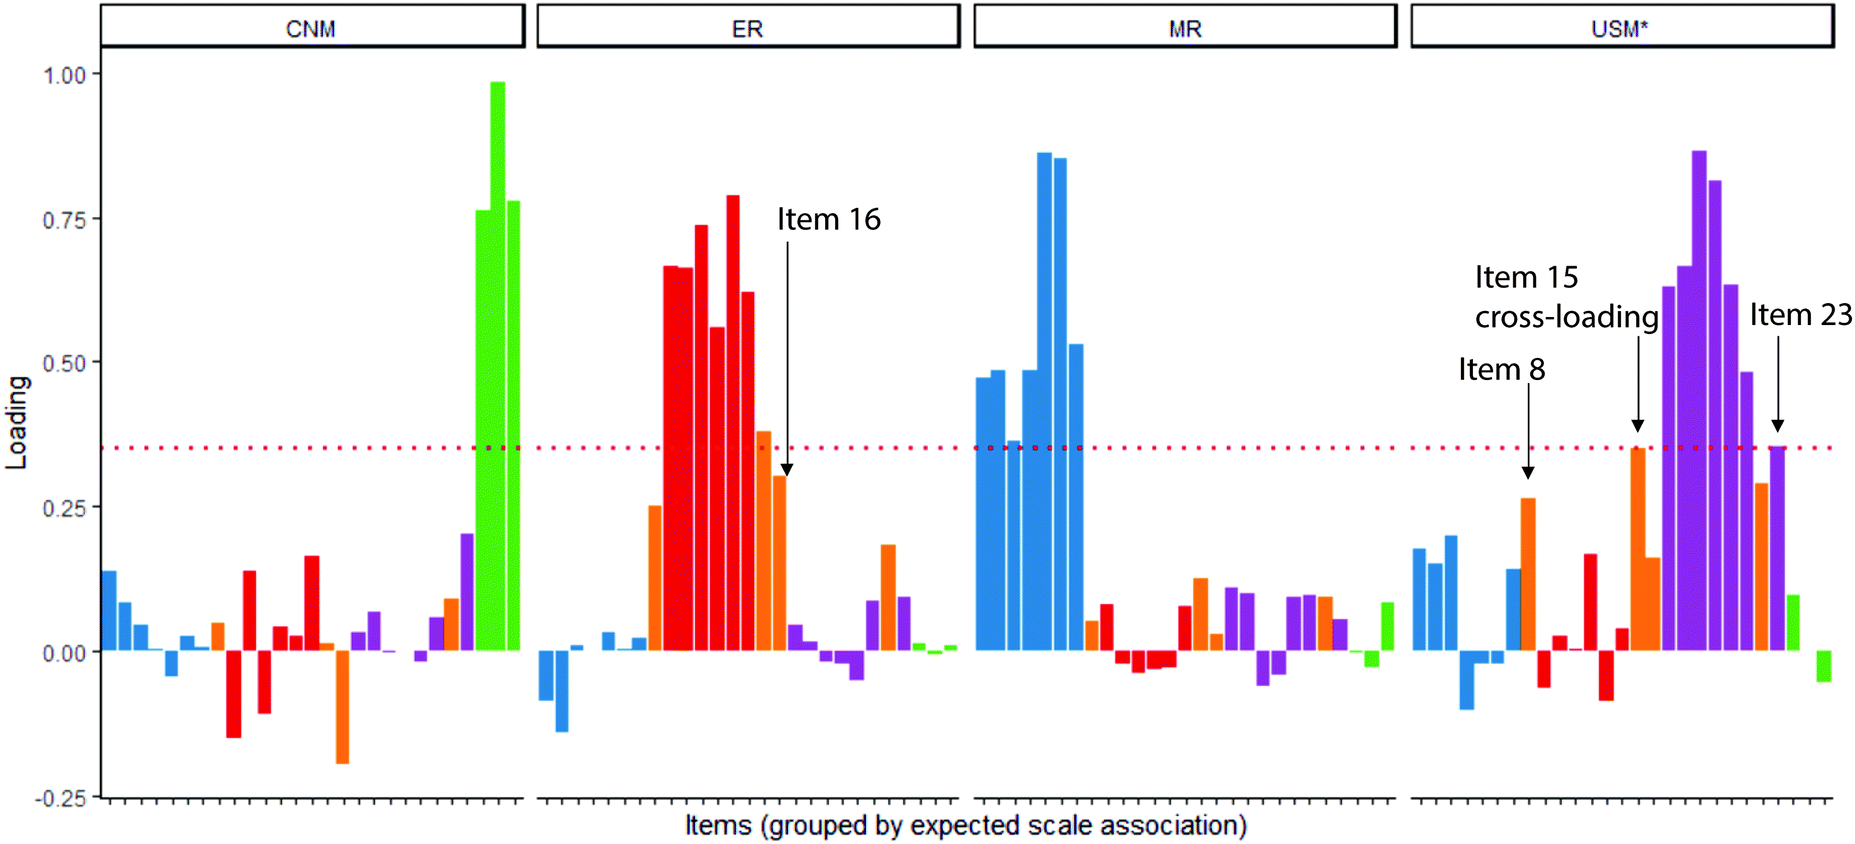 | ||
| Fig. 7 Loading values for 27-item SUMS instrument, grouped by scale association; items 8, 16, and 23 are not loading on any factor (no loading values ≥0.35); item 15 is loading on both ER and USM*. | ||
Both non-loading and cross-loading can be interpreted as evidence of a validity threat. In the case of non-loading, it is unclear what, if anything, the item is actually measuring. Items on the same scale should be at least moderately correlated (evidence of convergent validity, that is, that the items on a single scale measure the same construct) (Campbell, 1960). Non-loading items are not moderately correlated with the items on any of the scales.
In a similar vein, items on different scales should not be highly correlated (evidence of discriminant validity, that is, that items on different scales measure different constructs). When items cross-load (multiple loadings ≥0.35), this indicates that the item may be related to multiple constructs. For example, in the case of item 15 on the SUMS, it is unclear whether the item should be used to measure students’ ideas related to the ER scale or the USM* scale, based on the factor loadings. This can be interpreted as a lack of discriminant validity (Campbell, 1960).
Since items 8, 15, 16, and 23 do not load on exactly one factor, interpretation of students’ responses to SUMS is complicated by their inclusion. Before removing the items based solely on the EFA, we examined the wording/phrasing of the items and the ways in which students responded to the items in response process interviews.
Items 8 and 15 can be considered “double-barreled items” (ask two questions, using the conjunctions and/or), which may lead to respondents’ confusion about the meaning of the items as they can be interpreted as asking multiple questions. For instance, item 15 reads, “A model shows what the real thing does and what it looks like”; a student might be confused about whether they must agree or disagree to both or only one part of the item. We observed in the response process interviews that students expressed some difficulty deciding how to response to these double-barreled items. For instance, one student we interviewed said in response to Item 8 (a model has what is needed to show or explain a scientific phenomenon), “I feel like depending on the model… some models show more than they explain and some models explain more than they show.” Another student suggested, “I would definitely choose a sometimes option if that were a choice because I think that it depends on what type of [model].” Of the eleven students interviewed, seven students commented that they either found the language confusing or might have chosen an alternative central option (like “sometimes”) if given the choice.
In response to Item 15 (a model shows what the real thing does and what it looks like), students also expressed confusion related to the double-barrelled nature of the item for instance, “It's hard for me to think that a model shows what it does. This might make more sense to me if it was two different questions,” and “I’m not sure because some models aren’t in motion. ‘what the real thing does’ means motion, but ‘what it looks like’… This question is asking two different things, so that makes it hard to answer.” Generally, it is considered best practice in test and item development to avoid complex item stems, including double-barrelled stems (Lane et al., 2016; Johnson and Christensen, 2019). Five of the eleven students interviewed identified item 15 as difficult to interpret.
Item 16 (models show a smaller scale size of something), in our opinion, is also phrased in a way that might be confusing for some students. To us, it is unclear whether the item is intended to ask whether models can show phenomena on a smaller scale or that models must scale down phenomena. While some models do represent phenomena on a smaller scale, this is not true of all models; because of this, some students may not have known how to interpret the item, given the available Likert response options. Students articulated this in response process interviews as well; one student said in response to Item 16, “If there was a sometimes option, I would probably choose that. Some models show a smaller scale size of something, but also other models show a larger scale size of something… so when I look at that question, it's like they can show a smaller scale size of something. It makes me not want to agree and not want to disagree because it could [show a smaller scale size of something] but doesn’t always.” Four of the eleven students interviewed identified Item 16 as difficult to interpret and another four students commented that they agreed that models can show a phenomenon on a smaller scale but do not necessarily have to.
Item 23 (models are used to show how they are used in scientific investigations) was also identified in response process interviews as an item that was difficult for students to understand and decide how to respond. Seven of the eleven students interviewed identified Item 23 as difficult to interpret, for instance, “I understand the gist of what it's trying to say, but is ‘they’ referring to models? And I don’t understand how a model could model itself.” Another student stated in response to Item 23, “I guess I would agree? It's a little bit hard to interpret. I don’t know what they mean.” Since each of the items which did not load on exactly one factor also included language that could be confusing for respondents, we removed items 8, 15, 16, and 23 and repeated the factor analysis with a modified 23-item version of SUMS instrument.
The exploratory factor analysis (WLSMV estimation, oblimin rotation, polychoric correlations) with the modified 23-item SUMS also produced four eigenvalues greater than 1, and thus we again retained four factors (Kaiser, 1960). In the 23-item, 4-factor model, items again loaded onto the factors that Treagust et al. (2002) proposed, with the factors of ET (explanatory tools) and USM (uses of scientific models) collapsing into a single factor (USM*). All items loaded on exactly one factor (ignoring factor loading values <0.35), shown in Fig. 8. Loading values can be found in Table 6 in the Appendix.
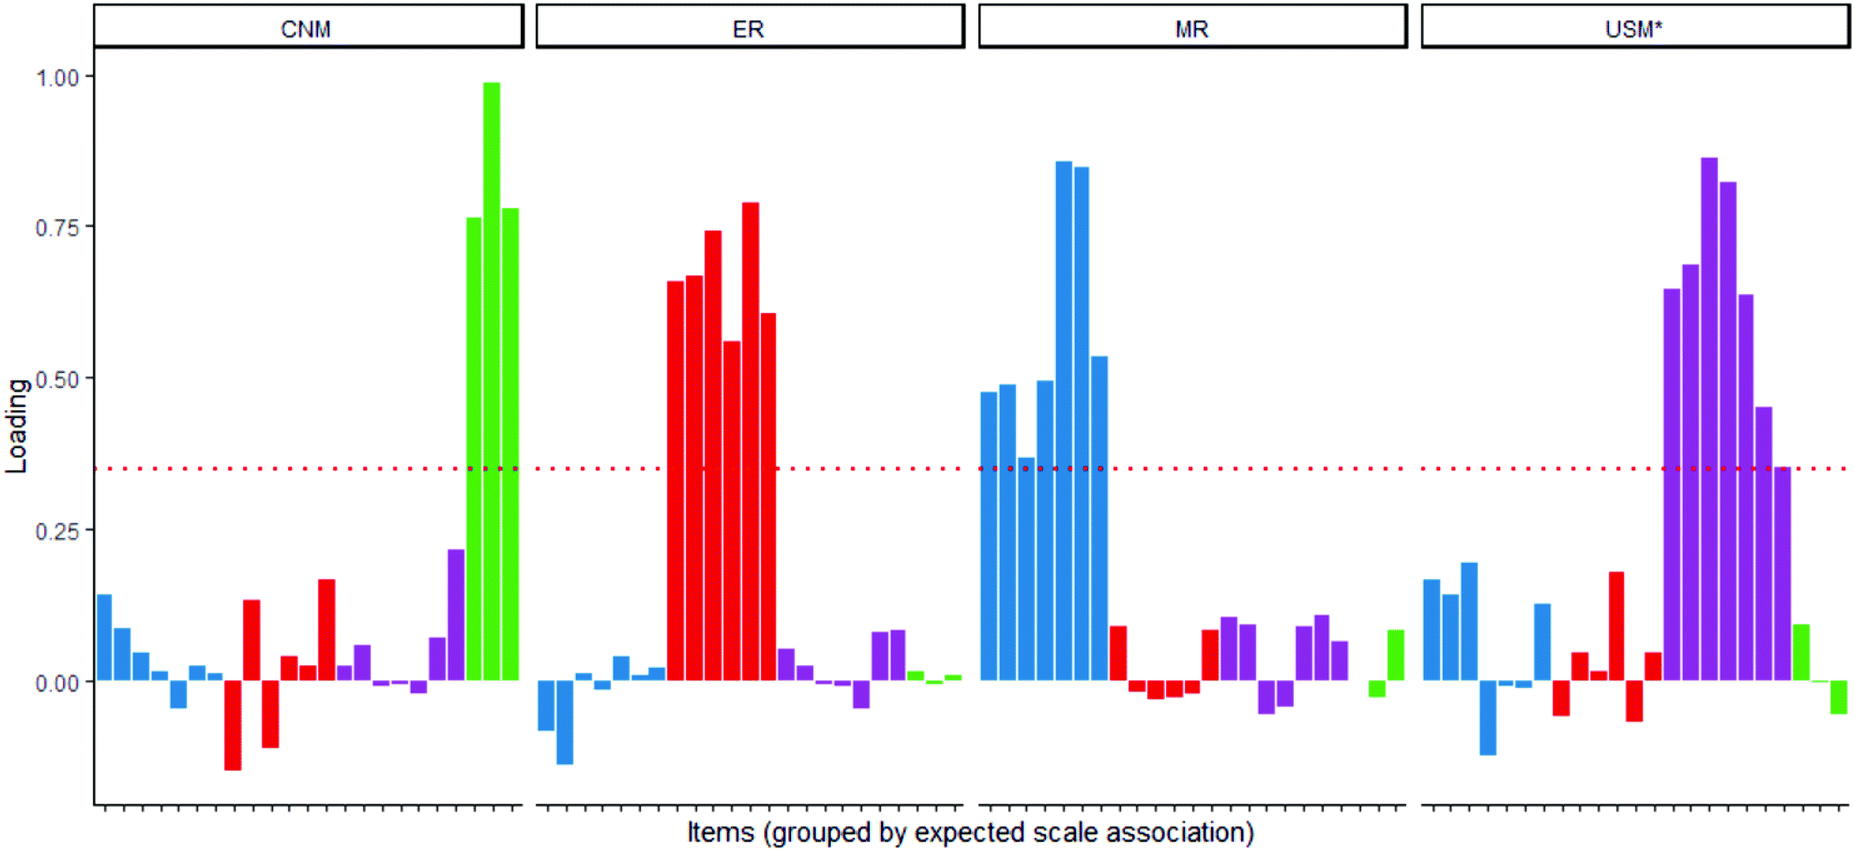 | ||
| Fig. 8 Loading values for 23-item SUMS instrument, grouped by scale association; all items load on exactly one factor. | ||
Confirmatory factor analysis
To investigate whether the factor structure identified in the EFA (23-item, 4-factor model) could be replicated, we conducted a confirmatory factor analysis using the second half of the combined data set. Because of the ordinal nature of the data, we chose to use robust diagonally weighted least squares (WLSMV) as the estimator for the CFA. In Table 4, we report three indices of model fit, as discussed earlier. We also compared model fit indices generated from a CFA using the model reported by Treagust et al. (2002) (27-item, 5-factor model) and the 27-item, 4-factor model, based on the retention of four factors in EFA but with all items included.The incremental fit indices (CFI and TLI) must meet cutoff criteria for the model to be considered an acceptable fit (≥0.95); similarly, the RMSEA index must also meet the cutoff criterion (95% CI includes 0.05) for the model to be considered an acceptable fit. For our analyses, if either the CFI or TLI indices and the RMSEA index meet cutoff criteria, we will draw the conclusion of acceptable model fit.
None of the model fit indices generated in the CFA meet cutoff criteria. Therefore, we conclude that none of the suggested models, the 27-item, 5-factor model reported by Treagust et al. (2002), the modified 27-item, 4-factor model, or the modified 23-item, 4-factor model may be considered acceptable models for these data, according to the pre-specified criteria for the model fit indices.
The CFA fit indices in Table 4 for the original 27-item, 5-factor model and the modified 23-item, 4-factor model were nearly equal. One interpretation of this is that the removal of four potentially problematic items (items 8, 15, 16, and 23) and the retention of four factors (collapsing ET and USM into a single factor, USM*) does not substantially improve data-model fit. Alternatively, another interpretation is that the removal of four potentially problematic items reduced the degrees of freedom, and the model fit did not get worse (in fact, the TLI and CFI values increased slightly). We interpret this as evidence that the simplification of the model (fewer factors, fewer items) did not result in loss of information.
In any case, our CFA results provide little evidence that data generated using the SUMS instrument can be validly interpreted according to the originally-reported model (as it has been in multiple previous studies), nor can the modified models suggested by the EFA in this study be used for valid interpretations of SUMS scores in this population (undergraduate chemistry students).
Reliability
While Treagust et al. (2002) report Cronbach's alpha values as evidence of the internal consistency (reliability) of each of the subscales on the original SUMS instrument, the meaningfulness of these indices are contingent upon the assumption that the data can be interpreted with validity. Since we are concerned about the validity of conclusions about undergraduate chemistry students’ knowledge of scientific models, based on the analyses previously described, we do not report estimates of internal consistency here.Conclusions
In this study, we examined the functioning of the SUMS instrument for assessing undergraduate chemistry students’ understanding of the epistemic nature of scientific models. The purpose of this study was to determine whether the SUMS instrument, which has been adapted for use in many different settings since its original publication, could be used in its original form to make valid and reliable interpretations about students’ knowledge in this context.The Standards for Educational and Psychological Testing describe the process of validation as the collecting of evidence to support an argument that scores from measurements and assessments can be interpreted accurately and as intended (American Educational Research Association, American Psychological Association and National Council on Measurement in Education, 2014). In this manuscript, we examined the internal structure of the SUMS instrument using factor analyses. We conducted factor analyses to investigate the internal structure of the SUMS; using exploratory factor analysis (EFA), we identified a modified four-factor structure by collapsing two of the factors (ET and USM) from the original study. We argue that this alternative structure is theoretically reasonable, given that one of the primary purposes of models (USM) is as explanatory tools (ET). However, based on the confirmatory analysis results presented, we conclude that there is limited evidence that either the originally proposed internal structure nor the modified structures we proposed in this manuscript are appropriate for interpretation of data generated using SUMS; the removal of four items and collapsing of factors ET and USM into a single factor, USM*, resulted in slightly improved CFA fit statistics, though fit statistics did not meet cutoff criteria. We also conducted response process interviews with undergraduate students and observed that students had some difficulty interpreting some of the items on the SUMS.
As a result, we conclude that we cannot make meaningful interpretations of students’ scores on the SUMS instrument in this context (a first-semester undergraduate chemistry course). We also caution researchers and practitioners who wish to use the SUMS instrument in contexts outside of that in which it was originally developed unless additional evidence of validity and reliability can be provided.
Implications
The SUMS instrument has been used in a number of empirical studies as a measure of students’ knowledge about scientific models (Liu, 2006; Everett et al., 2009; Levy and Wilensky, 2009; Gobert et al., 2011; Chang and Chang, 2013; Park, 2013; Cheng et al., 2014; Wei et al., 2014; Cheng and Lin, 2015; Campos et al., 2016; Underwood et al., 2016; Derman and Kayacan, 2017; Park et al., 2017; Pierson et al., 2017; Burgin et al., 2018). In many of these studies, the researchers provide little or no evidence of the psychometric properties of the SUMS instrument, even though it has been adapted in contexts quite different from that in the original study (Australian students grades 8–10) and administered in multiple languages. In those studies which have investigated the psychometric properties of SUMS data (including this study), researchers have found evidence that suggests that SUMS cannot be used in its original form to make valid inferences about students’ epistemic knowledge of models (Wei et al., 2014; Campos et al., 2016).In some studies, the SUMS has been used as a measure of the efficacy of curricular interventions. However, we have identified that interpretations of the data generated using the SUMS instrument may be subject to validity threats, especially in contexts dissimilar to that in Treagust, Chittleborough, and Mamiala's original study (2002). Given that this study and those by other researchers have been unsuccessful in providing suitable evidence of validity and reliability beyond its original context, we caution practitioners considering using or adapting the SUMS as an assessment of students’ knowledge about scientific models. In the case of using the SUMS to draw conclusions about curricular interventions, the SUMS may not be an appropriate measure to detect changes in students’ knowledge about scientific models as a result of the intervention, but it is impossible to know without validity and reliability evidence.
Alternative approaches to assessing students’ knowledge about the epistemic nature of scientific models have been reported in the literature that may be more appropriate for assessing undergraduate chemistry students (e.g., Crawford and Cullin, 2005; Danusso et al., 2010; Gogolin and Krüger, 2016, 2018; Lazenby et al., 2019; Mathesius and Krell, 2019). For instance, in our prior work, we have used the Models in Chemistry Survey, a constructed-response survey, for eliciting students’ ideas about scientific models and modelling (Lazenby, Rupp, et al., 2019; Lazenby, Stricker, et al., 2019; Lazenby et al., 2020). Crawford and Cullin (2005) also used an open-ended questionnaire to characterize pre-service teachers’ epistemic knowledge about scientific models before and after a modelling-focused curricular intervention. Gogolin and Krüger (2018) developed a forced-choice instruments for assessing high school students’ meta-modeling knowledge in biological contexts. In our own ongoing work, we are developing an assessment intended to measure students’ epistemic knowledge of models and modelling in undergraduate chemistry; the ordered-multiple choice assessment will allow us to retain the efficiency of forced-choice assessments like the SUMS, while also supporting claims about the level of sophistication of students’ epistemic knowledge of models and modelling. We encourage those interested in assessing students’ knowledge of scientific models to consider assessment options carefully and to select assessment tools which are appropriate for their learning context, either by selecting assessment tools that have been shown to produce valid and reliable data in similar contexts or by collaborating with educational researchers who are interested in adapting existing tools in new contexts.
Limitations
The intent of this study was to provide evidence about whether the data collected in this study, a context different in multiple ways from Treagust et al. (2002)'s study, could support valid interpretations about undergraduate chemistry students’ knowledge of the epistemic nature of scientific models. We collected data from two semesters of undergraduate chemistry at a single institution, so our findings may not be generalizable to other contexts. While we present data from only one institution, our findings and conclusions are consistent with other studies which have investigated the psychometric properties of SUMS and found insufficient evidence to support the use of SUMS in its original for as an assessment tool (Wei et al., 2014; Campos et al., 2016).Secondly, we did not investigate the SUMS instruments’ properties respective to demographic variables, such as students’ gender, year in school, or stated major. We also did not collect demographic information in the Fall 2016 administration of the SUMS instrument, and we make the assumption that the Fall 2016 and Fall 2017 datasets are comparable on demographics, based on the typical demographic characteristics of the course at our institution and the similarities in student response patterns.
Conflicts of interest
There are no conflicts to declare.Appendix
| MR | ER | USM* | CNM | ||
|---|---|---|---|---|---|
| Q1 | 0.474 | ||||
| Q2 | 0.485 | ||||
| Q3 | 0.364 | ||||
| Q4 | 0.486 | ||||
| Q5 | 0.860 | ||||
| Q6 | 0.852 | ||||
| Q7 | 0.530 | ||||
| Q8 | Not loading on any factor | ||||
| Q9 | 0.665 | ||||
| Q10 | 0.663 | ||||
| Q11 | 0.735 | ||||
| Q12 | 0.560 | ||||
| Q13 | 0.789 | ||||
| Q14 | 0.620 | ||||
| Q15 | 0.379 | 0.352 | Cross-loading on two factors | ||
| Q16 | Not loading on any factor | ||||
| Q17 | 0.629 | ||||
| Q18 | 0.666 | ||||
| Q19 | 0.865 | ||||
| Q20 | 0.813 | ||||
| Q21 | 0.635 | ||||
| Q22 | 0.480 | ||||
| Q23 | Not loading on any factor | ||||
| Q24 | 0.354 | ||||
| Q25 | 0.762 | ||||
| Q26 | 0.984 | ||||
| Q27 | 0.779 | ||||
| MR | ER | USM* | CNM | |
|---|---|---|---|---|
| Q1 | 0.477 | |||
| Q2 | 0.488 | |||
| Q3 | 0.365 | |||
| Q4 | 0.494 | |||
| Q5 | 0.856 | |||
| Q6 | 0.849 | |||
| Q7 | 0.535 | |||
| Q9 | 0.658 | |||
| Q10 | 0.667 | |||
| Q11 | 0.741 | |||
| Q12 | 0.560 | |||
| Q13 | 0.788 | |||
| Q14 | 0.607 | |||
| Q17 | 0.646 | |||
| Q18 | 0.686 | |||
| Q19 | 0.862 | |||
| Q20 | 0.823 | |||
| Q21 | 0.637 | |||
| Q22 | 0.450 | |||
| Q24 | 0.351 | |||
| Q25 | 0.763 | |||
| Q26 | 0.987 | |||
| Q27 | 0.780 |
Acknowledgements
This material is based upon work supported by the National Science Foundation under grant DUE-1611622 and the National Science Foundation Graduate Research Fellowship Program under Grant No. GRFP-1650114. Any opinions, findings, and conclusions or recommendations expressed in this material are those of the authors and do not necessarily reflect the views of the National Science Foundation. We would like to thank Jack Barbera, Michael Mack, and Catherine Welch for providing feedback in the preparation of this manuscript.References
- American Educational Research Association, American Psychological Association and National Council on Measurement in Education, (2014), Standards for Educational and Psychological Testing, American Educational Research Association, Washington, DC: AERA.
- Barlow A. T. et al., (2014), Modeling Instruction: The Impact of Professional Development on Instructional Practices, Sci. Educ., 23(1), 14–26.
- Brewe E., Kramer L. and O’Brien G., (2009), Modeling instruction: Positive attitudinal shifts in introductory physics measured with CLASS, Phys. Rev. Spec. Top.-Phys. Educ. Res., 5(1), 013102.
- Brewe E. et al., (2010), Toward equity through participation in Modeling Instruction in introductory university physics, Phys. Rev. Spec. Top.-Phys. Educ. Res., 6(1), 010106.
- Brown T. L. et al., (2012), Chemistry: The Central Science, 12th edn, United States: Pearson Education, Inc.
- Bryer J. and Speerschneider K., (2017), Likert: analysis and visualization Likert items, R package version 1.3. 5. 2016’.
- Burgin S. R. et al., (2018), High school biology students use of visual molecular dynamics as an authentic tool for learning about modeling as a professional scientific practice, Biochem. Mol. Biol. Educ., 46(3), 230–236.
- Campbell D. T., (1960), Recommendations for APA test standards regarding construct, trait, or discriminant validity, Am. Psychol., 15(8), 546–553.
- Campos V. M. et al., (2016), Assessment of teacher training students’ understanding of the nature of the models, Nature of Science: History, Philosophy and Sociology of Science, pp. 799–805.
- Cangur S. and Ercan I., (2015), Comparison of model fit indices used in structural equation modeling under multivariate normality, J. Mod. Appl. Stat. Methods, 14(1), 152–167.
- Casanova J., (1993), Computer-based molecular modeling in the curriculum, J. Chem. Educ., 70(11), 904–909.
- Chang H.-Y. and Chang H.-C., (2013), Scaffolding students’ online critiquing of expert-and peer-generated molecular models of chemical reactions, Int. J. Sci. Educ., 35(12), 2028–2056.
- Cheng M.-F. and Lin J.-L., (2015), Investigating the relationship between students’ views of scientific models and their development of models, Int. J. Sci. Educ., 37(15), 2453–2475.
- Cheng M.-F. et al., (2014), Developing explanatory models of magnetic phenomena through model-based inquiry, J. Balt. Sci. Educ., 13(3), 351–360.
- Costello A. B. and Osborne J. W., (2005), Best practices in exploratory factor analysis: Four recommendations for getting the most from your analysis, Pract. Assess., Res. Eval., 10(7), 1–9.
- Crawford B. and Cullin M., (2005), Dynamic assessments of preservice teachers’ knowledge of models and modelling, in Boersma K. et al. (ed.) Research and the Quality of Science Education, Dordrecht: Springer Netherlands, pp. 309–323.
- Danusso L., Testa I. and Vicentini M., (2010), Improving prospective teachers’ knowledge about scientific models and modelling: Design and evaluation of a teacher education intervention, Int. J. Sci. Educ., 32(7), 871–905.
- Derman A. and Kayacan K., (2017), Investigating of the Relationship Between the Views of the Prospective Science Teachers on the Nature of Scientific Models and Their Achievement on the Topic of Atom, Eur. J. Educ. Stud., 3(6), 541–559.
- Everett S. A., Otto C. A. and Luera G. R., (2009), Preservice elementary teachers’ growth in knowledge of models in a science capstone course, Int. J. Sci. Math. Educ., 7(6), 1201–1225.
- Forman E. A., (2018), The practice turn in learning theory and science education, Constructivist education in an age of accountability, Switzerland: Springer, pp. 97–111.
- Gobert J. D. et al., (2011), Examining the Relationship Between Students’ Understanding of the Nature of Models and Conceptual Learning in Biology, Physics, and Chemistry, Int. J. Sci. Educ., 33(5), 653–684.
- Gogolin S. and Krüger D., (2016), Diagnosing students’ understanding of the nature of models, Res. Sci. Educ., 47(5), 1–23.
- Gogolin S. and Krüger D., (2018), Students’ understanding of the nature and purpose of models, J. Res. Sci. Teach., 55(9), 1313–1338.
- Grosslight L. et al., (1991), Understanding models and their use in science: Conceptions of middle and high school students and experts, J. Res. Sci. Teach., 28(9), 799–822.
- Holgado-Tello F. P. et al., (2010), Polychoric versus Pearson correlations in exploratory and confirmatory factor analysis of ordinal variables, Qual. Quant., 44(1), 153–166.
- Johnson R. B. and Christensen L., (2019), Educational research: Quantitative, qualitative, and mixed approaches, USA: SAGE Publications, Inc.
- Kaiser H. F., (1960), The application of electronic computers to factor analysis, Educ. Psychol. Meas., 20(1), 141–151.
- Komperda R., Hosbein K. N. and Barbera J., (2018), Evaluation of the influence of wording changes and course type on motivation instrument functioning in chemistry, Chem. Educ. Res. Pract., 19(1), 184–198.
- Lane S., Raymond M. R. and Haladyna T. M., (2016), Handbook of test development, New York: Routledge.
- Lazenby K. et al., (2019), Mapping undergraduate chemistry students’ epistemic ideas about models and modeling, J. Res. Sci. Teach., 57, 794–824.
- Lazenby K. et al., (2019), Undergraduate Chemistry Students’ Conceptualization of Models in General Chemistry, J. Chem. Educ., 96(3), 455–468.
- Lazenby K. et al., (2019), Mapping undergraduate chemistry students’ epistemic ideas about models and modeling, J. Res. Sci. Teach., 57, 794–824.
- Lazenby K. et al., (2020), Undergraduate Chemistry Students’ Epistemic Criteria for Scientific Models, J. Chem. Educ., 97(1), 16–26.
- Levene H., (1961), Robust tests for equality of variances, Contributions to probability and statistics. Essays in honor of Harold Hotelling, pp. 279–292.
- Levy S. T. and Wilensky U., (2009), Students’ Learning with the Connected Chemistry (CC1) Curriculum: Navigating the Complexities of the Particulate World, J. Sci. Educ. Technol., 18(3), 243–254.
- Liu X., (2006), Effects of Combined Hands-on Laboratory and Computer Modeling on Student Learning of Gas Laws: A Quasi-Experimental Study, J. Sci. Educ. Technol., 15(1), 89–100.
- Mathesius S. and Krell M., (2019), Assessing Modeling Competence with Questionnaires, Towards a Competence-Based View on Models and Modeling in Science Education, Cham, Switzerland: Springer, pp. 117–129.
- National Research Council, (2012), A Framework for K-12 Science Education: Practices, Crosscutting Concepts, and Core Ideas, Washington, DC: The National Academies Press.
- National Research Council, (2014), Developing Assessments for the Next Generation Science Standards, National Academies Press.
- Norman G., (2010), Likert scales, levels of measurement and the “laws” of statistics, Adv. Health Sci. Educ., 15(5), 625–632.
- Park S. K., (2013), The relationship between students’ perception of the scientific models and their alternative conceptions of the lunar phases, Eurasia J. Math., Sci. Technol. Educ., 9(3), 285–298.
- Park M. et al., (2017), The effect of computer models as formative assessment on student understanding of the nature of models, Chem. Educ. Res. Pract., 18, 572–581.
- Pierson A. E., Clark D. B. and Sherard M. K., (2017), Learning progressions in context: Tensions and insights from a semester-long middle school modeling curriculum, Sci. Educ., 101(6), 1061–1088.
- Revelle W., (2014), psych: procedures for psychological, psychometric, and personality research, Northwestern University, Evanston, Illinois, 165, 1–10.
- Rosseel Y., (2012), Lavaan: An R package for structural equation modeling and more. Version 0.5–12 (BETA), J. Stat. Softw., 48(2), 1–36.
- Schwarz C. V. and White B. Y., (2005), Metamodeling knowledge: developing students’ understanding of scientific modeling, Cognit. Instr., 23(2), 165–205.
- Schwarz C. V., Passmore C. and Reiser B. J., (2017), Helping students make sense of the world using Next Generation Science and Engineering Practices, NSTA Press.
- Tien L. T., Rickey D. and Stacy A. M., (1999), The MORE thinking frame: Guiding students’ thinking in the laboratory, J. Coll. Sci. Teach., 28(5), 318–324.
- Tien L. T., Teichert M. A. and Rickey D., (2007), Effectiveness of a MORE laboratory module in prompting students to revise their molecular-level ideas about solutions, J. Chem. Educ., 84(1), 175–181.
- Treagust D. F., Chittleborough G. and Mamiala T. L., (2001), Learning introductory organic chemistry: secondary students’ understanding of the role of models and the development of scientific ideas, Paper presented at AERA 2001, Seattle, WA.
- Treagust D. F., Chittleborough G. and Mamiala T. L., (2002), Students’ understanding of the role of scientific models in learning science, Int. J. Sci. Educ., 24(4), 357–368.
- Underwood S. M., Reyes-Gastelum D. and Cooper M. M., (2016), When do students recognize relationships between molecular structure and properties? A longitudinal comparison of the impact of traditional and transformed curricula, Chem. Educ. Res. Pract., 17(2), 365–380.
- Wei S., Liu X. and Jia Y., (2014), Using Rasch measurement to validate the instrument of Students’ Understanding of Models in Science (SUMS), Int. J. Sci. Math. Educ., 12(5), 1067–1082.
| This journal is © The Royal Society of Chemistry 2021 |