 Open Access Article
A highly active Ca/Cu/YCeO2–TiO2 catalyst for the transient reduction of NO with CO and naphthalene under oxidizing conditions†
Luis Sánchezbc,
Gonzalo Aguila a,
Paulo Arayab,
Sergio Quijadac and
Sichem Guerrero
 *c
*c
aDepartamento de Ciencias de la Ingeniería, Facultad de Ingeniería, Universidad Andres Bello, 8031015, Chile
bDepartamento de Ingeniería Química, Biotecnología y Materiales, Universidad de Chile, Casilla 2777, Santiago, Chile
cUniversidad de los Andes, Chile, Facultad de Ingeniería y Ciencias Aplicadas, Monseñor Álvaro del Portillo 12455, Las Condes, Chile. E-mail: sguerrero@uandes.cl
First published on 14th December 2021
Abstract
The transient combustion of biomass leads to the evolution of a variety of pollutants (NO, CO, organic compounds, and many others) that can react with each other on a suitable catalyst to generate compounds of lower toxicity. Here, the transient reduction of NO with CO and naphthalene in the presence of oxygen was studied on a Ca/Cu/YCeO2–TiO2 catalyst. Response surface methodology was used to identify the optimum amounts of calcium, copper, and cerium. The optimized Ca/Cu/YCeO2–TiO2 catalyst was then extensively studied and characterized. The coupling of yttrium-stabilized ceria with TiO2 provided an active support that effectively activated naphthalene. When calcium and copper were added to the support, the obtained Ca/Cu/YCeO2–TiO2 catalyst achieved the full conversion of CO and naphthalene and 72% conversion of NO. The Ca/Cu/YCeO2–TiO2 catalyst possessed labile oxygen species, which might be related to the high catalytic activity.
Introduction
According to the 2020 World Health Statistics report from the World Health Organization, air pollution remains a major environmental problem and accounts for approximately seven million deaths every year.1 In the same year, household air pollution from cooking with polluting fuels and technologies was responsible for 3.8 million deaths.2 The combustion of biomass results in the generation of hundreds or even thousands of chemical species that have been associated with a variety of respiratory problems such as infections in children, chronic obstructive pulmonary disease, pneumoconiosis, cataracts and blindness, and pulmonary tuberculosis along with adverse effects in pregnancy and other problems.3 Polycyclic aromatic hydrocarbons (PAHs), a family of harmful compounds derived from incomplete combustion, are associated with adverse health outcomes due to their carcinogenic, mutagenic, and teratogenic effects.4 In addition to indoor pollution, PAHs are generated from manufacturing processes, metal industries, petroleum fuel spills, coal-, gas-, and biomass-fired power plants, industrial incinerators, and so on.One common approach to study PAHs is the use of naphthalene as a probe molecule. Naphthalene, which is the smallest PAH, is a semi-volatile solid organic compound with a vapor pressure of 0.087 mmHg at 25 °C, making it easy to handle experimentally.5 The decomposition of naphthalene is challenging because of the low reactivity of the aromatic C–H bonds. Thus, several methods such as photocatalysis, biodegradation, solvent extraction, physical adsorption, and the use of biosorbents have been proposed for naphthalene decomposition.6–11 One effective method for the total decomposition of naphthalene is catalytic oxidation, which can achieve a high conversion of naphthalene at mild temperatures; noble metals such as Pt and Pd are the most active catalysts.12–14 However, the increasing demand for platinum from traditional sectors (automotive, jewelry, industry) and emerging green technologies (fuel cells, green hydrogen) is driving higher prices for this metal.15 Similar situations are affecting the prices of other noble metals.16 Fortunately, multiple examples in the literature demonstrate that less expensive metal oxides have interesting oxidation properties comparable to those of noble metals in some cases. For example, Leguizamón et al. obtained 100% conversion of naphthalene at temperatures as low as 200 °C using ZrO2-supported Co, Cu, and Ni catalysts.17 García et al. achieved total oxidation of naphthalene in the temperature range of 250–350 °C using metal oxides such as MnOx, CoOx, CuOx, Fe2O3, and CeO2.18 Zhang et al. found that Co, W, and Mo catalysts supported on γ-Al2O3 achieved the full conversion of naphthalene at temperatures above 450 °C.14 For more complex mixtures of gases, different species compete for active sites on the catalyst surface, which affects the conversion or requires higher temperatures. Ferrandon reported that Al2O3-supported oxides of Cu, Mn, Fe, Co, and Ni could oxidize a combination of CO, naphthalene, and CH4 in various temperature ranges depending on the metal; for example, using Cu and Mn, the total conversion of CO and naphthalene was achieved above 400 °C, while the total conversion of CH4 was achieved at 720 °C.19 Cerda et al. investigated the oxidation of a mixture of methane, naphthalene, and carbon monoxide using iron, copper, and manganese catalysts supported on TiO2 and obtained the full conversion of naphthalene near 280 °C.20 Manganese and copper catalysts supported on a commercial pelletized alumina carrier also achieved the nearly complete conversion of methane, naphthalene, and carbon monoxide around 800 °C.21 These reports suggest that although the catalytic oxidation of a combination of pollutants is plausible, higher temperatures are required to achieve full conversion. The presence of nitric oxide in the combustion mixture adds another layer of complexity. In this case, an alternative strategy is to selectively reduce NO by using other pollutants present in the mixture (e.g., CO, H2, or an organic compound). However, in the case of oxygen-rich exhausts or “lean mixtures,” the reducing compound tends to be oxidized rather than used as a reducer of NO. Multiple examples in the literature employ a combination of metal oxides for the selective reduction of NO.22 Nevertheless, reports on the simultaneous use of CO and naphthalene as reducers of NO in the presence of oxygen are scarce. Our group previously reported the reduction of NO by CO and naphthalene using a CeO2–TiO2-supported copper catalyst.23,24 In those studies, we added potassium to the catalysts to simulate the natural accumulation of this alkali metal in biomass. Then, potassium is later transferred to the catalyst during combustion. The addition of potassium increased the surface basicity, thereby enhancing the formation of nitrites and related compounds, which were later reduced by CO and naphthalene. One problem with this catalytic system is the volatility of potassium, especially at temperatures higher than 500 °C,25 which limits the calcination temperature that the catalyst can be subjected to. To overcome this issue, in the present study, we use calcium, which is the most abundant alkaline earth metal present in biomass ash and is more thermally stable than potassium.26 In this study, Ca was added as a promoter to a YCeO2–TiO2-supported copper catalyst for the reduction of NO by CO and naphthalene as reducers under oxidizing conditions. We present a systematic optimization of the amounts of calcium, copper, and cerium in terms of catalyst activity, and we also characterize the optimized catalyst. To simulate the temperature increase during combustion in a stove, the catalyst activity was studied under transient conditions.
Experimental
The synthesis of the CeO2–TiO2 support began with the preparation of a stock solution consisting of surfactant (Tomadol 91-6) and pentanol (98.5%), which was constantly stirred until a clear mixture was obtained. Two solutions (solution 1 and solution 2) were then prepared separately. Solution 1 was prepared in a 500 mL round-bottom flask by mixing stock solution, 99.5% isooctane, and 25% ammonia in distilled water under stirring. When the mixture was homogeneous, solution 1 was transferred into an addition funnel. Solution 2 was prepared in a 500 mL round-bottom flask by mixing stock solution, isooctane (99.5%), and a solution containing cerium nitrate, yttrium nitrate (Y was added as a stabilizer of CeO2; in all cases described later in the manuscript, 10% Y was added with respect to the amount of Ce), and titanium oxide (all reagents were obtained from Sigma-Aldrich). Solution 1 was slowly added in a drop-wise fashion into solution 2 under vigorous stirring at room temperature. After the two solutions were thoroughly mixed, the mixture was allowed to age overnight at room temperature. The next day, acetone was added, and the mixture was stirred for 1 h and allowed to rest for 2 d. The obtained precipitate was then filtrated and calcined at 500 °C for 3 h. The resulting support, hereafter noted as YCeO2–TiO2, was sequentially impregnated with Cu followed by Ca using copper nitrate and calcium hydroxide (both Sigma-Aldrich), respectively, dissolved in distilled water. After each impregnation, the samples were calcined at 500 °C for 3 h. Response surface methodology (RSM) was employed to select the amounts of copper, calcium, and cerium. RSM can identify the minimum amount of experiments necessary to determine the optimum combination of metals that produce the best catalytic activity.27 For this purpose, a central composite design (CCD) was implemented to model and optimize the different variables based on the experimental responses involving those variables. The statistical analysis of the proposed model was carried out using Design-Expert (version 9) software.The catalytic bed consisted of a proper amount of catalyst deposited on a mineral wool bed inside a quartz tube reactor (I.D. = 1 cm). To simulate the transient conditions of a catalyst in contact with a flow of pollutants from a combustion process, this plug flow reactor was placed in a split oven (Applied Test Systems, Inc.) equipped with a temperature-control system, and the temperature was increased at a rate of 1 °C min−1. Prior to each catalytic test, the samples were reduced in 5% H2/Ar for 1 hat 500 °C. The simulated gaseous mixture (GHSV = 10![[thin space (1/6-em)]](https://www.rsc.org/images/entities/char_2009.gif) 000 h−1) consisted of 500 ppm naphthalene, 500 ppm NO, 1% CO, and 10% O2, and He (balance). The mixture was flowed at 50 cm3 min−1 through a set of mass flow controllers (HORIBA). All lines were heated to avoid the condensation of naphthalene. The outlet of the reactor was screened to monitor the presence of NO, NO2, N2O, CO, naphthalene, and other species using an infrared spectrometer (Shimadzu, IRPrestige 21) equipped with a 2.4 m gas cell (Pike). To verify the concentrations of CO, N2, and O2, a gas chromatograph (Series 580, Gow-Mac) equipped with a 60/80 molecular sieve 5 A column (Supelco) was used along with a mass spectrometer (OmniStar, Pfeiffer). Mid-infrared DRIFTS analyses were carried out using the above mentioned infrared spectrometer but with a temperature-controlled stainless-steel reactor (Pike). Structural changes during reaction were monitored using a Raman spectrometer (Horiba Scientific, XploRA™) equipped with 532 and 785 nm lasers along with a temperature-controlled reactor cell (LINKAM). Temperature-programmed reduction (TPR) profiles were recorded using a stream of 5% H2/Ar and a temperature ramp of 10 °C min−1. Prior to analysis, a small sample was oxidized in pure O2 at 350 °C for 1 h and then cooled to room temperature. Scanning electron microscopy (SEM) was performed for selected samples (FEI, Quanta 250). The BET surface areas were obtained from N2 adsorption isotherms using a Micromeritics 2010 adsorption apparatus.
000 h−1) consisted of 500 ppm naphthalene, 500 ppm NO, 1% CO, and 10% O2, and He (balance). The mixture was flowed at 50 cm3 min−1 through a set of mass flow controllers (HORIBA). All lines were heated to avoid the condensation of naphthalene. The outlet of the reactor was screened to monitor the presence of NO, NO2, N2O, CO, naphthalene, and other species using an infrared spectrometer (Shimadzu, IRPrestige 21) equipped with a 2.4 m gas cell (Pike). To verify the concentrations of CO, N2, and O2, a gas chromatograph (Series 580, Gow-Mac) equipped with a 60/80 molecular sieve 5 A column (Supelco) was used along with a mass spectrometer (OmniStar, Pfeiffer). Mid-infrared DRIFTS analyses were carried out using the above mentioned infrared spectrometer but with a temperature-controlled stainless-steel reactor (Pike). Structural changes during reaction were monitored using a Raman spectrometer (Horiba Scientific, XploRA™) equipped with 532 and 785 nm lasers along with a temperature-controlled reactor cell (LINKAM). Temperature-programmed reduction (TPR) profiles were recorded using a stream of 5% H2/Ar and a temperature ramp of 10 °C min−1. Prior to analysis, a small sample was oxidized in pure O2 at 350 °C for 1 h and then cooled to room temperature. Scanning electron microscopy (SEM) was performed for selected samples (FEI, Quanta 250). The BET surface areas were obtained from N2 adsorption isotherms using a Micromeritics 2010 adsorption apparatus.
Results and discussion
Optimization of metal contents
RSM with CCD was applied to construct a mathematical model for identifying the importance of each metal loading and estimating the optimum loadings for each metal. In this model, the weight percentages of cerium, copper, and calcium were the independent variables, while the expected experimental response was the temperature required to obtain the 80% conversion of carbon monoxide, XCO_80%, during the reduction of NO with CO and naphthalene (this choice was based on the ease of reading from conversion plots). Table 1 shows the experimental metal loadings or the ranges for each studied variable (for statistical calculations, the coded values of the variables were set at the following levels: −α, −1, 0, +1, +α). To determine the highest and lowest boundary values of each variable, preliminary experiments were carried out.| Variables | Symbols | Ranges and levels | ||||
|---|---|---|---|---|---|---|
| xi | −α | −1 | 0 | +1 | +α | |
| Cerium (%) | x1 | 4.4 | 16 | 33 | 50 | 61.6 |
| Copper (%) | x2 | 1 | 1.4 | 2 | 2.6 | 3 |
| Calcium (%) | x3 | 1 | 1.8 | 3 | 4.2 | 5 |
For three variables, 20 experiments were required: eight factorial/cube points, six center points, and six star/axial points (center points are used to accurately estimate the pure error, whereas star points give information about the quadratic relationship between response and independent variables). Table 2 lists the 20 runs, including the specific metal loadings per run and the obtained experimental responses. The conversion plots of the 20 runs are included in the ESI.† The detailed analysis of the variance associated with the adjusted model (ANOVA) is fully described in the ESI.† The significant regression model was as follows (R2 = 90.26%):
| XCO_80% = 171.87 − 3.60Ce − 6.46Cu + 6.69Ca + 5.75(Cu)(Ce) − 1.5(Ce)(Ca) − 4.25(Cu)(Ca) − 2.96(Ca)2 |
| Run | Ce content [wt%] | Cu content [wt%] | Ca content [wt%] | Temperature for XCO = 80% [°C] |
|---|---|---|---|---|
| 1 | 16 | 2.6 | 1.8 | 152 |
| 2 | 33 | 2 | 3 | 173 |
| 3 | 50 | 2.6 | 4.2 | 163 |
| 4 | 33 | 2 | 3 | 165 |
| 5 | 33 | 2 | 3 | 173 |
| 6 | 16 | 1.4 | 1.8 | 172 |
| 7 | 16 | 2.6 | 4.2 | 163 |
| 8 | 33 | 1.0 | 3 | 184 |
| 9 | 33 | 2 | 3 | 171 |
| 10 | 50 | 1.4 | 1.8 | 155 |
| 11 | 16 | 1.4 | 4.2 | 195 |
| 12 | 33 | 3.0 | 3 | 166 |
| 13 | 50 | 1.4 | 4.2 | 177 |
| 14 | 33 | 2 | 1.0 | 155 |
| 15 | 50 | 2.6 | 1.8 | 163 |
| 16 | 33 | 2 | 5.0 | 176 |
| 17 | 33 | 2 | 3 | 168 |
| 18 | 33 | 2 | 3 | 171 |
| 19 | 61.6 | 2 | 3 | 170 |
| 20 | 4.4 | 2 | 3 | 185 |
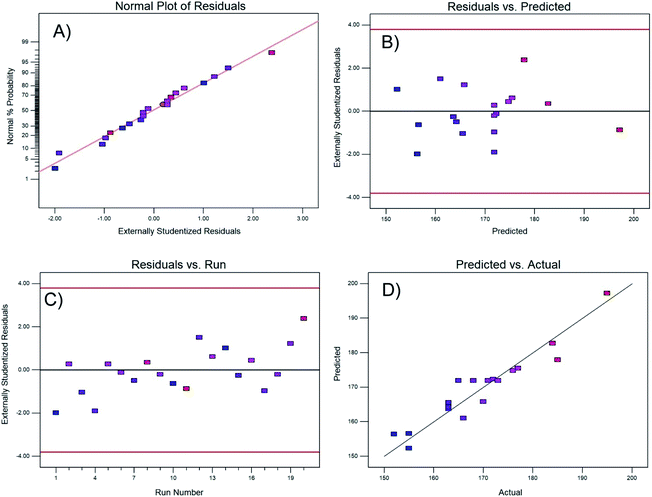 | ||
| Fig. 1 Residual test of the regression model: (A) normality, (B) residual vs. predicted response, (C) residuals vs. experimental run, and (D) predicted vs. actual value. | ||
Fig. 1B and C demonstrate the constant variance of the data; both plots correctly show that there is no pattern, and the residuals are randomly distributed within the band centered at zero, independently if it is the residual for the predicted value or the residual from a certain run.
Finally, Fig. 1D shows that the actual experimental data and the values predicted by the regression model are approximately fit by a straight line, demonstrating the effectiveness of the model. To visualize the interactions between variables, Fig. 2 shows contour and three-dimensional plots with the copper and calcium contents as examples (other interactions are included in the ESI†). The iso-response contour lines in Fig. 2A show that the lowest temperatures (blue shading) required to achieve 80% CO conversion are located at copper and calcium contents of 2.6 and 1.8 wt%, respectively. Similarly, in Fig. 2B, the response surface shows the lowest XCO_80% when the copper and calcium contents are 2.6 and 1.8 wt%, respectively. To confirm the latter optimal loadings, numerical optimization was carried out in Design Expert by minimizing the response (XCO_80%). The result of this optimization indicated that the optimum metal loadings are 2.6 wt% Cu, 1.8 wt% Ca, and 16 wt% Ce. Therefore, the following sections describe a detailed analysis of the specific catalyst with these optimized metal loadings. For simplicity of notation, this ideal catalyst is denoted as Ca/Cu/YCeO2–TiO2.
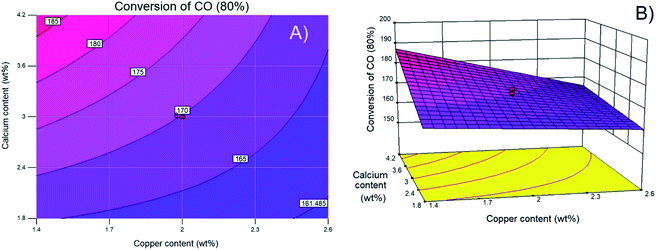 | ||
| Fig. 2 (A) Contour and (B) surface plots of calcium content versus copper content as weight percent. | ||
Activity results
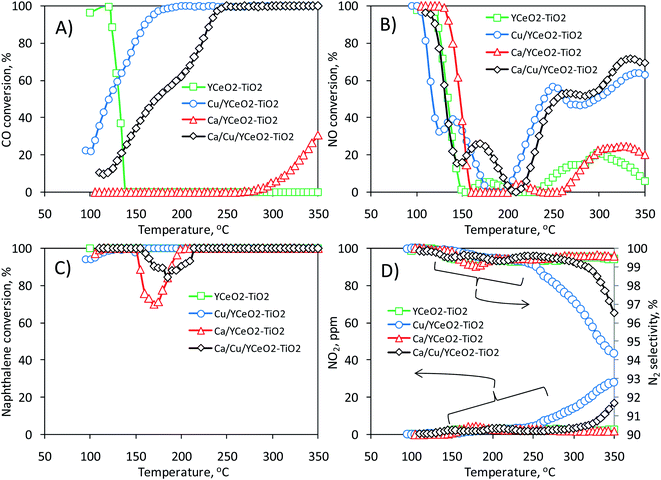
Fig. 3 shows the activity of the Ca/Cu/YCeO2–TiO2 catalyst during the transient reduction of NO with CO and naphthalene in the presence of oxygen. Along with the Ca/Cu/YCeO2–TiO2 catalyst, Fig. 3 also includes the activities of two mono-metallic catalysts, Ca/YCeO2–TiO2 (1.8% Ca) and Cu/YCeO2–TiO2 (2.6% Cu), and the support YCeO2–TiO2 (16% Ce). As shown in Fig. 3A, the CO conversion gradually increased with temperature from 100 °C until full conversion was reached at 250 °C. Slightly higher activity was observed for the Cu/YCeO2–TiO2 catalyst, which reached full CO conversion around 185 °C; however, at temperatures above 250 °C, CO conversion was accompanied by the generation of NO2 (Fig. 3D), which is an unwanted side- reaction (NO2 itself is an air pollutant and forms ozone in the atmosphere and acid rain). Nevertheless, as shown in the right-axis of Fig. 3D, all N2 selectivities were above 94% within the studied temperature range. On the other hand, as shown in Fig. 3A, CO conversion was negligible on the YCeO2–TiO2 support (note that the high conversion at low temperature is actually the physical adsorption of CO on the support). In contrast, some CO conversion was achieved above 300 °C when the support contained calcium (Ca/YCeO2–TiO2).When inspecting the simultaneous NO conversion during the reaction (Fig. 3B), similar results were obtained for the Ca/Cu/YCeO2–TiO2 and Cu/YCeO2–TiO2 catalysts; NO conversion increased with increasing temperature starting at 200 °C and reached maximum values of 72% and 64% around 340 °C, respectively. Note that the Ca/YCeO2–TiO2 and YCeO2–TiO2 samples showed some degree of conversion in the temperature range of 250 –300 °C (maximum conversions of 25% and 20%, respectively). As shown later, in all cases, the activity below 150 °C corresponds to physical adsorption rather than NO reaction. As for NO and CO, the conversion of naphthalene was monitored during the reaction (Fig. 3C). All samples were active in the conversion of naphthalene, with a slight decrease in conversion between 150 °C and 200 °C. Given the partial reduction of NO, it seems that the use of both CO and naphthalene as reducing agents is only partial with the remaining conversion of both resulting from their direct oxidation with oxygen. This point is explored later.
X-ray diffraction (XRD)
The crystallinity of each sample was analyzed by XRD (Fig. 4). The anatase phase of tetragonal TiO2 was clearly indicated by diffraction peaks at 25.5°, 38°, and 49°, which correspond to the (101), (112), and (200) planes of anatase (JCPDS #21-1272). However, the peaks of the Y2O3 and CeO2 phases overlap with each other (Y2O3was used as a surface stabilizer of CeO2), and the diffraction signals observed at 29.5°,33.3°,49°, and 56° could respectively correspond to the (111), (200), (220), and (311) planes of the cubic fluorite structure of CeO2 (JCPDS #81-0792) or the (222), (400), (440), and (541) planes of body-centered cubic Y2O3 (29.3°, 33.9°, 48.72°, and 56.38°, respectively; JCPDS #88-1040). Regardless, the XRD patterns demonstrate that the TiO2 phase in the catalysts was anatase, in agreement with the Raman results. Due to the overlap between the CeO2 andY2O3 peaks, it was not possible to confirm the crystalline structure of CeO2. However, since Y and Ce were subjected to similar conditions during the synthesis of the support (same impregnation method, the same calcination temperature, etc.), we suspect that the diffraction signal includes contributions from the crystalline phases of both Y2O3and CeO2. The diffraction signal of copper oxide (JCPDS #45-0937) was not observed in any of the copper-containing samples, consistent with the TPR results showing a high dispersion of copper.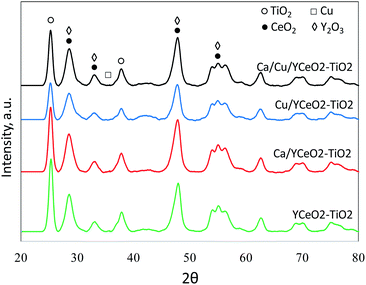 | ||
| Fig. 4 X-ray diffraction of the Ca/Cu/YCeO2–TiO2, Cu/YCeO2–TiO2, Ca/YCeO2–TiO2and Cu/YCeO2–TiO2 samples. Each curve is correspondingly labeled. | ||
BET results
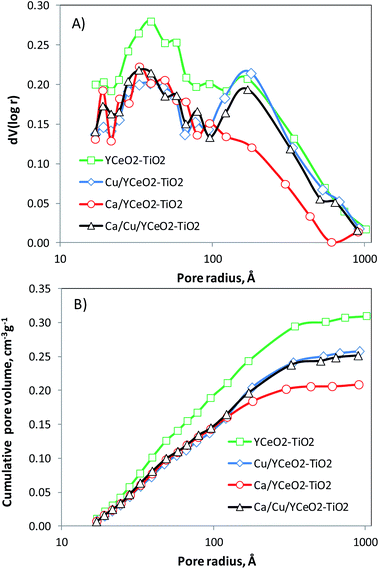
The pore distribution of the YCeO2–TiO2 support (Fig. 5A) exhibits a maximum around 40 Å and another at 170 Å. After adding calcium to form Ca/YCeO2–TiO2, the entire distribution decreased, as is evident from the cumulative pore volume (Fig. 5B). Note that the peak at 170 Å was almost negligible after adding calcium. On the other hand, although the entire pore distribution also decreased upon the addition of copper to YCeO2–TiO2 (Cu/YCeO2–TiO2), the addition of copper hardly affected the peak at 170 Å.The weak blocking effect of the large pores seems to be related to the high dispersion of copper,28 whereas the alkaline metal effectively blocked large pores.29 Note that the peak at 170 Å was preserved for the Ca/Cu/YCeO2–TiO2 catalyst despite the decrease in the entire pore distribution. Recall that the Ca/Cu/YCeO2–TiO2 catalyst was first impregnated with Cu and then further impregnated with Ca after calcining. This suggests that adding copper first prevents the migration of calcium into the pores, thereby preserving the pore distribution. The cumulative pore volume is also consistent with this interpretation; the pore volumes were similar for the Ca/Cu/YCeO2–TiO2 and Cu/YCeO2–TiO2 samples (Fig. 5B). As mentioned above, the pore volume of the Ca/YCeO2–TiO2 sample was much smaller, especially within the larger pore sizes. This suggests that calcium blocked pores more effectively when the sample was impregnated with calcium alone compared to Cu followed by Ca. Table 3 shows the BET surface areas and total pore volumes of the calcined samples (repeated three times with error less than 1 m2 g−1). The BET surface area of the YCeO2–TiO2 support was 115 m2 g−1. The addition of copper or calcium led to a similar decrease in the BET surface area, but a more abrupt decrease in pore volume was observed for Ca/YCeO2–TiO2 compared to Cu/YCeO2–TiO2. Among the samples, the Ca/Cu/YCeO2–TiO2 catalyst showed the lowest decrease in surface area compared to the support, and its pore volume was similar to that of Cu/YCeO2–TiO2. This again suggests the ability of copper to prevent the blocking of pores by calcium.
| Sample | Area m2 g−1 | Pore volume cm3 g−1 |
|---|---|---|
| YCeO2–TiO2 | 115 | 0.31 |
| Cu/YCeO2–TiO2 | 88 | 0.26 |
| Ca/YCeO2–TiO2 | 87 | 0.21 |
| Ca/Cu/YCeO2–TiO2 | 92 | 0.25 |
Temperature-programmed desorption (TPR)
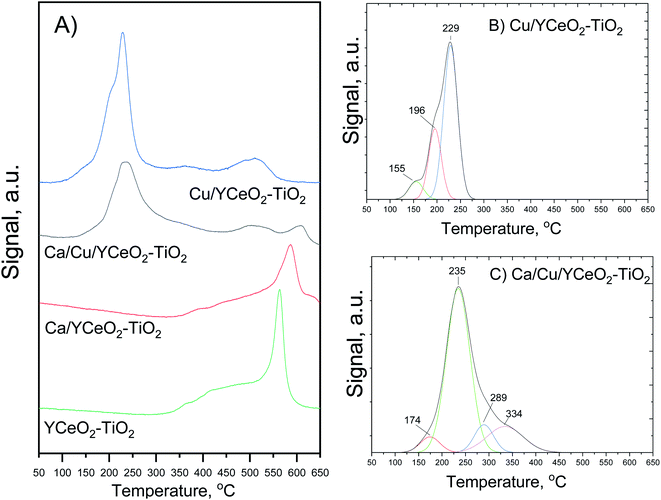
The reducibility of the catalysts was studied based on the gradual reduction in hydrogen with increasing temperature. Fig. 6A shows that the copper-containing catalyst had a wide reduction profile with especially strong reduction in the 150–350 °C range, which was not observed in the Ca/YCeO2–TiO2 and YCeO2–TiO2 samples. Fig. 6B and C show the deconvolution of the reduction profiles in the 150°C-350 °C range for the Cu/YCeO2–TiO2 and Ca/Cu/YCeO2–TiO2 catalysts, respectively. For Cu/YCeO2–TiO2, the reductions at 155 °C, 196 °C, and 229 °C are related to the reduction of highly dispersed copper species: (i) highly dispersed CuO species in close contact with the support (155 °C); (ii) small and dispersed oxide clusters that have not yet formed crystallites (196 °C); and (iii) small clusters of CuO (229 °C).30,31 On the other hand, when calcium was added to the catalyst containing copper, a shift toward higher temperatures was observed, and the main reduction peak appeared at 235 °C (Fig. 6C). This shift is related to the electropositive character of calcium, which interacts strongly with surface oxygen, making it more difficult to remove these oxygen atoms.32The reduction peaks corresponding to highly dispersed copper species at 155 °C and 196 °C for the Cu/YCeO2–TiO2 catalyst were replaced by a weak peak at 174 °C for the Ca/Cu/YCeO2–TiO2 catalyst, while new reduction peaks appeared at 289 °C and 334 °C. The latter copper reduction profile can likely be attributed to the aggregation of large Cu crystallites, which are difficult to reduce. Both copper-containing catalysts showed a reduction peak at 500 °C, which can be ascribed to the reduction of surface oxygen species; in contrast, the Ca/Cu/YCeO2–TiO2 catalyst showed a reduction peak around 600 °C associated with the reduction of bulk ceria.33–35 Note that the intensity of the reduction peaks decreased upon the addition of calcium, suggesting that the interactions with a more electropositive compound (calcium) reduced the amount of oxygen extracted in the reduction process. In the case of the YCeO2–TiO2 support, reduction began slowly at ca. 300 °C and proceeded with increasing temperature, with a sharp reduction peak observed at 560 °C. The reduction of the support starting at 300 °C is related to the reduction of labile oxygen atoms in the surface CeO2 (ref. 33–35) whereas the sharp peak at 570 °C might correspond to the reduction of oxygen atoms on the TiO2 surface.36
As before, the addition of calcium to the CeO2–TiO2 support caused the reduction peaks to shift toward higher temperatures. The reduction of Ca/YCeO2–TiO2 began around 350 °C, and the sharp reduction peak associated with TiO2was flattened and appeared at a higher temperature of 580 °C. The temperature shift and less intense reduction peaks reflect the electronic interactions between calcium and the support, which hinder the reduction of surface oxygen and thus require higher temperatures for reduction.
Raman spectroscopy
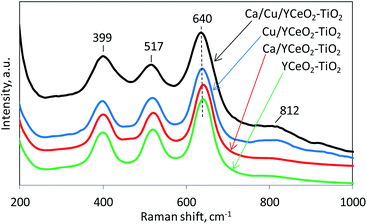
The crystalline structures of the catalysts were analyzed by Raman spectroscopy in the range of 50–5000 cm−1. The most important features of each spectrum (Fig. 7) are located in the range of 200–1000 cm−1 and include the characteristic vibration bands of the anatase phase of TiO2 at 399 cm−1 (B1g), 517 cm−1 (A1g), and 640 cm−1 (Eg).37 On the other hand, CeO2 has only one allowed Raman mode with a F2g symmetry from the symmetric breathing mode of O atoms around each cation.38 However, this signal, which usually appears around 465 cm−1, was not clearly observed for any of the samples, suggesting that the CeO2 signal may have been obscured by the TiO2 signal. The relatively weak Raman signal of CeO2 compared to TiO2 might be ascribed to the more defective structure and/or lower crystallinity of ceria.39,40 However, we cannot rule out that the lower loading of CeO2 compared to TiO2 led to a less intense Raman signal from CeO2. Note that the copper-containing samples, Ca/Cu/YCeO2–TiO2 and Cu/YCeO2–TiO2, showed a small broad signal around 812 cm−1, and this signal was rather weak in the Ca/YCeO2–TiO2 and YCeO2–TiO2 samples. The latter signal at 812 cm−1 is attributed to the adsorption of oxygen species on two-electron defects.41 These labile oxygen species are highly reactive, which might contribute to the high activity of the Ca/Cu/YCeO2–TiO2 and Cu/YCeO2–TiO2 catalysts.42–45Diffuse reflectance infrared Fourier transformed spectroscopy (DRIFTS)
To follow the species formed on the catalyst surface, DRIFTS analysis was performed for each sample under the reduction of NO with CO and naphthalene in the presence of oxygen. Separately, using the same catalysts, a series of reactions was studied to understand the dynamics of the formation of different species on the catalyst surface during the reactions. The studied reactions involved the oxidation of NO, the oxidation of CO, the oxidation of naphthalene, and the reduction of NO with CO in oxygen. The detailed DRIFTS spectra for these reactions using each sample are included in the ESI.† As shown in Fig. 8, multiple bands gradually developed during the reduction of NO with CO and naphthalene in the presence of oxygen. Although it is highly likely that the infrared absorption bands overlap with each other, the most important bands are observed at 1627 cm−1 (molecular water), 1535 cm−1 (carbonates46 or nitrite/nitrate species), 1446 cm−1 (linear nitrites47,48), 1364 cm−1 (ionic nitrates49), 1304 cm−1 (hyponitrites on highly basic sites50), and 1219 cm−1 (bridging bidentate nitrites).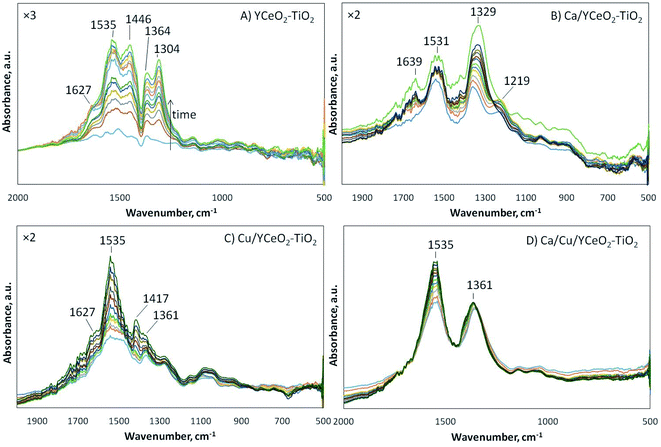 | ||
| Fig. 8 DRIFTS analysis of the reduction of NO with CO and naphtalene in oxygen on the (A) YCeO2–TiO2, (B) Ca/YCeO2–TiO2, (C) Cu/YCeO2–TiO2, and (D) Ca/Cu/YCeO2–TiO2catalysts at 200 °C for 1 hour. | ||
As shown in Fig. 8A, the DRIFTS spectrum of the YCeO2–TiO2support displays most of the above-described bands, in agreement of the support showing activity for NO reduction. Although the activity curve for the support (Fig. 3) indicates negligible conversion of NO, the complete conversion of naphthalene was observed on the support, suggesting that naphthalene served as a reducing agent for the support. In fact, the support could reduce NO to a certain degree. According to the literature, the formation of bands in the range of 1380–1360 cm−1 is associated with the evolution of nitrites into ionic nitrates, which are capable of displacing adsorbed carbon-containing species.50–57 Therefore, in all samples, the absorbed species were likely nitrates/nitrites. Note that the support showed infrared absorption (1304 cm−1) from hyponitrites at highly basic sites. When calcium was added (Ca/YCeO2–TiO2), which increased the basic character of the support, this band shifted to 1329 cm−1.
For the copper-containing samples (Fig. 8C and D), a similar evolution of bridging and chelating bidentate nitrates was observed, as indicated by the band at 1535 cm−1.58 The difference between the copper-containing samples was that the Ca/Cu/YCeO2–TiO2 catalyst showed a strong infrared absorption signal of ionic nitrates at 1361 cm−1, while this signal was weak in the Cu/YCeO2–TiO2 catalyst. Note that Cu/YCeO2–TiO2 generated the highest amount of NO2 at the reactor outlet, suggesting that the Cu/YCeO2–TiO2 catalyst readily consumed the ionic nitrates, forming gaseous NO2. Although the Ca/Cu/YCeO2–TiO2 catalyst also produced NO2, this NO2 might come from other species of nitrates/nitrites populating the support surface. It is important to note that the signal for the Cu/YCeO2–TiO2 catalyst was amplified by a factor of two (Fig. 8C) with respect to the signal of the Ca/Cu/YCeO2–TiO2 catalyst (Fig. 8D). In other words, because the Ca/Cu/YCeO2–TiO2 catalyst was more active than the Cu/YCeO2–TiO2 catalyst, more surface species are accumulated on the surface of the Ca/Cu/YCeO2–TiO2 catalyst.
As mentioned above, the surface area and total pore volume of the Cu/YCeO2–TiO2 and Ca/Cu/YCeO2–TiO2 catalysts were similar. Thus, the surface area and pore volume cannot explain the difference in activity between the catalysts (Fig. 3). On the other hand, the TPR curves suggest that the more active Ca/Cu/YCeO2–TiO2 catalyst had a lower reducibility than the Cu/YCeO2–TiO2catalyst, in agreement with the slightly lower Raman signal for labile oxygen species for this catalyst. These results suggest that the lower availability of oxygen species led to the accumulation of ionic nitrates and nitrite/nitrate species. When the latter does not occur and there is a higher availability of labile oxygen species, the catalyst is very active in oxidizing CO and also producing NO2 (Cu/YCeO2–TiO2 catalysts, Fig. 3A). Therefore, the addition of calcium decreased the reducibility of the catalyst and the availability of labile oxygen species, resulting in a lower capacity for oxidizing CO, less NO2 production, and slightly higher activity for NO reduction. Notably, the addition of ceria promoted the conversion of naphthalene, possibly providing reducing species, thereby compensating for the lower CO conversion on the Ca/Cu/YCeO2–TiO2 catalyst. Although CeO2 has been reported to have a much higher naphthalene oxidation activity than TiO2,59 the conversion of naphthalene by the mixed YCeO2–TiO2 catalyst obtained herein is the highest reported to date.
In summary, labile oxygen species seem to play an important role in the reduction of NO with CO and naphthalene, which is also the case for other reported reactions.60–63 The presence of these species allows for the mild reduction of NO when copper is not present. However, in the presence of copper, CO and naphthalene readily react at the copper sites, providing reducing species for NO reduction. It is highly likely that the reduced copper sites are again oxidized due to the highly oxidizing conditions of the reaction (Mars-van Krevelen mechanism). Although it is not currently clear how the NO reduction proceeds, we can speculate that NO is first oxidized to NO2, which is more reactive, at the copper sites.28 The generated NO2 is adsorbed at contiguous sites, forming nitrate/nitrites species, which are then reduced by the reacting CO and naphthalene. The inclusion of an alkaline earth metal seems to increase the basic character of the surface, allowing the formation of these nitrate/nitrites species. Moreover, this process does not block the copper sites, which remain highly active. These results suggest that the adsorption of nitrate/nitrite species occurs preferentially at calcium sites or on the support.
Conclusions
We have studied the reduction of NO with CO and naphthalene in the presence of oxygen under transient conditions. The Ca/Cu/YCeO2–TiO2 catalyst was highly active in reducing NO with a maximum conversion of 72% and full conversion of CO and naphthalene. The preliminary results suggest that labile oxygen species are responsible of the activity of the catalyst. The YCeO2–TiO2 support provides a reactive surface where CO and naphthalene can react. The addition of copper and calcium to the support facilitated the oxidation of NO, which enhanced the formation of nitrate/nitrate species. These species were then reduced by CO and naphthalene. The presence of oxygen facilitates this reaction process.In conclusion, the results demonstrate the promise of using volatile organic compounds (represented here by naphthalene) as reducing agents for the selective reduction of NO with CO in the presence of high concentrations of oxygen during the transient combustion of biomass. The Ca/Cu/YCeO2–TiO2 catalyst is a highly active catalyst for the elimination of NO when other byproducts of combustion such as CO and organic compounds are present. The studied Ca/Cu/YCeO2–TiO2 catalyst is a promising noble metal-free catalyst that can be applied in the elimination of pollutants generated during the transient combustion of biomass.
Conflicts of interest
There are no conflicts to declare.Acknowledgements
The Chilean National Commission for Scientific and Technological Research (CONICYT) is gratefully acknowledged for funding this work (FONDECYT Regular 1160721 and FONDEF IDeA ID16I10358).References
- World Health Organization. 2021 WHO global air quality guidelines: particulate matter (PM2.5 and PM10), ozone, nitrogen dioxide, sulfur dioxide and carbon monoxide. World Health Organization. https://apps.who.int/iris/handle/10665/345329. Licencia: CC BY-NC-SA 3.0 IGO. World Health Organization, Geneva. 2021 Search PubMed.
- Public Health and Environment, https://www.who.int/data/gho/data/themes/topics/topic-details/GHO/household-air-pollution. World Health Organization. Global Health Observatory (GHO), Geneva. 2021.
- M. A. Arbex, J. E. D. Cançado, L. A. A. Pereira, A. L. F. Braga and P. H. d. N. Saldiva, J. Bras. Pneumol., 2004, 30, 158–175 CrossRef.
- H. I. Abdel-Shafy and M. S. M. Mansour, Egyp. J. Pet., 2016, 25, 107–123 CrossRef.
- US EPA, Compendium Method TO-15, Determination of Volatile Organic Compounds (VOCs) in Air Collected in Specially-Prepared Canisters and Analyzed by Gas Chromatography/Mass Spectrometry (GC/MS), U.S. Environmental Protection Agency, Cincinnati, OH, USA. 1999 Search PubMed.
- N. Barrios, P. Sivov, D. D'andrea and O. Núñez, Int. J. Chem. Kinet., 2005, 37, 414–419 CrossRef CAS.
- M. Farhadian, P. Sangpour and G. Hosseinzadeh, RSC Adv., 2016, 6(45), 39063–39073 RSC.
- J. Shao, Y. Cheng, C. Yang, G. Zeng, W. Liu, P. Jiao and H. He, J. Environ. Sci., 2016, 47, 120–129 CrossRef CAS PubMed.
- Q. Shi, A. Li, Z. Zhu and B. Liu, J. Environ. Sci., 2013, 25, 188–194 CrossRef CAS.
- X. Quan, Q. Tang, M. He, Z. Yang, C. Lin and W. Guo, J. Environ. Sci., 2009, 21, 865–871 CrossRef CAS.
- Z. Xi and B. Chen, J. Environ. Sci., 2014, 26, 737–748 CrossRef CAS.
- A. K. Neyestanaki and L.-E. Lindfors, Fuel, 1998, 77, 1727–1734 CrossRef CAS.
- D. Sellick, D. Morgan and S. Taylor, Catalysts, 2015, 5, 690–702 CrossRef CAS.
- X. W. Zhang, S. C. Shen, L. E. Yu, S. Kawi, K. Hidajat and K. Y. S. Ng, Appl. Catal. A, 2003, 250, 341–352 CrossRef CAS.
- Platinum Quarterly Report for the first quarter of 2021. World Platinum Investment Council (WPIC). 2021 Search PubMed.
- J. Matthey, PGM market report, 2021 Search PubMed.
- M. S. Leguizamón Aparicio, M. A. Ocsachoque, D. Gazzoli, I. L. Botto and I. D. Lick, Catalysts, 2017, 7, 293 CrossRef.
- T. García, B. Solsona and S. H. Taylor, Appl. Catal., B, 2006, 66, 92–99 CrossRef.
- M. Ferrandon, Mixed metal oxide - noble metal catalysts for total oxidation of volatile organic compounds and carbon monoxide, in Trita-KET NV - 137, Kemiteknik, Stockholm, 2001. p. 122 Search PubMed.
- C. Cerda, L. Romero, R. Jiménez, G. Fuentes, M. A. Centeno and N. Alarcón, J. Chil. Chi. Soc., 2006, 51, 1015–1021 CAS.
- J. Carnö, M. Berg and S. Järås, Fuel, 1996, 75, 959–965 CrossRef.
- N. O. Popovych, S. O. Soloviev and S. M. Orlyk, Theor. Exp. Chem., 2016, 52, 133–151 CrossRef CAS.
- C. Morales, N. López, G. Aguila, P. Araya, F. Scott, A. Vergara-Fernández and S. Guerrero, Mat. Chem. Phys., 2019, 222, 294–299 CrossRef CAS.
- F. Venegas, N. López, L. Sánchez-Calderón, G. Aguila, P. Araya, X. Guo, Y. Zhu and S. Guerrero, Catal. Sci. Technol., 2019, 9, 3408–3415 RSC.
- Z. Xu, Y. Li, H. Shi, Y. Lin, Y. Wang, Q. Wang and T. Zhu, Catalysts, 2021, 11, 419 CrossRef CAS.
- G. Zając, J. Szyszlak-Bargłowicz, W. Gołębiowski and M. Szczepanik, Energies, 2018, 11, 2885 CrossRef.
- R. H. Myers, D. C. Montgomery and C. Anderson-Cook, Response Surface Methodology: Process and Product Optimization Using Designed Experiments, ed. W. Sons, Wiley, New Jersey. 2016. vol. 705 Search PubMed.
- S. Guerrero, I. Guzmán, G. Aguila, B. Chornik and P. Araya, App. Catal. B, 2012, 123–124, 282–295 CrossRef CAS.
- C. Li, J. Cheng, Q. Ye, F. Meng, X. Wang and H. Dai, Catalysts, 2021, 11, 329 CrossRef CAS.
- J. Xiaoyuan, D. Guanghui, L. Liping, C. Yingxu and Z. Xiaoming, J. Mol. Catal. A: Chem., 2004, 218, 187–195 CrossRef.
- Z. Rong, S. Yuhan, P. Shaoyi, H. Tiandou, L. Tao and X. Yaning, J. Nat. Gas Chem., 2000, 9, 110–118 CAS.
- S. Guerrero, I. Guzmán, G. Aguila and P. Araya, Catal. Commun., 2009, 11, 38–42 CrossRef CAS.
- C. Papadopoulos, K. Kappis, J. Papavasiliou, J. Vakros, M. Kuśmierz, W. Gac, Y. Georgiou, Y. Deligiannakis and G. Avgouropoulos, Catal. Today, 2020, 355, 647–653 CrossRef CAS.
- J. Papavasiliou, M. Rawski, J. Vakros and G. Avgouropoulos, ChemCatChem, 2018, 10, 2096–2106 CrossRef CAS.
- S. Sun, D. Mao and J. Yu, J. Rare Earths, 2015, 33, 1268–1274 CrossRef CAS.
- H. Zhu, Z. Qin, W. Shan, W. Shen and J. Wang, J. Catal., 2004, 225, 267–277 CrossRef CAS.
- T. Ohsaka, F. Izumi and Y. Fujiki, J. Raman Spectrosc., 1978, 7, 321–324 CrossRef.
- J. R. McBride, K. C. Hass, B. D. Poindexter and W. H. Weber, J. Appl. Phys., 1994, 76, 2435–2441 CrossRef CAS.
- F. Vindigni, M. Manzoli, A. Damin, T. Tabakova and A. Zecchina, Chem. -Eur. J., 2011, 17, 4356–4361 CrossRef CAS PubMed.
- R. Fiorenza, M. Bellardita, L. D'Urso, G. Compagnini, L. Palmisano and S. Scirè, Catalysts, 2016, 6, 121 CrossRef.
- V. V. Pushkarev, V. I. Kovalchuk and J. L. d'Itri, J. Phys. Chem. B, 2004, 108, 5341–5348 CrossRef CAS.
- J. I. Gutiérrez-Ortiz, B. de Rivas, R. López-Fonseca and J. R. González-Velasco, Appl. Catal., B, 2006, 65, 191–200 CrossRef.
- N. Hickey, P. Fornasiero, J. KaÅ¡par, J. M. Gatica and S. Bernal, J. Catal., 2001, 200, 181–193 CrossRef CAS.
- Q. Dai, X. Wang and G. Lu, Appl. Catal., B, 2008, 81, 192–202 CrossRef CAS.
- D. Yu, Y. Liu and Z. Wu, Catal. Commun., 2010, 11, 788–791 CrossRef CAS.
- G. Socrates, Infrared and Raman Characteristic Group Frequencies, Chichester, England, 2001 Search PubMed.
- K. I. Hadjiivanov, Catal. Rev., 2000, 42, 71–144 CrossRef CAS.
- A. A. Davydov, Infrared Spectroscopy of Adsorbed Species on the Surface of Transition Metal Oxides, J. Wiley & Sons., New York, 1990 Search PubMed.
- L. Liu, B. Liu, L. Dong, J. Zhu, H. Wan, K. Sun, B. Zhao, H. Zhu, L. Dong and Y. Chen, App. Catal. B, 2009, 90, 578–586 CrossRef CAS.
- C. Sedlmair, K. Seshan, A. Jentys and J. Lercher, J. Catal., 2003, 214, 308–316 CrossRef CAS.
- N. López, G. Aguila, P. Araya and S. Guerrero, Catal. Commun., 2018, 104, 17–21 CrossRef.
- Y. Chi and S. S. C. Chuang, J. Phys. Chem. B, 2000, 104, 4673–4683 CrossRef CAS.
- T. J. Toops, D. B. Smith and W. P. Partridge, Catal. Today, 2006, 114, 112–124 CrossRef CAS.
- S. Kikuyama, I. Matsukuma, R. Kikuchi, K. Sasaki and K. Eguchi, Appl. Catal. A, 2002, 226, 23–30 CrossRef CAS.
- P. Broqvist, H. Grönbeck, E. Fridell and I. Panas, Catal. Today, 2004, 96, 71–78 CrossRef CAS.
- C. Drouet, P. Alphonse, J. L. G. Fierro and A. Rousset, J. Colloid Interface Sci., 2000, 225, 440–446 CrossRef CAS PubMed.
- C. Drouet, P. Alphonse and A. Rousset, Phys. Chem. Chem. Phys., 2001, 3, 3826–3830 RSC.
- M. Y. Mihaylov, V. R. Zdravkova, E. Z. Ivanova, H. A. Aleksandrov, P. S. Petkov, G. N. Vayssilov and K. I. Hadjiivanov, J. Catal., 2021, 394, 245–258 CrossRef CAS.
- T. Garcia, B. Solsona and S. Taylor, App. Catal. B, 2006, 66, 92–99 CrossRef CAS.
- M. Labaki, S. Siffert, J.-F. Lamonier, E. A. Zhilinskaya and A. Aboukaïs, App. Catal. B, 2003, 43, 261–271 CrossRef CAS.
- P. M. Shah, J. W. H. Burnett, D. J. Morgan, T. E. Davies and S. H. Taylor, Catalysts, 2019, 9, 475 CrossRef CAS.
- A. Aranda, S. Agouram, J. M. López, A. M. Mastral, D. R. Sellick, B. Solsona, S. H. Taylor and T. García, App. Catal. B, 2012, 127, 77–88 CrossRef CAS.
- B. Solsona, R. Sanchis, A. M. Dejoz, T. García, L. Ruiz-Rodríguez, J. M. López Nieto, J. A. Cecilia and E. Rodríguez-Castellón, Catalysts, 2017, 7, 96 CrossRef.
Footnote |
| † Electronic supplementary information (ESI) available. See DOI: 10.1039/d1ra08412g |
| This journal is © The Royal Society of Chemistry 2021 |

