DOI:
10.1039/D1RA08315E
(Paper)
RSC Adv., 2021,
11, 39420-39427
K-doped CeO2–ZrO2 for CO2 thermochemical catalytic splitting†
Received
12th November 2021
, Accepted 1st December 2021
First published on 12th December 2021
Abstract
Green syngas production is a sustainable energy-development goal. Thermochemical H2O/CO2 splitting is a very promising sustainable technology allowing the production of H2 and CO with only oxygen as the by-product. CeO2–ZrO2 systems are well known thermochemical splitting catalysts, since they combine stability at high temperature with rapid kinetics and redox cyclability. However, redox performances of these materials must be improved to allow their use in large scale plants. K-doped systems show good redox properties and repeatable performances. In this work, we studied the effect of potassium content on the performances of ceria–zirconia for CO2 splitting. A kinetic model was developed to get insight into the nature of the catalytic sites. Fitting results confirmed the hypothesis about the existence of two types of redox sites in the investigated catalytic systems and their role at different K contents. Moreover, the model was used to predict the influence of key parameters, such as the process conditions.
Introduction
H2/CO production through thermochemical H2O/CO2 splitting is an important technological strategy to address environmental energy concerns. Notably, the upgrading of captured CO2 into synthetic fuels offers a great opportunity to store solar energy in chemicals and at the same time allows major greenhouse gas disposal, becoming an important energy challenge.1 Single-step thermochemical CO2 splitting above 2500 °C is technically unprofitable because of high operating temperature and unavoidable mixing of explosive gaseous products.2 As an alternative, several catalytic thermochemical cycles have been proposed.3–6 Two-step processes (catalyst self-reduction and oxidation) are generally preferred to multi-step cycles because of their smaller efficiency losses.7
The two-step process can be schematized by the following reactions:
| |
 | (a) |
| | |
MOn−δ(s) + CO2 → MOn(s) + δCO
| (b) |
where MO
n(s) is the non-stoichiometric metal oxide used as catalyst, and MO
n−δ(s) is its reduced form. Ceria is well known for its capacity for oxygen storage and release. Upon reduction step, a fraction of Ce
4+ is transformed into Ce
3+ ions, creating oxygen vacancies in the lattice, which facilitate the volumetric diffusion of O
2− ions. At high temperature, high concentration of oxygen vacancies can be obtained without any change in the crystallographic structure.
8
However, a ceria-based cycle shows some drawbacks, the main of which is related to high temperature required in the reduction step, that give rises to some issues about stability of operating materials, making this cycle not fully repeatable. After 500 reduction/oxidation runs, coarsening of the microstructure and decreasing in reaction rate are evident.9 To increase the oxygen storage and decrease operating temperature, doping with other metal oxides is often employed.8,10 According to Muhich and Steinfeld,11 tetravalent cations are more beneficial dopants than the di- and tri-valent ones and among 26 tetravalent elements only Hf-, Zr-, Pr-, and Tb-doped ceria showed stable structure and performances.12 In particular, CeO2 reduction capability increases by the addition of the smaller Zr4+ ions, which promote lattice deformation in CeO2, making oxygen diffusion easier.13 The best redox performance is achieved if Ce(IV) cations are replaced by about 25 mol% Zr(IV) species.14 The major issue of Zr-doped ceria is the loss of reactivity during cycling due to diffusion limitations associated to material sintering. The powder morphology, and in turn the preparation method of the materials, plays an important role to address this issue and to improve redox properties.15 As a result, the introduction of cations with valence ≤ 3+ in Zr-doped ceria lattice has been investigated,8 in order to achieve thermal stability and to enhance splitting activity.8,16,17 Other literature studies showed that water splitting via redox cycles of alkali metals allows to operate at lower temperature than the conventional ones. Miyaoka et al.18 investigated the feasibility of the alkali metal redox triphasic cycles by thermodynamic analyses. The sodium and potassium cycles could run at 500 °C, featuring high solar-to-fuel efficiency due to the heat recovery. However, this kind of process is strongly affected by separation issues and high cost of maintenance.18 Interestingly, Maneerung et al.19 investigated the behaviour of K-doped perovskites and found a positive role of K-doping on catalytic performances towards the water–gas shift (WGS) reaction.19 Notably, the formation of active –OH species is promoted by the addition of electropositive alkali metals, leading to an increase in the number of adsorption-active sites characterized by a high thermal stability.20 In a recent work, we found that the K-doping significantly enhances the CO2 splitting performance of ceria–zirconia systems due to the increase of oxygen vacancies.21 In this study, the influence of K content is assessed, and a kinetic model is developed to shed light on the nature of the active sites. The model is exploited to forecast the effect of dopant concentration, operating conditions, and process set-up on redox performances. The model is expected to provide key guidelines to support the material design and synthesis.
Materials and methods
Materials preparation
Details of material preparation are reported elsewhere.15,22 Briefly, ceria-based catalysts with Ce/Zr = 3 and different K contents were prepared by co-precipitation. In particular, Ce0.75Zr0.25O2, K0.02Ce0.73Zr0.24O1.97, K0.07Ce0.70Zr0.23O1.90, K0.1Ce0.68Zr0.22O1.86, K0.15Ce0.65Zr0.21O1.8, and K0.20Ce0.63Zr0.21O1.75 catalysts were investigated in this work. Cerium(III) nitrate hexahydrate, Ce(NO3)3·6H2O; zirconium(IV) oxynitrate hydrate, ZrO(NO3)2·xH2O; potassium nitrate, KNO3 were used as reagents (Sigma-Aldrich, used as received). Stoichiometric amounts of precursor salts were dispersed into bi-distillate water (75 mL) under magnetic stirring (200 rpm for 3 h). Then, the solution was dried at 120 °C overnight and calcined under air flow at 1100 °C for 4 hours.
Experimental procedures
To evaluate the redox properties of each sample, thermogravimetric analysis (TGA) was performed by using a TGA/DSC TA instrument Q600SDT. K-doped ceria–zirconia samples were tested in two consecutive redox cycles.15,22 30 mg sample were loaded into an alumina pan and pre-treated up to 1200 °C (air atmosphere, heating rate 10°C min−1, not reported) to remove any carbonate species and, consequently, measure only oxygen loss upon reduction in the further run. Next, the sample was cooled down to ambient temperature and, after 1 hour under N2 flow, was heated up to 1350 °C (heating rate 20 °C min−1 and isotherm for 40 min) under 0.1 NL min−1 N2 flow (reported only for experimental data). After that, the sample was cooled down to 1000 °C (cooling rate 40 °C min−1, reported only for experimental data), the atmosphere was switched to CO2 and temperature was kept constant for 90 min. Finally, the temperature was increased up to 1350 °C under N2 flow, and the sample was kept at this constant temperature for 40 min before repeating the oxidation step, as previously described. TPR/TPO analysis was used to evaluate reduction properties of the catalytic materials. Temperature was increased to 1020 °C (heating rate 10 °C min−1) and then kept constant for 20 min, under a 5% vol H2 flow in N2 at 10 NL h−1. TPR cycles were alternated with TPO under the same temperature ramp using a flowrate of 9.7 NL h−1 of 3% vol H2O in N2. Oxygen release upon reduction and CO formed upon oxidation was calculated from the weight change in TG.
Mathematical model
To get insights into the nature of the catalyst sites involved in the thermochemical redox cycles, a model was proposed to fit the thermogravimetric analysis data collected during CO2 splitting tests. The estimated parameters allowed to investigate the effect of the catalyst composition and the operating conditions such as the CO2 inlet fraction and operating temperature.
Model
As reported in the literature, K-doping can play an important role in promoting catalytic activity of transition metal oxides in redox processes, enhancing both the reduction step and the splitting one. Even though the K+ partial diffusion into the matrix cannot be prevented, due to high temperature treatment, it is expected that K+ ions are essentially segregated onto the catalyst surface in the form of K2O species in agreement with several studies.23 The K+–O2− bonding is a typical hard acid–hard base bond characterized by a significant electron density transfer from K+ to O2− enhancing the basic characteristics of O2− ions.24 Consequently, on the surface of the catalysts, the oxygen ions of the ceria framework that are adjacent to K+ are displaced towards it giving a distortion in their distance (d1) from Ce4+ ions (Fig. 1). This feature might affect the cerium reducibility behaviour, and Ce4+–Ce3+ reduction as reported for other K-doped materials,23,25,26 depending on K concentration. Meanwhile, the oxygen ions of K2O can act as preferential adsorption sites for acid molecules, such as CO2.27 Furthermore, the presence of Ce3+ ions close to these adsorption sites, contributes to C–O bond weakening, thus promoting CO production during the oxidation step. Due to K+ diffusion, similar features are expected in the bulk. Therefore, K-doping could lead to the formation of active sites both on the surface and in the bulk.
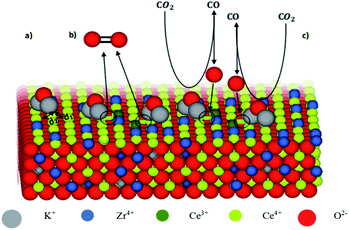 |
| | Fig. 1 Model of K-doped ceria–zirconia fluorite structure with exposed surface. | |
Fig. 1 shows the model of K-doped ceria–zirconia fluorite structure with exposed surface. For the sake of simplicity, the figure only shows the functioning of surface sites (a–c). The interaction between K+ and adjacent oxygen O2− of the ceria network leads to the lengthening of the distance d2 between Ce4+ and O2− and simultaneous shortening of the distance d1 between Ce4+ and the opposite O2− (a). The electron density transfer toward Ce4+ stabilizes Ce3+, resulting in oxygen release (formation of oxygen vacancies, circled in Fig. 1(b)). K2O acts as an adsorption site for CO2, and Ce3+ contributes to C–O bond weakening, promoting CO production and Ce3+ oxidation, re-establishing initial conditions (c).
Assuming these microscopic features, a kinetic model was developed accordingly, based on the Polanyi–Wigner equation under the Redhead approximation, which states that catalytic sites do not interact. The reaction mechanism is a redox mechanism with the presence of two sites σ1red and σ2red, in the reduced form, and σ1 and σ2, in the oxidized form.
According to this hypothesis, the reaction mechanism is:
| |
 | (1) |
| |
 | (2) |
| | |
σ1red + σ2 ⇄ σ1 + σ2red
| (3) |
σ1 and
σ2 are surface-like and bulk-like sites, respectively. We refer to “surface-like” and “bulk-like” sites because in Ce–Zr solid solution an improved reducibility of bulk sites overlapping with surface reduction can be detected due to enhanced oxygen mobility.
28,29 Therefore, reactions
(1–3) represent the series of bulk-to-surface oxygen diffusion and reaction. Fractions
θi and
θired are defined as the fraction of oxidized and reduced active material, respectively. It should be noted that the experimental values of
θ =
θ1 +
θ2 are derived by the experimental TGA curve. In particular, they are calculated by normalizing the current sample weight as:
| |
 | (4) |
where
w(
t) is the sample weight at any given time
t,
wmin is the minimum weight of the sample after complete reduction, and
w0 is the initial weight of the sample.
The reaction rates of steps ((1) and (2)) are:
| |
 | (7) |
| |
 | (8) |
where
θ1 and
θ2 are the oxidized site fractions,
θ1red and
θ2red are the reduced site fractions,
ni are the overall reaction orders, and
ki and

are the kinetic constants which are evaluated as follows:
| |
 | (9) |
| |
 | (10) |
| |
 | (11) |
| |
 | (12) |
where
E1red,
E2red,
E1ox, and
E2ox are the overall activation energies,
k01,
k02 
, and

are the frequency factors, and
YCO2 is the carbon dioxide molar fraction.
For the equilibrium reaction (3), the forward and back reaction rates were defined as follows
| |
 | (13) |
| |
 | (14) |
Model equations
The thermo-gravimetric (TG) cell and the catalyst load were negligible with respect to the gas phase volume  As a consequence, the cell was modelled as a differential reactor, without any spatial changes of the gas phase concentration. Accordingly, the balance equations on θ1, θ2, θ1red, θ2red, and YCO2 are:
| |
 | (15) |
| |
 | (16) |
| |
 | (17) |
| |
 | (18) |
| |
 | (19) |
where τ is the residence time calculated considering a total flow of 0.1 NL min−1 and an alumina crucible volume equal to 0.11 cm3.
The initial conditions are:
| | |
t = 0 θ1red = θ01red
| (22) |
| | |
t = 0 θ2red = θ02red
| (23) |
Eqn (15)–(19), with the initial conditions (20)–(24), were solved with MATLAB using the solving routine ode23s, based on a modified Rosenbrock formula of order 2, due to the stiffness nature of the equations system. The first reduction step was not simulated because it is a transient phase characterized by recombination and reorganization of active sites (Fig. 2). For simplicity, at the end of this step, the active fraction of material has been considered as entirely reduced (θ1 + θ2 = 0).
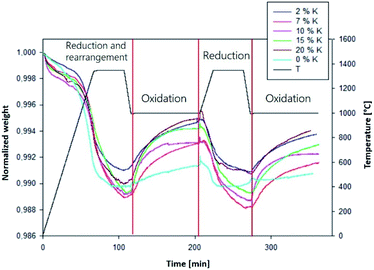 |
| | Fig. 2 Normalized weight and temperature as a function of time,  for K0.02Ce0.73Zr0.24O1.97, K0.07Ce0.70Zr0.23O1.90, K0.1Ce0.68Zr0.22O1.86, and K0.15Ce0.65Zr0.21O1.8 catalysts. for K0.02Ce0.73Zr0.24O1.97, K0.07Ce0.70Zr0.23O1.90, K0.1Ce0.68Zr0.22O1.86, and K0.15Ce0.65Zr0.21O1.8 catalysts.  for Ce0.75Zr0.25O2, K0.20Ce0.63Zr0.21O1.75 catalysts. for Ce0.75Zr0.25O2, K0.20Ce0.63Zr0.21O1.75 catalysts. | |
Results and discussion
Experimental results
In Fig. 2, the experimental TG curves as a function of time and the correspondent temperature profile at different K percentage are shown.
After the initial transient weight loss occurring in the first reduction step, a stable and reproducible redox cycle is established. Therefore, in the following we refer to the first stable oxidation and consequent reduction of the material as “first cycle”. Table 1 reports the total amount of consumed CO2 (i.e., CO formed) and released O2, as evaluated by TG measurements.
Table 1 Produced CO, released O2, and calculated reduction degree, oxidation yield, and reductions yield in the TG redox cycle of the investigated catalyst
| K wt% |
CO formed I cycle [μmol gcat−1] |
O2 released [μmol gcat−1] |
| 0 |
97 |
52 |
| 2 |
221 |
123 |
| 7 |
247 |
157 |
| 10 |
238 |
140 |
| 15 |
298 |
158 |
| 20 |
294 |
148 |
As confirmed in ref. 21, the K addition significantly improves redox performances if compared with the undoped material; in particular, O2 generation has more than doubled for most samples and trebled for samples with 7 and 15 wt% K. CO generation follows a similar pattern. Therefore, K-doping enhances the redox performances in terms of evolved O2 and CO amounts.
The calculated fraction of active material θ = θ1 + θ2, as defined by eqn (4), is shown as a function of the K weight percentage in Fig. 3. It is worth stressing that K-doping significantly increases θ up to 7 wt% of potassium. Beyond this value, the addition of potassium does not significantly affect the number of active sites involved in the redox cycle.
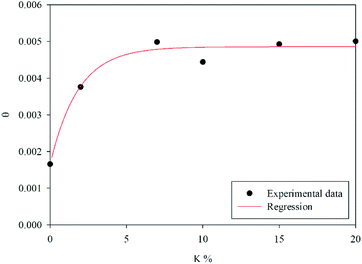 |
| | Fig. 3 Fraction of active material as a function of the K percentage. | |
In Fig. 4, CO and O2 formed during the first cycle are plotted versus the initial site fraction, (θ1 + θ2)°. It is worth noting that increasing the initial site fraction, the amount of CO and O2 produced increases up to a maximum value. It is also worth remarking that the ratio between O2 and CO is almost stoichiometric (0.5) in all cases.
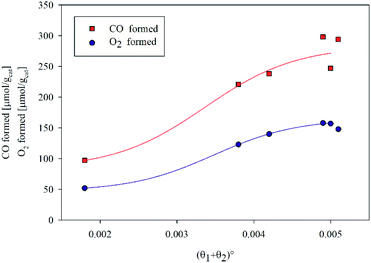 |
| | Fig. 4 CO and O2 formed during the first cycle as a function of the initial site fraction. | |
Model-guided evaluation of K effect
The kinetic parameters of the model were obtained by minimizing the squared error between the experimental and calculated data using a Nelder–Mead simplex direct search. The optimized parameters are reported in the ESI† together with their 97% intervals of confidence (Tables S1 and S2†). Fig. S1 in the ESI† shows the model fitting, evidencing a good agreement.
The model was used to compare the performances of the different samples in terms of the overall reduction rate (r1 + r2) and oxidation rate  In Fig. 5, the overall reactions rates are reported together with the constant of oxygen transfer reaction (3) defined as:
| |
 | (25) |
at different potassium percentages and two different temperatures.
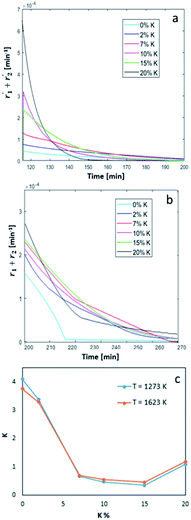 |
| | Fig. 5 Overall oxidation (a) and reduction (b) reaction rates as a function of time and (c) calculated constant of oxygen transfer (eqn (3)) as a function of wt% of K. | |
In Fig. 5a, the simulated oxidation rate is reported as a function of time, under the same experimental conditions adopted in Fig. 2; the only exception is the carbon dioxide molar fraction fixed at  for all the investigated samples for a better comparison. As a general consideration, the overall oxidation rate of the material increases for catalysts with a higher K content (Fig. 5a).
Also the reduction rate (Fig. 5b) increases at higher K percentages, the only exception being the sample at 7 wt% K, performing better than the one at 10 wt% K, and maintaining a higher reduction rate also for longer reaction times. Interestingly, all the doped samples showed a substantially different behaviour compared to bare ceria–zirconia, with a reduction reaction rate sharply changing slope at higher reaction times. This behaviour can be ascribed to the different distribution of oxidized active sites on the surface and in the bulk of the material, as a consequence of the amount of K doping. This effect is more evident for the sample at 20 wt% K and it might suggest a faster surface reduction, followed by a slower diffusion/reduction in the bulk. This is also confirmed by the smoother transition observed for the reduction rate of sample at 2 wt% K, more similar to bare ceria–zirconia. This behaviour is in line with the fact that potassium tends to form K-enriched superficial layers in these materials, generating additional diffusive limitations in the external layers, slowing down oxygen diffusion to the surface, thus reducing oxygen release under reductive conditions.30
In Fig. 5c, we show the estimated value of the oxygen transfer constant as defined by eqn (25), as the ratio between the forward and back reaction constant of eqn (3). This constant describes the oxygen transfer from the bulk to the surface and vice versa, also taking into account possible diffusive limitations, as suggested by the weak temperature dependence. As a general trend, a K content higher than 2 wt% results in a lower value of the equilibrium constant, suggesting that a higher amount of oxygen might be present in the bulk of the material, in line with the observed reduced diffusion of oxygen to the surface. This suggests that higher K content can increase the oxidation kinetics of the material, and so promote a faster CO2 conversion, but also cause a slower material reduction, requiring higher temperature and longer reduction times.
To further confirm this point, samples with K content of 2 wt% K and 15 wt% K were analyzed by TPR. Fig. 6 shows stable TPR cycles in the presence of H2 of the two samples. As one can see, the sample with a lower K content is characterized by a single reductive event, ascribable to the reduction of a single type of surface-like catalytic sites, possibly overlapping the reduction of a smaller fraction of bulk-like sites. On the contrary, when a higher content of K is present, we observed different broader reduction peaks, indicating the presence of more than one type of catalytic site, namely surface-like and bulk-like, showing very different reduction rates. This is in line with the results of the model, indicating a sharp change in the reduction rate for samples with higher K content, ascribable to the reduced mobility of oxygen from the bulk to the surface of the material, whereas this is less marked at lower K content.
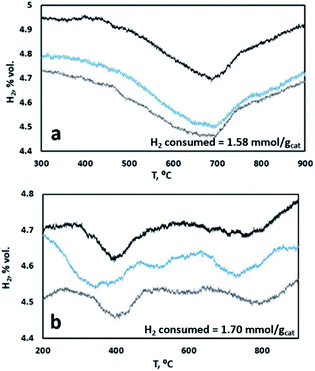 |
| | Fig. 6 TPR cycles of catalyst samples with (a) 2 wt% K and (b) 15 wt% K. | |
Effect of operating conditions
To assess the effect of the operating conditions, i.e. CO2 inlet fraction and temperature, on redox performances further simulations were carried out.
The trend of catalyst site concentration vs. time evaluated by the model for two different values of the CO2 inlet fraction ( and
and  ) is showed in Fig. 7. Adopted temperature conditions were the same described for the experimental runs. The reaction rate of the splitting oxidation step increases by increasing the CO2 inlet fraction, whereas the time needed to reach the same final value of sites concentration decreases. It is worth highlighting that samples with the lower potassium content, i.e. 2 wt% and 7 wt%, benefit the most from an increase in CO2 concentration, showing a significantly higher oxidation degree of the sample within the same reaction time. Remarkably, the sample with 7 wt% K, shows an oxidation degree comparable with the one of the samples with 10, 15, and 20 wt% K when pure CO2 is adopted. As expected, reduction kinetics are not significantly affected by the change in the oxidation degree; however, samples with lower K content, i.e. 2 and 7 wt% K, tend to reduce completely and significantly faster than the samples with higher potassium content, in agreement with the general observation highlighted in Fig. 5. This would suggest that 7 wt% K is a good compromise between a high number of active sites, and fast kinetics of oxidation and reduction.
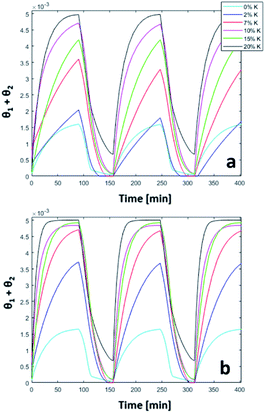 |
| | Fig. 7 Comparison between 50% (a) and pure (b) CO2 in three consecutive simulated redox cycles. | |
Two-step thermochemical cycles can be carried out under either isothermal31–36 or temperature-swing conditions.1,12,37–40 The best operating conditions depend on several parameters and their individuation is not an easy feat.41–45
In this work, we simulated the possibility of the catalyst to undergo isothermal reduction/oxidation cycles by switching the CO2 concentration without changing the operating temperature in order to compare isothermal and temperature-swing conditions.
Fig. 8 shows the simulated results of the splitting process at T = 1200 °C, intermediate between the oxidation and reduction temperature used in the previous experimental investigations. A higher oxidation temperature increases oxidation kinetics, whereas the plateau value of oxidized active sites and the overall dependence on K content remains unchanged.
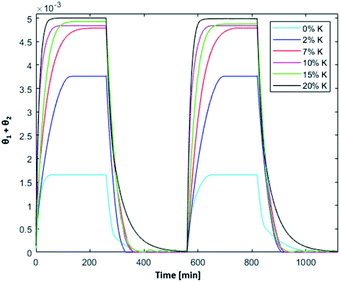 |
| | Fig. 8 Isothermal cycles at 1200 °C;  . . | |
The reaction rate of the reduction step decreases at lower temperature. As a result, complete reduction step at 1200 °C requires longer time, especially for bare ceria–zirconia and the sample with the highest K content, i.e. 20 wt. Overall, the best performances under isothermal conditions were observed for the samples at 7 and 15 wt%, showing comparable plateau values of active material fraction, and fast reduction kinetics; despite the slower oxidation kinetics of the sample with 7 wt%, it might still represent a competitive alternative, because of the lower potassium content.
Conclusions
K-doping improves redox performances of Ce0.75Zr0.25O2 catalyst in thermochemical cycles for CO2 splitting. To explain this experimental result, a mathematical model was developed. The aim of the model is to unveil the mechanism of redox activity as well as the effect of the different doping levels and the operating conditions on the splitting performances.
Two sites were identified: surface-like and bulk-like sites. The mathematical model was used to investigate the effect of the catalyst composition, operating temperature, CO2 inlet fraction, the feasibility and the optimization of isothermal cycles. The experimental results and the simulations of the model suggest that K-doping plays an active role in increasing the total amount of active sites up to 7 wt% K; further increase in the potassium concentration resulted in faster oxidation kinetics but no significant change in the number of active sites. On the other hand, the reduction of doped samples is characterized by two different phases with different characteristic times ascribable to the reduction of bulk-like and surface-like catalytic sites. Higher potassium content can affect the potassium distribution and result in slower reduction of the sample, thus also affecting the relative ratio between surface-like and bulk-like sites. Among the investigated catalysts, the sample with 7 wt% K showed the best performances, combining a large number of active sites, competitive oxidation kinetics, and fast and complete reduction. Simulations carried out at constant temperature suggested the possibility of running isothermal processes, with obvious advantages in process management and costs. Future investigations will address the implementation of the investigated catalytic system on a continuous-flow plant in the presence of H2O/CO2 co-feeding.
Funding
This research did not receive any specific grant from funding agencies in the public, commercial, or not-for-profit sectors.
Author contributions
Maria Portarapillo: investigation, writing, conceptualization. Danilo Russo: modeling, writing, conceptualization. Gianluca Landi: conceptualization, investigation, supervision. Giuseppina Luciani: conceptualization, supervision. Almerinda Di Benedetto: conceptualization, supervision, resource.
Conflicts of interest
There are no conflicts to declare.
References
- S. Abanades and A. Le Gal, Fuel, 2012, 102, 180–186 CrossRef CAS.
- J. L. Lyman and R. J. Jensen, Sci. Total Environ., 2001, 277, 7–14 CrossRef CAS.
- M. Roeb, M. Neises, N. Monnerie, F. Call, H. Simon, C. Sattler, M. Schmücker and R. Pitz-Paal, Materials, 2012, 5, 2015–2054 CrossRef CAS.
- C. N. R. Rao and S. Dey, J. Solid State Chem., 2016, 242, 107–115 CrossRef CAS.
- T. Kodama and N. Gokon, Chem. Rev., 2007, 107, 4048–4077 CrossRef CAS PubMed.
- R. R. Bhosale, A. Kumar and P. Sutar, Energy Convers. Manag., 2017, 135, 226–235 CrossRef CAS.
- C. N. R. Rao and S. Dey, Proc. Natl. Acad. Sci. U. S. A., 2017, 114, 13385–13393 CrossRef CAS PubMed.
- R. R. Bhosale, G. Takalkar, P. Sutar, A. Kumar, F. AlMomani and M. Khraisheh, Int. J. Hydrogen Energy, 2019, 44, 34–60 CrossRef CAS.
- W. C. Chueh, C. Falter, M. Abbott, D. Scipio, P. Furler, S. M. Haile and S. Aldo, Science, 2010, 330, 1797–1802 CrossRef CAS PubMed.
- A. Le Gal and S. Abanades, J. Phys. Chem. C, 2012, 116, 13516–13523 CrossRef CAS.
- C. Muhich and A. Steinfeld, J. Mater. Chem. A, 2017, 5, 15578–15590 RSC.
- R. Jacot, R. Moré, R. Michalsky, A. Steinfeld and G. R. Patzke, J. Mater. Chem. A, 2017, 5, 19901–19913 RSC.
- J. R. Scheffe, R. Jacot, G. R. Patzke and A. Steinfeld, J. Phys. Chem. C, 2013, 117, 24104–24110 CrossRef CAS.
- A. Le Gal and S. Abanades, Int. J. Hydrogen Energy, 2011, 36, 4739–4748 CrossRef CAS.
- G. Luciani, G. Landi, C. Imparato, G. Vitiello, F. A. Deorsola, A. Di Benedetto and A. Aronne, Int. J. Hydrogen Energy, 2019, 44(33), 17565–17577 CrossRef CAS.
- Q. Dong, S. Yin, C. Guo and T. Sato, Nanoscale Res. Lett., 2012, 7, 1–6 CrossRef PubMed.
- D. Terribile, A. Trovarelli, C. De Leitenburg, A. Primavera and G. Dolcetti, Catal. Today, 1999, 47, 133–140 CrossRef CAS.
- H. Miyaoka, T. Ichikawa and Y. Kojima, Energy Procedia, 2014, 49, 927–934 CrossRef CAS.
- T. Maneerung, K. Hidajat and S. Kawi, Int. J. Hydrogen Energy, 2017, 42, 9840–9857 CrossRef CAS.
- B. Zugic, D. C. Bell and M. Flytzani-stephanopoulos, Appl. Catal., B, 2014, 144, 243–251 CrossRef CAS.
- M. Portarapillo, G. Landi, G. Luciani, C. Imparato, G. Vitiello, F. A. Deorsola, A. Aronne and A. Di Benedetto, Appl. Catal., A Search PubMed , submitt. to..
- M. Portarapillo, A. Aronne, A. Di Benedetto, C. Imparato, G. Landi and G. Luciani, Chem. Eng. Trans., 2019, 74, 43–48 Search PubMed.
- K. Asano, C. Ohnishi and S. Iwamoto, Appl. Catal., B, 2008, 78, 242–249 CrossRef CAS.
- H. Ju, C. Kim, K. S. Choi, E. Lee, S. Kim, J. H. Jung, Y. Habata, L. F. Lindoy and S. S. Lee, Eur. J. Inorg. Chem., 2018, 2018, 3587–3594 CrossRef CAS.
- M. Kim, S. Lee, I. Ryu, M. Jeon, S. Moon, H. Roh and S. Goo, Mol. Catal., 2017, 442, 202–207 CrossRef CAS.
- F. Zasada, P. Stelmachowski, G. Maniak, J. F. Paul, A. Kotarba and Z. Sojka, Catal. Lett., 2009, 127, 126–131 CrossRef CAS.
- C. Chen, W. Cheng and S. Lin, Appl. Catal., A, 2003, 238, 55–67 CrossRef CAS.
- N. Guillén-Hurtado, I. Atribak, A. Bueno-López and A. García-García, J. Mol. Catal. A: Chem., 2010, 323, 52–58 CrossRef.
- I. Atribak, A. Bueno-López, A. García-García and B. Azambre, Phys. Chem. Chem. Phys., 2010, 12, 13770–13779 RSC.
- I. P. Parkin and A. R. West, Basic Solid State Chemistry, John Wiley & Sons, Chichester, 2nd edn, 2000 Search PubMed.
- C. L. Muhich, B. W. Evanko, K. C. Weston, P. Lichty, X. Liang, J. Martinek, C. B. Musgrave and A. W. Weimer, Science, 2013, 341, 540–542 CrossRef CAS PubMed.
- B. J. Hathaway, R. Bala Chandran, A. C. Gladen, T. R. Chase and J. H. Davidson, Energy Fuels, 2016, 30, 6654–6661 CrossRef.
- Y. Hao, C.-K. Yang and S. M. Haile, Phys. Chem. Chem. Phys., 2013, 15, 17084 RSC.
- I. Ermanoski, J. E. Miller and M. D. Allendorf, Phys. Chem. Chem. Phys., 2014, 16, 8418 RSC.
- S. Dey and C. N. R. Rao, ACS Energy Lett., 2016, 1, 237–243 CrossRef CAS.
- B. J. Hathaway, R. B. Chandran, S. Sedler, D. Thomas, A. Gladen, T. Chase and J. H. Davidson, J. Sol. Energy Eng., 2015, 138, 011007 CrossRef.
- B. Zhao, C. Huang, R. Ran, X. Wu and D. Weng, J. Mater. Sci., 2016, 51, 2299–2306 CrossRef CAS.
- R. R. Bhosale, A. Kumar, F. Almomani, U. Ghosh, S. Al-Muhtaseb, R. Gupta and I. Alxneit, Ceram. Int., 2016, 42, 9354–9362 CrossRef CAS.
- L. Zhu, Y. Lu and F. Li, Int. J. Hydrogen Energy, 2018, 43, 13754–13763 CrossRef CAS.
- S. J. Roberts, N. G. Carr, J. McLaughlin and H. E. Hagelin-Weaver, Int. J. Hydrogen Energy, 2018, 43, 12970–12984 CrossRef CAS.
- I. Al-Shankiti, B. D. Ehrhart and A. W. Weimer, Sol. Energy, 2017, 156, 21–29 CrossRef.
- H. Kong, Y. Hao and H. Jin, Appl. Energy, 2018, 228, 301–308 CrossRef CAS.
- A. H. McDaniel, Curr. Opin. Green Sustain. Chem., 2017, 4, 37–43 CrossRef.
- C. L. Muhich, B. D. Ehrhart, I. Al-Shankiti, B. J. Ward, C. B. Musgrave and A. W. Weimer, Wiley Interdiscip. Rev.: Energy Environ., 2016, 5, 261–287 CAS.
- B. D. Ehrhart, C. L. Muhich, I. Al-Shankiti and A. W. Weimer, Int. J. Hydrogen Energy, 2016, 41, 19881–19893 CrossRef CAS.
Footnote |
| † Electronic supplementary information (ESI) available. See DOI: 10.1039/d1ra08315e |
|
| This journal is © The Royal Society of Chemistry 2021 |
Click here to see how this site uses Cookies. View our privacy policy here.  Open Access Article
 a and
Almerinda Di Benedettoa


 are the kinetic constants which are evaluated as follows:


 , and
, and  are the frequency factors, and YCO2 is the carbon dioxide molar fraction.


 As a consequence, the cell was modelled as a differential reactor, without any spatial changes of the gas phase concentration. Accordingly, the balance equations on θ1, θ2, θ1red, θ2red, and YCO2 are:


 In Fig. 5, the overall reactions rates are reported together with the constant of oxygen transfer reaction (3) defined as:

 for all the investigated samples for a better comparison. As a general consideration, the overall oxidation rate of the material increases for catalysts with a higher K content (Fig. 5a).
 and
and  ) is showed in Fig. 7. Adopted temperature conditions were the same described for the experimental runs. The reaction rate of the splitting oxidation step increases by increasing the CO2 inlet fraction, whereas the time needed to reach the same final value of sites concentration decreases. It is worth highlighting that samples with the lower potassium content, i.e. 2 wt% and 7 wt%, benefit the most from an increase in CO2 concentration, showing a significantly higher oxidation degree of the sample within the same reaction time. Remarkably, the sample with 7 wt% K, shows an oxidation degree comparable with the one of the samples with 10, 15, and 20 wt% K when pure CO2 is adopted. As expected, reduction kinetics are not significantly affected by the change in the oxidation degree; however, samples with lower K content, i.e. 2 and 7 wt% K, tend to reduce completely and significantly faster than the samples with higher potassium content, in agreement with the general observation highlighted in Fig. 5. This would suggest that 7 wt% K is a good compromise between a high number of active sites, and fast kinetics of oxidation and reduction.


