
 Open Access Article
 This Open Access Article is licensed under a
 Creative Commons Attribution 3.0 Unported Licence
Carbon dots conjugated nanocomposite for the enhanced electrochemical performance of supercapacitor electrodes†
Sally M. Youssry‡
 a,
M. Abd Elkodous‡b,
Go Kawamurab and
Atsunori Matsuda*b
a,
M. Abd Elkodous‡b,
Go Kawamurab and
Atsunori Matsuda*b
aDepartment of Chemistry, Faculty of Science, Tanta University, Tanta, 31527, Egypt
bDepartment of Electrical and Electronic Information Engineering, Toyohashi University of Technology, 1-1 Hibarigaoka, Tempaku-cho, Toyohashi, Aichi 441-8580, Japan. E-mail: matsuda.atsunori.hh@tut.jp
First published on 13th December 2021
Abstract
Naturally, a combination of metal oxides and carbon materials enhances the electrochemical performance of supercapacitor (SC) electrodes. We report on two different materials with highly conductive carbon dots (CDs) and a Co0.5Ni0.5Fe2O4/SiO2/TiO2 nanocomposite with a high power density, a high specific surface area, and a nanoporous structure to improve power and energy density in energy storage devices. A simple and low-cost process for synthesizing the hybrid SC electrode material Co0.5Ni0.5Fe2O4/SiO2/TiO2/CDs, known as CDs-nanocomposite, was performed via a layer-by-layer method; then, the CDs-nanocomposite was loaded on a nickel foam substrate for SC electrochemical measurements. A comparative study of the surface and morphology of CDs, the Co0.5Ni0.5Fe2O4/SiO2/TiO2 nanocomposite and CDs-nanocomposite was carried out using X-ray diffraction (XRD), scanning electron microscopy (SEM), transmission electron microscopy (TEM), energy-dispersive X-ray spectroscopy (EDX), BET surface area, and Raman spectroscopy. The synthesized CDs-nanocomposite electrode material displayed enhanced electrochemical performance, having a high specific capacitance of 913.7 F g−1 at a scan rate of 5 mV s−1 and capacitance retention of 72.2%, as well as remarkable long-life cyclic stability over 3000 cycles in the three-electrode setup and 1 M KOH electrolyte. It also demonstrated a superior energy density of 130.7 W h kg−1. The improved electrochemical behavior of the CDs-nanocomposite for SC electrodes, together with its fast and simple synthesis method, provides a suitable point of reference. Other kinds of metal oxide nanocomposites can be synthesized for use in energy storage devices.
1. Introduction
Over the last century, the energy used by humans has come primarily from fossil fuels. Conventional fossil fuel resources continue to be consumed at an alarming rate to meet soaring energy demands. Global climate change caused by the excessive burning of fossil fuels has worsened and become an urgent problem.1–3 Consequently, researchers seek new forms of renewable energy to reduce carbon dioxide emissions and enable the transition to clean and eco-friendly energy sources.4,5 Such technologies also help to control and reduce the cost of electricity, improve the consistency and flexibility of electrical systems, replace aging power infrastructure, and provide consistent power to remote areas.6 However, renewable energy sources are prone to fluctuations. Therefore, energy storage systems will be required to buffer these fluctuations to ensure a stable energy supply.7–9Supercapacitors (SCs), unlike batteries or fuel cells, are the key to efficient electrochemical energy storage as they demonstrate high power density, a fast charge–discharge rate, a long life cycle, and a simple operational mechanism.10,11 These properties come from two common mechanisms: the electric double-layer capacitance (EDLC) and the pseudocapacitance (PC). In EDLC, the capacitance comes from the high charge accumulation rate at the electrolyte–electrode interface. Therefore, a large surface area and porous structure are required in this case. In contrast, the PC mechanism employs a fast oxidation–reduction reaction.12–14
Activated carbon-based materials, such as carbon nanotube (CNT), carbon dots (CDs), and graphene, are commonly used in the construction of EDLC electrodes due to their high porosity, low cost, chemical and physical stability, and ease of production from renewable sources.15–17
However, the specific capacitance of activated carbon electrodes is still lower than that of many other materials, such as conductive polymers and inorganic oxides, which are generally used in PC electrodes.18 Therefore, the electrical performance of carbon-based SCs must improve before they are useful for practical applications. This can be accomplished by incorporating pseudocapacitive properties and combining carbon-based materials with materials that have a large surface area and appropriate pore size, such as metal oxides, metal hydroxides, and polymers, or with materials containing oxygen or nitrogen functional groups. Such energy storage systems are known as hybrid SCs.19,20
Titanium dioxide (TiO2) is widely used as a photocatalyst and semiconductor in dye-sensitized solar cells. However, researchers recently turned their attention to using TiO2 as an electroactive material for SCs. TiO2 possesses semiconducting properties, low-cost production, high stability, and is environmentally friendly. However, TiO2 has some drawbacks, such as slow ion diffusion and low electrical conductivity, which worsen its performance. Its low specific capacitance range of 90–120 µF cm−2 is much lower than those of other transition metal oxides (e.g. Co(OH)2, Co3O4, NiOH2, spinel cobaltites etc.).21–26
TiO2 performance must improve to enable the production of low-cost, practical TiO2-based SCs. This can be achieved by combining TiO2 with a range of carbon-based materials or conjugated polymers to form composites with mutual EDLC and PC properties, enhancing the SC electrode materials.27 TiO2-based CDs demonstrate excellent suitability for supercapacitor applications due to their nanometer size, unique electronic and surface functionalities, large surface area, simple synthesis, low environmental risk, and high charge–discharge rate.28,29 The hybridization of carbon allotropes with metal oxides will improve the hybrid system's conductivity and structural stability. TiO2-based CDs has excellent electron mobility, conductivity, high transmittance, Young's modulus, and large SSA. As a result, it has been used in energy storage applications as an additive with TiO2 electrodes.30–32
In this study, TiO2-based CDs nanocomposite (CoxNi1−xFe2O4; x = 0.5/SiO2/TiO2/CDs), termed CDs-nanocomposite, is synthesized via a layer-by-layer method. Loading CDs-nanocomposite electrode materials on nickel foam (NF) substrate improves supercapacitive performance. The experimental results display superior specific capacitance magnitudes of 913.7 F g−1 at a scan rate of 5 mV s−1 and capacitance retention of 72.2%. In addition, the results demonstrate a higher energy density of 130.7 W h kg−1 and exceptional long-life cyclic stability over 3000 cycles. CDs-nanocomposite electrode materials also demonstrate significant values of power and energy density. Consequently, this makes CDs-nanocomposite on NF a promising candidate for use as a hybrid supercapacitor electrode material.
2. Materials and methods
2.1. Materials
Ascorbic acid (C6H8O6), titanium(IV) isopropoxide (97%, C12H28O4Ti), copper acetate monohydrate (C4H8CuO5), tetraethyl orthosilicate (TEOS, 98%, Si(OC2H5)4), ammonium hydroxide (28%, NH4OH), hydroxypropyl cellulose (MW = 80![[thin space (1/6-em)]](https://www.rsc.org/images/entities/char_2009.gif) 000), absolute ethanol (99.9%, C2H5OH), cobalt chloride (CoCl2), nickel chloride (NiCl2), sodium hydroxide pellets (NaOH), and ferric chloride hexahydrate (FeCl3·6H2O), were purchased from Sigma Aldrich (Germany). All reagents were of extra-pure grade and were used as received from the supplier without further purification.
000), absolute ethanol (99.9%, C2H5OH), cobalt chloride (CoCl2), nickel chloride (NiCl2), sodium hydroxide pellets (NaOH), and ferric chloride hexahydrate (FeCl3·6H2O), were purchased from Sigma Aldrich (Germany). All reagents were of extra-pure grade and were used as received from the supplier without further purification.
2.2. Preparation of the composite matrix
Co0.5Ni0.5Fe2O4/SiO2/TiO2 nanocomposite matrix was prepared using a layer-by-layer method. CoxNi1−xFe2O4; x = 0.5 core was firstly-prepared using a coprecipitation route. Cobalt chloride (12.5 mg), ferric chloride 45% (0.05 ml), and nickel chloride (12.5 mg) were mixed with deionized water (D.I.W.) (50 ml) at 80 °C. Then, pH was adjusted to 8 using few drops of NaOH aqueous solution (2 M) leading to the precipitation of ferrite black particles. Then, formed particles were washed using D.I.W and dried at 70 °C for 3 h. Finally, dried particles were calcined for 4 h at 300 °C. Secondly, core–shell structure (ferrite/SiO2) was prepared. Ferrite powder (180 mg) (obtained in the previous step) was dispersed in (64 ml) D.I.W. via water-bath sonication for 45 min. Then, absolute ethanol (320 ml) and ammonia solutions (25%) (8 ml) were added directly into the dispersion at room temperature. After mixing, TEOS (3.2 ml) was added dropwise to the mixture, which was left under stirring for 16 h. The precipitate was collected by centrifugation and was washed with D.I.W. and ethanol. Finally, the precipitate was dried at 50 °C in air. To load TiO2 layer onto the formed core–shell structure, (obtained powder from the previous step) was dispersed in a mixture of absolute ethanol (100 ml), hydroxypropyl cellulose (0.2 g), and (0.48 ml) D.I.W. via sonication for 30 min. Then, dissolved titanium(IV) isopropoxide (4 ml) in absolute ethanol (18 ml) was dipped directly into the mixture under vigorous stirring at 85 °C. The reaction was left under reflux conditions for 100 min. The obtained powder was collected and washed with ethanol, then it was re-dispersed in D.I.W. (20 ml) to partially etch the silica layer to form a hollow structure. The dispersion was mixed with (3.5 ml) NaOH solution (2 M) under fixed stirring for 1 h. The powder was then collected, washed several times with D.I.W. and dried for 4 h at 90 °C. Finally, dried powder was calcined for 4 h at 550 °C.2.3. Preparation of CDs
CDs were prepared using a hydrothermal method. In brief, ascorbic acid (6.8 g) was dissolved in (400 ml) D.I.W. Then, copper acetate monohydrate (0.8 g) was added to the formed solution at room temperature under fixed stirring for 10 min. Reaction temperature was then increased gradually to 90 °C and the mixture was left for 5 h. The formed supernatant was purified through Millipore filter paper (0.22 µm). Finally, supernatant containing CDs was freeze-dried for 12 h.2.4. Preparation of CDs-nanocomposite
Prepared CDs and composite matrix (1:10 wt/wt) were dispersed in super dehydrated ethanol solution (50 ml) using water bath sonication for 30 min. Next, (1 ml) of NH4OH 25% solution was added into the mixture which was kept at vigorous stirring overnight. Finally, collected powder was washed many times using D.I.W. and dried for 6 h at 80 °C.
2.5. Loading of CDs-nanocomposite electrode materials on NF substrate for hybrid supercapacitor application
Initially, 1 mg of CDs-nanocomposite powder was dispersed in a solution of 1 ml isopropanol, 1 ml deionized water, and 50 µl Nafion (0.5 wt%) and sonicated for 30 min until homogeneous. Then, using a micropipette, 0.5 mg of this solution was loaded on a clean NF substrate of a defined area of 1.5 ×× 1.5 cm2. Finally, the NF loaded with CDs-nanocomposite was heated in an oven at 60 °C for 2 h or until completely dry. The CDs-nanocomposite on NF electrode was then ready to be used for electrochemical measurements as shown in the schematic diagram in Fig. 1.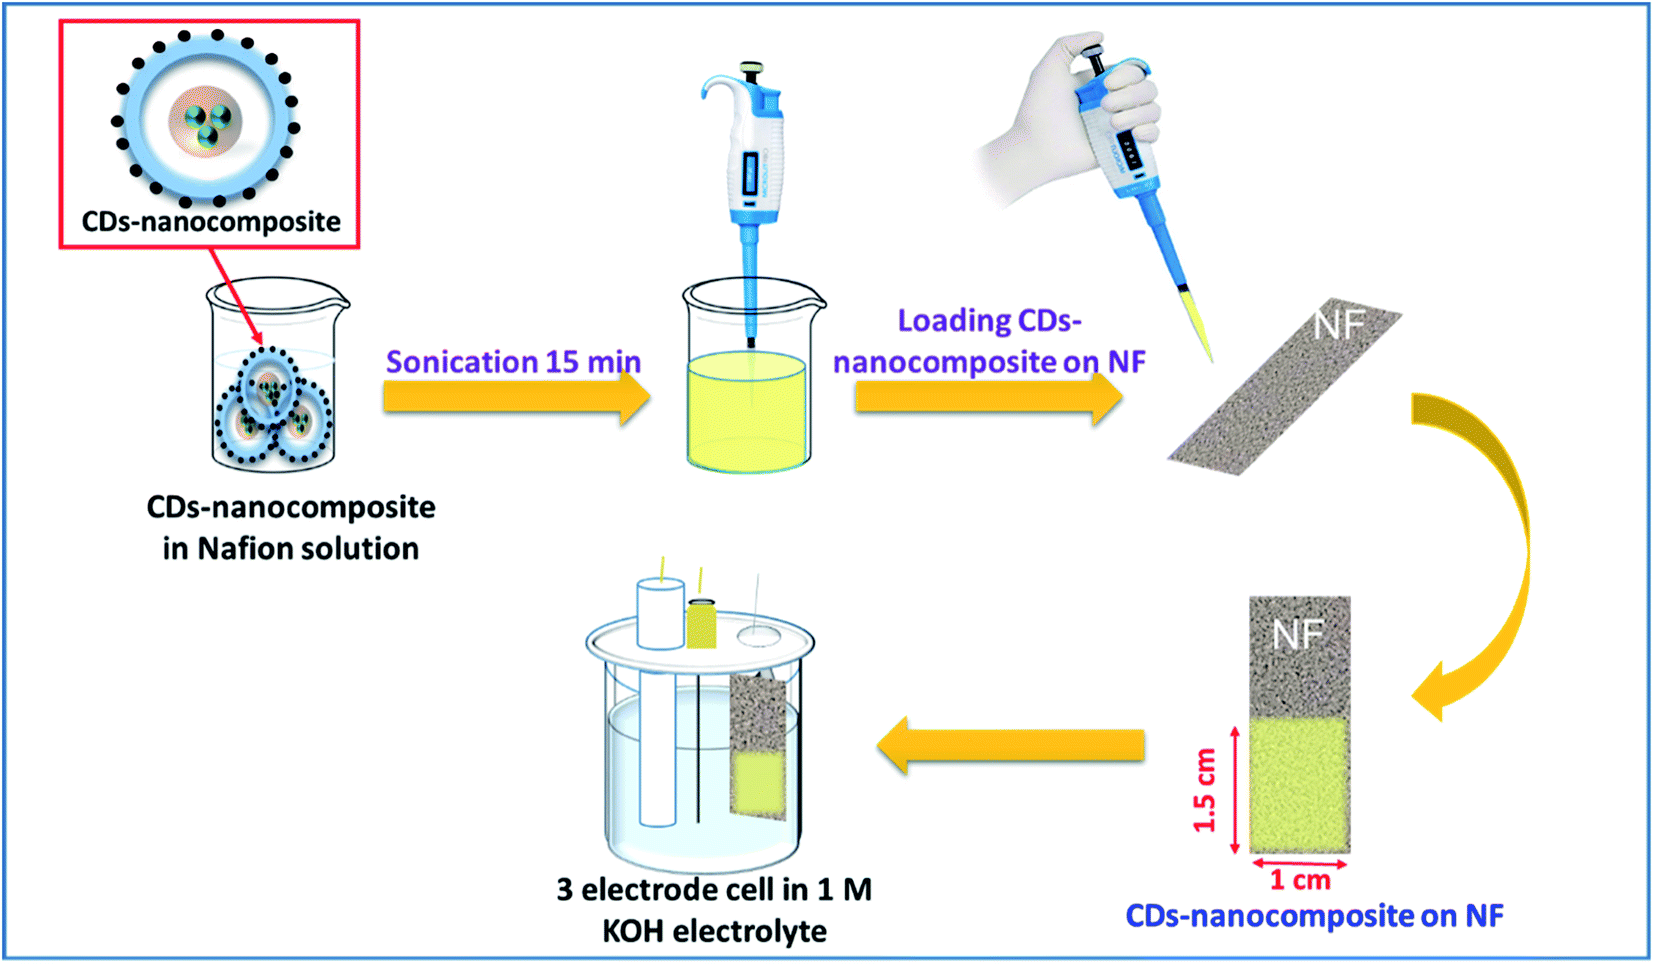 | ||
| Fig. 1 Schematic diagram for the detailed steps of loading CDs-nanocomposite on nickel foam (NF) substrate and preparing it for electrochemical measurements. | ||
2.6. Characterization of the prepared samples
X-ray diffraction (XRD) patterns were recorded using a Rigaku Ultima IV X-ray diffractometer (Japan) with Cu Kα radiation (λ = 1.5418 Å) operating at 40 kV and 60 mA. While, SEM analysis was performed via SEM (Hitachi SU 8000 Type II) connected with energy-dispersive X-ray spectroscopy (EDX). In addition, BET surface area and BJH pore size distribution analyses were conducted by a Tristar II analyzer (Micromeritics, Japan). In addition, TEM analysis was carried out via JEM-2100F (JEOL, Japan). Moreover, Raman analysis was performed on a JASCO NRS-3100 micro-spectrometer with excitation radiation.2.7. Electrochemical analysis
The electrochemical performance of the electrode materials was tested in a three-electrode configuration system using a Solartron SI 1286 electrochemical workstation with 1 M KOH as an electrolyte.3. Results and discussion
3.1. Characterizations
 | ||
| Fig. 2 XRD analysis of CDs, nanocomposite, and CDs-nanocomposite. | ||
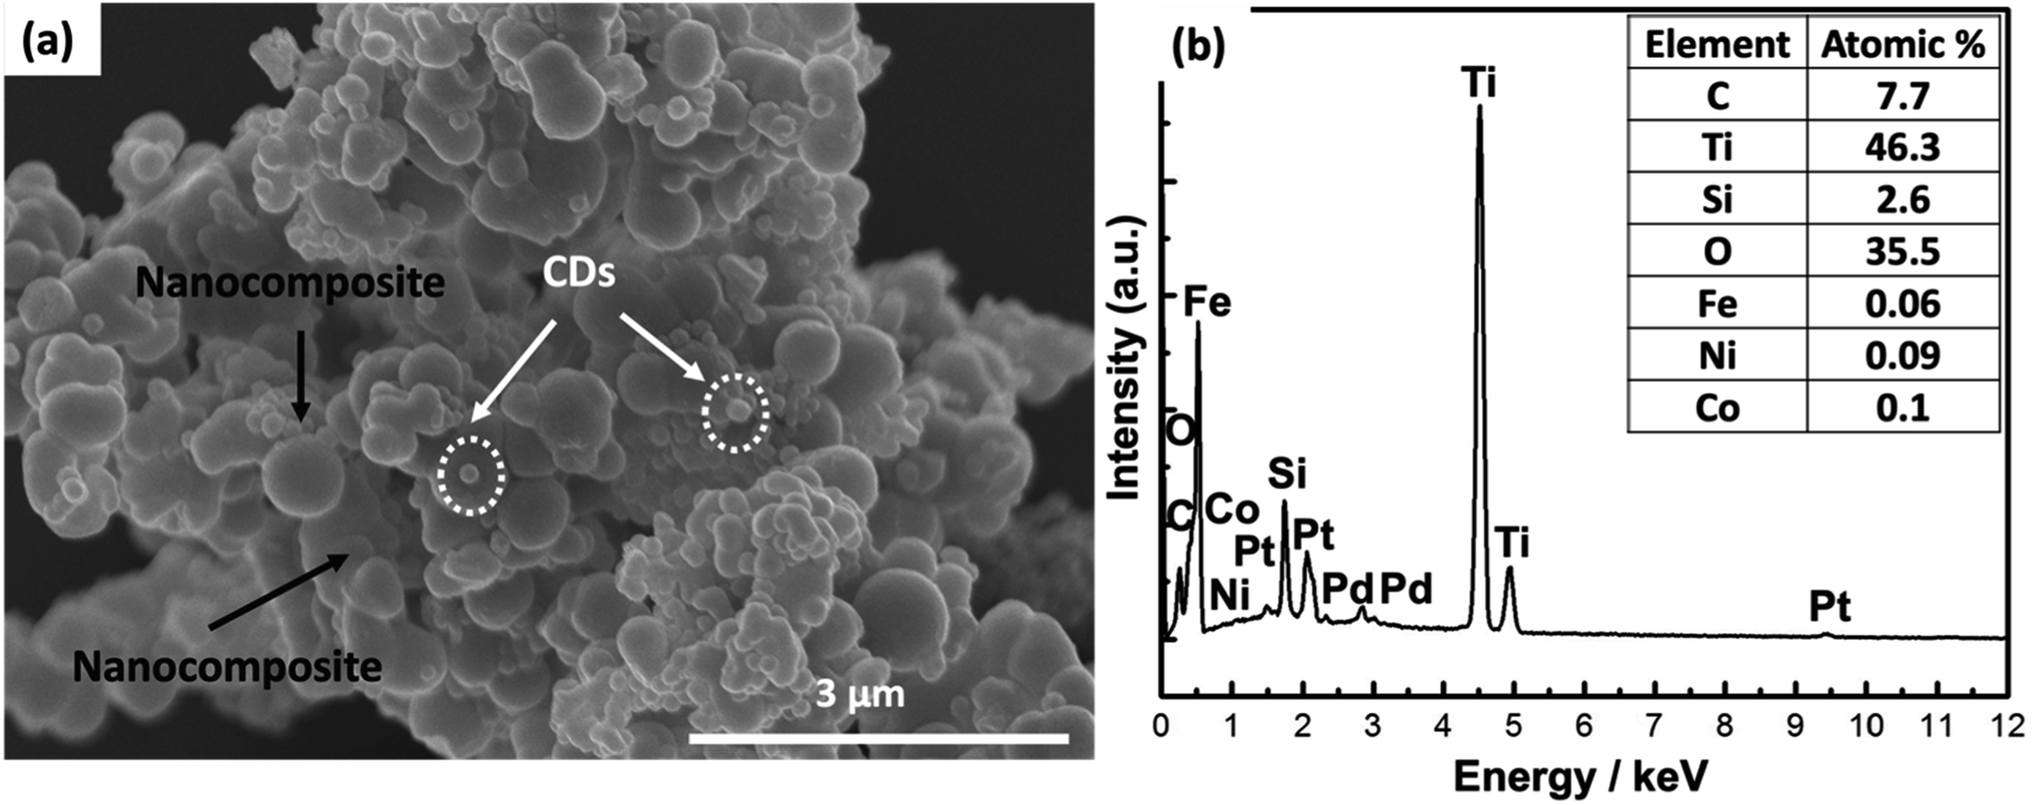 | ||
| Fig. 3 (a) SEM analysis of CDs-nanocomposite and (b) EDX atomic analysis. | ||
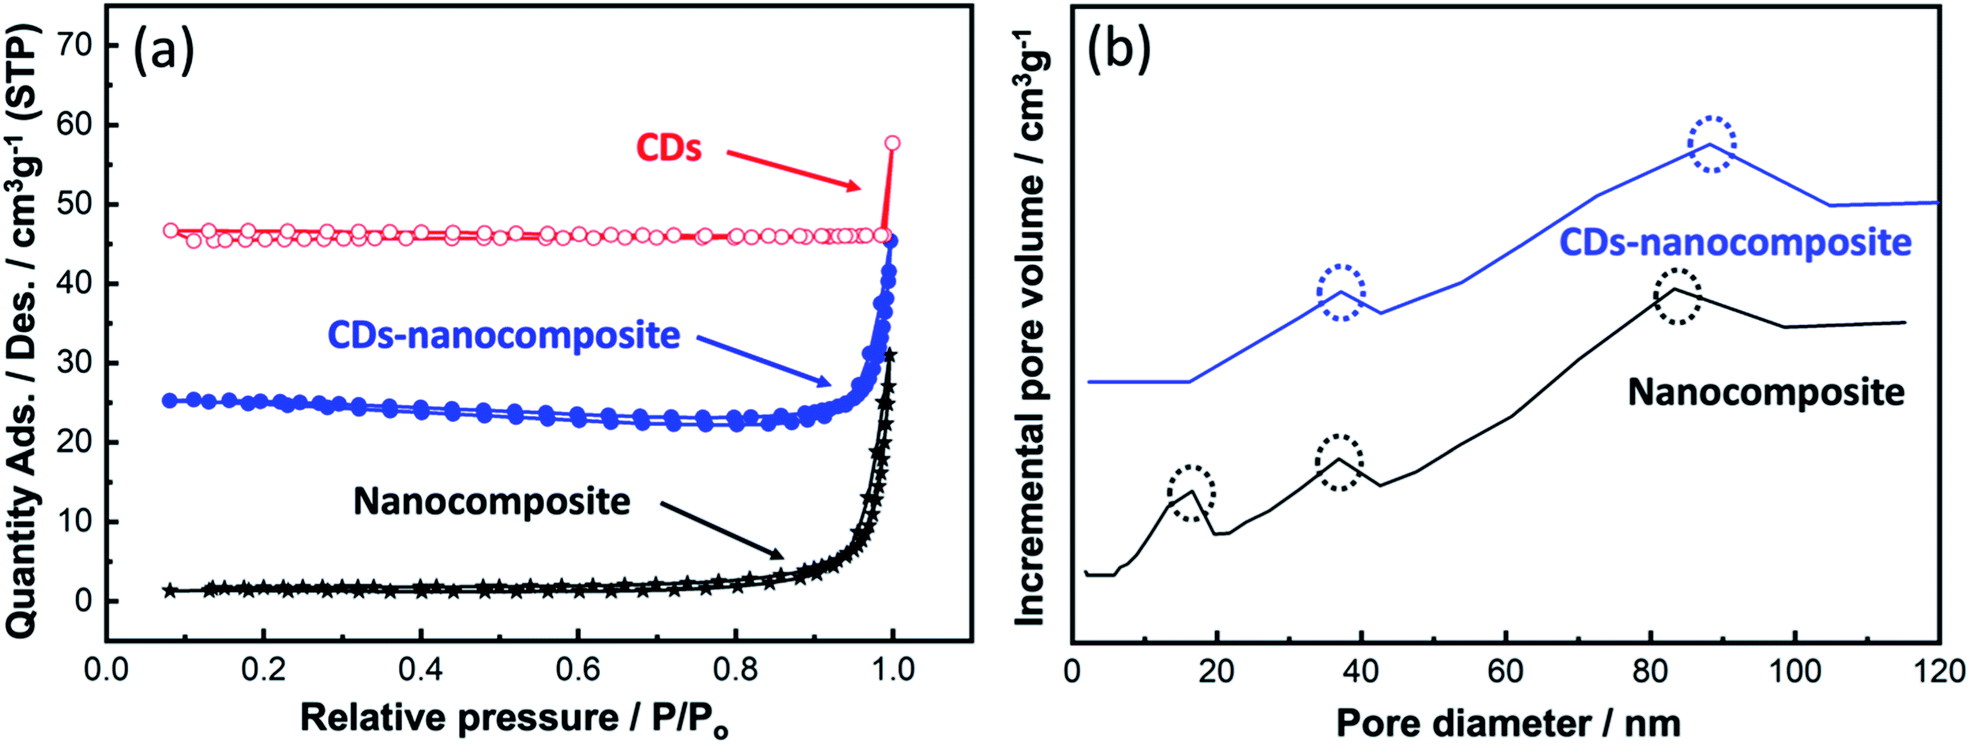 | ||
| Fig. 4 (a) BET surface area analysis of CDs, nanocomposite, and CDs-nanocomposite, and (b) BJH pore size distribution analysis. | ||
At higher relative pressures (0.87–1), sharp capillary condensation occurred, corresponding to the formation of macropores. The BET surface area, pore volume, and pore area values are summarized in Table 1. Upon CDs loading onto the composite matrix, the BET surface area declined which can be the result of increasing the particle size of the new CDs-nanocomposite. While Fig. 4(b) illustrates the BJH pore size distribution. All samples exhibited a broad, multimodal pore size distribution, confirming the existence of two types of pores: mesopores (2–50 nm) and macropores (>50 nm).
| No | Sample | BET surface area (m2 g−1) | Pore volume (cm3 g−1) | Pore area (m2 g−1) |
|---|---|---|---|---|
| 1 | CDs | 4.2 ± 2.5 | < 0.001 | < 0.001 |
| 2 | Nanocomposite | 3.3 ± 0.2 | 0.001 | 3.5 |
| 3 | CDs-nanocomposite | 1.2 ± 0.2 | 0.004 | 7.8 |
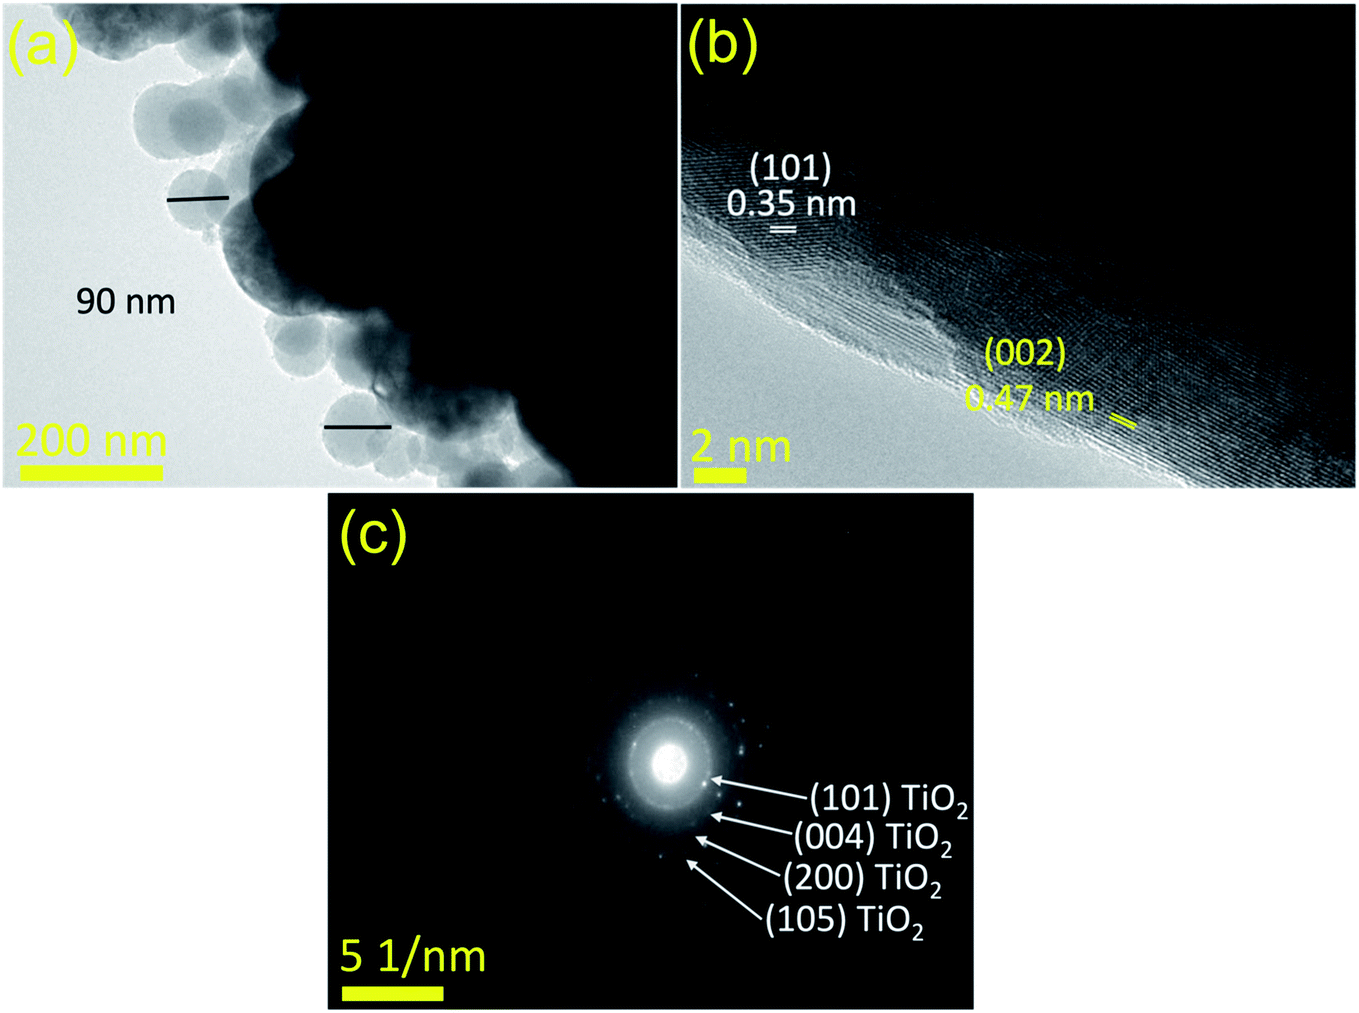 | ||
| Fig. 5 (a) TEM analysis of CDs-nanocomposite, (b) HR-TEM analysis, and (c) SAED pattern. | ||
Fig. 5(b) reveals the lattice fringes in HR-TEM images, which confirms the conjugation between the predominant anatase TiO2 nanoparticles of the matrix and the loaded CDs, characterized by the d-spacing of (002) planes at 0.47 nm. The SAED pattern in Fig. 5(c) shows only the fringes of anatase TiO2 and is consistent with the XRD analysis in Fig. 2.
 | ||
| Fig. 6 Raman spectra of the nanocomposite and CDs-nanocomposite. | ||
3.2. Electrochemical measurements
Fig. 7(a) shows a comparison between the CV curves of the CDs, nanocomposite, and CDs-nanocomposite at a scan rate of 50 mV s−1 within a potential window of 0–0.75 V. It is accepted that the area of the CV curve is directly proportional to the specific capacitance value. Fig. 7(a) shows the area and current of the CV curve of the CDs-nanocomposite are much greater than that of the CDs and nanocomposite CV curves, which emphasizes the enhanced specific capacitance of the CDs-nanocomposite. Moreover, the CDs curve displays a rectangular shape that reflects EDLC behavior. The shape of the CDs-nanocomposite curve illustrates two redox peaks due to faradaic processes as shown in the following equation (eqn (1)),38 which confirms the presence of the composite and its PC mechanisms.39,40| TiO2−M+ ↔TiO2 + M+ + e− | (1) |
 | ||
| Fig. 7 The electrochemical performance of CDs-nanocomposite on NF electrode material (a) comparison of the CV curve of CDs, nanocomposite (inset), and CDs-nanocomposite at a scan rate of 50 mV s−1 (b) CV curves of CDs-nanocomposite at various scan rates (c) specific capacitance of CDs-nanocomposite at various scan rates and (d) galvanostatic charge–discharge curves of CDs-nanocomposite at various current densities. | ||
Fig. 7(b) further demonstrates the properties of the electrode material, illustrating the CV curves of the CDs-nanocomposite tested at different scan rates ranging from 5 to 80 mV s−1. All the curves possess two redox peaks. As the scan rate increases, the oxidation peak of the CDs-nanocomposite shifts to a higher potential, and the reduction peak shifts to a lower potential. This can be ascribed to the relatively slow kinetics of the electrochemical reactions at higher scan rates and suggests that the electron transfer process is quasi-reversible or reversible.41,42 In addition, as the scan rate increases, the height of the redox peak also increases, and, consequently, the area of the CV curve increases, indicating good electron conduction.43 There is no substantial change in the shape of the curves even at the highest scan rate (80 mV s−1), which suggests that the CDs-nanocomposite has fast charge transfer properties.44 Fig. 7(c) shows the specific capacitance of the CDs-nanocomposite at different scan rates. These values were calculated using the following equation:45
 | (2) |
The curves at different current densities ranging from 10 to 30 A g−1 were compared, as illustrated in Fig. 7(d), by controlling the measured currents of the CDs-nanocomposite according to the mass of active substance coated on the NF substrate. These values were calculated using the following equation:46
 | (3) |
The cycling stability of the electrode material was analyzed using the CV technique continuously for 3000 cycles at a constant scan rate of 80 mV s−1 within a potential window of 0–0.75 V to evaluate the electrochemical behavior of the CDs-nanocomposite further. The results presented in Fig. 8(a) show that the CDs-nanocomposite electrode material delivers 72.2% capacitance after 3000 cycles, signifying its remarkable long-life cyclic stability.
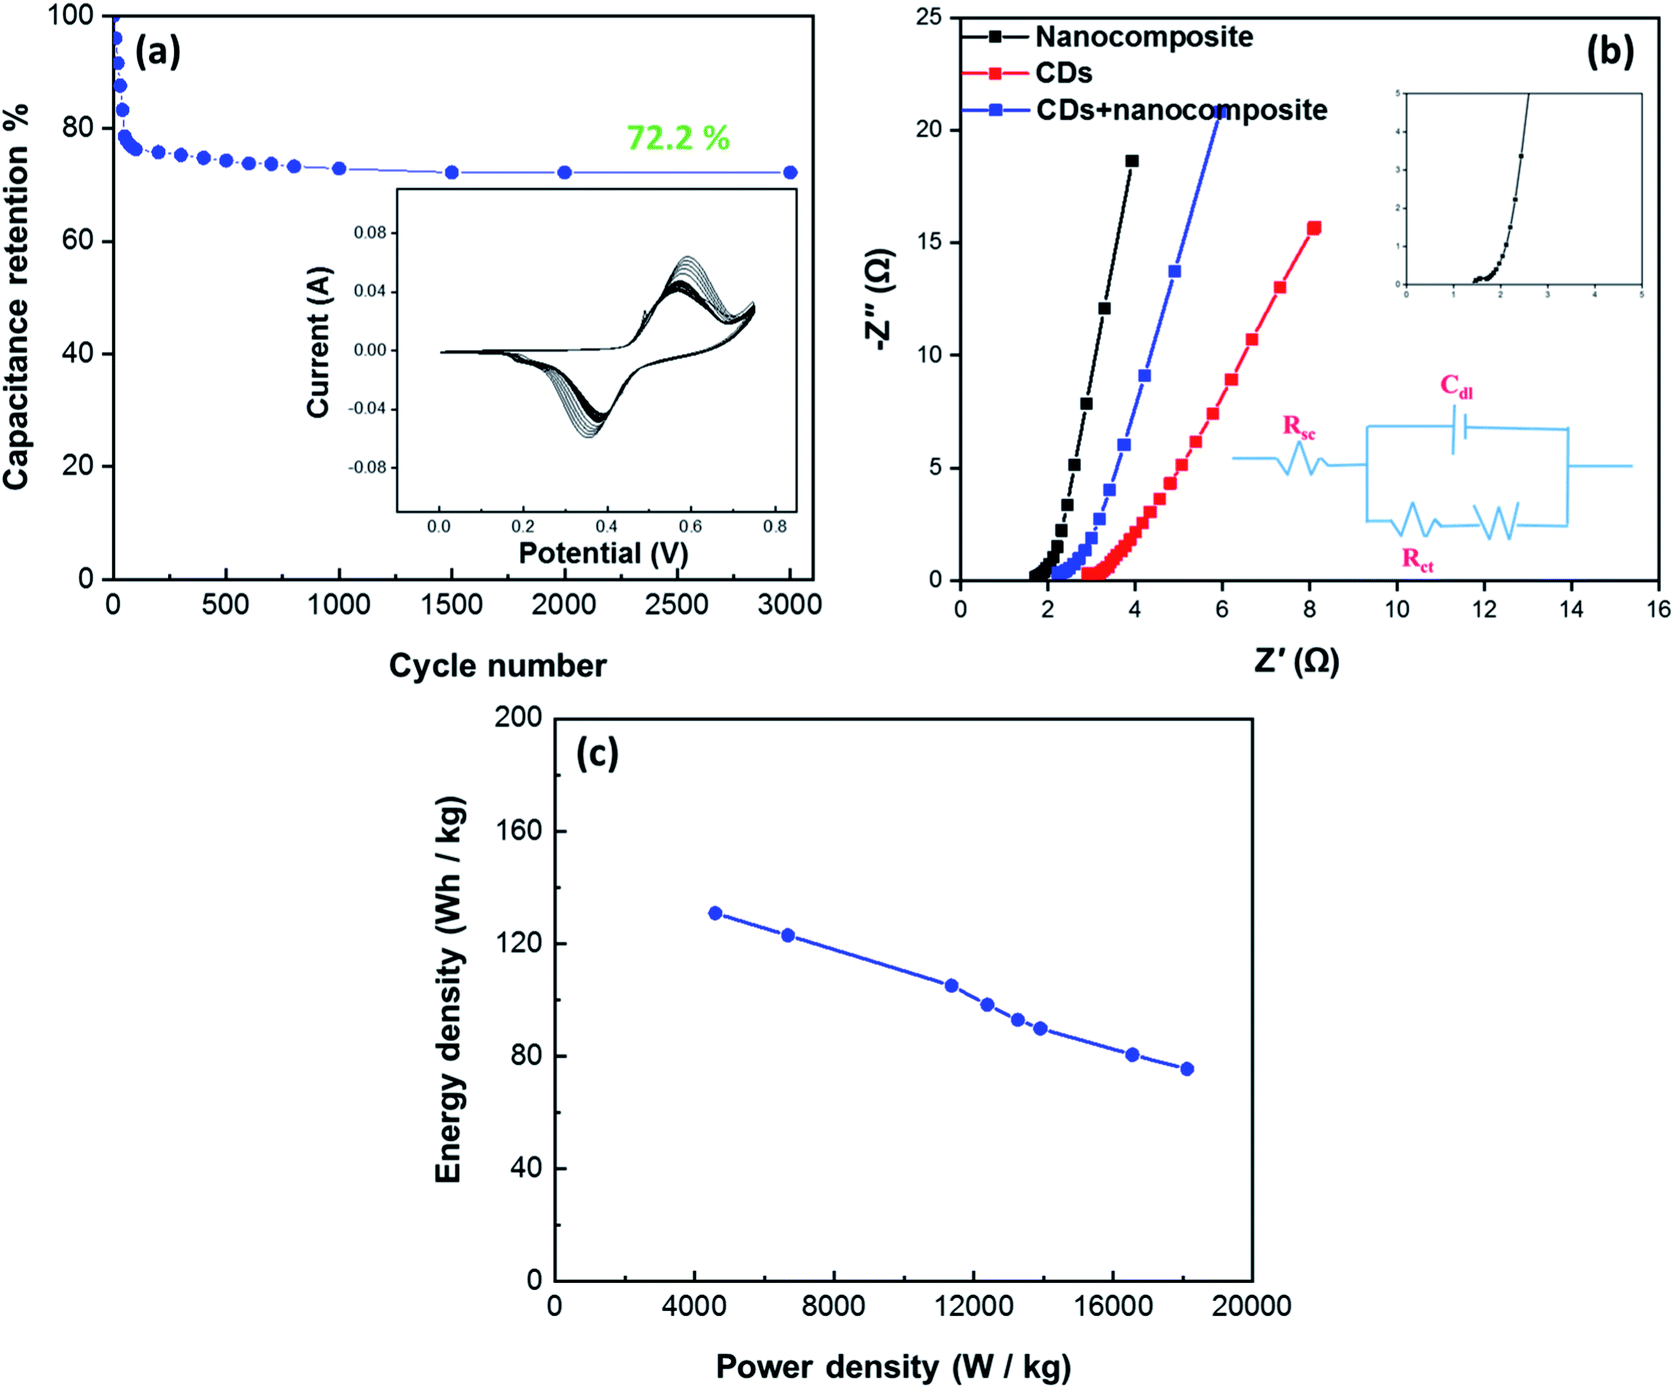 | ||
| Fig. 8 (a) Long-life cyclic stability (over 3000 cycles) of CDs-nanocomposite at a scan rate of 80 mV s−1 in 1 M KOH electrolyte (inset is the CV curve for the initial and final few cycles of CDs-nanocomposite), (b) Nyquist plot of nanocomposite, CDs-nanocomposite and CDs on NF (inset figure is the high frequency region of CDs-nanocomposite at the top, and EIS equivalent circuit at the bottom) and (c) Ragone plots of the CDs-nanocomposite. | ||
More helpful technique to understand the electrochemical performance and the energy storage mechanism for CDs-nanocomposite as hybrid SCs is electrochemical impedance spectroscopy (EIS) technique. EIS is a very significant technique to analyze the electrochemical behavior occurring at different frequencies in SCs. The EIS provides a total overview of all the frequency behavior of a system and gives information about the capacitive behavior, the resistance, and the diffusion-limited processes. EIS techniques make it easy to differentiate between EDLC and faradaic reaction capacitance in redox-active materials since these two processes occur at different frequencies. The ideal Nyquist plot produced by EIS consists of a semicircle at high frequency, a tilted linear variation of the impedance in the middle frequency range, and a vertical tail at low frequency.48,49
Fig. 8(b) shows the Nyquist plots for the CDs, nanocomposite, and CDs-nanocomposite obtained in the frequency range of 1.0 to 200 kHz with an ac voltage amplitude of 10 mV. Semicircles are as the charge transfer resistance (Rct) is the charge transfer resistance at the electrode–electrolyte interface, and Rs is the solution resistance, calculated from the semicircle's intercept with the x-axis.50,51 It can be noticed that, Rs of CDs-nanocomposite gives intermediate value of 1.5 Ω compared to nanocomposite and CDs. This value of Rs indicates the difference in conductivity of the electrode materials, the lower Rs value of CDs-nanocomposite shows the higher conductivity due to a good contact between composite with highly conductive CDs and also short electron path-length as the presence of CDs helps the electrons to migrate to the surface of the electrode active materials which is favorable to redox reactions.41 The very small semicircle that appears in the region of high frequency has very low diameter, showing low Rct (0.4 Ω). The line with a sharp slope at low frequency is specific for the electrode capacity, that looks vertically in ideal capacitors.52 As shown in Fig. 8(b), the linear part of the CDs-nanocomposite curve looks more vertical, with a smaller practical impedance value, and its shape looks closer to the ideal form. Therefore, it can be noted that the modification of the nanocomposite with CDs enhances the electrochemical performance of hybrid SCs.
Fig. 8(c) shows the Ragone plot (power density vs. energy density) of the CDs-nanocomposite. The values of energy density and power density were calculated from the following equations:53,54
 | (4) |
 | (5) |
| Electrode material | Method | Electrolyte | Specific capacitance | Power density | Energy density | Ref | |
|---|---|---|---|---|---|---|---|
| TiO2–CNT film | Electrochemical deposition | PVA–H2SO4 | 345.7 F g−1 at 1 A g−1 | 9.4 kW kg−1 | 82.5 W h kg−1 | 55 | |
| CNT/TiNiW | Dr Blade technique | PVA/H3PO4 | 549.1 F g−1 at 1 A g−1 | — | 336.7 W h kg−1 | 56 | |
| Co3O4/TiO2/activated carbon on NF | Simple solgel | 6 M KOH | 946 F g−1 at 5 mV s−1 | — | — | 57 | |
| SWCNTs/TiO2 | Hydrothermal | PVA/H2SO4 | 144 F g−1 at 1 A g−1 | 62.5 W kg−1 | 20 W h kg−1 | 58 | |
| CDs/TiO2 | Chemical reduction & pyrolysis | 2 M KOH | 2200 mF cm−2 at 5 mV s−1 | 635 µW cm−2 | 51.3 µW h cm−2 | 21 | |
| CDs/PPy/TiO2 nanotube arrays | Anodization | 0.15 M pyrrole monomer & 0.1 M (LiClO4) | 482 F g−1 at 0.5 A g−1 | 150 W kg−1 | 42.5 W h kg−1 | 59 | |
| CDs-nanocomposite | Layer-by-layer and hydrothermal methods | 1 M KOH | 913.7 F g−1 at 5 mV s−1 | 20 kW kg−1 | 130.7 W h kg−1 | This work | |
4 Conclusion
To summarize, in this study, a TiO2-based nanocomposite (CoxNi1−xFe2O4, x = 0.5/SiO2/TiO2) was synthesized using a simple layer-by-layer approach. It was then enhanced with CDs synthesized using a one-pot hydrothermal method, loaded on NF substrate, and investigated as a potential electrode material for hybrid SCs. The structure and morphology of the CDs-nanocomposite were analyzed using various techniques, such as XRD, BET, Raman spectroscopy, SEM, EDS, and TEM. The calculated specific capacitance value of the CDs-nanocomposite was 913.7 F g−1 at a scan rate of 5 mV s−1, and it demonstrated good cyclic stability over 3000 cycles with capacitance retention of 72% and a superior energy density value of 130.7 W h kg−1. In conclusion, we suggest that the CDs-nanocomposite developed in this study has the potential to enhance the electrochemical performance of hybrid SCs and that the simple synthesis method can be applied to similar TiO2 nanocomposites to create favorable electrode materials for advanced energy storage systems.Conflicts of interest
There are no conflicts to declare.Acknowledgements
Authors A. Matsuda and G. Kawamura would like to acknowledge Japan Society for Promotion of Science (JSPS) KAKENHI Grant No. 18H03841 and No. 21K18823.References
- K.-Q. Chen, W.-H. Pu, Q. Zhang, X.-L. Xing, C. Xiong and M.-D. Guo, J. Energy Storage, 2021, 41, 102959 CrossRef.
- M.-J. Li, C.-X. Song and W.-Q. Tao, Appl. Energy, 2016, 169, 738–747 CrossRef.
- M.-J. Li and W.-Q. Tao, Appl. Energy, 2017, 187, 203–215 CrossRef.
- A. Cosic, M. Stadler, M. Mansoor and M. Zellinger, Energy, 2021, 121559, DOI:10.1016/j.energy.2021.121559.
- K.-B. Wang, Q. Xun and Q. Zhang, EnergyChem, 2020, 2, 100025 CrossRef.
- A. N. Abdalla, M. S. Nazir, H. Tao, S. Cao, R. Ji, M. Jiang and L. Yao, J. Energy Storage, 2021, 40, 102811 CrossRef.
- F. Gasanzade, W. T. Pfeiffer, F. Witte, I. Tuschy and S. Bauer, Renew. Sustain. Energy Rev., 2021, 149, 111422 CrossRef.
- S. Weitemeyer, D. Kleinhans, T. Vogt and C. Agert, Renewable Energy, 2015, 75, 14–20 CrossRef.
- S. Zheng, Y. Sun, H. Xue, P. Braunstein, W. Huang and H. Pang, Natl. Sci. Rev., 2021 DOI:10.1093/nsr/nwab197.
- Y. Zhou, H. Qi, J. Yang, Z. Bo, F. Huang, M. S. Islam, X. Lu, L. Dai, R. Amal, C. H. Wang and Z. Han, Energy Environ. Sci., 2021, 14, 1854–1896 RSC.
- K. Fic, A. Platek, J. Piwek and E. Frackowiak, Mater. Today, 2018, 21, 437–454 CrossRef CAS.
- G. S. dos Reis, R. M. A. Pinheiro Lima, S. H. Larsson, C. M. Subramaniyam, V. M. Dinh, M. Thyrel and H. P. de Oliveira, J. Environ. Chem. Eng., 2021, 106155, DOI:10.1016/j.jece.2021.106155.
- Y. Mo, J. Du, H. Lv, Y. Zhang and A. Chen, Diamond Relat. Mater., 2021, 111, 108206 CrossRef CAS.
- Y. Bai, C. Liu, T. Chen, W. Li, S. Zheng, Y. Pi, Y. Luo and H. Pang, Angew. Chem., 2021, 133, 25522–25526 CrossRef.
- T. Jorn-am, J. Praneerad, R. Attajak, N. Sirisit, J. Manyam and P. Paoprasert, Colloids Surf., A, 2021, 127239, DOI:10.1016/j.colsurfa.2021.127239.
- S. Zhang, X. Shi, X. Chen, D. Zhang, X. Liu, Z. Zhang, P. K. Chu, T. Tang and E. Mijowska, ACS Appl. Energy Mater., 2019, 2, 4234–4243 CrossRef CAS.
- N. Hussain, S. Alwan, H. Alshamsi and I. Sahib, Int. J. Chem. Eng., 2020, 2020, 9068358 Search PubMed.
- B. Unnikrishnan, C.-W. Wu, I. W. P. Chen, H.-T. Chang, C.-H. Lin and C.-C. Huang, ACS Sustainable Chem. Eng., 2016, 4, 3008–3016 CrossRef CAS.
- M. M. Rahman, P. M. Joy, M. N. Uddin, M. Z. B. Mukhlish and M. M. R. Khan, Heliyon, 2021, 7, e07407 CrossRef PubMed.
- S. M. Youssry, M. N. El-Nahass, R. Kumar, I. S. El-Hallag, W. K. Tan and A. Matsuda, J. Energy Storage, 2020, 30, 101485 CrossRef.
- W. Pholauyphon, R. N. Bulakhe, J. Praneerad, R. Attajak, J. Manyam, I. In and P. Paoprasert, Electrochim. Acta, 2021, 390, 138805 CrossRef CAS.
- A. Elmouwahidi, E. Bailón-García, J. Castelo-Quibén, A. Pérez-Cadenas, F. Maldonado-Hódar and F. Carrasco-Marín, J. Mater. Chem. A, 2018, 6, 633–644 RSC.
- V. Sharavath, S. Sarkar and S. Ghosh, J. Electroanal. Chem., 2018, 829, 208–216 CrossRef CAS.
- K. Xiao, J.-W. Li, G.-F. Chen, Z.-Q. Liu, N. Li and Y.-Z. Su, Electrochim. Acta, 2014, 149, 341–348 CrossRef CAS.
- P. Gao, Y. Zeng, P. Tang, Z. Wang, J. Yang, A. Hu and J. Liu, Adv. Funct. Mater., 2021, 2108644 CrossRef.
- P. Tang, P. Gao, X. Cui, Z. Chen, Q. Fu, Z. Wang, Y. Mo, H. Liu, X. Chaohe, J. Liu, J. Yan and S. Passerini, Adv. Energy Mater., 2021, 2102053 CrossRef.
- D. Ghosh, S. Giri, S. Kalra and C. K. Das, Open J. Appl. Sci., 2012, 2, 70 CrossRef.
- C. Hu, M. Li, J. Qiu and Y.-P. Sun, Chem. Soc. Rev., 2019, 48, 2315–2337 RSC.
- E. Zhang, X. Jia, B. Wang, J. Wang, X. Yu and B. Lu, Adv. Sci., 2020, 7, 2000470 CrossRef CAS PubMed.
- A. Seetharaman, M. Kandasamy, S. Manivannan, K. Jothivenkatachalam, K. Subramani, A. Pandikumar, M. Sathish, V. Rao Soma, D. Sivasubramanian and B. Chakraborty, Appl. Surf. Sci., 2021, 563, 150259 CrossRef CAS.
- K. Subramani, N. Sudhan, M. Karnan and M. Sathish, ChemistrySelect, 2017, 2, 11384–11392 CrossRef CAS.
- M. Karnan, K. Subramani, N. Sudhan, N. Ilayaraja and M. Sathish, ACS Appl. Mater. Interfaces, 2016, 8, 35191–35202 CrossRef CAS PubMed.
- M. Abd Elkodous, G. S. El-Sayyad, A. E. Mohamed, K. Pal, N. Asthana, F. G. de Souza Junior, F. M. Mosallam, M. Gobara and A. I. El-Batal, J. Mater. Sci.: Mater. Electron., 2019, 30, 8312–8328 CrossRef.
- G. S. El-Sayyad, M. Abd Elkodous, A. M. El-Khawaga, M. A. Elsayed, A. I. El-Batal and M. Gobara, RSC Adv., 2020, 10, 5241–5259 RSC.
- M. Abd Elkodous, G. S. El-Sayyad, S. M. Youssry, H. G. Nada, M. Gobara, M. A. Elsayed, A. M. El-Khawaga, G. Kawamura, W. K. Tan, A. I. El-Batal and A. Matsuda, Sci. Rep., 2020, 10, 11534 CrossRef CAS PubMed.
- M. Abd Elkodous, G. S. El-Sayyad, M. I. A. Abdel Maksoud, R. Kumar, K. Maegawa, G. Kawamura, W. K. Tan and A. Matsuda, J. Hazard. Mater., 2021, 410, 124657 CrossRef CAS PubMed.
- A. S. Rajan, S. Sampath and A. K. Shukla, Energy Environ. Sci., 2014, 7, 1110–1116 RSC.
- T. Wang, H. C. Chen, F. Yu, X. Zhao and H. Wang, Energy Storage Mater., 2019, 16, 545–573 CrossRef.
- Z. Ji, N. Li, M. Xie, X. Shen, W. Dai, K. Liu, K. Xu and G. Zhu, Electrochim. Acta, 2020, 334, 135632 CrossRef CAS.
- V. C. Hoang and V. G. Gomes, Mater. Today Energy, 2019, 12, 198–207 CrossRef.
- I. S. El-Hallag, M. N. El-Nahass, S. M. Youssry, R. Kumar, M. M. Abdel-Galeil and A. Matsuda, Electrochim. Acta, 2019, 314, 124–134 CrossRef CAS.
- W. Pholauyphon, R. N. Bulakhe, J. Praneerad, R. Attajak, J. Manyam, I. In and P. Paoprasert, Electrochim. Acta, 2021, 138805, DOI:10.1016/j.electacta.2021.138805.
- Y. Zhou, X. Zou, Z. Zhao, B. Xiang and Y. Zhang, Ceram. Int., 2018, 44, 16900–16907 CrossRef CAS.
- D. Kumar and S. Hiranwal, Descriptive Study and Analysis of Forest Change detection techniques using Satellite Images, International Conference on Smart Systems and Inventive Technology (ICSSIT), IEEE, 2019 Search PubMed.
- S. Zhu, X. Zou, Y. Zhou, Y. Zeng, Y. Long, Z. Yuan, Q. Wu, M. Li, Y. Wang and B. Xiang, J. Alloys Compd., 2019, 775, 63–71 CrossRef CAS.
- M. Ashourdan, A. Semnani, F. Hasanpour and S. E. Moosavifard, J. Energy Storage, 2021, 36, 102449 CrossRef.
- L. Abbasi, M. Arvand and S. E. Moosavifard, Carbon, 2020, 161, 299–308 CrossRef CAS.
- K. W. Leitner, B. Gollas, M. Winter and J. O. Besenhard, Electrochim. Acta, 2004, 50, 199–204 CrossRef CAS.
- P. Navalpotro, M. Anderson, R. Marcilla and J. Palma, Electrochim. Acta, 2018, 263, 110–117 CrossRef CAS.
- H. R. Ghenaatian, M. F. Mousavi and M. S. Rahmanifar, Electrochim. Acta, 2012, 78, 212–222 CrossRef CAS.
- Q. Li, X.-F. Lu, H. Xu, Y.-X. Tong and G.-R. Li, ACS Appl. Mater. Interfaces, 2014, 6, 2726–2733 CrossRef CAS PubMed.
- G. Zhu, Z. He, J. Chen, J. Zhao, X. Feng, Y. Ma, Q. Fan, L. Wang and W. Huang, Nanoscale, 2014, 6, 1079–1085 RSC.
- X. Xu, J. Yang, X. Zhou, S. Jiang, W. Chen and Z. Liu, Chem. Eng. J., 2020, 397, 125525 CrossRef CAS.
- R. Kumar, H.-J. Kim, S. Park, A. Srivastava and I.-K. Oh, Carbon, 2014, 79, 192–202 CrossRef CAS.
- J. Li, J. Ao, C. Zhong and T. Yin, Appl. Surf. Sci., 2021, 563, 150301 CrossRef CAS.
- R. Mendoza, M. Al-Sardar, A. I. Oliva, G. Robledo-Trujillo, V. Rodriguez-Gonzalez, A. Zakhidov and J. Oliva, J. Phys. Chem. Solids, 2021, 155, 110128 CrossRef CAS.
- K. Sirengo, Y. A. C. Jande, T. E. Kibona, A. Hilonga, C. Muiva and C. K. King'ondu, Mater. Chem. Phys., 2019, 232, 49–56 CrossRef CAS.
- M. S. Lal, R. Badam, N. Matsumi and S. Ramaprabhu, J. Energy Storage, 2021, 40, 102794 CrossRef.
- Y. Xie and H. Du, RSC Adv., 2015, 5, 89689–89697 RSC.
Footnotes |
| † Electronic supplementary information (ESI) available. See DOI: 10.1039/d1ra08045h |
| ‡ Equal contribution. |
| This journal is © The Royal Society of Chemistry 2021 |