 Open Access Article
Highly efficient and self-supported 3D carbon nanotube composite electrode for enhanced oxygen reduction reaction†
Bo Zheng *,
Yue Zhou,
Zhaorui Pan,
Guangxiang Liu* and
Leiming Lang
 *
*
Excellent Science and Technology Innovation Group of Jiangsu Province, Nanjing Xiaozhuang University, Nanjing 211171, China. E-mail: zhengbo7991@163.com; njuliugx@126.com; langleiming@njxzc.edu.cn
First published on 3rd December 2021
Abstract
A binder-free and self-supported 3D carbon nanotube composite electrode with NiFe nanoalloys, N doping and Fe/Ni–Nx–C structures was fabricated by a facile method. The strong synergistic effects of multi-components and the unique structural merits of the optimized sample endowed it outstanding oxygen reduction reaction activity with an onset potential of 1.048 V vs. RHE in 0.1 M KOH solution.
Introduction
Oxygen reduction reaction (ORR) is the pivotal cathodic reaction of fuel cell and metal–air cell. However, its sluggish reaction rate greatly restricts the working efficiency of the device.1,2 Therefore, to boost the ORR kinetic process, electrodes modified with various electrocatalysts, e.g., platinum and non-platinum-based catalysts, have extensively been investigated. Nevertheless, traditional electrode materials usually contain extra binders and additives apart from catalytic nanomaterials, which may overlay the active sites of catalyst, thus reducing their electrocatalytic performance.3 For example, the overall activity of the resultant electrode is largely hindered by uncontrollable interfacial evolution due to inevitable aggregation of nanocatalysts, when nanosized materials are processed by the conventional drop-casting methods.4 Moreover, the utilization of insulated polymer binders (e.g., Nafion) somewhat blocks the pathway of electrons and thus lowers electrocatalytic activity.5 Worse still, the glued catalysts tend to exfoliate from the substrate especially under vigorous gas bubbles.6 Therefore, designing the binder-free electrode structure to make full use of the related surface and interface of the nanomaterials for the electrochemical energy devices is an effective strategy.7–13Three-dimensional nanoarray (3D-NA), especially directly in situ grown on the current collector substrates, for example, nanowires, nanorods and nanotubes, is a promising electrode structure due to relatively ordered, continuous and fully exposed active surfaces, which can significantly promote the mass and electron transfer ability at the electrode/electrolyte interface and within the electrode. Carbon nanotubes (CNTs) as a kind of one-dimensional carbon material, have special properties of very high aspect ratio, light weight and small thickness, which make them possess some outstanding traits of high specific surface area, good electrical conductivity, mechanical property and stability. Consequently, 3D-CNTs have been substantially investigated for energy storage and conversion devices.13–16 Despite of advanced progress, delicately regulating surface/interface engineering of 3D-CNTs is still challenging. Metal–nitrogen–carbon (M–Nx–C) catalysts, especially for Fe–Nx–C, have drawn great attention, showing unprecedented ORR activity. In the meantime, meticulous design of metal nanoparticles encapsulated in the carbon matrix can further effectively promote electrocatalytic activity.17–20
Considering the above discussed factors, we proposed a strategy to synthesize the self-supported 3D N-doped CNT composite with encapsulated NiFe nanoalloys. It can be directly utilized as the working electrode, exhibiting remarkable ORR activity.
Results and discussion
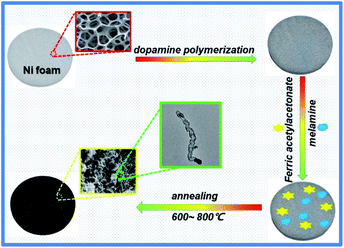
As depicted in Scheme 1, the fabrication of 3D N-doped CNT composite (FMPN-T, T stands for calcination temperature) involved three main steps as following. Nickel foam (NF) was chosen as catalyst and supporting substrate. Firstly, dopamine monomers were polymerized on the Ni foam to form the composite substrates (PDA-NF) in order to promote the adhesion of the subsequent growth of CNTs to the support.14 Then, ferric acetylacetonate as co-catalyst and carbon source, and melamine as nitrogen and carbon sources, were mixed with PDA-NF. Finally, the FMPN-T samples were prepared by one-step annealing without any post-treatment. Controlling the annealing temperature can expediently modulate the composition of N doping and Fe/Ni atom ratio in the resulted samples. For comparison, GMPN-800 was prepared by replacing ferric acetylacetonate with glucose. The detailed experiment can be seen in the experimental section.SEM images of FMPN-700 sample at low (Fig. 1a) and high (Fig. 1b) magnification showed that a large number of three-dimensional carbon nanotubes were entangled grown on the nickel foam substrate. Moreover, after removing the nickel foam substrate by acid dissolution, the carbon nanotubes still maintained a relatively integrated array structure, which may be attributed to their direct growth on the carbonized PDA layer pre-modified on the Ni foam (Fig. 1c). TEM image (Fig. 1d) further revealed the bamboo-like carbon nanotube with the diameter of 20–30 nm. Meanwhile, there were some visible nanoparticles (NPs) well-encapsulated inside of the nanotube. The high angle annular dark field scanning transmission electron microscopy (HAADF-STEM) image and the corresponding EDS mapping of C, N, Fe and Ni in Fig. S1† clearly revealed that detected elements were distributed throughout the entire nanotube. Although GMPN-800 exhibited the similar inherent morphology (Fig. S2†), it was too brittle and easily broken (the inset of Fig. S2†) because of excessive consumption of Ni substrate as the sole catalyst for the growth of CNTs. Comparing the insets of Fig. 1a and S2,† FMPN-700 sample behaved better mechanical property than GMPN-800. The reason may be that the Fe and Ni metals co-catalysed the formation of CNTs, considerably alleviating the consumption of the Ni matrix.
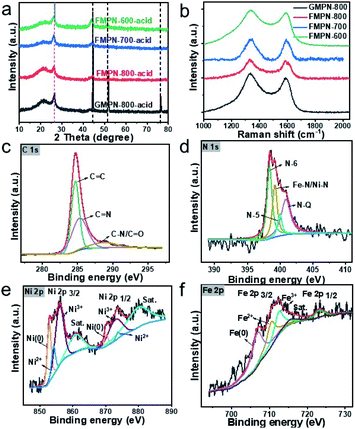
XRD measurements were carried out to acquire the crystal structures of the as-prepared samples. As seen from the Fig. S3,† three typical peaks at 44.6, 51.8 and 76.7° can be ascribed to the (002), (200) and (220) planes of metallic Ni. No obvious peaks of carbon materials can be observed because the amount of carbon material was so tiny relative to the nickel foam substrate that their diffraction peaks were masked. To explore the crystal structure of carbon nanotubes, all the samples were rinsed by hydrochloric acid and water to remove the Ni substrates. The XRD patterns of the resulted samples were shown in Fig. 2a. A well-defined sharp diffraction peak at 26° was indexed to the (002) reflection of graphitic carbon and the adjacent broaden peak indicated some amorphous carbon species co-existed in the composites. The other peaks were assigned to the remained metallic NiFe NPs encapsulated in the CNTs, as confirmed in the TEM image (Fig. 1d). Raman spectroscopy is often used to estimate the graphitization degree and defect structure of carbon materials.21,22 The G band at 1586 cm−1 was attributed to the in-plane vibration mode E2g of sp2-hybridized carbon atoms. The presence of D band at 1338 cm−1 arose from the structure deformation (e.g., sp3-hybridized carbon vibrations) and defects.23 The ID/IG values of GMPN-800, FMPN-800, FMPN-700 and FMPN-600 samples were 1.14, 1.06, 1.02 and 1.06 (Fig. 2b), respectively, indicating rich surface defects resulting from the introduction of foreign heteroatoms in the carbon matrix.24,25 What's more, the addition of Fe precursor seemed to enhance the graphitization degree of carbon material. The moderate ID/IG value by fine-regulating the local geometric and electronic environment in carbon matrix represents the appropriate percentage of defects and graphitic carbon, which could play a critical role in boosting the electrocatalytic activity.26 X-Ray photoelectron spectroscopy (XPS) is a highly sensitive surface analysis technique, which can provide detailed information on the elemental composition and binding structure. To unveil the chemical constitution of the as-synthesized CNT composites, we collected them by scraping from the FMPN-800, FMPN-700 and FMPN-600 samples with a knife. While, the detected CNT composite of GMPN-800 was collected by etching the Ni substrate with diluted hydrochloric acid because of its brittleness. The high-resolution C 1s, N 1s, Ni 2p and Fe 2p spectra were shown in Fig. S4† and their atomic percentage of C, N, O, Ni and Fe elements were listed in Table S1.† For the FMPN-800, FMPN-700 and FMPN-600 samples, the N content decreased with the elevation of calcination temperature, while the total amount of metal incorporated into the carbon matrix increased. The Fe/Ni atom ratios in the FMPN-800, FMPN-700 and FMPN-600 were 0.61, 0.81 and 2.31, respectively. As depicted in Fig. 2c, the high-resolution C 1s spectrum of the FMPN-700 showed three prominent peaks at 284.6, 285.4 and 288.0 eV assigned to the C![[double bond, length as m-dash]](https://www.rsc.org/images/entities/char_e001.gif) C, C
C, C![[double bond, length as m-dash]](https://www.rsc.org/images/entities/char_e001.gif) N and C–N/C
N and C–N/C![[double bond, length as m-dash]](https://www.rsc.org/images/entities/char_e001.gif) O,22,27 respectively. Fig. 2d exhibited the doped N atoms could be deconvoluted into four peaks: pyridinic-N (N-6, 398.4 eV), Fe/Ni–Nx (399.2 eV), pyrrolic-N (N-5, 400.1 eV) and graphitic-N (N-Q, 400.9 eV).25 It is commonly recognized that pyridinic-N, metal–Nx and graphitic-N can promote the ORR performance efficiently.24,28 Comparing the N bonding configurations (Fig. S5†), the FMPN-700 had the highest content (∼91%) of pyridinic-N, metal–Nx and graphitic-N. The Ni 2p high-resolution spectrum in Fig. 2e demonstrated peaks at 852.9, 854.1 and 855.9 eV ascribed to Ni 2p3/2 of Ni(0), Ni2+ and Ni3+ species. The peaks at 870.2, 872.9 and 873.7 eV could be designated to the Ni 2p1/2 band with Ni(0), Ni2+ and Ni3+. Besides, two satellite peaks of Ni 2p3/2 and Ni 2p1/2 were positioned at 860.8 and 879.8 eV,29 respectively. The Fe 2p high-resolution spectrum in Fig. 2f displayed peaks centred at 706.7, 709.7 and 711.9 eV, which could be assigned to Fe 2p3/2 orbitals of Fe(0), Fe2+ and Fe3+, respectively. The peak at 723.2 eV could be ascribed to the Fe 2p1/2 band with Fe species.
O,22,27 respectively. Fig. 2d exhibited the doped N atoms could be deconvoluted into four peaks: pyridinic-N (N-6, 398.4 eV), Fe/Ni–Nx (399.2 eV), pyrrolic-N (N-5, 400.1 eV) and graphitic-N (N-Q, 400.9 eV).25 It is commonly recognized that pyridinic-N, metal–Nx and graphitic-N can promote the ORR performance efficiently.24,28 Comparing the N bonding configurations (Fig. S5†), the FMPN-700 had the highest content (∼91%) of pyridinic-N, metal–Nx and graphitic-N. The Ni 2p high-resolution spectrum in Fig. 2e demonstrated peaks at 852.9, 854.1 and 855.9 eV ascribed to Ni 2p3/2 of Ni(0), Ni2+ and Ni3+ species. The peaks at 870.2, 872.9 and 873.7 eV could be designated to the Ni 2p1/2 band with Ni(0), Ni2+ and Ni3+. Besides, two satellite peaks of Ni 2p3/2 and Ni 2p1/2 were positioned at 860.8 and 879.8 eV,29 respectively. The Fe 2p high-resolution spectrum in Fig. 2f displayed peaks centred at 706.7, 709.7 and 711.9 eV, which could be assigned to Fe 2p3/2 orbitals of Fe(0), Fe2+ and Fe3+, respectively. The peak at 723.2 eV could be ascribed to the Fe 2p1/2 band with Fe species.
These characterization results convincingly suggested that different functionalization moieties, such as N-doped carbon, carbon defects, metal alloy nanoparticles and Ni/Fe–Nx–C, co-existed in the composites, which could synergistically boost the electrocatalytic activity.
As previously reported, CNT composites exhibit excellent ORR catalytic performance.24,28,30–32 Herein, firstly, the ORR activities of the as-prepared electrodes were investigated in 0.1 M KOH solution by cyclic voltammetry (CV) method. Seen from Fig. 3, oxygen reduction peak occurred for all the as-prepared samples in the O2-saturated KOH solution, while no obvious reduction peak appears in the N2-saturated KOH solution. The results clearly demonstrated their electrocatalytic ORR activity. In addition, the FMPN-700 showed the best performance with the peak potential at 0.775 V, comparable to that of Pt/C catalyst at 0.772 V. It was noted that some black powders began to fall down from the GMPN-800 electrode after a period of examination, indicating its poor stability (Fig. S6a†). In contrast, the FMPN-700 electrode always kept its original morphology (Fig. S6b†). Then, linear scanning voltammetry (LSV) measurements were conducted at a scan rate of 5 mV s−1 (Fig. 4a–e) to evaluate their ORR performance. The onset potentials (denoted as the potential deviating from the background) of GMPN-800, FMPN-800, FMPN-700 and FMPN-600 were located at 0.965, 1.005, 1.048 and 1.004 V, respectively. It was obvious that the FMPN-700 exhibited the most positive onset potential. For commercial Pt/C, the onset potential was at 0.980 V, which is more negative than that of the FMPN-700 electrode. The diffusion–limited current density (at 0.85 V) was further used to estimate their activity. The FMPN-700 exhibited the highest diffusion–limited current density of −1.370 mA cm−2 compared with the other electrodes of GMPN-800 (−0.369 mA cm−2), FMPN-800 (−0.992 mA cm−2), FMPN-600 (−0.440 mA cm−2) and Pt/C (−0.585 mA cm−2). All these electrochemical tests demonstrated the highest ORR performance of the FMPN-700 electrode. Diverse nitrogen functional groups will result in different influences on ORR performance. It is commonly recognized that pyridinic N may enhance the adsorption of O2 and raise the onset potential, whereas graphitic N can reduce the adsorption energy of O2 and accelerate the electron transfer and limiting current density in ORR.33 Moreover, the metal–Nx structure can delocalize the surface charge and promote the electron transfer, which has been demonstrated to enhance the adsorption of O2 molecules, lower the reaction barrier, and synergistically facilitate the ORR process.32 Comparing the N bonding configurations of the as-prepared samples (Fig. S5†), the FMPN-700 displayed the highest content (∼91%) of pyridinic-N, metal–Nx and graphitic-N, which may lead to the highest ORR activity. In order to illustrate the advantage of the special structure, controlled experiment was carried out. The FMPN-700 electrode sheet was treated by 5 M hydrochloric acid and rinsed with water. The resulted FMPN-700-acid catalyst was measured on a rotating disk electrode (RDE) by LSV at 1600 rpm (Fig. S7†). It exhibited degraded ORR performance with the onset potential at 0.892 V and the diffusion–limited current density of −0.550 mA cm−2 at −0.85 V. The result suggested that the unique FMPN-700 structure with various active moieties was vital for the enhanced ORR activity.
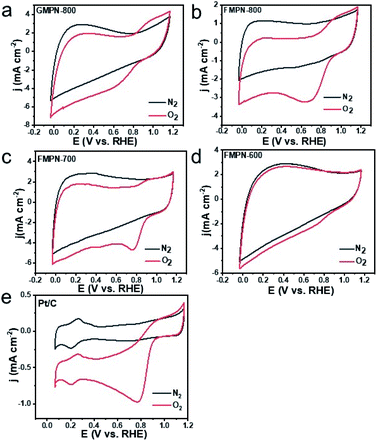 | ||
| Fig. 3 CV curves of GMPN-800 (a), FMPN-800 (b), FMPN-700 (c), FMPN-600 (d) and commercial Pt/C (e) samples at a scan rate of 20 mV s−1 in the N2 and O2-saturated KOH solution. | ||
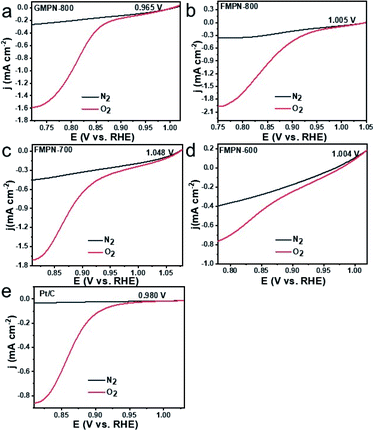 | ||
| Fig. 4 LSV curves of (a) GMPN-800, (b) FMPN-800, (c) FMPN-700 and (d) FMPN-600 and (e) Pt/C electrodes in 0.1 M KOH solution saturated with N2 and O2 at a scanning rate of 5 mV s−1. | ||
Electrochemical impedance spectroscopy (EIS) was further employed to study charge transfer kinetics of electrode materials. As shown in Fig. S8,† Nyquist plots revealed that GMPN-800 had the largest charge transfer resistance (∼4 Ω) in the high frequency region. Besides, it showed the smallest linear slope in the low frequency region, indicating the diffusion velocity of ions in this electrode structure was the slowest. However, the FMPN-700, FMPN-800 and FMPN-600 electrodes all showed much smaller charge transfer resistance (<1 Ω) at the interfacial surface and larger linear slope than those of GMPN-800, indicating their outstanding electron/mass transfer ability during ORR process. The increased conductivity may be attributed to the enhancement of graphitization degree of carbon nanomaterials, as affirmed by Raman analysis.
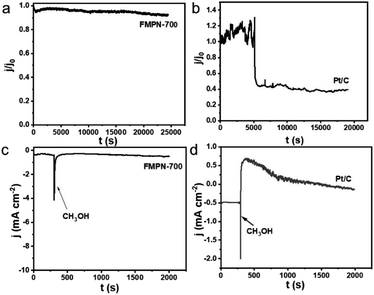
Chronopotentiometry tests were carried out to estimate the durability of the FMPN-700 and Pt/C electrodes. After a long test of 20![[thin space (1/6-em)]](https://www.rsc.org/images/entities/char_2009.gif) 000 s, FMPN-700 still remained a current retention of 94% in Fig. 5a. Conversely, the current density of the Pt/C electrode began to drop quickly after 5000 s running till to about 40% at 20
000 s, FMPN-700 still remained a current retention of 94% in Fig. 5a. Conversely, the current density of the Pt/C electrode began to drop quickly after 5000 s running till to about 40% at 20![[thin space (1/6-em)]](https://www.rsc.org/images/entities/char_2009.gif) 000 s (Fig. 5b), indicating that FMPN-700 possessed better stability than commercial Pt/C. What's more, the methanol tolerance ability was also examined by injecting methanol into the electrolyte at the potential of −0.35 V (vs. Ag/AgCl) during i–t chronoamperometric response test. Comparing Fig. 5c and d, a sharp oxidation current can be observed on Pt/C after introducing methanol at 300 s, whereas the FMPN-700 showed negligible decay under the same test conditions, which clearly testifying that the more outstanding tolerance to methanol poisoning effect of the FMPN-700.
000 s (Fig. 5b), indicating that FMPN-700 possessed better stability than commercial Pt/C. What's more, the methanol tolerance ability was also examined by injecting methanol into the electrolyte at the potential of −0.35 V (vs. Ag/AgCl) during i–t chronoamperometric response test. Comparing Fig. 5c and d, a sharp oxidation current can be observed on Pt/C after introducing methanol at 300 s, whereas the FMPN-700 showed negligible decay under the same test conditions, which clearly testifying that the more outstanding tolerance to methanol poisoning effect of the FMPN-700.
Conclusions
In summary, a facile and effective strategy was proposed to synthesize a binder-free and self-supported 3D N-doped CNT composite electrode, exhibiting outstanding ORR electrocatalytic activity. The introduction of Fe precursor during synthesis brought some benefits: (1) the mechanical property of the composite electrode was greatly improved. The reason may be that Fe acted as co-catalyst, thus reducing the consumption of Ni substrate during the growth of CNTs; (2) the formed FeNi nanoalloys encapsulated in the carbon matrix can regulate electronic structure, optimizing adsorption energy of intermediates; (3) Ni/Fe–Nx–C active sites incorporated into carbon nanomaterials partly contribute to the elevated ORR process. Our work could be applied to guide other advanced electrode design.Experimental section
Dopamine polymerization on the nickel foam surface
Ten pieces of clean nickel foam were placed in 50 mL of Tris–HCl buffer solution (pH = 8.5). 80 mg of dopamine hydrochloride was added. Subsequently, the polymerization was carried out on the surface of Ni foam. The polydopamine modified nickel foam was marked as PDA@NF.Fe–Ni co-catalyzed CNTs growth
The PDA@NF sheets were cleaned with purified water and ethanol for three times, respectively. Then, 0.35 g Ferric acetylacetonate (Fe(acac)3), 0.5 g melamine and 20 mL ethanol were mixed with PDA@NF sheets. After being stirred overnight, the resulted composites were put in an oven at 80 °C for drying. The dried mixture was placed in a porcelain boat and calcinated in a tubular furnace at a heating rate of 5 °C min−1 for 2 h under the atmosphere of nitrogen. The products were labelled as FMPN-T corresponding to different calcination temperature at 600, 700 and 800 °C. The FMPN-700-acid was denoted as the FMPN-700 sample treated by acid rinsing.Ni catalyzed CNTs growth
0.45 g of PDA@NF sheets were mixed with 1.37 g of melamine and glucose mixture (mass ratio: 40![[thin space (1/6-em)]](https://www.rsc.org/images/entities/char_2009.gif) :
:![[thin space (1/6-em)]](https://www.rsc.org/images/entities/char_2009.gif) 1). Then, the obtained mixture was calcinated at 800 °C for 2 h under nitrogen atmosphere. The product was denoted as GMPN-800.
1). Then, the obtained mixture was calcinated at 800 °C for 2 h under nitrogen atmosphere. The product was denoted as GMPN-800.
Material characterizations
The material morphologies were observed by scanning electron microscopy (FE-SEM, S-4800, Hitachi) and transmission electron microscope (TEM, Hitachi-2100, 200 kV), combined with energy dispersive X-ray spectrometry (EDS) for elemental mappings. The sample for TEM characterization was obtained by scraping the black powders from the substrate with a knife. The phase structure of samples was determined with X-ray diffraction (XRD, Bruker D8 advance with Cu Kα, λ = 1.5418 Å). X-ray photoelectron spectra (XPS) were recorded on a Thermo Fisher X-ray photoelectron spectrometer system. Raman spectra were collected on a Renishaw InVia micro-Raman system with an excitation wavelength of 633 nm (Renishaw, UK).Electrochemical measurements
All electrochemical measurements were carried out on CHI760E electrochemical workstation (Shanghai Chenhua Company, China) using standard three-electrode test methods at room temperature. The reference and auxiliary electrodes were KCl-saturated Ag/AgCl electrode and platinum wire, respectively. The as-prepared carbon nanotube composite was used directly as the working electrode, which is pinched by a glassy carbon electrode clamp.Oxygen reduction reaction (ORR) tests were performed in 0.1 mol L−1 KOH solution saturated with N2 or O2. The scanning rate of cyclic voltammetry (CV) was 20 mV s−1, and the scanning rate of linear scanning voltammetry (LSV) is 5 mV s−1. For comparison, the FMPN-700-acid catalyst (4 mg mL−1, in the 5% Nafion, alcohol and water solution) was measured on a rotating disk electrode (RDE) at 1600 rpm. Methanol crossover and durability were evaluated at a potential of −0.35 V (vs. Ag/AgCl) measured by chronoamperometry (i–t). For comparison, commercial 20% Pt/C was utilized as the benchmark by dripping its solution to the Ni foam. The measured potentials (vs. Ag/AgCl) were calibrated to a reversible hydrogen electrode (RHE):
| E (vs. RHE) = E (vs. Ag/AgCl) + 0.197 V + 0.059 pH. |
Electrochemical Impedance Spectrometry (EIS) was conducted at an AC amplitude of 5 mV in the frequency range of 0.01–1000 kHz.
Conflicts of interest
The authors declare no conflict of interest.Acknowledgements
The authors are grateful for National Natural Science Foundation of China (No. 21671117).Notes and references
- F. Xiao, Y. C. Wang, Z. P. Wu, G. Chen, F. Yang, S. Zhu, K. Siddharth, Z. Kong, A. Lu, J. C. Li, C. J. Zhong, Z. Y. Zhou and M. Shao, Adv. Mater., 2021, e2006292 CrossRef PubMed.
- M. K. Debe, Nature, 2012, 486, 43–51 CrossRef PubMed.
- J. Y. Tao, Y. J. Zhang, S. P. Wang, G. Wang, F. Hu, X. J. Yan, L. F. Hao, Z. J. Zuo and X. W. Yang, ACS Appl. Mater. Interfaces, 2019, 11, 18342–18348 CrossRef PubMed.
- H. Zhong, J. Wang, F. Meng and X. Zhang, Angew. Chem., Int. Ed., 2016, 55(34), 9937–9941 CrossRef PubMed.
- J. Gao, Z. H. Cheng, C. X. Shao, Y. Zhao, Z. P. Zhang and L. T. Qu, J. Mater. Chem. A, 2017, 5(24), 12027–12033 RSC.
- S. Chen, J. J. Duan, P. J. Bian, Y. H. Tang, R. K. Zheng and S. Z. Qiao, Adv. Energy Mater., 2015, 5(18), 1500936 CrossRef.
- L. Zhang, X. Qin, S. Zhao, A. Wang, J. Luo, Z. L. Wang, F. Kang, Z. Lin and B. Li, Adv. Mater., 2020, 32, e1908445 CrossRef.
- S. Chabi, C. Peng, Z. Yang, Y. Xia and Y. Zhu, RSC Adv., 2015, 5, 3999–4008 RSC.
- P. Wang and B. Wang, ChemSusChem, 2020, 13, 4795–4811 CrossRef.
- R. Singhal and V. Kalra, ChemPhysChem, 2017, 18, 223–229 CrossRef PubMed.
- D. X. Ji, S. J. Peng, J. Lu, L. L. Li, S. Y. Yang, G. R. Yang, X. H. Qin, M. Srinivasan and S. Ramakrishna, J. Mater. Chem. A, 2017, 5, 7507–7515 RSC.
- M. Jiang, C. Fu, R. Cheng, W. Zhang, T. Liu, R. Wang, J. Zhang and B. Sun, Adv. Sci., 2020, 7, 2000747 CrossRef.
- Y. Liu, B. Wang, Q. Sun, Q. Pan, N. Zhao, Z. Li, Y. Yang and X. Sun, ACS Appl. Mater. Interfaces, 2020, 12, 16512–16520 CrossRef CAS.
- Z. Zhang, J. Wang, X. Yan, S. Zhang, W. Yang, Z. Zhuang and W.-Q. Han, Energy Storage Mater., 2020, 29, 332–340 CrossRef.
- J. Guo, X. Du, X. Zhang, F. Zhang and J. Liu, Adv. Mater., 2017, 29, 1700273 CrossRef PubMed.
- D. T. Tran, V. H. Hoa, S. Prabhakaran, D. H. Kim, N. H. Kim and J. H. Lee, Appl. Catal., B, 2021, 294, 120263 CrossRef CAS.
- S. L. Zhang, X. F. Lu, Z. P. Wu, D. Y. Luan and X. D. Lou, Angew. Chem., Int. Ed. Engl., 2021, 60(35), 19068–19073 CrossRef CAS.
- B. Zheng, Y. Zhou, C. Yu, S. X. Liu, Z. R. Pan, X. F. Wang, G. X. Liu and L. M. Lang, J. Mater. Sci., 2020, 55, 15454–15466 CrossRef CAS.
- T. Zhang, J. Bian, Y. Zhu and C. Sun, Small, 2021, e2103737 CrossRef PubMed.
- J. Li, Y. Kang, W. Wei, X. Li, Z. Lei and P. Liu, Chem. Eng. J., 2021, 407, 127961 CrossRef CAS.
- X. Sun, P. Wei, S. Gu, J. Zhang, Z. Jiang, J. Wan, Z. Chen, L. Huang, Y. Xu, C. Fang, Q. Li, J. Han and Y. Huang, Small, 2020, 16, e1906057 CrossRef.
- T. Wang, R. Yang, N. Shi, J. Yang, H. Yan, J. Wang, Z. Ding, W. Huang, Q. Luo, Y. Lin, J. Gao and M. Han, Small, 2019, 15, e1902410 CrossRef PubMed.
- Y. Cheng, P. K. Shen and S. P. Jiang, Int. J. Hydrogen Energy, 2014, 39, 20662–20670 CrossRef CAS.
- R. Nandan, H. R. Devi, R. Kumar, A. K. Singh, C. Srivastava and K. K. Nanda, ACS Appl. Mater. Interfaces, 2020, 12, 36026–36039 CrossRef CAS.
- X. Wei, X. Luo, H. Wang, W. Gu, W. Cai, Y. Lin and C. Zhu, Appl. Catal., B, 2020, 263, 118347 CrossRef CAS.
- H. Jiang, J. Gu, X. Zheng, M. Liu, X. Qiu, L. Wang, W. Li, Z. Chen, X. Ji and J. Li, Energy Environ. Sci., 2019, 12, 322–333 RSC.
- Z. H. Sheng, L. Shao, J. J. Chen, W. J. Bao, F. B. Wang and X. H. Xia, ACS Nano, 2011, 5, 4350–4358 CrossRef CAS.
- M. Han, M. Shi, J. Wang, M. Zhang, C. Yan, J. Jiang, S. Guo, Z. Sun and Z. Guo, Carbon, 2019, 153, 575–584 CrossRef CAS.
- A. Meng, X. Yuan, T. Shen, J. Zhao, G. Song, Y. Lin and Z. Li, Nanoscale, 2020, 12, 4655–4666 RSC.
- B. Tan, Z.-F. Wu and Z.-L. Xie, Sci. Bull., 2017, 62, 1132–1141 CrossRef CAS.
- S. Dilpazir, H. He, Z. Li, M. Wang, P. Lu, R. Liu, Z. Xie, D. Gao and G. Zhang, ACS Appl. Energy Mater., 2018, 1, 3283–3291 CrossRef CAS.
- S. Wan, J. Wu, D. Wang, H. Liu, Z. Zhang, J. Ma and C. Wang, Chin. Chem. Lett., 2021, 32, 816–821 CrossRef CAS.
- B. Zheng, J. X. Wang, Z. R. Pan, X. F. Wang, S. X. Liu, S. Q. Ding and L. M. Lang, J. Porous Mater., 2020, 27, 637–646 CrossRef CAS.
Footnote |
| † Electronic supplementary information (ESI) available: Experimental section, HAADF-STEM, EDS, SEM, XRD, XPS, EIS of the synthetic materials. See DOI: 10.1039/d1ra07973e |
| This journal is © The Royal Society of Chemistry 2021 |

