 Open Access Article
Creative Commons Attribution 3.0 Unported Licence
A catalytic ozonation process using MgO/persulfate for degradation of cyanide in industrial wastewater: mechanistic interpretation, kinetics and by-products
Ali Behnamia,
Jean-Philippe Crouéb,
Ehsan Aghayanic and
Mojtaba Pourakbar *a
*a
aDepartment of Environmental Health Engineering, Maragheh University of Medical Sciences, Maragheh, Iran. E-mail: ppourakbar@yahoo.com; Tel: +98 4132726363
bInstitut de Chimie des Milieux et des Matériaux, IC2MP UMR 7285 CNRS, Université de Poitiers, France
cResearch Center for Environmental Contaminant, Abadan University of Medical Sciences, Abadan, Iran
First published on 19th November 2021
Abstract
Cyanide-laden wastewaters generated from mining and electroplating industries are extremely toxic and it is of vital importance to treat them prior to discharge to receiving water resources. The present study aims to oxidize cyanide using an ozonation process catalyzed by MgO and persulfate (PS). A MgO nanocatalyst was synthesized using the sol–gel method and characterized. The results show that the synthesized catalyst had a BET surface area of 198.3 m2 g−1 with a nanocrystalline particle size of 7.42 nm. In the present study, the effects of different operational parameters were investigated, and it was found that the MgO/O3/PS process is able to oxidize 100 mg L−1 of cyanide after 30 min under optimum operational conditions. Cyanide degradation mechanisms in the MgO/O3/PS process were completely investigated and the main radical species were identified using scavenging experiments. It was found that sulfate and hydroxyl radicals both contributed to the cyanide degradation in the MgO/O3/PS process. Cyanide degradation by-products were also tracked and it was found that cyanate and ammonium species are primarily generated during the oxidation, but increase of reaction time allowed their conversion to much less toxic compounds such as nitrate and bicarbonate. Cyanide degradation was also conducted in real industrial wastewater containing 173 mg L−1 of cyanide. Although there was a reduction in cyanide removal rate, the MgO/O3/PS process was able to completely oxidize cyanide within 70 min. Finally, it can be concluded that the ozonation process catalyzed by MgO and persulfate is an efficient and reliable advanced oxidation process for removal of cyanide from industrial wastewater.
1. Introduction
Cyanide is a toxic compound that has been widely found in wastewater generated from various industries such as pharmaceuticals, mining, metal plating, gold extraction and dye production. Due to extremely dangerous effects to humans and other living organisms, cyanide is classified as a priority pollutant by the U.S. Environmental Protection Agency.1,2 The maximum permissible cyanide concentration in wastewater effluent is recommended to be below 0.2 mg L−1 prior to discharge into natural water bodies.3 Hence, to comply with strict environmental legislations, industries are required to provide adequate treatment methods for removing cyanide from wastewater.In order to remove cyanide from the cyanide-laden wastewaters, several conventional physical, chemical, biological and adsorption processes have been investigated. Although the biological processes are efficient, cost-effective and widely used methods for industrial and municipal wastewater treatment,4 the toxicity of cyanide is a potent inhibitor for microbial growth and activity,5 which results in low biodegradation rate of cyanide. Physical treatment technologies such as membrane separation and ion exchange are very expensive, and they only transfer cyanide from one phase to another. Cyanide adsorption onto pistachio hull wastes,4 synthetic zeolite,6 and coke breeze7 were investigated previously and showed acceptable removal efficiency. However, adsorption processes can be expensive due to adsorbent, regeneration and waste management costs. Chemical methods such as alkaline chlorination are widely used for treatment of cyanide-containing wastewater, but they are often expensive, generate sludge and hazardous by-products.8,9
In recent years, many studies have been focusing on removing cyanide and its related degradation by-products from industrial wastewaters using Advanced Oxidation Processes (AOPs). Considering the toxicity of cyanide and its derivatives to microbial communities, AOPs can be suitable processes for treating these bio-refractory pollutants. AOPs utilize O3, persulfate (PS) and H2O2 enhanced with catalysts, UV light and electrochemical methods to generate highly potent hydroxyl radicals.10 Hydroxyl and sulfate radicals (HO˙ and SO4˙−) have almost similar redox potential (HO˙: E0 = 2.74 V and SO4˙−: E0 = 2.5–3.1 V) leading fragmentation of pollutants and mineralization to CO2 and H2O. However, in comparison to HO˙, SO4˙− has some advantages including broad operational pH range (2–8) and longer half-life (30–40 μs) which provides better contact chance with contaminants. SO4˙− can be generated through the activation of PS via various methods including heat, catalyst, electrochemical, UV, etc. SO4˙− can efficiently degrade target pollutants present in aqueous solutions.11,12
So far, various AOPs are employed to remove cyanide from wastewater including ozone oxidation,13,14 photocatalytic processes,9,13,15 Fenton oxidation,16,17 and catalytic ozonation18 etc. Among them, Catalytic Ozonation Process (COP) has been considered as an attractive and promising ozone-based AOP. In COP, the presence of metal oxides such as Fe, Mn, Mg, Ni, Ce and Co accelerate the decomposition of ozone and enhance the production of hydroxyl radicals, thereby increasing the degradation rate of refractory and also ozone-recalcitrant compounds.19 A variety of metal base catalysts such as ZnO,20 (MnO2–Co3O4)/AC,21 Fe2O3,22 MgO,23 etc., have been investigated for their efficiency to activate O3 for refractory pollutants degradation.
Among the aforementioned materials, MgO has received significant attention in conventional wastewater treatment due to its non-toxic and adsorption properties, because it is environmentally friendly, economical, and showed high stability in water.24,25 Based on literature review, to date, MgO has been reported as a capable catalyst to efficiently catalyze O3 to degrade a variety of compounds including antibiotics and drugs,23,26 organic compounds27,28 and dye29,30 in water environment.
To our knowledge, no study has been conducted to investigate the oxidation of cyanide in the ozonation process catalyzed by MgO in the presence of persulfate for simultaneous generation of sulfate and hydroxyl radicals. Therefore, this study aims to analyze the effect of the main operational variables, including catalyst concentration, cyanide concentration, and reaction time, on the removal of free cyanide synthetic wastewater and then real chromium electroplating wastewater. Degradation by-products are thoroughly tracked in the process and various mechanisms are proved in the MgO/O3/PS for free cyanide removal.
2. Materials and methods
2.1. Reagents and materials
Cyanide solutions were prepared from NaCN salt. The pH of the all solutions containing NaCN salt was adjusted to 11 by NaOH solution. The real wastewater used in this study was taken from a chromium electroplating plant. Chemicals used in the experiments were of the analytical grade and purchased from Merck Co. All chemicals were used without further purification.2.2. Preparation of catalyst
In this study, MgO was prepared by sol–gel method. Magnesium acetate tetra-hydrate (Mg (C2H3O2)2·4H2O) was used as magnesium source. First, 50 g of Mg(C2H3O2)2·4H2O were dissolved in 500 mL of distilled water and gently stirred for 30 min. NaOH 1 N was used as alkaline agent to increase pH and form the gel. The solution was then stirred for 4 hours to form magnesium hydroxide (Mg(OH)2) precipitates. In order to separate Mg(OH)2 deposits, the suspension was stirred at 3000 rpm for 5 min. The separated deposits were washed three times using a mixture of ethanol and distilled water (50/50 vol% ratio) for removal of residual impurities from the prepared gel, and dried at 60 °C for 24 hours. Finally, the dried powder was collected and calcinated in an oven at 500 °C for 2 hours to form MgO nanoparticles.232.3. Characterization techniques
The characteristics of the synthesized catalyst such as the surface morphology of the catalyst were investigated using Scanning Electron Microscopy (SEM) coupled with energy dispersive X-ray spectroscopy (EDX). The specific surface area and the pore size of the catalyst were determined by the Brunauer–Emmett–Teller (BET) technique by the N2 adsorption/desorption method. X-ray diffraction (XRD) technique was used to analyze the crystalline phase of the MgO using Cu Kα radiation, scanned for 2θ of 10°–90°. The structural composition of the catalyst was examined by X-ray fluorescence (XRF). Fourier Transmission Infrared Spectroscopy (FTIR) was also used to determine the functional groups on the surface of the catalyst. Point of zero charge pH (pHpzc) was also measured for the synthesized MgO using the pH-drift method. In this characterization experiment, 100 mL of 0.1 M NaCl solution was used at ambient temperature. The pH of the solution was adjusted between 2–13 using NaOH or HCl solutions. Then, 100 mg of the MgO was added and stirred for 24 h. The final pH (pHfinal) of the solution was plotted in front of initial values of pH (pHinitial). Finally the point at which final and initial pH were the same was selected as pHzpc.312.4. Experimental procedure
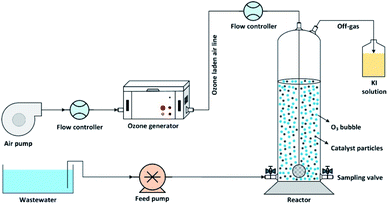
The catalytic ozonation of wastewater using MgO as a catalyst was performed in batch mode in a lab-scale cylindrical reactor as shown in Fig. 1. Ozone gas was produced using an ozone generator (ARDA model) and uniformly bubbled into the solution using glass diffuser at the bottom of the reactor. The inlet ozone concentration was controlled by adjusting the airflow rate passing through the ozone generator. The residual ozone in the off-gas stream was trapped into a potassium iodide (KI) solution.This study can be divided into two main parts: firstly, the effect of the MgO/O3 process in cyanide removal, secondly, investigating the benefit of adding PS to the MgO/O3 process (MgO/O3/PS process). To evaluate the performance of aforementioned processes, adsorption rate of cyanide onto the MgO catalyst, the effect of the Sole Ozonation Process (SOP), Catalytic Ozonation Process (COP), and persulfate (PS) alone were also studied. Accordingly, the effect of operational variables such as ozone dosage, MgO concentration, cyanide and anions (including carbonate, bicarbonate, nitrate, sulfate, phosphate and chloride) concentrations, and the effect of contact time in MgO/O3 and MgO/O3/PS processes were examined to determine the optimum operational conditions. To determine radical based degradation of cyanide, the effect of radical quenchers such as tert-butanol (TBA), and ethanol (EtOH) was examined. Radical scavengers were used at the concentration of 5 g L−1. A comprehensive investigation was also carried out with different combination of oxidizing agents to identify the possible degradation mechanisms of the degradation of cyanide. All the experiment were conducted in a solution pH of 11, since the dissolved cyanide is converted into gaseous HCN and released in the lower pH values.
To predict the cyanide degradation mechanism, the influence of possible by-products such as cyanate (OCN−), ammonium (NH4+), nitrite (NO2−), nitrate (NO3−), and alkalinity were measured under the optimum experimental conditions. In addition, residual persulfate concentration and sulfate in the effluent were measured.
Finally, in order to evaluate the practicality of the processes in actual application, the performance of MgO/O3/PS process for cyanide removal was investigated in different water matrices in the presence of water anions (nitrate, chloride, sulfate, phosphate, carbonate), tap water, and the real chromium electroplating wastewater. Table 1 shows the composition of studied wastewater. To ensure the accuracy and reliability of the results, two replicates of each experiment were conducted and the average values of the measurements have been presented.
| Parameter | COD (mg L−1) | pH | CN (mg L−1) | Cr (mg L−1) | TSS (mg L−1) |
|---|---|---|---|---|---|
| Value | 976 | 10.8 | 173 | 63 | 101 |
2.5. Analytical methods
Due to the interference of cyanide with impurities in the samples such as persulfate and yellowish colour of the chromium electroplating wastewater, cyanide was extracted from the solution in accordance with the standard methods for the examination of water and wastewater. In this method, acetic acid was added to the solution and the pH was reduced to 3. This resulted in formation of gaseous HCN. The generated HCN was then diffused into the NaOH normal solution. Finally, the cyanide content in the solution was measured by titrimetric method using a standard solution of silver nitrate in the presence of p-dimethylaminobenzalrhodanine indicator.32In order to determine the fate of cyanide in the MgO/O3/PS process, the concentration of cyanate, nitrite, nitrate, ammonium, bicarbonate, and sulfate were analyzed following the Standard Methods.32 Iodometric method was used to quantify the residual persulfate in the effluent.33
The ozone concentration in the inlet and the process off-gas was measured by sparging the gas stream into a potassium iodide solution followed by iodometric titration.32
3. Results and discussion
3.1. Catalyst characterization
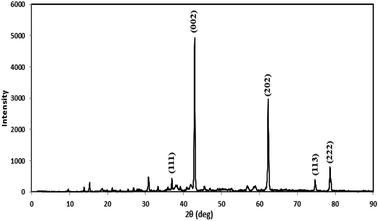
Prior to conducting the oxidation experiments, the synthesized MgO was fully characterized. Fig. 2 is illustrating the XRD pattern of the prepared MgO. As it is shown in the figure there are sharp distinguished peaks at 2θ of 36.97°, 43.03°, 62.29°, 74.67°, and 78.61° corresponding to the (111), (002), (202), (113), and (222) planes, respectively (JSPDS no. 87-0653). The XRD patterns of the MgO showed a well crystallized material owing to the high intensity, narrow width and sharpness of diffraction peaks. The mean crystallite size of the catalyst was also calculated using the Debye–Scherrer's formula.34
 | (1) |
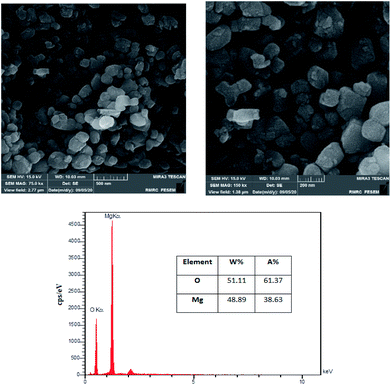
The surface morphology of the MgO was investigated using FESEM images. Fig. 3 is illustrating the MgO catalyst structure at different magnifications (75k× and 150k×). The formation of nanoparticles are clearly observed in the high resolution SEM images. The nanoparticles are in spherical shapes, uniformly distributed and highly porous with agglomeration.37 In order to investigate the elemental characterization of the MgO particles, the EDX technique was used. The results of EDS analysis are also illustrated in Fig. 3. As it is shown in the figure, there is no impurity in the synthesized MgO. EDS results showed that the weight percentages of magnesium and oxygen were 48.89% and 51.11%, respectively.
XRF technique was used for the identification of the chemical composition of the MgO catalyst (Table 2). Based on the results, MgO was the main compound (70.8%) found in the catalyst which is in accordance with the results of XRD and EDS. Based on the experimental data, almost 28% of the catalyst has burned and missed in the XRF technique which is reported as LOI (Loss of Ignition).
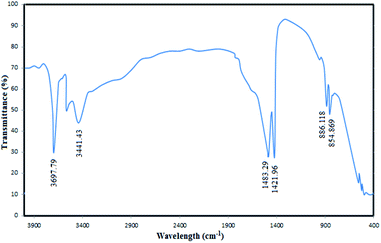
To confirm the successful synthesis and analyse the chemical structure of the MgO nanoparticles, FTIR spectrum of the catalyst was recorded (Fig. 4). The absorbance values were carefully investigated in the FTIR spectra to understand the surface properties of the synthesized MgO. As shown in the figure, the bands observed at 854 cm−1 and 886 cm−1 correspond to the vibration of Mg–O bands which have also been reported in similar MgO spectra in the literature.38 The distinct bands observed at 1421 cm−1 and 1483 cm−1 are associated to the vibration of surface hydroxyl groups.35 The observed broad bands at 3441 cm−1 and 3697 cm−1 are due to the OH stretching vibration of water molecules.39
It is of great importance to evaluate the point of zero charge pH of the catalyst. The pH-drift procedure was selected to find pHpzc. The pHpzc was measured to be 12.4 for the synthesized MgO (data not shown). This value is close to the values reported in literature. E.g. Chen et al.28 measured the pHpzc of various MgO nanoparticles synthesized with different methods. The pHpzc values were all reported to be 12.1–12.7. Mashayekh-Salehi et al.23 also reported pHpzc of 10.9 for the synthesized MgO.
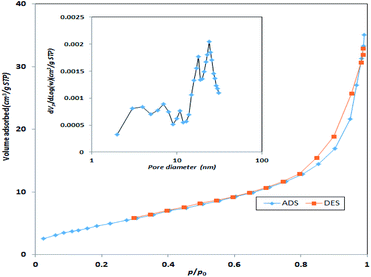
Specific surface area and average pore size of the synthesized catalyst were also measured using BET surface area. Based on Fig. 5, the specific surface area of the synthesized MgO was 198.3 m2 g−1 with an average pore size of 7.42 nm. Therefore, the synthesized MgO could be considered as a mesoporous material (IUPAC classification). The higher surface area of the catalyst could be a determining factor for the enhancement of catalytic activity. The specific surface area and average pore size of the current MgO is close to the values reported in other studies.23
3.2. Contribution of different oxidation processes for cyanide removal
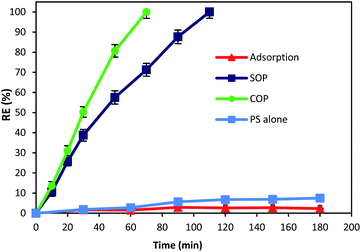
The catalytic activity of MgO was tested for the oxidation of cyanide. In this regard, preliminary experiments were carried out to describe the contribution of different processes (adsorption, SOP, COP and PS) in cyanide removal using reaction time as an operational variable. Fig. 6 displays the contribution of different processes in cyanide removal. As can be seen in the figure, adsorption has low contribution in cyanide removal (less than 3%), indicating that the effect of adsorption on the COP can be neglected. In previous studies, MgO has been reported as a cost-effective and potential adsorbent for the removal of drugs,40 heavy metals,41,42 and various anions.43,44 However, Fig. 6 revealed that the MgO catalyst is not an effective adsorbent for cyanide. Based on the results, the adsorption rate of cyanide first slightly increased (2.9%, at min 90), then decreased to 2.3% (at min 180). There is no similar study using the MgO catalyst for cyanide adsorption. However, there are some other studies using MgO for other contaminants adsorption. For instance, Chen et al.28 reported that only less than 3% of 4-chlorophenol was adsorbed onto four different MgO catalysts that they investigated. Mashayekh-Salehi et al.23 also revealed that adsorption rate of acetaminophen onto MgO nanoparticles was around 1% at the contact time of 15 min. The reduction in adsorption rate can be attributed to the limited available space for cyanide adsorption on MgO and therefore, the exterior surface of MgO particles are saturated with cyanide molecules in the solution. However, adsorption of cyanide onto MgO is not major factor for effective COP performance.As shown in Fig. 6, after 180 min of reaction, the cyanide removal rate reached 7.5% for PS alone. Although PS has high redox potential of 2.01 V,45 PS alone had no significant effect on cyanide removal at pH 11. The possible reason can be the absence of PS activating agent which causes PS to remain nearly intact in the solution and does not actively participate in cyanide removal. This is in accordance with similar studies using PS alone for cyanide containing compounds degradation. Castilla-Acevedo et al.46 exposed 1 g L−1 of PS at pH 11 to cyanide containing wastewater and only a negligible degradation has occurred. Therefore, it can be concluded that activation of PS in alkaline solution is not contributing for PS activation and cyanide degradation.
Based on the results, it can be seen that ozonation alone could degrade cyanide completely after 110 min of reaction. Presence of ozone in the cyanide-laden solution could lead to the degradation of cyanide through two main reaction pathways. Firstly, ozone could directly react with cyanide molecules and produce cyanate, nitrogenous compounds and bicarbonate as given in eqn (2) and (3):14
| 3CN− + O3(aq) → 3OCN− | (2) |
| 2OCN− + O3(aq) + H2O → 2HCO3− + N2 | (3) |
Secondly, under alkaline conditions (alkaline ozonation) ozone can mainly decompose to HO˙, which react with the target compound. It has also been reported that under basic condition, HO˙ is the main oxidizing agent in the solution.47 Therefore, second reaction pathway through generated radicals is the main degradation process in SOP. Although SOP can completely destruct cyanide (Fig. 6), it needs longer reaction time and consequently higher energy consumption, since more electric power is required at higher reaction times.
3.3. Catalytic activity of MgO in COP
As seen in Fig. 6, combination of catalyst and the ozonation process significantly improved the cyanide degradation rate. COP reached 100% cyanide removal rate in the lower reaction time (70 min). This is due to the synergetic effect of ozone and MgO, and formation of highly active radicals. To understand the synergistic effect of catalyst addition to the ozonation process for effective degradation of cyanide, the following equation was used:| Synergy (%) = % removed in COP − [% removed in SOP + % removed by adsorption] | (4) |
According to the results, the highest synergy of 26.74% was calculated for MgO catalyst on the degradation of cyanide in combination with the ozonation process at a reaction time of 70 min. The synergistic effect of a combined method of ozonation and MgO catalyst increased from 3.88% to 26.74% with the increase of reaction time from 20 min to 70 min. Considering that the highest adsorption rate of cyanide onto MgO nanoparticles was negligible (2.9%, at min 90), therefore it can be deduced that the cyanide was mainly removed through degradation. The findings indicate the high potential of MgO catalyst to catalyze the ozonation process, thereby improving the cyanide degradation rate in COP.
In COP, besides the direct reaction of cyanide with ozone (eqn (2) and (3)) molecules, the enhanced removal rate of cyanide can be described to the adsorption of ozone molecules on the surface of MgO nanoparticles and subsequently decomposition into active radicals.29 As mentioned before, ozone molecules are unstable at pH 11, and also they can initiate reactions directly with cyanide molecules. However, since there are higher concentrations of injected ozone in the inflow gas stream, the MgO activation is also favored in the COP. The following equation describe the direct oxidation of cyanide with ozone on MgO surface:
| MgO–O3 + CN → CO2 + H2O + intermediates | (5) |
The presence of basic functional groups (hydroxyl groups or isolated oxygen) on the surface of nanosized MgO play an essential role in transformation of ozone molecules to active hydroxyl radicals.
On the other hand, pHpzc of the MgO was found to be 12.4, and pH of the cyanide-laden solution are below 11. Therefore, the catalyst surface will be positively charged (Mg–OH2+) in the cyanide solution. The positive surface of the catalyst will attract the OH− and will form a basic microenvironment around the MgO catalyst in the cyanide-laden solution. Presence of high amounts of OH− around the catalyst will eventually lead to the formation of more HO˙ due to the ozonation of the solution, since OH− acts as an initiator of radical formation.28
3.4. Persulfate activation in MgO/O3 process
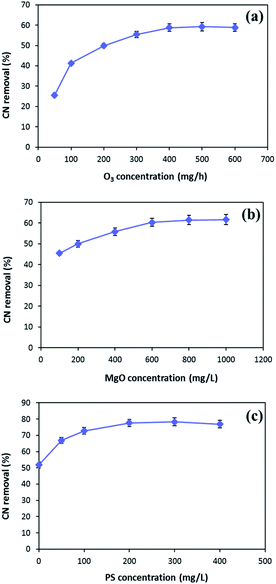
In order to enhance the MgO/O3 process, precursor of sulfate radical is added to the COP, and a thorough investigation of the effective parameters on the process performance was conducted. Optimization of the developed processes was conducted using synthetic wastewater to determine the optimum operating condition for effective cyanide removal (100 mg L−1). To find out the optimum injected ozone dosage, different concentrations of ozone were used in the MgO/O3 process. The effect of ozone dosage on the removal of cyanide is shown in Fig. 7a. As can be seen in the figure, the cyanide concentration steeply decreased by increasing injected ozone concentration up to 400 mg h−1, beyond which no significant change in degradation rate was observed. Therefore, the optimum injected ozone dosage was found around 400 mg h−1. This might be ascribed to the fact that further increase in the injected ozone concentration can result in the reaction of ozone with HO˙ and causing the self-scavenge effect. Furthermore, higher concentrations of ozone could not completely dissolve in the solution and the excess ozone will be released in the off-gas form.48,49The catalytic activity of MgO in the solution was evaluated for cyanide oxidation in the MgO/O3 process. To optimize the concentration of catalyst, various amounts of MgO ranging from 100–1000 mg L−1 were used. Fig. 7b depicts the effect of the MgO catalyst on cyanide removal in the MgO/O3 process under condition of 400 mg h−1 injected ozone concentration and 30 min of reaction time. Based on the figure, the optimum MgO dosage in the MgO/O3 process for efficient removal of cyanide under our experimental conditions was obtained around 600 mg L−1. The increased degradation of cyanide in the MgO/O3 process can be attributed to the larger surface areas, more active sites, and formation of highly oxidizing radicals.29,50 However, further increasing in the MgO concentration (up to 600 mg L−1) did not considerably increase the cyanide removal rate. Beside the self-decomposition of hydroxyl radicals, this could be explained by the agglomeration of catalyst particles which reduces the number of active sites for production of hydroxyl radicals.29
In the second phase of study, persulfate, as a sulfate radical precursor, was added to the reaction. Optimization of PS concentration is an important factor since PS is the source of SO4˙− in the solution. According to Fig. 7c, the highest cyanide removal efficiency (77.7%) was achieved when PS concentration was adjusted around 200 mg L−1. By increasing PS concentration from 200 to 400 mg L−1, no significant increase in cyanide removal efficiency was observed. This can be due to the fact that increasing PS concentration causes scavenging effect between generated radicals.15 Hence, the optimum PS concentration for efficient cyanide removal was 200 mg L−1.
Taking into account all the aforementioned results, the optimal reaction conditions were determined as follows: injected ozone concentration of 400 mg h−1, MgO concentration of 600 mg L−1, and PS concentration of 200 mg L−1.
3.5. The effect of reaction time and cyanide concentration
The initial concentration of pollutants and reaction time are crucial factors that have a great influence on the design and operation performance of an oxidation process. Hence, in this study, the time dependent behavior of cyanide degradation by varying the reaction time in the range of 0–60 min with different initial cyanide concentration (50, 100, and 200 mg L−1) was investigated. Fig. 8 illustrates the cyanide removal versus the contact time under the optimum condition of MgO = 600 mg L−1, O3 = 400 mg h−1, and PS = 200 mg L−1 by the MgO/O3/PS process. Results showed that the cyanide removal rate in the MgO/O3/PS process decreased by increasing the initial cyanide concentration from 50 to 200 mg L−1. The complete degradation was achieved at 25 min contact time for a cyanide concentration of 50 mg L−1, but with increasing initial cyanide concentration from 50 to 200 mg L−1, it proceeded at a slower rate. Therefore, more contact time is required for degradation of high concentrations of input cyanide. The high removal rate in low cyanide concentration (50 mg L−1) is attributed to the presence of sufficient amount of reactive radicals in the solution. Moreover, increasing in initial cyanide concentration with constant initial concentrations of ozone, MgO and PS led to an increase of cyanide concentration to oxidizing agent's ratio, thereby reducing the removal efficiency.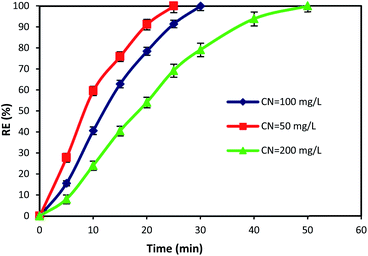 | ||
| Fig. 8 Effects of contact time and initial cyanide concentration on the removal of cyanide by MgO/O3/PS process. | ||
3.6. Degradation kinetics and cyanide removal mechanism
In the sulfate radical based AOPs, SO4˙− and HO˙ are simultaneously generated in the oxidation reaction. To identify the main mechanisms participated in the target pollutant degradation, it is important to find the principle reactive radical since it has direct implication of the process performance, degradation pathway, and degradation by-products. One of the commonly used methods for identification of the main oxidizing radicals is indirect competitive kinetic method using scavenging agents. Usually TBA and EtOH are used to identify the main oxidizing radicals in the sulfate based AOPs. It has been demonstrated that EtOH can react with both HO˙ (KEtOH·HO˙ = (1.2–2.8) × 109 M−1 s−1) and SO4˙− (KEtOH·SO4 = 1.6 × 10⁷ M−1 s−1). On the other hand, TBA is a reliable HO˙ radical quencher.51 The reaction rate constant of TBA and HO˙ is (3.8–7.6) × 108 M−1 s−1 which is 1000 times more than that of SO4˙− (KTBA·SO4 = (4–9.1) × 105 M−1 s−1). Therefore, TBA and EtOH are used as radical capturing agents to identify the relative contribution of the SO4˙− and HO˙.In addition, to better elucidate the potential of catalyst for catalyzing the cyanide degradation in the ozonation process, the rate constant of the cyanide oxidation was determined following a pseudo-first order (PFO) kinetic model as follows:9
 | (6) |
Cyanide degradation in the MgO/O3/PS process could be occurred through various degradation mechanisms. To better understand and prove the degradation pathways, various combinations of oxidizing agents were investigated for cyanide degradation. Following are the investigated degradation mechanisms:
- Adsorption on MgO catalyst.
- Oxidation by persulfate alone.
- Single Ozonation Process (SOP).
- MgO/O3.
- PS/O3.
- MgO/PS.
- MgO/O3/PS.
As it was illustrated in Fig. 6, the performance of adsorption and persulfate alone are negligible in cyanide removal efficiency, and therefore, they are not further investigated in the oxidation mechanism. However, the other remaining proposed mechanisms are thoroughly investigated to find the main oxidizing agents in the investigated processes. Fig. 9 is illustrating the performance of the above-mentioned pathways.
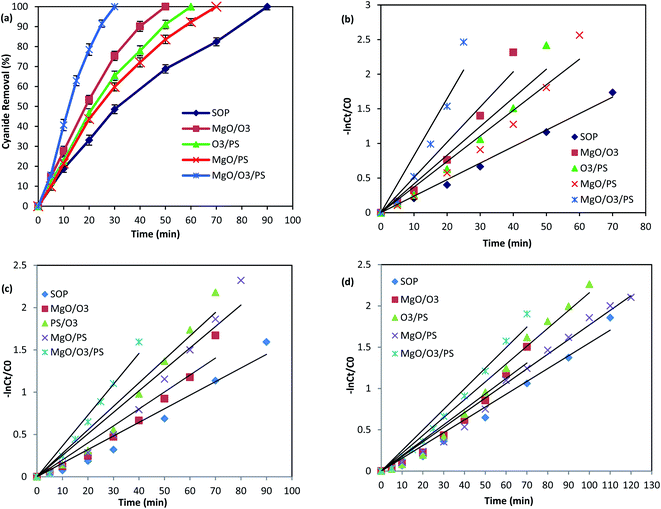 | ||
| Fig. 9 Cyanide removal efficiency by different AOPs without any scavenger (a), PFO kinetics without any scavenger (b) PFO kinetics in the presence of TBA (c) PFO kinetics in the presence of EtOH (d). | ||
| Process | Without scavenger | TBA as scavenger | EtOH as scavenger | Contribution of HO˙ | Contribution of SO4˙− | |||
|---|---|---|---|---|---|---|---|---|
| Kobs | R2 | Kobs | R2 | Kobs | R2 | |||
| SOP | 0.024 | 0.99 | 0.016 | 0.96 | 0.015 | 0.97 | — | — |
| MgO/O3 | 0.056 | 0.97 | 0.020 | 0.95 | 0.018 | 0.95 | — | — |
| PS/O3 | 0.045 | 0.96 | 0.027 | 0.95 | 0.021 | 0.97 | 42.56 | 57.44 |
| MgO/PS | 0.040 | 0.97 | 0.025 | 0.95 | 0.017 | 0.98 | 37.5 | 62.5 |
| MgO/PS/O3 | 0.096 | 0.94 | 0.036 | 0.96 | 0.024 | 0.97 | 62.5 | 37.5 |
In order to find the relative contribution of the SO4˙− and HO˙, TBA and EtOH as radical quenchers were used. When excessive amount of TBA was added to the reaction, majority of the HO˙ were captured, and only small amount of SO4˙− could react with cyanide molecules. In the second quenching experiment, excessive amount of EtOH was introduced into the process, based on the high reaction rate of EtOH with SO4˙− and HO˙, both of them are simultaneously captured in the PS/O3 process. This is well-proved based on the reduction in the Kobs values in the presence of TBA and EtOH (Table 3).
The relative contribution of SO4˙− and HO˙ in the sulfate based AOPs could be calculated by comparing the differences in the rate constants of pollutant removal with and without HO˙ scavenger. Accordingly, the contribution of SO4˙− and HO˙ are calculated using eqn (7) and (8).57,58
 | (7) |
| HO˙ contribution (%) = 100 − SO4˙− contribution (%) | (8) |
Based on the reaction rate constants, it is found that almost 57.44% of the cyanide oxidation is due to the generation of SO4˙− and 42.56% is due to the HO˙. Thus, it can be concluded that both SO4˙− and HO˙ are the main oxidizing species in the PS/O3 process. Qiao et al.55 investigated the activation of persulfate by ozone molecules for degradation of cyanide. Based on the reaction rate constants it is found that almost 57.44% of the cyanide oxidation is due to the generation of SO4˙− and 42.56% is due to the HO˙. Thus, it can be concluded that both SO4˙− and HO˙ are the main oxidizing species in the PS/O3 process. Qiao et al.55 investigated the activation of persulfate by ozone molecules for degradation of nitrobenzene. They also used the same radical scavengers and proved the simultaneous generation of SO4˙− and HO˙ in PS/O3 process.
| SO4˙− + OH− → SO42− + HO˙ | (9) |
Therefore, formation of both radicals are expected to occur in the solution. Table 3 is illustrating the scavenging tests results in MgO/PS process. Based on the Kobs values, the contribution of SO4˙− is calculated to be 62.5% and contribution of hydroxyl radical is 37.5% in cyanide oxidation by MgO/PS process.
Comparison of the Kobs of the process in the presence of EtOH shows much more reduction than that of TBA. Therefore, formation of both SO4˙− and HO˙ are proved. Table 3 is also showing that SO4˙− contribution for cyanide oxidation is 37.5% and HO˙ is 62.5% in the MgO/O3/PS process. Accordingly, it can be concluded that MgO/O3/PS is a promising process for cyanide degradation.
The amount of consumed ozone was also investigated in MgO/O3/PS process, and about 25.5% ozone was measured to be used in this process which is the highest amount of consumed ozone in the present study. The higher consumption of ozone in the MgO/O3/PS process is due to the presence of various ozone quenchers including the alkaline cyanide solution, MgO catalyst, and persulfate.
No report was found in the literature of a catalytic ozonation of cyanide using MgO to compare the results. As well as, the combination method of MgO/O3/PS has not yet been tested on degradation of cyanide. However, there are some other advanced oxidation processes which have been reported in literature for cyanide oxidation, and the results of present study is comparable with them. Guo et al.60 investigated photoelectrocatalytic degradation of cyanide in the presence of PS. TiO2 nanorods and CuFe2O4 modified graphite felt were used as anode and cathode, respectively. They have reported that 0.9 mM of cyanide was almost completely degraded after 120 min of reaction time. The Kobs value under the optimum condition of the process was calculated to be 0.0314 min−1. Budaev et al.61 investigated the performance sulfate based AOPs for thiocyanate degradation. They have investigated various oxidation process such as PS + T (50 °C), PS/Fe2+ and PS/Fe3+ for oxidation of 1.72 mM thiocyanate. The results show that heating the solution to 50 °C and addition PS alone was not effective for thiocyanate degradation and only 7% removal efficiency has been reached. While PS/Fe2+ and PS/Fe3+ were able to completely destruct thiocyanate with reaction rate constants of 0.058 and 0.096 min−1, respectively. Finally, it can be deduced that MgO/O3/PS process, in comparison with other proposed techniques, is an effective technique for simultaneous generation of sulfate and hydroxyl radical to degrade cyanide.
3.7. The effect of different water matrices and real wastewater treatment
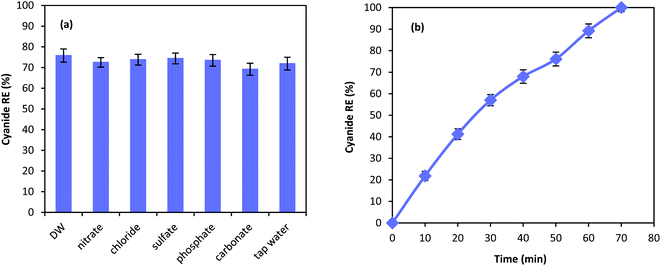
Chemical degradation of contaminants are highly affected by various compounds present in the solution.62 Therefore, the effect of different anions on the performance of MgO/O3/PS process was investigated. 100 mg L−1 of nitrate, chloride, sulfate, phosphate, and carbonate along with tap water were used in the MgO/O3/PS process. Fig. 11a is illustrating the effect anions on the process performance. As shown in the figure, inorganic compounds are not capable of deteriorating the process performance and only a slight reduction has been observed in cyanide removal. Furthermore, cyanide oxidation in tap water compared to that of distilled water is not effected by the water ingredients, proving the fact that MgO/O3/PS process can be reliable in different water matrices. Even though anions are not considered as limitation for this process, cyanide removal efficiency has slightly been reduced in presence of carbonate. Anions such as carbonate is dependent to the Lewis acids and they can occupy the active sites of the catalysts surface. Therefore, reduction in ozone decomposition on the catalyst surface takes place.63 However, the reduction in the presence of inorganic anions is negligible. Accordingly, it can be inferred that generated radicals are released into the bulk solution to react with the cyanide molecules, and the oxidation reaction mainly occur in the bulk solution rather than catalyst surface.Fig. 11b is showing the performance of the MgO/O3/PS in the real industrial wastewater. Cyanide oxidation in the real wastewater is considerably affected by the real wastewater matrix, and a substantial reduction in cyanide removal efficiency has been observed. However, complete cyanide oxidation is also reached in the complicated matrix of industrial wastewater, after reaction time of 70 min. The reduction in the process performance is due to the presence of other organic radical quenchers in the wastewater that lead to the reduction in removal efficiency of our target pollutant.
3.8. Cyanide degradation by-products
In order to see the fate of cyanide molecules in the investigated process, the possible cyanide degradation by-products were measured. Degradation by-products were measured at two different times of 30 min (complete cyanide degradation was reached) and 60 min to see the degradation of carbon and nitrogen-based compounds. Based on previous studies cyanide degradation may lead to the generation of cyanate, nitrate, nitrite, ammonium, nitrogen gas and carbon dioxide. In addition, to cyanide degradation by products, sulfate and residual persulfate were also measured in the process effluent. Table 4 is giving the measured by-products of cyanide degradation at 30 and 60 min of reaction time. As it is shown, after 30 min, complete degradation of cyanide has been reached, and formation of degradation by-products are observed. Cyanate and ammonium are the main primarily generated by-products. Accordingly, two distinct degradation pathways are proposed for cyanide degradation (eqn (10)–(12)): (1) degradation of cyanide through cyanate oxidation, (2) degradation of cyanide through ammonium oxidation.| CN− + oxidizing agents → OCN− + NH4+ | (10) |
| OCN− + oxidizing agents → HCO3−/CO32− + CO2 | (11) |
| NH4+ + oxidizing agents → NO2− + NO3− + N2 | (12) |
| Chemical compound | T = 0 min | T = 10 min | T = 20 min |
|---|---|---|---|
| CN | 100 | 0 | 0 |
| OCN− | 0 | 61.3 | 0 |
| NH4+ | 0 | 15.4 | 0 |
| NO3− | 0 | 16.1 | 18.7 |
| NO2− | 0 | 19.3 | 1.3 |
| HCO3−/CO32− | 0 | 443 | 510 |
| S2O82− | 200 | 43.8 | 15.2 |
| SO42− | 0 | 150.9 | 180.4 |
As it is shown in the table, cyanate is formed after 30 min, while it is completely oxidized after 60 min, and carbonate concentration has increased in the process. Therefore, carbon content of cyanide primarily transfers to cyanate and further exposure of the solution with oxidizing agents transfers the carbon to carbonate. Based on previous studies, cyanide oxidation may also lead to the generation of carbon dioxide.64
In the second degradation pathway, ammonium concentration has increased after cyanide degradation. Further increase of the reaction time leads to formation of other nitrogenous compounds such as nitrite and nitrate, and complete elimination of ammonium is reached. On the other hand, nitrite was primarily produced which has changed to nitrate. Finally, nitrate was the dominant nitrogenous compound in the solution and only a negligible amount of nitrite is remaining in the solution. Comparing the results of cyanide oxidation with similar studies shows a similar trend in carbonaceous and nitrogenous compounds of the effluent.9,15,64–66 Kim et al.64 investigated cyanide degradation in UV/TiO2 process and tracked the final by-products. They also reported generation of cyanate as the intermediate product and nitrate, nitrite and carbonate were the final generated by-products. They also measured carbon dioxide and nitrogen gas in the off-gas of the process which are generated as a result of cyanide oxidation. Moussavi et al.15 also proved cyanate and ammonium generation as a result of cyanide oxidation, but finally, they all were converted to carbonate and nitrate in the effluent. There is only one controversy in the literature in various types of oxidation process which is in case of ammonium generation. Yeddou et al.66 reported the formation of ammonium ions as the intermediate products which is stated to be due to the presence of redundant amount of H2O2 as an auxiliary oxidant in the solution. On the other hand, Kim et al.64 only have detected nitrite, nitrate and nitrogen gas as the by-products of cyanide oxidation. However, in our study, ammonium was detected as the intermediate product.
Persulfate was the chemical additive in the present study to accelerate process performance. The fate of persulfate was also tracked in the present study. It was found that persulfate is consumed in this process and finally it converts to sulfate ion in the effluent. Accordingly, it can be deduced that MgO/O3/PS process is a reliable method for conversion of toxic cyanide to much less noxious compounds.
3.9. Catalyst reusability
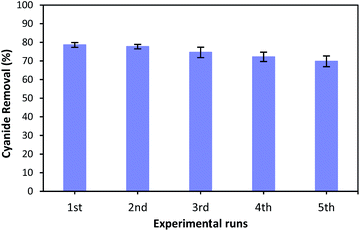
As the reusability of the catalyst is very important factor from the practical, environmental and economic viewpoint,23,67 the catalytic reusability of MgO was studied in a consecutive reusability test. To recover the MgO catalyst, the solution containing catalyst was centrifuged at 5000 rpm for 10 minutes after each use. The removed catalyst was washed several times with distilled water, dried at 105 °C for 24 hours, and reused for the next reaction. Fig. 12 illustrates the cyanide removal efficiency when using the recycled and regenerated MgO catalyst in five batch runs. It can be seen that the cyanide removal potential was 78.6% when regenerated catalyst was used for the first time. The removal rate decreased slightly after each cycle. However, the cyanide removal capacity was still 69.8% after 5 cycles indicating that MgO shows a relatively stable catalytic performance for the COP experiment. A little decrease in removal capacity can be ascribed to the occupation of surface active sites with some impurities, and the mass loss of MgO during the recovery process in each cycle. However, the catalytic activity of regenerated MgO remained as high as 69.8% after 5 runs. Therefore, these results reveal that synthesized catalyst can be considered as a relatively stable catalyst in the catalytic ozonation of cyanide.4. Conclusion
Present study investigated catalyzed ozonation process with MgO nanoparticles and the process performance was accelerated by addition of persulfate as sulfate based radical precursors. The operating parameters in the MgO/O3/PS process were completely investigated and a comprehensive investigation was conducted to find the cyanide degradation mechanism. The following conclusions can be mentioned for this study:• The synthesized catalyst with nanocrystalline structure had specific surface area of 198.3 m2 g−1 and average particle size of 7.42 nm.
• Catalyzing ozonation process had almost 30% synergy for cyanide degradation in MgO/O3.
• The highest cyanide removal rate was observed in the presence of 400 mg h−1 injected ozonation, 200 mg L−1 persulfate and 600 mg L−1 MgO catalyst. Almost 25.5% of the injected ozone was consumed in the MgO/O3/PS.
• Five distinct mechanisms (SOP, MgO/O3, PS/O3, MgO/PS, and MgO/O3/PS) were proposed and proved for cyanide oxidation.
• Scavenging experiments proved generation of both sulfate and hydroxyl radicals in the MgO/O3/PS process.
• The MgO/O3/PS process was able to oxidize 173 mg L−1 of cyanide after 70 min of reaction time in real industrial wastewater.
• The final generated by-products of cyanide oxidation were tracked and it was found that toxic cyanide has completely destructed to much less toxic compounds such as nitrate and carbonate.
Finally, according to the findings of the present study and proposed mechanisms and degradation pathways, it can be concluded that catalyzed ozonation process with MgO nanoparticles and persulfate is a reliable advanced oxidation process for removal of cyanide from industrial wastewater.
Author contributions
Ali Behnami: conducting experiments, data curation and writing the manuscript. Jean-Philippe Croué: writing and revising the manuscript. Ehsan Aghayani: conceptualization and conducting experiments. Mojtaba Pourakbar: conceptualization, methodology, acquisition of the financial support for the project, writing the manuscript.Conflicts of interest
There are no conflicts to declare.Acknowledgements
The authors would like to acknowledge the financial support of Maragheh University of Medical Sciences for this research under grant number 97 DAY18-PAM01.References
- I. Matino, V. Colla and T. A. Branca, Front. Chem. Sci. Eng., 2018, 12, 718–730 CrossRef CAS.
- Q. Li, H. Lu, Y. Yin, Y. Qin, A. Tang, H. Liu and Y. Liu, J. Hazard. Mater., 2019, 364, 367–375 CrossRef CAS PubMed.
- R. Noroozi, T. J. Al-Musawi, H. Kazemian, E. M. Kalhori and M. Zarrabi, J. Water Process. Eng., 2018, 21, 44–51 CrossRef.
- G. Moussavi and R. Khosravi, J. Hazard. Mater., 2010, 183, 724–730 CrossRef CAS PubMed.
- P. Kaewkannetra, T. Imai, F. J. Garcia-Garcia and T. Y. Chiu, J. Hazard. Mater., 2009, 172, 224–228 CrossRef CAS PubMed.
- I. Maulana and F. Takahashi, J. Water Process. Eng., 2018, 22, 80–86 CrossRef.
- M. Mondal, R. Mukherjee, A. Sinha, S. Sarkar and S. De, J. Water Process. Eng., 2019, 28, 135–143 CrossRef.
- R. R. Dash, A. Gaur and C. Balomajumder, J. Hazard. Mater., 2009, 163, 1–11 CrossRef CAS PubMed.
- G. Moussavi, M. Pourakbar, E. Aghayani, M. Mahdavianpour and S. Shekoohyian, Chem. Eng. J., 2016, 294, 273–280 CrossRef CAS.
- G. Moussavi, M. Pourakbar, S. Shekoohiyan and M. Satari, Chem. Eng. J., 2018, 331, 755–764 CrossRef CAS.
- R. Li, J. Kong, H. Liu, P. Chen, G. Liu, F. Li and W. Lv, RSC Adv., 2017, 7, 22802–22809 RSC.
- H. Li, Y.-L. Yang, X. Li, X.-Y. Fan and N. Wang, J. Environ. Chem. Eng., 2021, 9, 106489 CrossRef CAS.
- R. Mudliar, S. S. Umare, D. S. Ramteke and S. R. Wate, J. Hazard. Mater., 2009, 164, 1474–1479 CrossRef CAS PubMed.
- B. K. Mert, Ö. Sivrioğlu, T. Yonar and S. Özçiftçi, Ozone: Sci. Eng., 2014, 36, 196–205 CrossRef CAS.
- G. Moussavi, M. Pourakbar, E. Aghayani and M. Mahdavianpour, Chem. Eng. J., 2018, 350, 673–680 CrossRef CAS.
- S. L. Budaev, A. A. Batoeva and B. A. Tsybikova, J. Environ. Chem. Eng., 2014, 2, 1907–1911 CrossRef CAS.
- T.-K. Kim, T. Kim, A. Jo, S. Park, K. Choi and K.-D. Zoh, Chemosphere, 2018, 208, 441–449 CrossRef CAS PubMed.
- M. D. Hernández-Alonso, J. M. Coronado, J. Soria, J. C. Conesa, V. Loddo, M. Addamo and V. Augugliaro, Res. Chem. Intermed., 2007, 33, 205–224 CrossRef.
- K. Wu, F. Zhang, H. Wu and C. Wei, Environ. Sci. Pollut. Res., 2018, 25, 2389–2400 CrossRef CAS PubMed.
- Z.-Q. Liu, J. Tu, Q. Wang, Y.-H. Cui, L. Zhang, X. Wu, B. Zhang and J. Ma, Sep. Purif. Technol., 2018, 200, 51–58 CrossRef CAS.
- M. Giagnorio, A. Amelio, H. Grüttner and A. Tiraferri, J. Cleaner Prod., 2017, 154, 593–601 CrossRef.
- G. Moussavi, R. Khosravi and N. R. Omran, Appl. Catal., A, 2012, 445–446, 42–49 CrossRef CAS.
- A. Mashayekh-Salehi, G. Moussavi and K. Yaghmaeian, Chem. Eng. J., 2017, 310, 157–169 CrossRef CAS.
- H. Luo, Y. Wang, X. Wen, S. Cheng, J. Li and Q. Lin, Sci. Total Environ., 2021, 766, 142618 CrossRef CAS PubMed.
- J. Zhou, Y. Xia, Y. Gong, W. Li and Z. Li, Sci. Total Environ., 2020, 711, 135120 CrossRef CAS PubMed.
- A. Alinejad, H. Akbari, M. Ghaderpoori, A. K. Jeihooni and A. Adibzadeh, RSC Adv., 2019, 9, 8204–8214 RSC.
- K. He, Y. M. Dong, Z. Li, L. Yin, A. M. Zhang and Y. C. Zheng, J. Hazard. Mater., 2008, 159, 587–592 CrossRef CAS PubMed.
- J. Chen, S. Tian, J. Lu and Y. Xiong, Appl. Catal., A, 2015, 506, 118–125 CrossRef CAS.
- G. Moussavi and M. Mahmoudi, Chem. Eng. J., 2009, 152, 1–7 CrossRef CAS.
- A. Fouda, S. E.-D. Hassan, E. Saied and M. F. Hamza, J. Environ. Chem. Eng., 2021, 9, 105346 CrossRef CAS.
- A. G. El-Shamy, Polymer, 2020, 202, 122565 CrossRef CAS.
- APHA/AWWA/WEF, Standard Methods for the Examination of Water and Wastewater, American Public Health Association, Washington, DC, USA, 20th edn, 2005 Search PubMed.
- Y. K. Güpta, Fresenius' Z. Anal. Chem., 1961, 180, 260–265 CrossRef.
- U. Holzwarth and N. Gibson, Nat. Nanotechnol., 2011, 6, 534 CrossRef CAS PubMed.
- G. Balakrishnan, R. Velavan, K. Mujasam Batoo and E. H. Raslan, Results Phys., 2020, 16, 103013 CrossRef.
- I. Ercan, O. Kaygili, T. Ates, B. Gunduz, N. Bulut, S. Koytepe and I. Ozcan, Ceram. Int., 2018, 44, 14523–14527 CrossRef CAS.
- K. Karthik, S. Dhanuskodi, C. Gobinath, S. Prabukumar and S. Sivaramakrishnan, J. Photochem. Photobiol., B, 2019, 190, 8–20 CrossRef CAS PubMed.
- F. Mohandes, F. Davar and M. Salavati-Niasari, J. Phys. Chem. Solids, 2010, 71, 1623–1628 CrossRef CAS.
- N. C. S. Selvam, R. T. Kumar, L. J. Kennedy and J. J. Vijaya, J. Alloys Compd., 2011, 509, 9809–9815 CrossRef CAS.
- A. Fakhri and S. Adami, J. Taiwan Inst. Chem. Eng., 2014, 45, 1001–1006 CrossRef CAS.
- I. H. Chowdhury, A. H. Chowdhury, P. Bose, S. Mandal and M. K. Naskar, RSC Adv., 2016, 6, 6038–6047 RSC.
- Y. Cai, C. Li, D. Wu, W. Wang, F. Tan, X. Wang, P. K. Wong and X. Qiao, Chem. Eng. J., 2017, 312, 158–166 CrossRef CAS.
- X.-Y. Yu, T. Luo, Y. Jia, Y.-X. Zhang, J.-H. Liu and X.-J. Huang, J. Phys. Chem. C, 2011, 115, 22242–22250 CrossRef CAS.
- D. Zhu, Y. Chen, H. Yang, S. Wang, X. Wang, S. Zhang and H. Chen, Chemosphere, 2020, 247, 125847 CrossRef CAS PubMed.
- H.-Y. Shu, M.-C. Chang and S.-W. Huang, Desalin. Water Treat., 2015, 54, 1013–1021 CrossRef CAS.
- S. F. Castilla-Acevedo, L. A. Betancourt-Buitrago, D. D. Dionysiou and F. Machuca-Martínez, J. Hazard. Mater., 2020, 392, 122389 CrossRef CAS PubMed.
- P. P. Das, A. Anweshan, P. Mondal, A. Sinha, P. Biswas, S. Sarkar and M. K. Purkait, Chemosphere, 2021, 263, 128370 CrossRef CAS PubMed.
- B. Kasprzyk-Hordern, M. Ziółek and J. Nawrocki, Appl. Catal., B, 2003, 46, 639–669 CrossRef CAS.
- J. Weizhou, L. Youzhi, L. Wenli, L. Jing, S. Fan and W. Chaoran, China Pet. Process. Petrochem. Technol., 2013, 15, 85–94 Search PubMed.
- N. Khoshnamvand, A. Jafari, B. Kamarehie, A. Mohammadi and M. Faraji, Environ. Processes, 2019, 6, 757–772 CrossRef CAS.
- M. Pourakbar, G. Moussavi and S. Shekoohiyan, Ecotoxicol. Environ. Saf., 2016, 125, 72–77 CrossRef CAS PubMed.
- M. a. A. Aramendía, V. Borau, C. Jiménez, J. M. Marinas, J. R. Ruiz and F. J. Urbano, Appl. Catal., A, 2003, 244, 207–215 CrossRef.
- M. Sánchez-Polo, U. von Gunten and J. Rivera-Utrilla, Water Res., 2005, 39, 3189–3198 CrossRef PubMed.
- T. Zhang, C. Li, J. Ma, H. Tian and Z. Qiang, Appl. Catal., B, 2008, 82, 131–137 CrossRef CAS.
- J. Qiao, S. Luo, P. Yang, W. Jiao and Y. Liu, J. Taiwan Inst. Chem. Eng., 2019, 99, 1–8 CrossRef CAS.
- S. S. Abu Amr, H. A. Aziz, M. N. Adlan and M. J. K. Bashir, Chem. Eng. J., 2013, 221, 492–499 CrossRef CAS.
- W.-D. Oh, Z. Dong and T.-T. Lim, Appl. Catal., B, 2016, 194, 169–201 CrossRef CAS.
- Y. Zhang, Q. Zhang and J. Hong, Appl. Surf. Sci., 2017, 422, 443–451 CrossRef CAS.
- Y.-H. Guan, J. Ma, Y.-M. Ren, Y.-L. Liu, J.-Y. Xiao, L.-q. Lin and C. Zhang, Water Res., 2013, 47, 5431–5438 CrossRef CAS PubMed.
- T. Guo, C. Dang, S. Tian, Y. Wang, D. Cao, Y. Gong, S. Zhao, R. Mao, B. Yang and X. Zhao, Chem. Eng. J., 2018, 347, 535–542 CrossRef CAS.
- S. L. Budaev, A. A. Batoeva and B. A. Tsybikova, Miner. Eng., 2015, 81, 88–95 CrossRef CAS.
- G. Moussavi, M. Rezaei and M. Pourakbar, Chem. Eng. J., 2018, 332, 140–149 CrossRef CAS.
- F. Rashidashmagh, Y. Doekhi-Bennani, M. Tizghadam-Ghazani, J. P. van der Hoek, A. Mashayekh-Salehi, B. S. G. J. Heijman and K. Yaghmaeian, J. Hazard. Mater., 2021, 404, 124154 CrossRef CAS PubMed.
- S. H. Kim, S. W. Lee, G. M. Lee, B.-T. Lee, S.-T. Yun and S.-O. Kim, Chemosphere, 2016, 143, 106–114 CrossRef CAS PubMed.
- S. Malhotra, M. Pandit, J. Kapoor and D. Tyagi, J. Chem. Technol. Biotechnol., 2005, 80, 13–19 CrossRef CAS.
- A. R. Yeddou, B. Nadjemi, F. Halet, A. Ould-Dris and R. Capart, Miner. Eng., 2010, 23, 32–39 CrossRef CAS.
- M. F. Hanafi and N. Sapawe, Mater. Today: Proc., 2020, 31, 266–268 CAS.
| This journal is © The Royal Society of Chemistry 2021 |

