 Open Access Article
Exploring the therapeutic mechanisms of Cassia glauca in diabetes mellitus through network pharmacology, molecular docking and molecular dynamics†
Prarambh S. R. Dwivedi i,
Rajesh Patil
 b,
Pukar Khanal
 *a,
Nilambari S. Gurav
 c,
Vaishali D. Muraded,
Dinesh P. Hase
 j,
Mohan G. Kalaskare,
Muniappan Ayyanar
 f,
Rupesh V. Chikhale*g and
Shailendra S. Gurav
 *h
*h
aDepartment of Pharmacology and Toxicology, KLE College of Pharmacy Belagavi, KLE Academy of Higher Education and Research (KAHER), Belagavi-590010, India. E-mail: pukarkhanal58@gmail.com
bSinhgad Technical Education Society's, Sinhgad College of Pharmacy, Vadgaon (Bk), Pune-411041, Maharashtra, India
cPonda Education Society's Rajaram and Tarabai Bandekar College of Pharmacy, India
dDepartment of Chemistry, Padmashri Vikhe Patil College, Pravarangar, Loni, Ahmednagar, Maharashtra, India
eR C Patel Institute of Pharmaceutical Education and Research, Shirpur, India
fDepartment of Botany, A. V. V. M. Sri Pushpam College (Autonomous), Affiliated to Bharathidasan University, Poondi, Thanjavur, India
gSchool of Pharmacy, University of East Anglia, Norwich Research Park, Norwich, UK. E-mail: rupeshchikhale7@gmail.com
hDepartment of Pharmacognosy and Phytochemistry, Goa College of Pharmacy Panaji, Goa University, Goa-403001, India. E-mail: shailendra.gurav@nic.in
iDepartment of Pharmacology, NGSM Institute of Pharmaceutical Sciences (NGSMIPS), Nitte (Deemed to be University), Mangalore-575018, India
jDepartment of Pharmacognosy, Amrutvahini College of Pharmacy, Sangamner, Maharashtra, India
First published on 9th December 2021
Abstract
Cassia glauca is reported as anti-diabetic medicinal plant and is also used as an ethnomedicine. However, its mode of action as an anti-diabetic agent has not been clearly elucidated. Hence, the present study investigated the probable mechanism of action of C. glauca to manage diabetes mellitus via network pharmacology and molecular docking and simulations studies. The reported bioactives from C. glauca were retrieved from an open-source database, i.e. ChEBI, and their targets were predicted using SwissTargetPrediction. The proteins involved in the pathogenesis of diabetes were identified from the therapeutic target database. The targets involved in diabetes were enriched in STRING, and the pathways involved in diabetes were identified concerning the KEGG. Cytoscape was used to construct the network among bioactives, proteins, and probably regulated pathways, which were analyzed based on edge count. Similarly, molecular docking was performed using the Glide module of the Schrodinger suite against majorly targeted proteins with their respective ligands. Additionally, the drug-likeness score and ADMET profile of the individual bioactives were predicted using MolSoft and admetSAR2.0 respectively. The stability of these complexes were further studied via molecular dynamics simulations and binding energy calculations. Twenty-three bio-actives were retrieved from the ChEBI database in which cassiarin B was predicted to modulate the highest number of proteins involved in diabetes mellitus. Similarly, GO analysis identified the PI3K-Akt signaling pathway to be primarily regulated by modulating the highest number of gene. Likewise, aldose reductase (AKR1B1) was majorly targeted via the bioactives of C. glauca. Similarly, docking study revealed methyl-3,5-di-O-caffeoylquinate (docking score −9.209) to possess the highest binding affinity with AKR1B1. Additionally, drug-likeness prediction identified cassiaoccidentalin B to possess the highest drug-likeness score, i.e. 0.84. The molecular dynamics simulations and the MMGBSA indicate high stability and greater binding energy for the methyl-3,5-di-O-caffeoylquinate (ΔGbind = −40.33 ± 6.69 kcal mol−1) with AKR1B1, thus complementing results from other experiments. The study identified cassiarin B, cassiaoccidentalin B, and cinnamtannin A2 as lead hits for the anti-diabetic activity of C. glauca. Further, the PI3K-Akt and AKR1B1 were traced as majorly modulated pathway and target, respectively.
1. Introduction
Diabetes mellitus is characterized by hyperglycemia which may occur due to impaired insulin secretion, insulin action, or a combination of both.1 Increased risk for diabetes is primarily associated with age, ethnicity, and family history of diabetes, smoking, obesity, and physical inactivity which may lead to cardiovascular complications.2 In 2005, it was estimated that more than 20 million people had diabetes in the United States and 30% of the cases were undiagnosed. Moreover, it has been estimated that these numbers may rise to 48 million by 2050.3 Also, this number has been estimated to increase to 578 million, representing 10.2% of the total world adult population by 2030, and further increase to 700 million by the year 2045. Additionally, in 2019, diabetes prevalence among men and women has been estimated to be 9.6% and 9.0%, respectively, of the total respective gender world population.4Diabetes mellitus is a complex pathogenesis and varied presentation; thus, any classification is arbitrary;5 majorly categorized into type 1 diabetes mellitus (T1DM) and type 2 diabetes mellitus (T2DM).6,7 T1DM is an autoimmune disorder characterized by T-cell-mediated destruction of pancreatic β-cells, which results in insulin deficiency and ultimately hyperglycemia8 whereas, the T2DM is characterized by two main insulin-related anomalies i.e. insulin resistance and pancreatic β-cell dysfunction.9 Chronic hyperglycemia may result in dysfunctioning, and failure of multiple organs like kidneys, eyes, nerves, blood vessels, and heart;6 often cauterized for diabetic complications. The current pharmacotherapy of T2DMs utilizes synthetic single-target oral hypoglycaemic agents; includes sulphonylureas, biguanides, thiazolidinediones, and α-glucosidase inhibitors;10,11 however, these agents are concerned with multiple side effects like heartburn, stomach discomfort, ketoacidosis, pancreatitis, and nephropathy risk.12
Since ancient times, various medicinal plants were the first choice to treat diabetes13,14 as they are concerned with minimum side effects.15 However, no clear mechanism has been established for their potential therapeutic action including C. glauca against diabetes; in addition, traditional medicines are explained as "hard to swallow" agents due to unproposed mode of action which is one of the prime reason to limit their utility. Moreover, in the present study, an approach has been made to propose the probable mechanism of action of C. glauca via the concept of multiple bioactives-multiple targets interaction using the concept of network pharmacology10 by extending the theory of “lock and key” to “a master key may unlock multiple locks”.
Cassia glauca is an ornamental tree with a height of 10 m belonging to the sub-family Caesalpiniaceae and family Fabaceae.16 It has been reported for its various pharmacological activities like anti-inflammatory, anti-oxidant, and anti-diabetic properties.17 Traditionally, the bark and leaves of C. glauca are used to treat diabetes and gonorrhea.18 Further, it has been reported to lower the elevated blood glucose level in streptozotocin-induced hyperglycemia.19 Additionally, C. glauca has been reported to inhibit α-glucosidase and α-amylase; may contribute in managing the post-prandial hyperglycemia.20 In addition, C. glauca acetone fraction has been reported to cause a significant decrease in the levels of hepatic enzyme aspartate transaminase, alanine transaminase, creatine kinase, and lactate dehydrogenase in streptozotocin-induced diabetic rats.21 Further, multiple bioactives from C. glauca have been traced to regulate the PPAR-γ to deal with the pathogenesis of diabetes using computational approaches.22 However, the complete interaction of the secondary metabolites from C. glauca to regulate the multiple pathways and associated proteins in diabetes has not been reported yet. In this regard, the present study aimed to predict the mode of action of C. glauca against diabetes via the implementation of network pharmacology, molecular docking, and molecular dynamics simulation.
2. Materials and methods
2.1. Mining of phytoconstituents and targets
A list of reported phytoconstituents was retrieved from the Chemical Entities of Biological Interest (ChEBI; https://www.ebi.ac.uk/chebi/https://www.ebi.ac.uk/chebi/https://www.ebi.ac.uk/chebi/) database. The molecular formula, molecular weight, PubChem CID, InChI key, and canonical SMILES were obtained from the PubChem (https://pubchem.ncbi.nlm.nih.gov/https://pubchem.ncbi.nlm.nih.gov/https://pubchem.ncbi.nlm.nih.gov/) database. The targets involved in diabetes were retrieved from the therapeutic target database (http://db.idrblab.net/ttd/http://db.idrblab.net/ttd/http://db.idrblab.net/ttd/) using the keyword “Diabetes mellitus” and cross-matched with the proteins regulated by the bioactives of C. glauca with reference to the bioactives-regulated proteins from SwissTargetPrediction (http://www.swisstargetprediction.ch/http://www.swisstargetprediction.ch/http://www.swisstargetprediction.ch/).232.2. Drug-likeness and ADMET profile of bio-actives
The drug-likeness score of individual bioactive was retrieved from MolSoft (https://molsoft.com/mprop/https://molsoft.com/mprop/https://molsoft.com/mprop/) by querying their SMILES. Further, absorption, distribution, metabolism, excretion, and toxicity (ADMET) profile of each bio-active was predicted using admetSAR 2.0![[thin space (1/6-em)]](https://www.rsc.org/images/entities/char_2009.gif) 24 (http://lmmd.ecust.edu.cn/admetsar2/http://lmmd.ecust.edu.cn/admetsar2/http://lmmd.ecust.edu.cn/admetsar2/) to predict human intestinal absorption, Caco-2 permeability, blood–brain barrier permeability, P-gp inhibition, P-gp substrate, CYP3A4/CYP2C9/CYP2D6 substrate, CYP3A4/CYP2C9/CYP2C19/CYP2D6/CYP1A2 inhibition, Ames mutagenesis, human ether-a-go-go inhibition, micronuclear toxicity, hepatotoxicity, plasma protein binding, acute oral toxicity.
24 (http://lmmd.ecust.edu.cn/admetsar2/http://lmmd.ecust.edu.cn/admetsar2/http://lmmd.ecust.edu.cn/admetsar2/) to predict human intestinal absorption, Caco-2 permeability, blood–brain barrier permeability, P-gp inhibition, P-gp substrate, CYP3A4/CYP2C9/CYP2D6 substrate, CYP3A4/CYP2C9/CYP2C19/CYP2D6/CYP1A2 inhibition, Ames mutagenesis, human ether-a-go-go inhibition, micronuclear toxicity, hepatotoxicity, plasma protein binding, acute oral toxicity.
2.3. Gene expression and enrichment analysis
UniProt database (https://www.uniprot.org/https://www.uniprot.org/https://www.uniprot.org/) was used to identify the gene code of regulated proteins which were queried in STRING25 (https://string-db.org/https://string-db.org/https://string-db.org/) for GO analysis. Likewise, the pathways involved in diabetes were identified by concerning the KEGG database (https://www.genome.jp/kegg/https://www.genome.jp/kegg/https://www.genome.jp/kegg/). In addition, network among bioactives, proteins, and pathways was constructed using Cytoscape26 ver. 3.7.2 (https://cytoscape.org/https://cytoscape.org/https://cytoscape.org/https://cytoscape.org/https://cytoscape.org/); any duplication was avoided. The whole network was treated as directed, and node size and color were set as “low values to small sizes” and “low values to bright colors” concerning edge count.2.4. Molecular docking
2.5. Molecular dynamics (MD) simulation and molecular mechanics-generalized born solvent accessibility (MM-GBSA) analysis
The AMBER18 molecular dynamics simulation package was used to perform all the simulation calculations. All the ligand molecules were parameterized with the ANTECHAMBER tool implemented with AMBER18. The protein–ligand complexes were prepared in xLeap to obtain an explicit solvent model. These complexes were subjected to the minimization cycles, simulated annealing, equilibration, and finally, a production run of 100 ns on Nvidia V100-SXM2-16GB Graphic Processing Unit using the PMEMD.CUDA module. Further, the 100 ns trajectories were stripped of water molecules and salt ions with CPPTRAJ and subjected to MM-GBSA analysis using Amber18 and Amber18 tools on all the 10![[thin space (1/6-em)]](https://www.rsc.org/images/entities/char_2009.gif) 000 frames (ESI file†).
000 frames (ESI file†).
3. Results
3.1. Mining of phytoconstituents and targets involved in diabetes
Twenty-three bio-actives were identified in the plant C. glauca from the ChEBI database in which all bioactives modulated proteins involved in diabetes. Two hundred and sixteen proteins were found to be involved in diabetes mellitus (as recorded by the therapeutic target database); among them, eighty-four were modulated by the bio-actives from C. glauca. Table 1 summarizes the list of bioactives, their PubChem CID, molecular formula, and molecular weight.| Bioactives | PubChem CID | Molecular formula | Molecular weight |
|---|---|---|---|
| [Epicatechin-(4beta->8)]5-epicatechin | 16129623 | C90H74O36 | 1731.5 |
| 1-Tetracosanoylglycerol | 14542801 | C27H54O4 | 442.7 |
| 3-O-Methylcalopocarpin | 467497 | C21H22O4 | 338.4 |
| 3-Phenylpropanal | 7707 | C9H10O | 134.17 |
| Cassiaoccidentalin B | 70698280 | C27H28O14 | 576.5 |
| Cassiarin B | 17756116 | C18H19NO4 | 313.3 |
| Cinnamic acid | 444539 | C9H8O2 | 148.16 |
| Sandwicensin | 467498 | C21H22O4 | 338.4 |
| Sennoside | 656822 | C42H38O20 | 862.7 |
| Torososide B | 9988405 | C40H52O25 | 932.8 |
| Cassiaside C2 | 10350826 | C39H52O25 | 920.8 |
| Methyl 3,5-di-O-caffeoyl quinate | 10075681 | C26H26O12 | 530.5 |
| Cassiarin A | 17756117 | C13H11NO2 | 213.23 |
| Cassiatannin A | 44610605 | C60H48O24 | 1153 |
| Cinnamtannin A2 | 16130899 | C60H50O24 | 1155 |
| Cinnamtannin B-1 | 475277 | C45H36O18 | 864.8 |
| Cinnamtannin D-1 | 46173958 | C45H36O18 | 864.8 |
| Diphenyl sulfone | 31386 | C12H10OS | 218.27 |
| Kaempferol 3-beta-gentiobioside | 9960512 | C27H30O16 | 610.5 |
| Norrubrofusarin | 1.35 × 10⁸ | C14H10O5 | 258.23 |
| Parameritannin A-1 | 16146159 | C60H48O24 | 1153 |
| Pentadecanal | 17697 | C15H30O | 226.4 |
| 3,5-Di-O-caffeoyl quinic acid | 6474310 | C25H24O12 | 516.4 |
3.2. Drug-likeness score and ADMET profile of bioactives
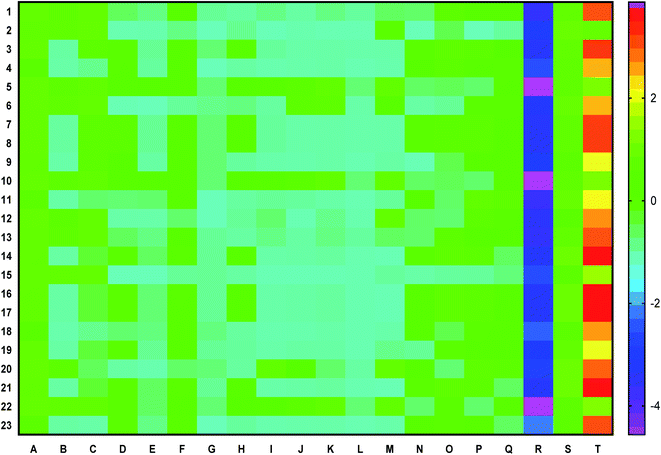
Fourteen bioactives scored a positive drug-likeness score in which cassiaoccidentalin B scored the highest, i.e. 0.84 (Table 2). Similarly, the pharmacokinetic profile of each bioactive is represented in a heat map to present human intestinal absorption (HIA), Caco-2 permeability (Caco-2p), blood–brain barrier (BBB) permeability, P-glycoprotein (p-gp) inhibitor/substrate, CYP3A4, CYP2C9, CYP2D6, CYP3A4, CYP2C9, CYP2C19, CYP2D6, CYP1A2 inhibitor/substrate, Ames mutagenesis, human ether-a-go-go inhibition, hepatotoxicity, water-solubility, plasma protein binding, and acute oral toxicity (Fig. 1) in which 3-phenylpropanal and cassiatannin A showed highest HIA, Caco-2p by sennoside, and BBB permeability by 1-tetracosanoylglycerol. Additionally, cassiarin A and cassiarin B were predicted to possess the highest p-gp inhibition. Further, 3-phenylpropanal and cassiatannin A were predicted to possess the highest affinity towards p-pg as a substrate. Likewise, 3,5-di-O-caffeoylquinic acid, 3-O-methylcalopocarpin, and cinnamtannin D-1 and sandwicensin were predicted for their highest affinity towards hERG inhibition, hepatotoxicity, and plasma protein binding respectively (Fig. 1).| Bioactive | Number of HBA | Number of HBD | MolLogP | MolLogS | DLS | |
|---|---|---|---|---|---|---|
| log(mol L−1) | mg L−1 | |||||
| a HBA: hydrogen bond acceptor; HBD: hydrogen bond donor; DLS: drug-likeness score. | ||||||
| [Epicatechin-(4beta->8)]5-epicatechin | 3 | 1 | 2.68 | −2.84 | 375.19 | 0.29 |
| 1-Tetracosanoylglycerol | 4 | 2 | 10.2 | −5.98 | 0.46 | −0.11 |
| 3-O-Methylcalopocarpin | 4 | 1 | 5.14 | −4.96 | 3.75 | −0.42 |
| 3-Phenylpropanal | 1 | 0 | 1.62 | −1.31 | 6623.72 | −1.38 |
| Cassiaoccidentalin B | 14 | 8 | 0.04 | −1.59 | 14![[thin space (1/6-em)]](https://www.rsc.org/images/entities/char_2009.gif) 846.5 846.5 |
0.84 |
| Cassiarin B | 4 | 0 | 1.66 | −1.49 | 10![[thin space (1/6-em)]](https://www.rsc.org/images/entities/char_2009.gif) 022.7 022.7 |
−0.96 |
| Cinnamic acid | 2 | 1 | 2.22 | −2.45 | 522.96 | −1.17 |
| Sandwicensin | 4 | 1 | 5.06 | −4.86 | 4.64 | 0.05 |
| Sennoside | 20 | 12 | 1.08 | −2.02 | 8246.81 | 0.71 |
| Torososide B | 25 | 14 | −4.46 | −1.52 | 27![[thin space (1/6-em)]](https://www.rsc.org/images/entities/char_2009.gif) 878.3 878.3 |
0.63 |
| 3,5-Di-O-caffeoyl quinic acid | 12 | 7 | 1.73 | −2.03 | 4764.38 | 0.74 |
| Cassiaside C2 | 25 | 14 | −4.95 | −1.56 | 25![[thin space (1/6-em)]](https://www.rsc.org/images/entities/char_2009.gif) 553.5 553.5 |
0.52 |
| Methyl 3,5-di-O-caffeoyl quinate | 12 | 6 | 2.34 | −2.65 | 1174.72 | 0.78 |
| Cassiarin A | 2 | 1 | 1.27 | −1.79 | 3435.66 | −1.53 |
| Cassiatannin A | 24 | 19 | 3.47 | −3.15 | 815.43 | 0.75 |
| Cinnamtannin A2 | 24 | 20 | 3.01 | −2.86 | 1602.46 | 0.73 |
| Cinnamtannin B-1 | 18 | 14 | 2.5 | −2.7 | 1740.12 | 0.75 |
| Cinnamtannin D-1 | 18 | 14 | 2.5 | −2.7 | 1740.12 | 0.75 |
| Diphenyl sulfone | 2 | 0 | 2.96 | −3.1 | 172.89 | −1.54 |
| Kaempferol 3-beta- gentiobioside | 16 | 10 | −1.99 | −1.79 | 9833.52 | 0.64 |
| Norrubrofusarin | 5 | 3 | 1.23 | −1.49 | 8329.69 | −1.3 |
| Parameritannin A-1 | 24 | 19 | 3.47 | −3.15 | 815.43 | 0.75 |
| Pentadecanal | 1 | 0 | 6.58 | −5.9 | 0.29 | −1.19 |
3.3. Enrichment and network analysis
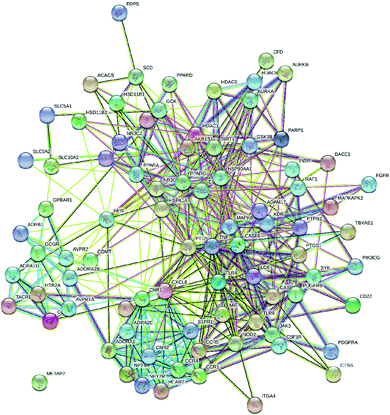
Cassiarin B was predicted to modulate the highest number of genes, i.e. 24 (Table 3). Similarly, Fig. 2 represents the protein–protein interaction of all the regulated proteins. In the constructed network of bioactives, targets, and pathways, AKR1B1 was majorly targeted by the highest number of bio-actives. Similarly, the PI3K-Akt pathway was primarily regulated by triggering the highest number of genes, i.e. 13 (Table 4).| Bioactive | Gene count | Bioactive | Gene count |
|---|---|---|---|
| [Epicatechin-(4beta-8)]5-epicatechin | 16 | Cinnamtannin A2 | 19 |
| 1-Tetracosanoylglycerol | 12 | Cinnamtannin B-1 | 12 |
| 3,5-Di-O-caffeoyl quinic acid | 12 | Cinnamtannin D-1 | 11 |
| 3-O-Methylcalopocarpin | 18 | Diphenyl sulfone | 17 |
| 3-Phenylpropanal | 10 | Kaempferol 3-beta-gentiobioside | 12 |
| Cassiaoccidentalin B | 17 | Methyl 3,5-di-O-caffeoyl quinate | 14 |
| Cassiarin A | 15 | Norrubrofusarin | 12 |
| Cassiarin B | 24 | Parameritannin A-1 | 14 |
| Cassiaside C2 | 12 | Pentadecanal | 19 |
| Cassiatannin A | 17 | Sandwicensin | 15 |
| Cinnamic acid | 16 | Sennoside | 19 |
| Torososide B | 17 | ||
| Grand total | 350 | ||
| Pathway | Gene count | Pathway | Gene count |
|---|---|---|---|
| Adherens junction | 3 | Jak-STAT signaling pathway | 4 |
| Adipocytokine signaling pathway | 5 | Longevity regulating pathway | 3 |
| AGE-RAGE signaling pathway in diabetic complications | 3 | Longevity regulating pathway – multiple species | 4 |
| Aldosterone-regulated sodium reabsorption | 3 | mTOR signaling pathway | 4 |
| AMPK signaling pathway | 5 | Neurotrophin signaling pathway | 4 |
| Bile secretion | 3 | Notch signaling pathway | 2 |
| Cytokine–cytokine receptor interaction | 9 | PI3K-Akt signaling pathway | 13 |
| FoxO signaling pathway | 5 | PPAR signaling pathway | 5 |
| Galactose metabolism | 2 | Progesterone-mediated oocyte maturation | 4 |
| Glucagon signaling pathway | 5 | T Cell receptor signaling pathway | 4 |
| Insulin resistance | 7 | Type II diabetes mellitus | 4 |
| Insulin signaling pathway | 7 | Wnt signaling pathway | 3 |
| Grand total | 111 | ||
Likewise, gene ontology of protein interaction (Fig. 3) analysis identified 1179 biological processes in which response to an organic substance (GO:00110033) scored the lowest false discovery rate via the modulation of 58 genes, i.e. (SIRT1, MIF, GCK, NR3C1, RAF1, PDGFRA, PDGFRB, KDR, REN, AKR1B1, CSF1R, PPARG, CCR5, CCR1, AVPR1A, NOD2, TACR1, INSR, S1PR1, CXCL8, ADAM17, PPARD, HSD11B2, GSK3B, P2RX7, CCR4, HDAC6, HSP90AA1, ACACB, NR3C2, CASP8, AVPR2, PIK3CG, RXRG, TLR9, COMT, PARP1, MAPKAPK2, PTGS2, CTSS, CNR1, PTPN1, TLR4, CNR2, HSPA1A, SYK, MAPK8, ITGA4, GCGR, PPARA, JAK3, FGFR1, TNF, ESR1, HDAC9, CASP1, HTR2A, NR1H4) against 2815 background genes at a strength of 0.68. Similarly, 146 molecular functions were identified in which signaling receptor activity (GO:0038023) scored the lowest false discovery rate via modulation of 39 genes (NR3C1, PDGFRA, PDGFRB, KDR, CSF1R, PPARG, CCR5, CCR1, AVPR1A, TACR1, INSR, ADORA2B, S1PR1, PPARD, P2RX7, NPY2R, CCR4, CCKBR, NR3C2, AVPR2, RXRG, TLR9, ADORA1, ADRB1, CNR1, TLR4, NPY4R, CNR2, ADRA1D, HCAR2, ITGA4, GCGR, PPARA, ADRA2C, FGFR1, ESR1, GPBAR1, HTR2A, NR1H4) against 1429 background genes at a strength of 0.8. Likewise, 53 cellular components were identified in which intrinsic component of the plasma membrane (GO:0031226) scored the minimum false discovery rate by modulation of 33 genes (SLC10A2, PDGFRA, PDGFRB, KDR, SLC5A1, CSF1R, CCR5, CCR1, AVPR1A, TACR1, INSR, ADORA2B, S1PR1, ADAM17, BACE1, SLC5A2, P2RX7, NPY2R, CCR4, AVPR2, ADORA1, ADRB1, CNR1, TLR4, NPY4R, CNR2, ADRA1D, ITGA4, GCGR, ADRA2C, FGFR1, TNF, HTR2A) against 1641 background genes at a strength of 0.67. Fig. 3 represents the top 20 biological processes, molecular function, and cellular components. Additionally, the network analysis identified the cassiacin B to regulate the highest number of proteins; AKR1B1 was primarily a targeted protein, and the PI3K-Akt signaling pathway was primarily modulated signaling pathway. Similarly, the interaction of individual bioactives with the respected modulated proteins and regulated pathways is presented in Fig. 4. In addition, Fig. 5 summarizes the association of gene ontology terms linked genes/targets with the KEGG-triggered genes; 76.6% of the top 20 gene ontology genes were identified to be common with KEGG-identified proteins.
 | ||
| Fig. 3 Gene ontology of proteins regulated by bioactives of C. glauca for (a) molecular function, (b) cellular components, and (c) biological process. | ||
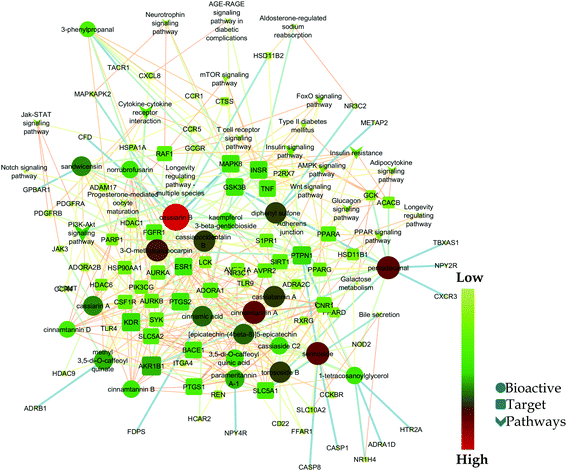 | ||
| Fig. 4 Network interaction of bio-actives from C. glauca, their regulated targets, and modulated pathways. | ||
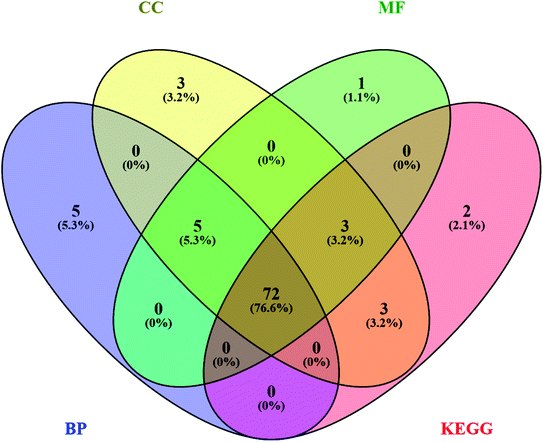 | ||
| Fig. 5 Interaction of genes regulated in CC; cellular components, MF; molecular function, and BP; biological process with KEGG; KEGG pathways. | ||
It was observed that interaction between cassiarin B and MAPK8 showed the highest edge betweenness i.e. 299.94 (Table S1; ESI file†). Further, node notch signaling pathway, cassiarin B, PTPN1, CFD, and FFAR1 had the average shortest path length i.e. 3.85, betweenness centrality i.e. 0.11, closeness centrality i.e. 0.43, neighborhood connectivity i.e. 24, and topological coefficient i.e. 0.79 respectively (Table S2; ESI file†).
3.4. In silico molecular docking
In silico molecular docking revealed that methyl 3,5-di-O-caffeoyl quinate to possess the highest docking score (−9.209) with AKR1B1 compared to the rest of the bioactives. Similarly, three hydrogen bond interactions of methyl 3,5-di-O-caffeoyl quinate were observed with three amino acid residues, i.e.![[double bond, length as m-dash]](https://www.rsc.org/images/entities/char_e001.gif) O with Leu 300 and Hie100 and –OH with Asp 43. Further, one of the aromatic rings of methyl 3,5-di-O-caffeoyl quinate was involved in pi–pi stacking with Trp219 (Fig. 6a). Similarly, kaempferol 3-beta-gentiobioside had a docking score of −9.123 with six hydrogen bond interactions, i.e. OH with Hie110, Ser302, Lys21, Tyr48, and Val47 with aldo-ketoreductase. Similarly, two aromatic rings from flavonoid moiety of kaempferol 3-beta-gentiobioside were involved in pi–pi stacking with Trp20 and Phe122 (Fig. 6b). Further, 3,5-di-O-caffeoyl quinic acid showed the highest docking score of −9.117 with AKR1B1 via three hydrogen bond interactions, i.e. two
O with Leu 300 and Hie100 and –OH with Asp 43. Further, one of the aromatic rings of methyl 3,5-di-O-caffeoyl quinate was involved in pi–pi stacking with Trp219 (Fig. 6a). Similarly, kaempferol 3-beta-gentiobioside had a docking score of −9.123 with six hydrogen bond interactions, i.e. OH with Hie110, Ser302, Lys21, Tyr48, and Val47 with aldo-ketoreductase. Similarly, two aromatic rings from flavonoid moiety of kaempferol 3-beta-gentiobioside were involved in pi–pi stacking with Trp20 and Phe122 (Fig. 6b). Further, 3,5-di-O-caffeoyl quinic acid showed the highest docking score of −9.117 with AKR1B1 via three hydrogen bond interactions, i.e. two ![[double bond, length as m-dash]](https://www.rsc.org/images/entities/char_e001.gif) O group interacted with Leu300 and Hie110 and one –OH group with Asp43. Similarly, one of the aromatic rings of 3,5-di-O-caffeoyl quinic acid had a pi–pi stacking with Trp219 (Fig. 6c). Similarly, sennoside was predicted to possess the docking score of −8.108 with AKR1B1 via –OH group of tetrahydropyran ring via one hydrogen bond, i.e. –OH with Tyr48. Likewise, pi–pi stacking was observed with one of the aromatic rings of the sennoside with Phe122 (Fig. 6d). Likewise, torososide B was predicted to possess the docking score of −7.945 with AKR1B1 via four hydrogen bond interactions by –OH groups of tetrahydropyran rings with Tyr48, Gln49, and Lys119 (Fig. 6e). In addition, epalrestat, a positive control as AKR1B1 inhibitor, possessed a docking score of −8.646 with four hydrogen interactions in which two
O group interacted with Leu300 and Hie110 and one –OH group with Asp43. Similarly, one of the aromatic rings of 3,5-di-O-caffeoyl quinic acid had a pi–pi stacking with Trp219 (Fig. 6c). Similarly, sennoside was predicted to possess the docking score of −8.108 with AKR1B1 via –OH group of tetrahydropyran ring via one hydrogen bond, i.e. –OH with Tyr48. Likewise, pi–pi stacking was observed with one of the aromatic rings of the sennoside with Phe122 (Fig. 6d). Likewise, torososide B was predicted to possess the docking score of −7.945 with AKR1B1 via four hydrogen bond interactions by –OH groups of tetrahydropyran rings with Tyr48, Gln49, and Lys119 (Fig. 6e). In addition, epalrestat, a positive control as AKR1B1 inhibitor, possessed a docking score of −8.646 with four hydrogen interactions in which two ![[double bond, length as m-dash]](https://www.rsc.org/images/entities/char_e001.gif) O groups interacted with Cys298 and Trp111. Similarly, O− of (–COOH) of epalrestat possessed two hydrogen bond interactions with Hie110 and Tyr48 (Fig. 6f); the docking score of individual bioactives with AKR1B1 is summarized in Table 5.
O groups interacted with Cys298 and Trp111. Similarly, O− of (–COOH) of epalrestat possessed two hydrogen bond interactions with Hie110 and Tyr48 (Fig. 6f); the docking score of individual bioactives with AKR1B1 is summarized in Table 5.
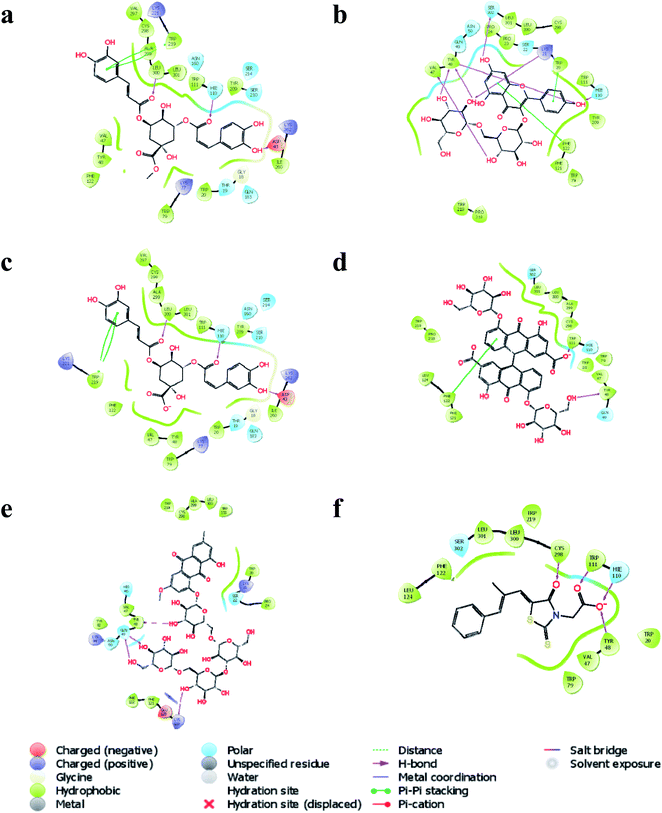 | ||
| Fig. 6 Interaction of (a) methyl 3,5-di-O-caffeoyl quinate, (b) kaempferol 3-beta-gentiobioside, (c) 3,5-di-O-caffeoyl quinic acid, (d) sennoside, (e) torososide B, and (f) epalrestat with AKR1B1. | ||
| Title | Docking score |
|---|---|
| a Compounds identified from network interactions.b Gold standard as aldo-keto reductase inhibitor. | |
| Methyl 3,5-di-O-caffeoyl quinatea | −9.209 |
| Kaempferol 3-beta-gentiobiosidea | −9.123 |
| 3,5-Di-O-caffeoyl quinic acida | −9.117 |
| Sennoside | −8.108 |
| Torososide Ba | −7.945 |
| Cassiarin Ba | −7.903 |
| Cassiaoccidentalin Ba | −7.839 |
| Cassiaside C2a | −7.646 |
| Cassiarin Aa | −7.298 |
| Norrubrofusarina | −7.211 |
| 3-Phenylpropanal | −6.753 |
| Cinnamtannin B-1 | −6.708 |
| Sandwicensin | −6.46 |
| Diphenyl sulfone | −6.192 |
| Cinnamic acida | −5.984 |
| 1-Tetracosanoylglycerol | −5.776 |
| 3-O-Methylcalopocarpin | −5.753 |
| Cinnamtannin A2a | −2.464 |
| Pentadecanal | −0.869 |
| [Epicatechin-(4beta->8)]5-epicatechina | 0 |
| Cassiatannin A | 0 |
| Cinnamtannin D-1 | 0 |
| Parameritannin A-1a | 0 |
| Epalrestatb | −8.646 |
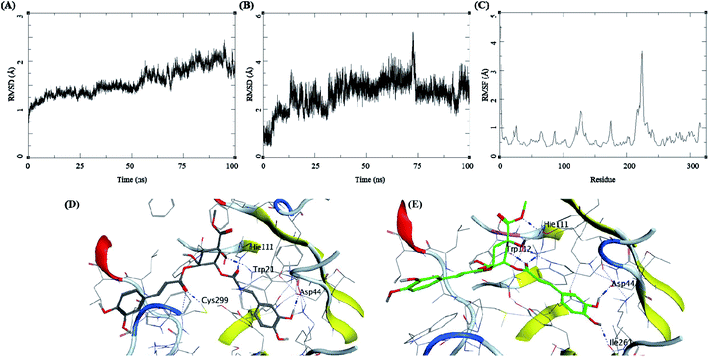
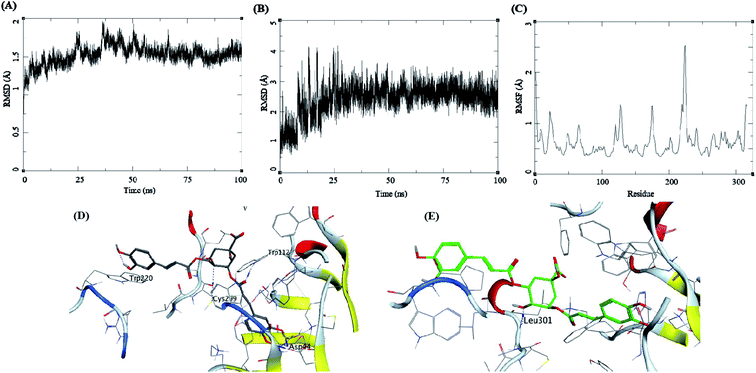
Methyl 3-5-di-O-caffeoyl quinate, kaempferol-3-beta-gentiobioside, and 3-5-di-O-caffeoyl quinic acid complexed with AKR1B1 and a standard drug epalrestat were studied for their comparative stability in the active site of the receptor and their respective binding free energies. The trajectory analysis of methyl 3-5-di-O-caffeoyl quinate complexed with AKR1B1 is presented in Fig. 7. The protein RMSD during the 100 ns simulation shows a slight and gradual rise in the fluctuations for the protein residues in three stages, first 0–30 ns, second 30–60 ns, and the final one with more fluctuation between 60–100 ns (Fig. 7A). During the last 10 ns, it stabilizes between 1.7 to 2 Å. The ligand RMSD showed higher fluctuations throughout the simulation, with RMSD fluctuations between 1.5 to 4 Å (Fig. 7B). The RMSF for protein amino acid residues was between 0.5 to 1.5 Å for almost all the residues except for the residues between 210 to 250; showed high RMSF of up to 4 Å (Fig. 7C). The initial frame (Fig. 7D) of this complex showed hydrogen bonds with Asp44, His111, and Cys299. In contrast, the end conformation from the simulations showed the formation of some new hydrogen bonds between Trp112 and Ile261 and loss of H-bonds with Cys299 (Fig. 7E).
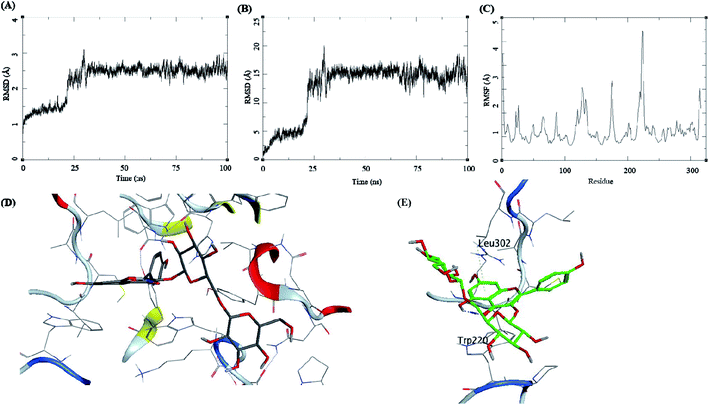
The trajectory analysis of the kaempferol-3-beta-gentiobioside complexed with AKR1B1 is presented in Fig. 8. The protein RMSD during the 100 ns simulation showed a quick transition after 25 ns. The rise in the fluctuations for the protein residues occured between 25–30 ns, and then the trajectory converged towards a stable RMSD between 2–3 Å. The overall fluctuation was 1 Å from 30 to 100 ns of MD simulation (Fig. 8A). The ligand RMSD showed a similar trend; initially, the RMSD fluctuated between 0–15 Å. Then an abrupt fluctuation of about 10 Å was observed. Later, the RMSD stabilized between 12.5 to 17.5 Å during the remaining 25–100 ns, which accounted for an average RMSD of 5 Å (Fig. 8B). The RMSF for protein amino acid residues was high for almost all the regions of the protein, between 0.5 to 3 Å. The residues from 210 to 225 showed higher RMSF of up to 4.5 Å (Fig. 8C). The initial frame of this complex showed the formation of no hydrogen bonds between the ligand and the receptor (Fig. 8D). The end confirmation from the simulations showed the formation of some new hydrogen bonds between Trp220 and Leu302 (Fig. 8E).
The trajectory analysis of 3-5-di-O-caffeoyl quinic acid complexed with AKR1B1 is presented in Fig. 9. The protein RMSD during the 100 ns simulation showed a stable conformational picture with a low fluctuation in the trajectory RMSD between 1–2 Å. The overall fluctuation was 1 Å for almost all of 100 ns MD simulations (Fig. 9A). The ligand RMSD showed larger fluctuations between 0.5–3.5 Å. Further, an abrupt fluctuation of about 10 Å was also observed. Later, the RMSD stabilized between 12.5 to 17.5 Å during the remaining 25–100 ns, which accounted for an average RMSD of 5 Å's (Fig. 9B). The RMSF for protein amino acid residues was high for almost all the regions of the protein, between 0.5 to 3 Å. The residues within 210 to 225 reflected higher RMSF of up to 4.5 Å (Fig. 9C). The initial frame of this complex showed the formation of hydrogen bonds between the ligand and the receptor residues Trp112, Asp44, Cyc299, and Trp220 (Fig. 9D). The end confirmation from the simulations showed the formation of new hydrogen bonds between Leu301 and the loss of other hydrogen bonds observed previously (Fig. 9E).
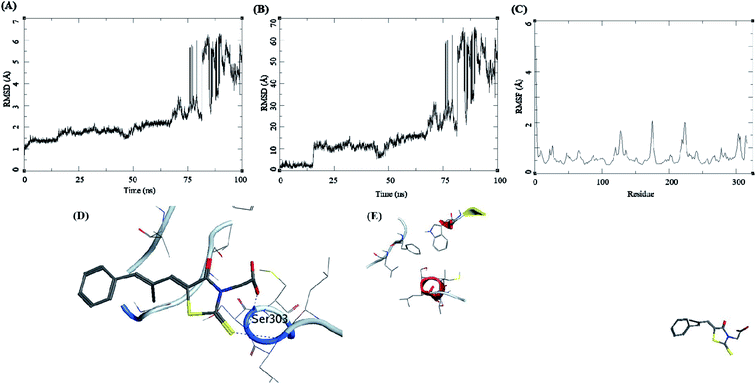
The trajectory analysis of epalrestat complexed with AKR1B1 is presented in Fig. 10. The protein RMSD during the 100 ns simulation showed a gradual rise in RMSD for 60 ns of the trajectory, after which was a high rate of fluctuation levelling up to 6.5 Å (Fig. 10A). The ligand RMSD had lower RMSD i.e. 5 Å, but later the fluctuations rose significantly, suggesting a breakdown of the complex (Fig. 10B). The RMSF for protein amino acid residues was low between 0.5 to 2 Å (Fig. 10C). The initial frame of this complex showed the formation of hydrogen bonds between the ligand and the receptor residue Ser303 (Fig. 10D). The end confirmation from the simulations shows a complex breakdown, and the ligand had fallen out of the receptor binding site (Fig. 10E).
The MMGBSA calculations were performed on the complete trajectories to study the binding energy of the complexes; mentioned in Table 6. The contribution from various parameters are summarized in the table for the four complexes studied in the MD simulations.
| Compounds | MM-GBSA | ||||||
|---|---|---|---|---|---|---|---|
| ΔEVDW | ΔEELE | ΔGGB | ΔGSurf | ΔGgas | ΔGSol | ΔGbind | |
| a ΔEVDW = van der Waals contribution from MM; ΔEELE = electrostatic energy as calculated by the MM force field; ΔGGB = the electrostatic contribution to the solvation free energy calculated by GB; ΔGSurf = solvent-accessible surface area; ΔGSol = solvation free energy; ΔGgas = gas phase interaction energy; ΔGbind = binding free energy. | |||||||
| Quinate | −49.66 (4.94) | −47.01 (12.56) | 62.60 (7.91) | −7.54 (0.45) | −95.38 (12.97) | 55.05 (7.64) | −40.33 (6.69) |
| Gentiobioside | −29.82 (8.44) | −18.84 (10.91) | 35.17 (12.18) | −3.91 (1.25) | −63.24 (16.70) | 31.25 (11.14) | −31.98 (7.28) |
| Quinic acid | −40.05 (3.73) | 33.99 (16.35) | −4.51 (10.90) | −5.80 (0.44) | −3.34 (15.30) | −10.32 (10.79) | −13.66 (7.04) |
| Epalarestat | −12.41 (8.46) | −24.88 (31.74) | 33.73 (32.82) | −1.62 (1.08) | −39.83 (35.02) | 32.10 (32.49) | −7.72 (4.87) |
4. Discussion
Traditional medicinal plants have played a vital role in drug discovery from ancient times. Many well-known bioactives have been derived from the plant origin either based on the traditional claim or independent of traditional knowledge; they are analogous to the core structure or secondary metabolites.27 C. glauca is reported to lower the blood glucose in streptozotocin-induced diabetes mellitus.18 Further, a record has been made to report its efficacy to inhibit enzymes involved in post-prandial hyperglycemia i.e., α-amylase and α-glucosidase enzymes proposing evidence of its anti-diabetic property.20 The current drug discovery proceedings involve using in silico tools to predict possible molecular mechanisms, which further adds-on support to in vitro and in vivo models.28Network pharmacology provides an overview of predicting the medicinal plant's possible molecular mechanism via multi-compounds and multi proteins interaction.29 In the present study, among two hundred and sixteen targets of diabetes mellitus (as recorded by the therapeutic target database), twenty-three bioactives of C. glauca were identified to regulate eighty-four proteins accountable for hyperglycemia. Previously it has been demonstrated that traditional medicinal plants may possess its anti-diabetic activity via their action over multiple proteins involved in pathogenesis but may not rely on one pathway or one protein, as explained previously.30 Similarly, during the query of targets of bioactives, cassiarin B was predicted to modulate the maximum number of genes i.e. 24 (HSD11B1, SYK, AKR1B1, PARP1, ADAM17, P2RX7, HSP90AA1, ESR1, PTGS2, AURKA, AURKB, MAPKAPK2, PTPN1, CCR5, KDR, HDAC6, CFD, MAPK8, HDAC1, SCD, CSF1R, PIK3CG, CTSS, HSD11B2) in which maximum bio-actives majorly targeted AKR1B1; AKR1B1 is associated with the progression of the vascular complications such as diabetic nephropathy, diabetic retinopathy, and stroke.31
Similarly, the PI3K-Akt pathway was modulated based on the gene counts, i.e. 14 (RAF1, PDGFRA, PDGFRB, KDR, CSF1R, INSR, GSK3B, HSP90AA1, PIK3CG, TLR4, SYK, ITGA4, JAK3, FGFR1). Phosphatidyl inositol 3-kinase (PI3K) plays a crucial role in mediating insulin's metabolic effects. AKT/protein kinase B is involved in regulating the activity of numerous targets, including transcription factors and kinases, and other regulatory molecules.32 This report suggests that PI3K-Akt regulators are efficacious in managing cases of diabetic retinopathy.33 Likewise, in the present study, cytokine–cytokine receptor interaction was the second major pathway which was modulated with the regulation of 9 genes, i.e. PDGFRA, PDGFRB, KDR, CSF1R, CCR5, CCR1, CXCL8, CCR4, TNF; reports have been made to point the increase in inflammatory markers such as C-reactive protein, plasminogen activator inhibitor-1, and other cytokines in insulin-resistant states without diabetes.34,35
Further, the drug-likeness of the molecule provides an idea of how the molecule is likely to behave in vivo, including the characters of molecular weight, the number of hydrogen bond donors, acceptors, and lipophilicity for its oral bioavailability.36 Among the twenty-three bio-actives, fourteen were predicted to possess a positive drug-likeness score indicating their probability for oral intestinal absorption. Likewise, the ADMET profile predicts the pharmacokinetic and pharmacodynamic parameters of the drug molecule such as intestinal absorption, BBB permeability, water-solubility, plasma protein binding, drug metabolism, hepatotoxicity, and other parameters,37 which were also predicted for individual bioactives.
The target AKR1B1 was chosen for docking as it was linked with the majority of bioactives in the combined bioactive-protein-pathway network. Among the bio-actives modulating AKR1B1, four molecules, i.e. cassiarin B, cinnamic acid, cassiarin A, and norrubrofusarin were with the molecular weight of <500 daltons in which cassiarin B possessed the docking score of −7.903. Similarly, cassiaoccidentalin B was predicted to have the highest drug-likeness score of 0.84 and possessed a docking score of −7.839. Earlier studies have reported the binding affinity of cassiaoccidentalin B as α-glucosidase and α-amylase inhibitor,12 which may also contribute to managing post-prandial hyperglycemia.
The molecular mechanism of any plant may not be justified by a single compound or a single target but may be implicated via multiple bio-actives and their target interactions.38 In this regard, among the multiple bioactives of C. glauca, cassiarin B modulated 24 different proteins in which PTPN1 was primarily regulated. Further, PTPN1 negatively regulates insulin signaling by dephosphorylating the phosphotyrosine residues of the insulin receptor kinase activation segment. Moreover, PTPN1 gets activated through 3 pathways, i.e. insulin resistance, insulin signaling pathway, and adherens junction pathway, which could be regulated and may play an important role in manipulating the pathogenesis of hyperglycemia. Although, it would be complex to define the exact molecular mechanism of C. glauca due to the combined effect of multiple bio-actives by acting on various proteins to maintain the glucose homeostasis, from the present findings it can be speculated that, the PI3K-Akt signaling pathway could be regulated as all the bio-actives majorly modulated it, and cassiarin B and cinnamtannin A2 could be the lead hits for this action.
The molecular dynamics simulation of the three natural bioactives and one standard drug molecule gives an elaborating insight into the binding of these molecules with the active site of the receptor AKR1B1. These molecules were selected based on their docking profile, scoring, and interaction with the residues in the active site. The compound methyl 3-5-di-O-caffeoyl quinate complexed with AKR1B1 showed the best profile concerning binding energy at −40.33 ± 6.69 kcal mol−1. This compound showed better stability during the simulation with low RMSD and higher stability of the complex compared to kaempferol-3-beta-gentiobioside, and 3-5-di-O-caffeoyl quinic acid. These ligands formed several hydrogen bonds with the receptor residues, but these were not the same in each case; this could be attributed to the large volume of the receptor surface and its shallow nature.
The compound methyl 3-5-di-O-caffeoyl quinate retained its interaction with Ile261 and His111, suggesting that these are important residues in the active site or form stronger hydrogen bonds which is also dependent on the conformation and the flexibility this molecule possess. The compound kaempferol-3-beta-gentiobioside formed hydrogen bonds with the Trp220 and Leu302 towards the end of the simulation; this was the reason for its stable ligand RMSD and protein RMSD. The compound 3-5-di-O-caffeoyl quinic acid assumes a linear structure but is highly flexible, and thus it exploreed high conformation space, which is evident from its ligand RMSD plot. The more surprising findings were from the epalrestat-AKR1B1 complex. It showed very low binding energy at −7.72 ± 4.87 kcal mol−1. The reason could be the instability of the complex. The ligand "fell off" from the complex at about 70 ns giving rise to high RMSD for ligand; the visualization of MD trajectory showed that the ligand ends up at the box boundaries (Fig. 10E). The MD studies suggest methyl 3-5-di-O-caffeoyl quinate–AKR1B1 complex as the best complex from the set of molecules under investigation with better binding and energy profiles.
In addition, the progression of T2DM is directly concerned with insulin resistance. In this regard, we mapped the KEGG regulated proteins within the KEGG insulin resistance pathway (entry hsa04931) in which we identified compounds that could act over PI3K; involved in insulin sensitivity, GSK3; involved in glycogenesis, TNF-α; reduces oxidative stress, PPAR; reduced fatty acid efflux, ACC-β; controls fatty acid oxidation, and IRS-1, and Akt; improves insulin sensitivity. These points are directly concerned with the development of insulin resistance-mediated diabetes mellitus. Since most of the compounds-mediated proteins interactions identified these pathways, it can be assumed that C. glauca can act over the upregulation of insulin sensitivity, promotes glycogenesis, reduces oxidative stress, and attenuates the free fatty acid metabolism (Fig. 11).
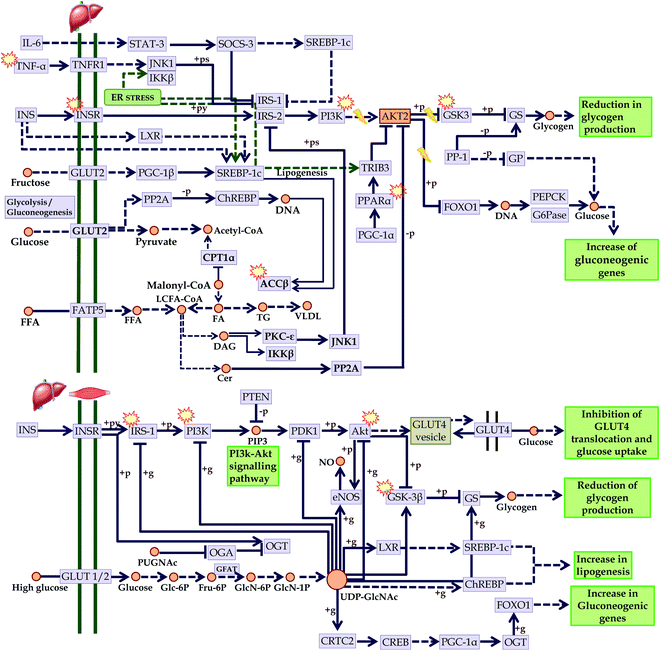 | ||
Fig. 11 Checkpoints affected by the bioactives of C. glauca in insulin resistance (KEGG entry: hsa04931) in liver and skeletal muscle.  Targeted points by the bioactives. Targeted points by the bioactives. | ||
5. Conclusion
The anti-diabetic effect of C. glauca may be due to bio-actives like cassiarin B, cassiaoccidentalin B, 3-5-di-O-caffeoyl quinate, and cinnamtannin A2, which were predicted to be involved in the regulation of the majority of proteins associated with the pathogenesis of diabetes mellitus. Further, the PI3K-Akt pathway was majorly modulated, and AKR1B1 was the majorly modulated protein. However, the present findings are based on the computational approaches that need to be further validated using in vitro and in vivo protocols.Ethical statement
This work did not include any human or animal participation.Funding
This work did not receive any funding from any national or international agencies to declare.Conflicts of interest
All the authors of this manuscript have no conflict of interest in any financial and non-financial means.Acknowledgements
The authors are thankful to Principal, KLE College of Pharmacy Belagavi for their support in conducting this work.References
- M. Roden, Wien Klin. Wochenschr., 2016, 128, S37–S40 CrossRef PubMed.
- D. Glovaci, W. Fan and N. D. Wong, Curr. Cardiol. Rep., 2019, 21, 21 CrossRef PubMed.
- A. D. Deshpande, M. Harris-Hayes and M. Schootman, Phys. Ther., 2008, 88, 1254–1264 CrossRef PubMed.
- P. Saeedi, I. Petersohn, P. Salpea, B. Malanda, S. Karuranga, N. Unwin, S. Colagiuri, L. Guariguata, A. A. Motala, K. Ogurtsova and J. E. Shaw, Diabetes Res. Clin. Pract., 2019, 157, 107843 CrossRef PubMed.
- S. Kulkarni, P. S. R. Dwivedi, A. N. Danappanvar, B. A. Subhash and B. M. Patil, In Silico Pharmacol., 2021, 9, 50 CrossRef PubMed.
- American Diabetes Association, Diabetes Care, 2014, 37, S81–S90 CrossRef PubMed.
- P. S. Dwivedi, V. P. Rasal, E. Kotharkar, S. Nare and P. Khanal, J. Diabetes Metab. Disord., 2021, 20, 369–375 CrossRef CAS PubMed.
- M. Knip and H. Siljander, Autoimmun. Rev., 2008, 7, 550–557 CrossRef CAS PubMed.
- J. L. Leahy, Arch. Med. Res., 2005, 36, 197–209 CrossRef CAS PubMed.
- P. Khanal and B. M. Patil, J. Integr. Med., 2021, 19, 66–77 CrossRef PubMed.
- P. S. R. Dwivedi, P. Khanal, V. P. Gaonkar and V. P. Rasal, In Silico Pharmacol., 2021, 9, 30 CrossRef PubMed.
- A. Chaudhury, C. Duvoor, V. S. Reddy Dendi, S. Kraleti, A. Chada, R. Ravilla, A. Marco, N. S. Shekhawat, M. T. Montales, K. Kuriakose, A. Sasapu, A. Beebe, N. Patil, C. K. Musham, G. P. Lohani and W. Mirza, Front. Endocrinol., 2017, 8, 6 Search PubMed.
- P. S. R. Dwivedi and V. P. Rasal, J. Phytopharm., 2020, 9, 38–45 CrossRef CAS.
- B. Moradi, S. Abbaszadeh, S. Shahsavari, M. Alizadeh and F. Beyranv, Biomed. Res. Ther., 2018, 5, 2538–2551 CrossRef.
- A. Karimi, M. Majlesi and M. Rafieian-Kopaei, J. Nephropharmacology, 2015, 4, 27–30 CAS.
- M. Farswan, P. M. Mazumder and V. Percha, Indian J. Pharmacol., 2009, 41, 19–22 CrossRef PubMed.
- D. Kumar, A. Singh, A. Sanghi, R. Chandra and S. Arora, Int. J. Res. Pharm. Sci., 2017, 8, 129–134 CAS.
- M. D. Salahuddin, S. S. Jalalpure and N. B. Gadge, Can. J. Physiol. Pharmacol., 2010, 88, 153–160 CrossRef CAS PubMed.
- V. P. Veerapur, V. Pratap, B. S. Thippeswamy, P. Marietta, P. Bansal, P. V. Kulkarni and V. H. Kulkarni, J. Ethnopharmacol., 2017, 198, 489–498 CrossRef CAS PubMed.
- S. G. Ternikar, M. B. Patil, I. Pasha and P. Khanal, J. Diabetes Metab. Disord., 2020, 19, 683–689 CrossRef CAS PubMed.
- M. Farswan, P. M. Mazumder and V. Percha, Indian J. Pharmacol., 2009, 41, 19–22 CrossRef PubMed.
- S. G. Ternikar, M. B. Patil, I. Pasha and P. S. R. Dwivedi, J. Diabetes Metab. Disord., 2021, 20, 1239–1246 CrossRef CAS.
- A. Daina, O. Michielin and V. Zoete, Nucleic Acids Res., 2019, 47, W357–W364 CrossRef CAS PubMed.
- H. Yang, C. Lou, L. Sun, J. Li, Y. Cai, Z. Wang, W. Li, G. Liu and Y. Tang, Bioinformatics, 2019, 35, 1067–1069 CrossRef CAS PubMed.
- D. Szklarczyk, J. H. Morris, H. Cook, M. Kuhn, S. Wyder, M. Simonovic, A. Santos, N. T. Doncheva, A. Roth, P. Bork and L. J. Jensen, Nucleic Acids Res., 2017, 45, D362–D368 CrossRef CAS PubMed.
- P. Shannon, A. Markiel, O. Ozier, N. S. Baliga, J. T. Wang, D. Ramage, N. Amin, B. Schwikowski and T. Ideker, Genome Res., 2003, 13, 2498–2504 CrossRef CAS PubMed.
- T. G. Tolstikova, M. V. Khvostov and A. O. Bryzgalov, Mini Rev. Med. Chem., 2009, 9, 1317–1328 CrossRef CAS PubMed.
- S. Ekins, J. Mestres and B. Testa, Br. J. Pharmacol., 2007, 152, 9–20 CrossRef CAS PubMed.
- S. Li and B. Zhang, Chin. J. Nat. Med., 2013, 11, 110–120 CrossRef PubMed.
- P. Khanal and B. M. Patil, 3 Biotech, 2021, 11, 238 CrossRef PubMed.
- N. Kaur and V. Vanita, Diabetes Res. Clin. Pract., 2016, 121, 41–48 CrossRef CAS PubMed.
- S. A. Khorami, A. R. Movahedi, K. Huzwah and A. M. Sokhini, Ann. Med. Biomed. Sci., 2015, 1, 46–55 Search PubMed.
- A. Maffei, G. Lembo and D. Carnevale, Int. J. Mol. Sci., 2018, 19, 4098 CrossRef PubMed.
- G. L. King, J. Periodontol., 2008, 79, 1527–1534 CrossRef CAS PubMed.
- S. M. Haffner, Am. J. Cardiol., 2003, 92, 18–26 CrossRef.
- D. E. Clark and S. D. Pickett, Drug Discov. Today, 2000, 5, 49–58 CrossRef CAS PubMed.
- L. L. Ferreira and A. D. Andricopulo, Drug Discov. Today, 2019, 24, 1157–1165 CrossRef CAS PubMed.
- T. Duyu, P. Khanal, N. A. Khatib and B. M. Patil, Indian J. Pharm. Educ., 2020, 54, 732–739 CrossRef CAS.
Footnote |
| † Electronic supplementary information (ESI) available. See DOI: 10.1039/d1ra07661b |
| This journal is © The Royal Society of Chemistry 2021 |

