DOI:
10.1039/D1RA06227A
(Paper)
RSC Adv., 2021,
11, 39349-39361
Unravelling the anticancer potential of a square planar copper complex: toward non-platinum chemotherapy†
Received
17th August 2021
, Accepted 20th November 2021
First published on 10th December 2021
Abstract
Coordination compounds from simple transition metals are robust substitutes for platinum-based complexes due to their remarkable anticancer properties. In a quest to find new metal complexes that could substitute or augment the platinum based chemotherapy we synthesized three transition metal complexes C1–C3 with Cu(II), Ni(II), and Co(II) as the central metal ions, respectively, and evaluated them for their anticancer activity against the human keratinocyte (HaCaT) cell line and human cervical cancer (HeLa) cell lines. These complexes showed different activity profiles with the square planar copper complex C1 being the most active with IC50 values lower than those of the widely used anticancer drug cisplatin. Assessment of the morphological changes by DAPI staining and ROS generation by DCFH-DA assay exposed that the cell death occurred by caspase-3 mediated apoptosis. C1 displayed interesting interactions with Ct-DNA, evidenced by absorption spectroscopy and validated by docking studies. Together, our results suggest that binding of the ligand to the DNA-binding domain of the p53 tumor suppressor (p53DBD) protein and the induction of the apoptotic hallmark protein, caspase-3, upon treatment with the metal complex could be positively attributed to a higher level of ROS and the subsequent DNA damage (oxidation), generated by the complex C1, that could well explain the interesting anticancer activity observed for this complex.
1. Introduction
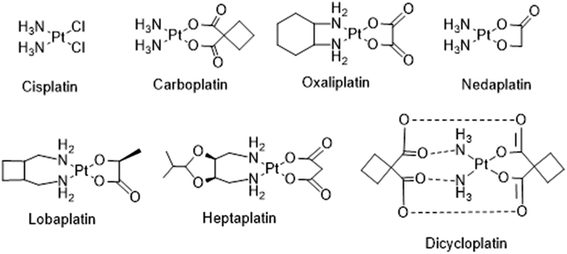
Cancer, also called malignancy, is one of the major health problems in the world and has a major impact on the socioeconomic condition of several countries. It is one of the prominent causes of death in the United States, causing more than half a million deaths.1 There are more than 100 types of cancers that can begin in various tissues and organs. Each cancer type is a result of various genetic and epigenetic alterations.2–5 Moreover, DNA damage caused by natural processes or by genotoxic agents has been correlated to be the causative agent for several diseases including cancer.6 Cancer treatment may include chemotherapy, radiation, immunotherapy and/or surgery. However, chemotherapy remains one of the preferred treatments of choice, involving various natural and synthetic compounds that have potential to kill or check the unwanted cancer cell growth. The discovery and the use of metal-based drugs offers much promise for cancer chemotherapy, which gained momentum after the serendipitous discovery of cisplatin by Barnett Rosenberg in 1960, is being clinically used for the treatment of solid malignancies.7 Among the 4000 plus platinum drugs tested as promising anticancer agents, only cisplatin, carboplatin and oxaliplatin are approved worldwide and the other three, nedaplatin, lobaplatin and heptaplatin (Fig. 1) have clinical approval in Japan, China and South Korea, respectively.8,9 Nevertheless, the issues of systemic toxicity, drug resistance and limited therapeutic window have motivated researchers to look for alternative cancer therapies which involves the use of drugs or other compounds against the specific biomolecules like enzymes, proteins, DNA/RNA and cancer specific pathways involved in cancer cell growth.10–14
 |
| | Fig. 1 Molecular structures of some platinum anticancer drugs that are approved or undergoing clinical trials. | |
P53 is an important cellular gene and is a well-studied transcription factor. p53, commonly referred as “guardian of the genome”, is a tumour suppressor protein whose primary function is to maintain cellular homeostasis and is activated upon cellular stress.15,16 It protects cells from several genotoxic challenges like hypoxia, free radicals, DNA damage, and UV light.17 Upon DNA damage, p53 elicit a multifaceted response in the cell and it decides various important cellular processes like DNA repair, cell cycle arrest and apoptosis, thereby maintaining the genomic integrity of the cells.18,19 Unlike, other cellular transcription factors, p53 is known to be mutated in almost all types of cancer. Around 50% of human cancers have mutation in p53 gene suggesting its importance in cancer biology. P53 also plays important role in response to the several chemotherapeutic agents.20 In response to widely used Platinum drugs like cisplatin and oxaliplatin, p53 plays a deciding role in inducing cell-cycle arrest or apoptosis. Lack of p53 function is also linked to cisplatin resistance.21,22 Moreover, p53 has also emerged as an attractive drug target which has led to recent discoveries of several small molecules targeting p53 and some are in clinical trials.23,24
Improving the design of metal-based drugs devoid of undesirable side effects and having different mechanism of action is a real challenge to the scientific community. In recent years, several transition metal-complexes have been investigated as purposive and apt alternatives to platinum-based drugs.25 A plenty of Schiff base metal chelates currently known are recognized as potential pharmacological agents and have received considerable attention in the field of medicine.26 Metal complexes including iron (Fe), cobalt (Co), nickel (Ni), copper (Cu), zinc (Zn), gold (Au), and palladium (Pd) have displayed promising results in cancer therapy.27–29 Cu is a nontoxic endogenous essential element. Its complexes have attained special interest as they trigger apoptotic cell death by stimulating proapoptotic proteins or antiapoptotic proteins.30–32 The redox metal Cu has potential to generate ROS that brings about the oxidative damage of biomolecules like proteins, lipids, DNA and RNA. Hence a conceivable strategy is to develop robust metal complexes of cheaper transition metals as new anti-cancer chemotherapeutics.33
In continuation of our work on the design and synthesis of metal based chemotherapeutic antitumor agents,34 we herein report the synthesis of Cu, Ni, and Co complexes from a Schiff base ligand (SB) derived from the condensation reaction of 2-hydroxynapthaldehyde with 1, 4-benzodioxan-6-amine. These metal complexes were investigated for their in vitro anticancer activity against human cervical (HeLa) and human keratinocyte (HaCaT) cancer cell lines. DNA binding potential were assayed using spectroscopic methods. In addition, ROS generation, cell cycle analysis, DNA damage assay, apoptotic pathway analysis (caspase-3 assay) and molecular docking studies were carried out to support the results of cancer cell cytotoxicity. Since, DNA is not always the primary target of metal based anticancer molecules,35,36 we also explored the ability of these metal complexes to bind an important cellular transcription factor protein, p53, which is an important regulator of cell growth and cell death pathways.19–21 Our molecular docking results suggest that the ligand binds to the central, highly conserved DNA-binding domain region of p53 (p53DBD), that could further activate the cancer cell DNA damage, which in turn could trigger the cell signalling pathways leading to cancer cell death.
2. Experimental section
2.1. Materials and methods
The reagents used in the synthesis of the ligand and its transition metal complexes were obtained from commercial sources and used as received without further purifications. Solvents were dried and distilled prior to their use, following standard procedures. 3-(4,5-Dimethylthiazol-2-yl)-2,5-diphenyltetrazolium bromide (MTT) was purchased from Hi-Media. Calf Thymus (CT) DNA was purchased from Bangalore Genie (India). The elemental microanalyses of the synthesized compounds were performed at centre instrumentation facility, Jamia Millia Islamia using Elementar (Thermo Scientific) CHN Elemental analyzer. 1H- (400 MHz) and 13C- (100 MHz) NMR spectra were run on a Bruker spectrometer using tetramethylsilane [Si(CH3)4] as the internal reference. FTIR and electronic absorption spectra were recorded on a Bruker Alpha Fourier transform infrared (FT-IR) spectrometer and a PerkinElmer LAMBDA 40 UV/visible spectrophotometer, respectively. Molar conductance values of the complexes were obtained using a type 305 Systronics conductivity bridge in DMSO solution. Electrospray ionization mass spectrometric data (ESI-MS) were acquired in methanol on a Bruker Micro TOF QII, and a Thermo Finnigan LCQ Advantage Max ion trap Mass Spectrometer. The magnetic susceptibility data of the synthesized complexes was obtained by using the Faraday balance. Powder X-ray diffraction patterns of all compounds were carried out at room temperature using XPERT-PRO, X-ray diffractometer using CuKα monochromatic radiation (λ = 1.5406 Å) in the range of 10° ≤ 2θ ≤ 70°. The thermogravimetric analysis (TGA) of the synthesized complexes was performed in the temperature range of 40–800 °C in a dynamic nitrogen atmosphere with a heating rate of 10 °C min−1 using Exstar 6300 Thermogravimetric analyzer.
2.2. Synthesis
2.2.1. Synthesis of 1-[(2,3-dihydro-benzo[1,4]dioxin-6-ylimino)-methyl]-naphthalen-2-ol (SB). To a solution of 2-hydroxynaphthaldehyde (172 mg, 1 mmol) in dry methanol (5 mL) 1,4-benzodioxan-6-amine (151 mg, 1 mmol) dissolved in dry methanol (5 mL) was added in fractions, dropwise over 15 minutes and the reaction mixture was stirred for 4 h at room temperature. Completion of the reaction was monitored by TLC and after that the solvent was removed under reduced pressure. The residue thus obtained was collected, dried and recrystallized in ethanol. Crystals suitable for X-ray diffraction were obtained after two days.Yield: 88% (0.27 g) color: golden yellow; mp: 121 °C. Mol. wt 305.11, anal. calc for C19H15NO3: C, 74.74; H, 4.95; N, 4.59. Found: C, 74.35; H, 4.87; N, 4.65. IR (KBr disc, cm−1): 3430.25 (ph-OH), 1608.77 (C![[double bond, length as m-dash]](https://www.rsc.org/images/entities/char_e001.gif) N), 3055.16 (aromatic C–H), 2880.40 (CH2), 1485.16 (CC), 1272 (C–O). Mass spectrum (ESI) [M + Na]+ = 328.09. UV-vis (DMSO): λ/nm 272, 352. 1H-NMR (DMSO-d6, δ, ppm); 9.59 (1H, s, HCN), 15.90 (1H, s, Ar-OH), 6.94–8.52 (m, Ar-H), 4.29 (4H, s, CH2). 13C-NMR (DMSO-d6, δ, ppm); 155.80 (CHN), 144.96 (C–N), 170.05 (C–OH),143.38 (C–O), 109.46–138.76 (Ar C's), 65.05–65.09 (–OCH2).
N), 3055.16 (aromatic C–H), 2880.40 (CH2), 1485.16 (CC), 1272 (C–O). Mass spectrum (ESI) [M + Na]+ = 328.09. UV-vis (DMSO): λ/nm 272, 352. 1H-NMR (DMSO-d6, δ, ppm); 9.59 (1H, s, HCN), 15.90 (1H, s, Ar-OH), 6.94–8.52 (m, Ar-H), 4.29 (4H, s, CH2). 13C-NMR (DMSO-d6, δ, ppm); 155.80 (CHN), 144.96 (C–N), 170.05 (C–OH),143.38 (C–O), 109.46–138.76 (Ar C's), 65.05–65.09 (–OCH2).
2.2.2. Synthesis of [Cu(SB)2] (C1). To a 10 mL yellow methanolic solution of SB (152 mg, 0.5 mmol), a methanol solution of CuCl2·2H2O (43 mg, 0.25 mmol, 10 mL) was added dropwise with gentle stirring. One to two drops of triethylamine (20 μL) were added to the reaction mixture to adjust the pH to 7. The mixture was stirred for 3 h at room temperature resulting in the formation of light green precipitate which was filtered and dried in a vacuum desiccator. Several attempts of recrystallization didn't produce any crystals.Yield: 89 mg (53% based on CuII salt). Color: light green; mp: 222 °C. Mol. wt 671.12. IR (KBr disc, cm−1): 1576, 2910, 1502, 1143, 547, 437. Elemental analysis (%): calc. for C38H28CuN2O6: C, 67.90; H, 4.20; N, 4.17. Found: C, 67.83; H, 4.36; N, 4.22. Mass spectrum (ESI) [ML]+ = 671.13. UV-vis (DMSO): λ/nm 289, 434, 576. Molar conductance (1.0 × 10⁻⁴ M; DMSO, Ω−1 cm2 mol−1): 23.
2.2.3. Synthesis of [Ni(SB)2] (C2). Complex C2 was synthesized by a method similar to that of C1 using NiCl2·6H2O (59 mg, 0.25 mmol) as the metal salt. Dark green precipitate was collected from the final reaction mixture which after filtration and several washings with cold methanol and diethyl ether was dried in a vacuum desiccator.Yield: 79 mg (48% based on NiII salt). Color: dark green; mp: 227 °C. Mol. wt 666.13, IR (KBr disc, cm−1): 1598, 2975, 1498, 1153, 545, 431. Elemental analysis (%): calc. for C38H28NiN2O6: C, 68.39; H, 4.23; N, 4.20. Found: C, 68.43; H, 4.13; N, 4.20. Mass spectrum (ESI) [ML]+ = 666.15. UV-vis (DMSO): λ/nm 276, 362, 515. Molar conductance (1.0 × 10⁻⁴ M; DMSO, Ω−1 cm2 mol−1): 18.
2.2.4. Synthesis of [Co(SB)2] (C3). To a 10 mL ethanol solution of SB (152 mg, 0.5 mmol) and CoCl2·6H2O (59 mg, 0.25 mmol) in the ratio of 2![[thin space (1/6-em)]](https://www.rsc.org/images/entities/char_2009.gif) :1 (L:M), triethylamine (20 μL) was added dropwise under stirring to adjust the pH to 7. The mixture was stirred at room temperature for about 4 h. The resulting brick red precipitate obtained was filtered, washed several times with cold methanol and diethyl ether and then left to stand at room temperature for drying in a vacuum desiccator.
:1 (L:M), triethylamine (20 μL) was added dropwise under stirring to adjust the pH to 7. The mixture was stirred at room temperature for about 4 h. The resulting brick red precipitate obtained was filtered, washed several times with cold methanol and diethyl ether and then left to stand at room temperature for drying in a vacuum desiccator.Yield: 72 mg (43% based on CoII salt). Color: brick red; mp: 212 °C. Mol. wt 667.12. IR (KBr disc, cm−1): 1583, 2934, 1494, 1284, 547, 476. Elemental analysis (%): calc. for C38H28CoN2O6: C, 68.37; H, 4.23; N, 4.20. Found: C, 68.33; H, 4.24; N, 4.17. Mass spectrum (ESI) [ML]+ = 667.13. UV-vis (DMSO): λ/nm 267, 337, 603. Molar conductance (1.0 × 10⁻⁴ M; DMSO, Ω−1 cm2 mol−1): 20.
2.3. Crystal structure determination
Crystal suitable for single crystal X-ray diffraction analysis were obtained on slow evaporation of an ethanolic solution of the ligand (SB) at room temperature. Selected crystal data of the ligand molecule (SB) is given in Tables S1 and S2.† X-ray diffraction data of the ligand (SB) was collected on a Bruker SMART CCD diffraction using graphite-monochromated Mo Kα radiation (k = 0.71073 Å) by u and x scans. X-ray data reduction structure solution and refinement were done using the SHEL XS-97 and SHELXL-97 packages.37 The structure was solved by direct methods. Structural information for the compound has been deposited at the Cambridge Crystallographic Data Centre (CCDC).
2.4. Cell culture
Human cervical cancer (HeLa) cells and the spontaneously immortalized human keratinocyte line (HaCaT) were maintained in complete Dulbecco's modified Eagle medium (DMEM) consisting with 10% fetal bovine serum (FBS) supplemented with 20 mM L-glutamine, 100 units per mL penicillin and 100 μg mL−1 streptomycin at 37 °C under a humidified atmosphere of 5% CO2.38
2.5. Cell viability and proliferation assay/MTT assays
HaCaT and HeLa cell lines were used to determine the anticancer and cytotoxic activity in this study. Cell viability was checked by the MTT assay which is a colorimetric assay based on the conversion of the yellow tetrazolium salt MTT to purple formazan crystals after reaction with mitochondrial dehydrogenase of metabolically active cells. Stock solutions of the complexes C1–C3 were prepared in DMSO and diluted with DMEM (the final concentration of DMSO did not exceeded 1% v/v). The cell lines were maintained in complete DMEM (a culture medium consisting 10% fetal bovine serum, supplemented with 20 mM L-glutamine, 100 units per mL penicillin and 100 μg mL−1 streptomycin) at 37 °C under a humidified atmosphere of 5% CO2. Briefly, 1 × 10⁵ HaCaT and HeLa cancer cells were seeded in two different 96 well cell culture plates. After 24 h, the culture medium was replaced by a fresh medium containing various concentrations of complexes C1–C3 and incubated further for 24 and 48 h respectively under a 5% CO2 humidified atmosphere. The medium was then removed and 100 μL of fresh medium and 25 μL of 5 mg mL−1 MTT in phosphate buffered saline (PBS, pH 7.4) were added to each well for an additional 4 h. Finally, DMSO was added to dissolve the MTT formazan crystals. The absorbance of samples was measured at 570 nm with an TECAN plate reader. Cytotoxicity effect was revealed as the percentage of treated cells relative to untreated cells at 570 nm. Percent control was calculated using the following formula:
| % Control = [Mean O. D. of drug treated well/mean O. D. of control well] × 100 |
2.6. DNA interaction studies
Electronic absorption spectroscopic studies were carried out using fixed concentration of the compounds (SB, C1, C2 and C3) in DMSO solution (1%) with increasing concentration of Ct-DNA in 5 mM Tris HCl/50 mM NaCl buffer, pH 7.5, following an earlier procedure.19,34 The purity of the Ct-DNA was verified by electronic absorption studies following the ratio of absorbances at 260 and 280 nm, which was 1.8 and suggested that the DNA was sufficiently free of protein. The DNA concentration per nucleotide was determined by examining the molar extinction coefficient of 6600 M−1 cm−1 at 260 nm. The intrinsic binding constants ‘Kb’ were calculated from the spectroscopic data using the following equation:| | |
[DNA]/(εa − εf) = [DNA]/(εb − εf) + 1/Kb(εb − εf)
| (1) |
where ‘εf’ and ‘εb’ are the extinction coefficients of the free and fully bound complex, while ‘εa’ is the extinction coefficient observed for the absorption band at a given DNA concentration and Kb is the equilibrium binding constant. From the plot of [DNA]/(εa − εf) versus [DNA], the ratio of the slope to the intercept gives Kb.
2.7. ROS generation assay
Metal-complexes intracellular ROS generation levels were measured by DCFH2-DA (2′,7′-dichlorodihydrofluorescin diacetate) (Sigma-Aldrich). Briefly, HeLa cells (1 × 10⁵ cells per well) were treated with different concentrations of metal-complex based on the IC50 value for 24 h at 37 °C under a humidified atmosphere of 5% CO2. Fluorescent measurement was performed as described previously.39,40
2.8. Fluorescence staining of HeLa cells
Cells were seeded in 96 well plates and kept for 24 h at 37 °C in a humidified atmosphere of 5% CO2. After that, cells were treated with 15 μM concentration of different complexes (C1–C3) for 24 h. Subsequently, cells were washed with 1 × PBS and stained with 4′,6-diamidino-2-phenylindole, (DAPI) (5 μg mL−1) solution. Cells were then washed with PBS and images were taken using a fluorescent microscope (Evos FL, Life technologies) in blue and red channels.38
2.9. DNA oxidation measurement
DNA oxidation measurement was essentially done using 8-oxo detection ELISA kit (Cayman chemicals) according to manufacturer's protocol and as described previously.39 In brief, genomic DNA was extracted after 24 h from HeLa cells treated with different concentrations of metal complexes (5,10,15 μM) as well as from control cells using standard phenol/chloroform method. To prevent accidental DNA oxidation during extraction procedure, cell lysis buffer was supplemented with 1 mM ascorbic acid and 1 mM deferoxamine (iron chelator). Isolated DNA were digested using nuclease P1 (Sigma) followed by alkaline phosphatase (NEB). Samples were prepared and used for ELISA kit.
3. Results and discussion
3.1. Chemistry
The condensation of 2-hydroxynaphthaldehyde with 2,3-dihydro-benzo[1,4]dioxin-6-ylamine in a 1:1 molar ratio in methanol with a catalytic amount of acetic acid at room temperature resulted in the formation of the ligand (SB) (Scheme S1 in ESI†). The metal complexes C1–C3 were obtained by the reaction of the ligand with corresponding metal salts in a 2:1 (L:M) molar ratio in methanol (see Scheme S1 in ESI†). The complexes obtained were non-hygroscopic solids, stable at room temperature, and soluble in CHCl3, DMF, and DMSO. All the compounds were characterized by elemental analyses, 1HNMR, 13CNMR, FTIR, ESI-MS and UV-vis spectral methods. Molar conductance values of the complexes (C1–C3) in 10−5 M DMSO solutions at room temperature were 23 Ω−1 cm2 mol−1, 18 Ω−1 cm2 mol−1 and 20 Ω−1 cm2 mol−1, respectively suggesting the complexes are neutral in nature. The physiochemical data of all the synthesized complexes and the free ligand is given in Table 1.
Table 1 Physicochemical properties of the ligand (SB) and its complexes (C1–C3)
| Compound |
Color |
Mol. formula |
Yield (%) |
Mol. wt |
Mp (°C) |
Λm (Ω−1 cm2 mol−1) |
μeff (BM) |
| SB |
Yellow |
C19H15NO3 |
88 |
305.11 |
121 |
— |
— |
| C1 |
Light green |
[C38H28CuN2O6] |
53 |
671.12 |
222 |
23 |
1.52 |
| C2 |
Dark green |
[C38H28NiN2O6] |
48 |
666.13 |
227 |
18 |
2.82 |
| C3 |
Brick red |
[C38H28CoN2O6] |
43 |
667.12 |
212 |
20 |
3.37 |
The FTIR spectra of the free ligand (SB) clearly shows a sharp peak due to ν(CN) at ca. 1633 cm−1 which favours the condensation reaction and confirms the successful synthesis of the ligand (Fig. S2 in ESI†). In the complexes (C1–C3), the ν(CN) vibration shifted to a lower frequency by ca. 6–19 cm−1. The difference in the stretching C–O vibration bands (ca. 230 cm−1) confirms the bidentate coordination of the ligand with the metal ion. Furthermore, coordination through the azomethinic nitrogen (M − N) and the phenolic oxygen (M − O) was supported by the appearance of additional new bands in the region 560–430 cm−1 (see Fig. S1–S4 in ESI†). The ESI mass spectra of the ligand (SB) and all the complexes (C1–C3) displayed molecular ion peaks at m/z 328.09, 671.12, 666.13 and 667.12 assignable to the corresponding [M + Na]+ and [ML]+ ions, respectively (see Fig. S5–S8 in ESI†).
1H-NMR spectrum of the ligand (SB) gave reasonable peaks which are in accordance to the structure of the compound. A peak at approximately δ 9.59 ppm attributed to the azomethinic hydrogen (–CHN–) while the peak at approximately δ 15.90 ppm may be assigned to the hydrogen of the hydroxyl groups attached to aromatic ring. Meanwhile, the spectrum does not display a peak due to NH2 protons, thus supporting the successful synthesis of Schiff base ligand. Likewise, the sharp signal at δ 4.29 ppm has been assigned to the two equivalent CH2 groups, respectively. The aromatic protons are observed in the range δ 6.94–8.52 ppm. The 13C NMR spectrum of the ligand (SB) showed the imine carbon (CN) peak at 170.05 ppm. The aromatic carbons were observed at 155.80–109.46 ppm and the aliphatic CH2 carbons were recorded at 65.09 ppm, respectively. The 1H-NMR and 13C-NMR spectrum of the Schiff base (SB) ligand is given ESI (see Fig. S9 and S10†).
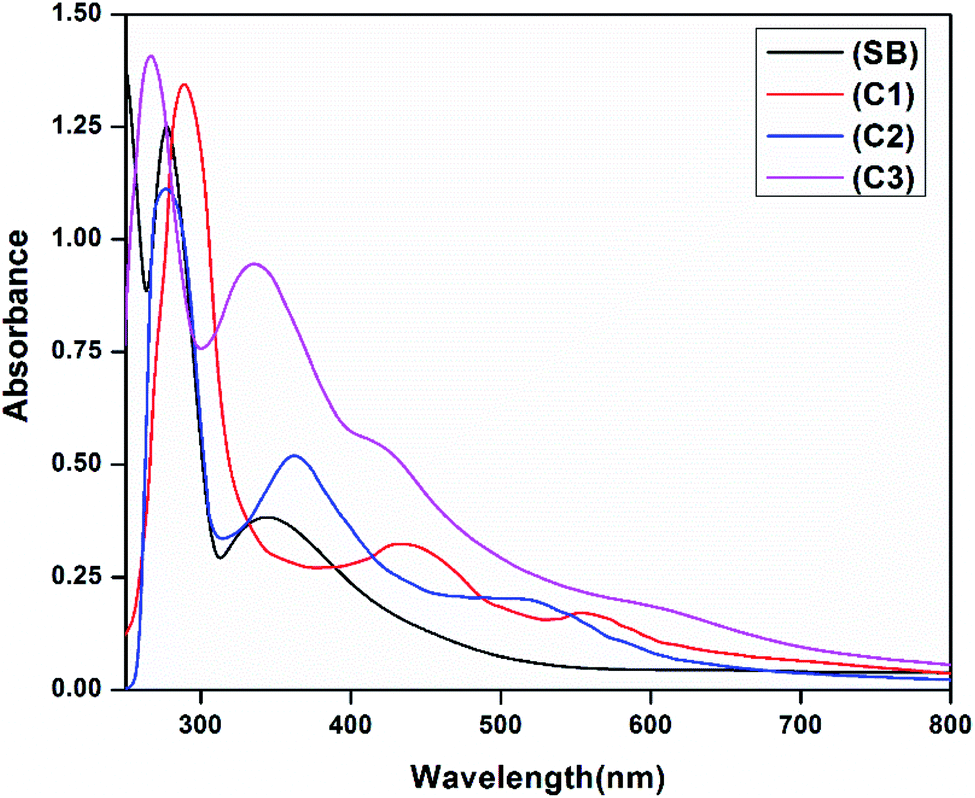
The electronic absorption spectra of the free ligand (SB) and its complexes (C1–C3) in 10−5 M DMSO (Experimental section) show peaks in the UV region at 245, 277 and 345 nm which are attributed to π → π* and n → π* transitions of the free Schiff base ligand. In addition, the broadbands observed in complexes at 436 and 423 nm (C1 and C3) and 362 nm (C2) are assigned to the ligand-to-metal charge transfer transition. The UV-vis. spectrum of complex C1 displayed a band at 576 nm assigned as a 2B1g → 2E1g transition, confirming the square planar geometry around the copper(II) ion. In complex C2 and C3 the absorption bands at 595 and 603 nm are assigned to 3T1(F) → 3T1(P) and 1A1g → 1B1g transitions respectively supporting a tetrahedral geometry for C2 and a distorted square planar geometry for C3.41,42 The electronic spectra of the ligand and the complexes are given in Fig. 2. Besides the observed magnetic moment of the complexes are 1.52 BM for C1 and 3.57 BM for C3 suggesting a square planar geometry around the metal ions. The observed magnetic moment of C2 was found to be 2.82 BM indicating the complex has a tetrahedral structure.42
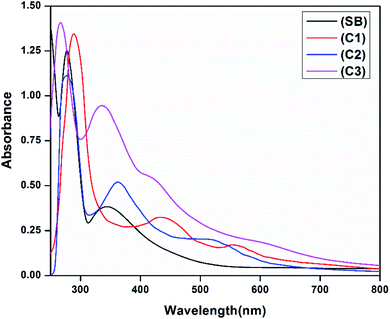 |
| | Fig. 2 Electronic spectra of the ligand (SB) and metal complexes C1–C3. | |
Thermal analysis of the complexes (C1–C3) was carried in the temperature range of 40–800 °C by using thermo gravimetric technique at a heating rate of 10 °C min−1. In complex C1 the decomposition occurs in two stages. The first stage proceeded with the weight loss of 43% (calcd 44.4%) in the temperature range of 222–395 °C which may be attributed to the loss of C16H14N2O4 group. The second decomposition step continued with the weight loss of 45% (calcd 46.25%) in the temperature range of 400–700 °C. This weight loss is due to the loss of C22H14O2 group. The overall weight loss observed in C1 was found to be 89% (calcd 90.65%). The metallic Cu left as the residue has the observed weight of 9.6% against the calculated value of 9.47%. The complexes C2 and C3 displayed similar decomposition steps with slight variations in decomposition temperatures. The TG curves of the complexes (C1–C3) are given in Fig. S11 in ESI.†
3.2. Crystal structure and XRD
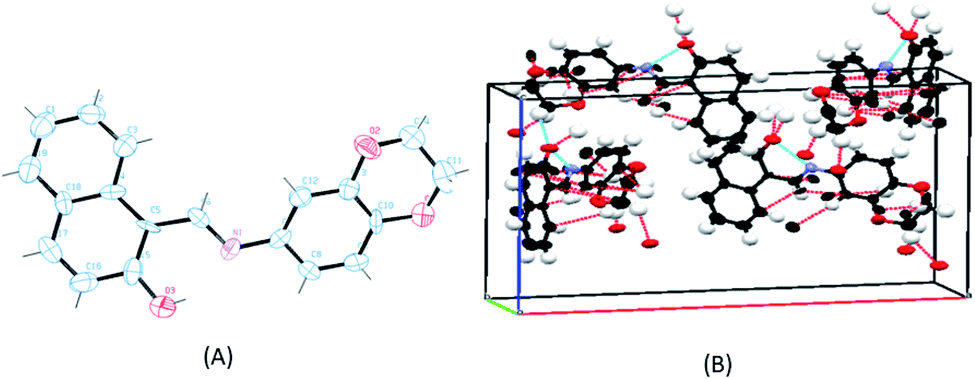
Single crystals for the ligand SB were obtained readily but all attempts to obtain the crystals of the metal complexes failed. Therefore, the ligand was structurally characterized by X-ray crystallography and X-ray powder diffraction studies were carried out for the complexes to determine whether the complexes are crystalline or amorphous in nature. The ligand (SB) crystallizes in an orthorhombic system with a space group of Pna21 (Fig. 3). The crystallographic data of the ligand (SB) and other structural refinement parameters are provided in Table T1 (see ESI†) and the selected bond distances and main bond angles are given in Table T2 (see ESI†). The azomethinic bond, N1–C6, 1.275(8) Å is in agreement with a formal –CN– double bond and the O3–C15 bond length of 1.324(10) Å, is somewhat shorter than the normal C–O single bond. The bond length for N1–C7, 1.412(9) Å and C5–C6, 1.420(10) Å for the ligand is nearer to N–C and CC bonds lengths, respectively. The unit-cell packing diagram of SB displayed hydrogen bonding interaction between the nitrogen of azomethinic group and the hydroxyl hydrogen atom. The single crystal X-ray diffraction study revealed that the Schiff base (SB) exhibits an imine-ol form (see Fig. 3A, B and S12 in ESI†).
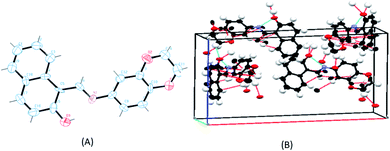 |
| | Fig. 3 (A) ORTEP diagram of the ligand SB with thermal ellipsoids drawn at the 50% probability level. All hydrogen atoms are shown with single bonds radiating from the atoms for the sake of clarity. (B) Unit cell packing diagram of the ligand SB with hydrogen atoms showing hydrogen bonding and short contacts. | |
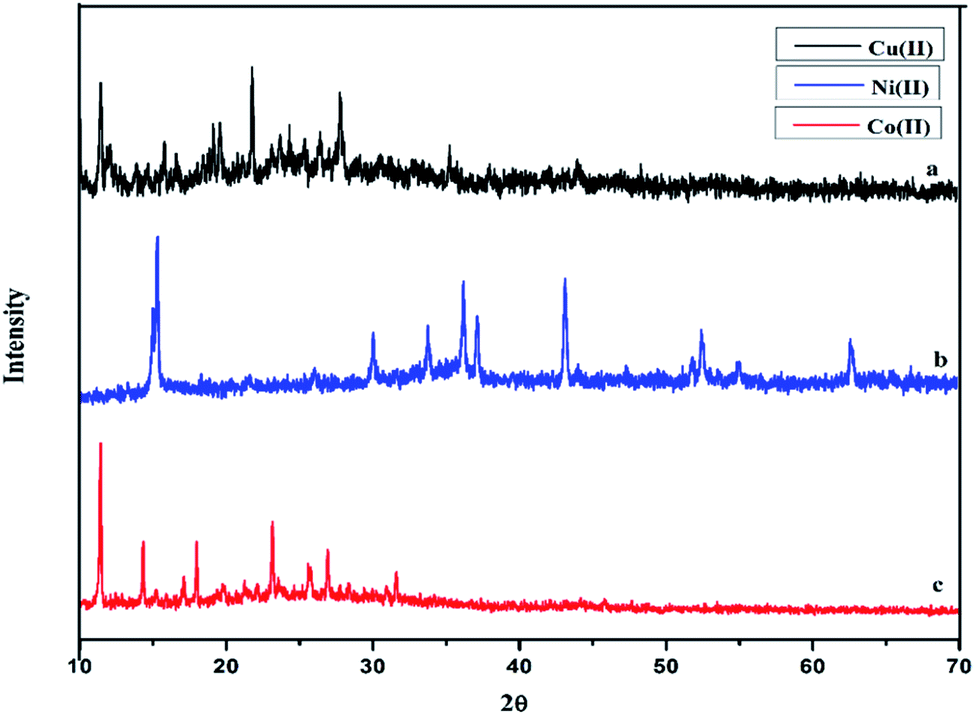
The powder XRD of the complexes were carried out in the range 10–70° (θ) at a wavelength of 1.54 Å. The different XRD pattern indicates that the complexes C1–C3 have well defined crystalline patterns with various degrees of crystallinity, as shown in Fig. 4.
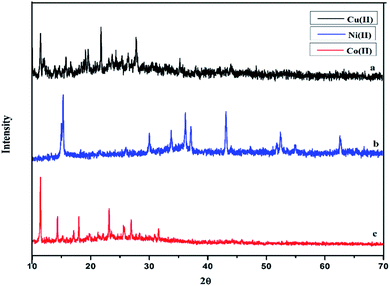 |
| | Fig. 4 Powder X-ray diffraction pattern of (a) C1, (b) C2 and (c) C3 complex. | |
3.3. Biology
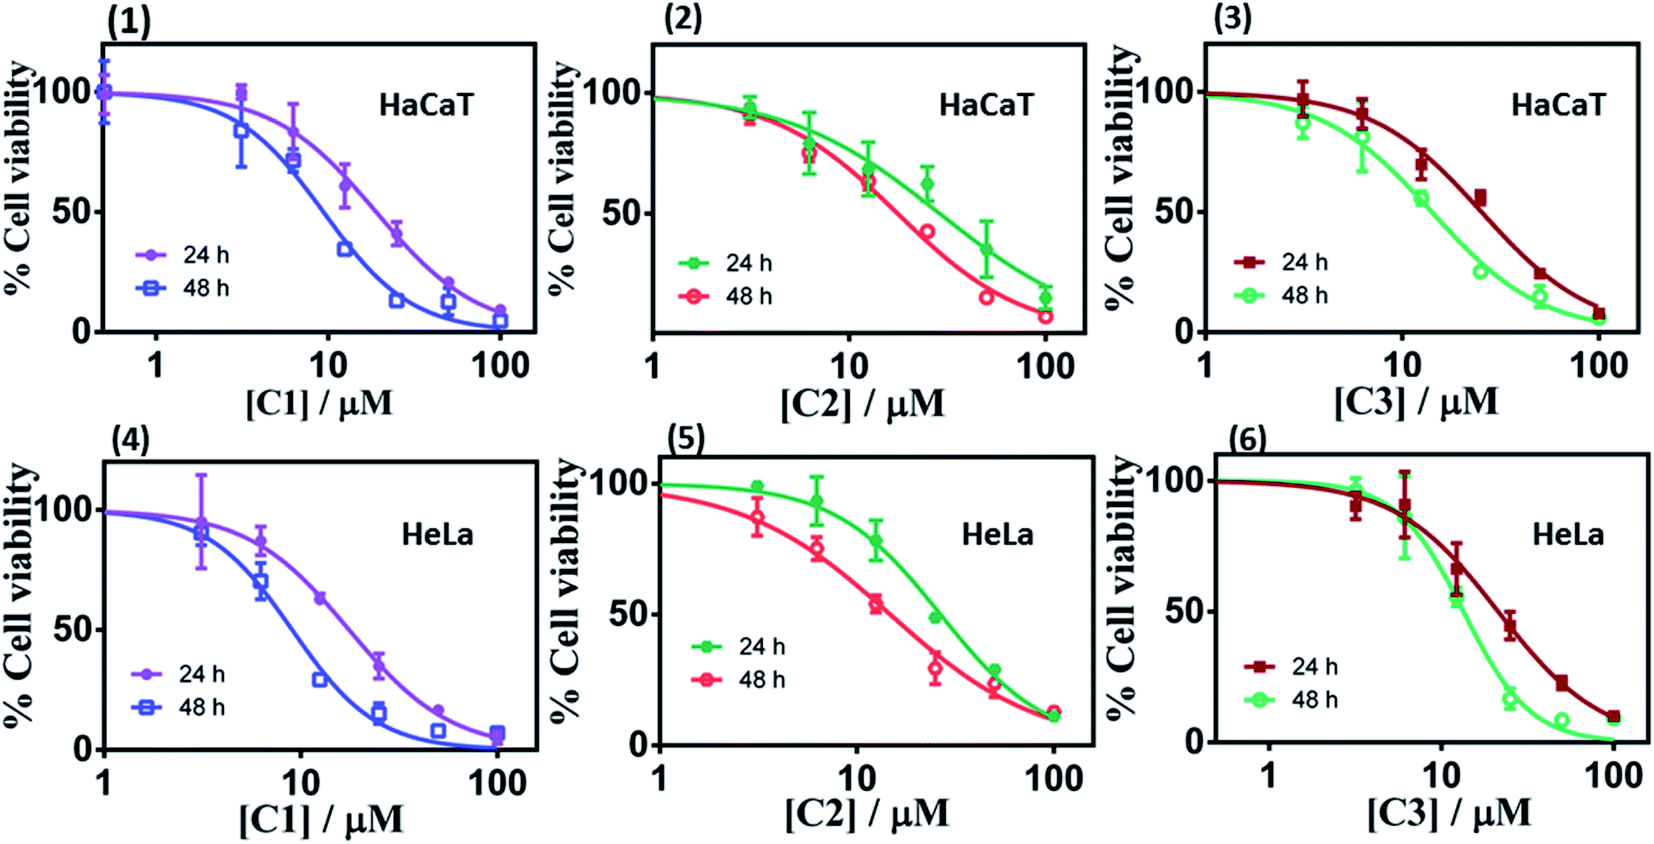
3.3.1. Metal complexes inhibited human cancer cell growth. The efficiency of metal complexes in suppressing cell growth and engendering apoptosis has been well documented.43,44 The in vitro cell culture studies provide valuable information for the screening of chemotherapeutic agents and preliminary data for further relative studies. Thus, cytotoxicity (Fig. 5 and Table 2) of complexes C1–C3 against two different human cancer cell lines, viz. HaCaT (human keratinocyte) and HeLa (human cervical) cancer cells, were evaluated through the loss of cell viability using the colorimetric MTT (3-(4,5-dimethylthiazol-2-yl)-2,5-diphenyltetrazolium bromide) assay. The cells were treated with the complexes (C1–C3) for 24 h and 48 h, respectively. A dose-dependent antitumor activity of C1–C3 was observed in both the cancer cells. Complex, C1 exhibited significant cytotoxicity against the HeLa cancer cells with an IC50 value of 17.65 μM (incubated for 24 h), 9.05 μM (incubated for 48 h) and is more potent than the widely used drug cisplatin (IC50 = 27.2 ± 1.71 μM) under similar experimental conditions.34 This is in accord with the DNA binding propensity order of complexes C1–C3 (as mentioned below). Since the in vitro cytotoxicity was found to be the highest for cervical cell line (HeLa cells) among our complexes and that cervical cancer is one of the most common cancer in women45 we preferred to use this cell line for all further studies.
 |
| | Fig. 5 Cell viability plots (1–3) and (4–6) showing cytotoxicity of the respective complex C1–C3 in HaCaT and HeLa cells incubated for 24 h and 48 h respectively. | |
Table 2 IC50 values of the complexes (C1–C3) against HeLa and HaCaT cancer cells
| Compounds |
Incubation time (24 h) IC50 (μM) |
Incubation time (48 h) IC50 (μM) |
| HeLa |
HaCaT |
HeLa |
HaCaT |
| C1 |
17.65 |
19.01 |
9.05 |
9.38 |
| C2 |
26.58 |
28.95 |
14.78 |
17.69 |
| C3 |
21.35 |
25.35 |
13.41 |
14.17 |
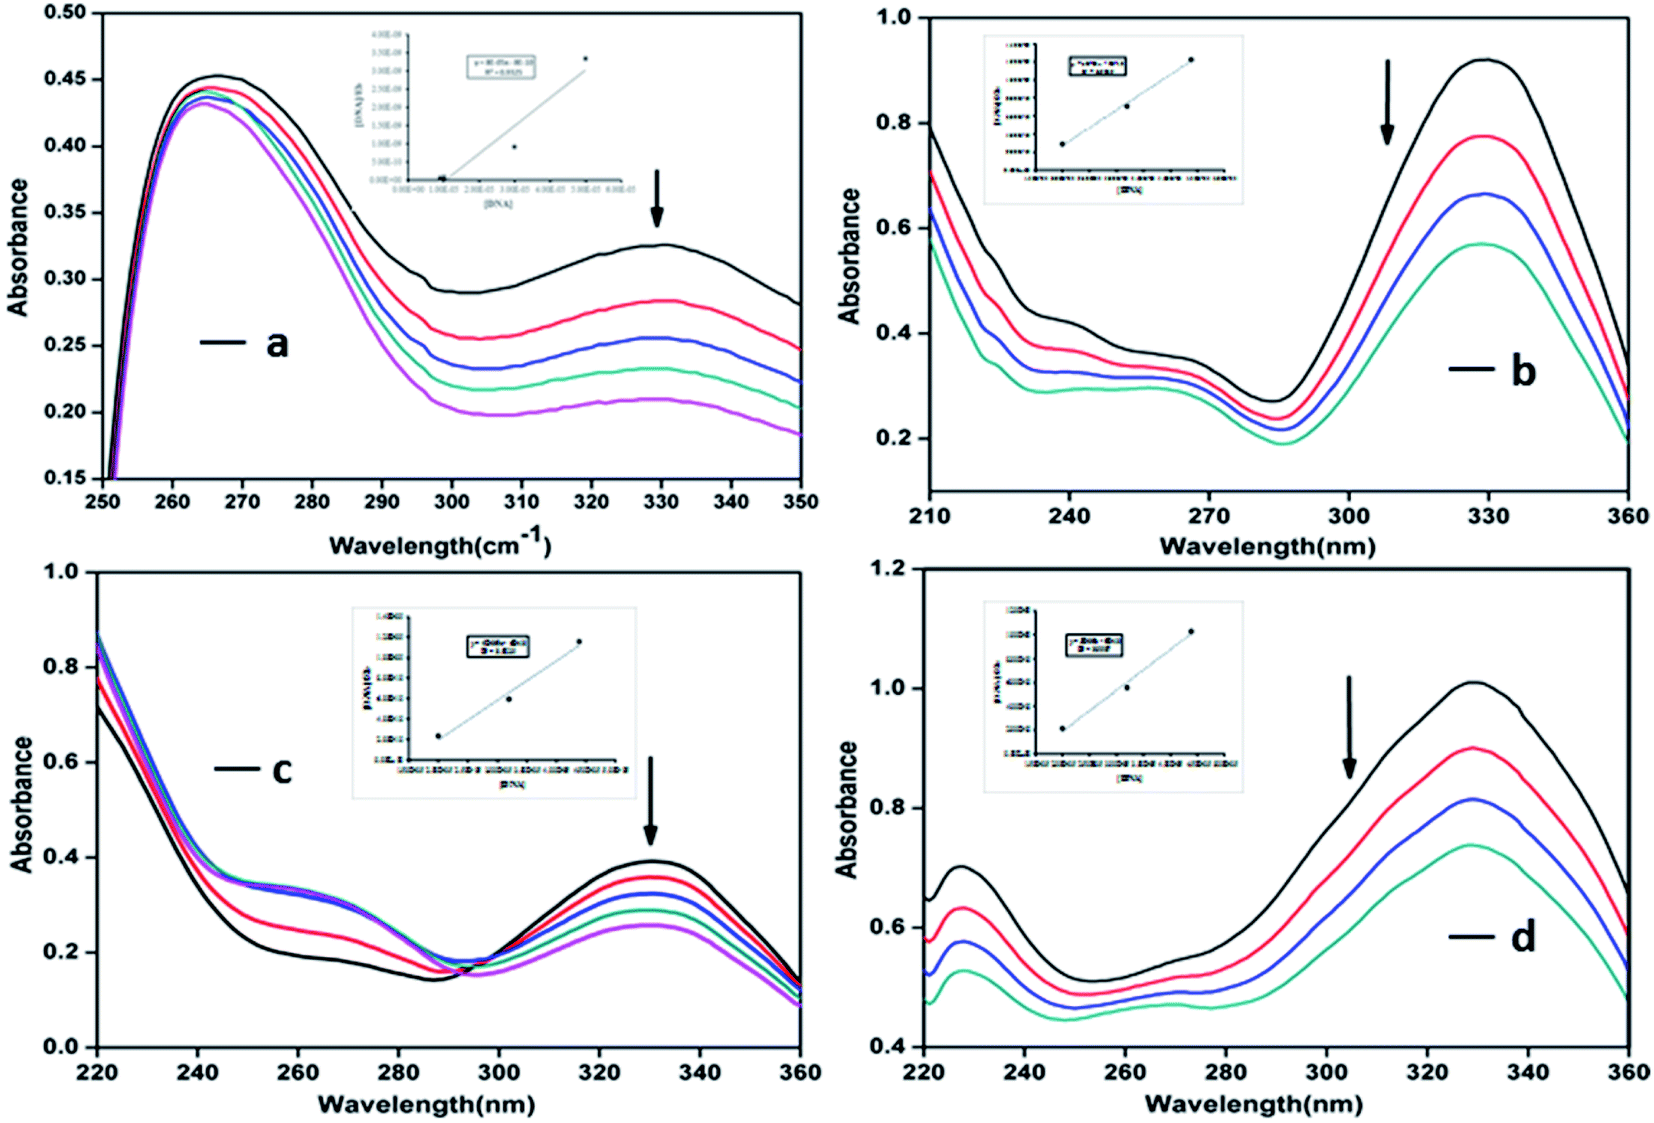
3.3.2. Absorption spectroscopic studies of the interaction between DNA and complexes. Absorption spectroscopy is one of the most useful and effective techniques in DNA–drug interaction studies. This technique allows recognizing the existence of interactions between DNA and molecules, as well as specifying the mode of interaction by utilizing the perturbations in the spectral observation.19,39,46 Binding of different compounds to DNA may create a strong stacking interaction between the compounds and the base pairs of the DNA and may cause the absorbance spectrum show some degrees of hypo- or hyperchromism.39 The interaction of synthesized compounds with Ct-DNA may occurs by three different modes of binding which includes (i) electrostatic binding/external binding, (ii) groove binding, (iii) or intercalative binding/intercalation. In our studies, electronic absorption spectroscopy was used to determine the binding capacity and the mode of interaction of the synthesized compounds with Ct-DNA, displaying characteristic absorbance changes and wavelength shifts (Fig. 6). The absorption spectral changes on addition of increasing concentrations of Ct-DNA to the fixed concentration solution of the compounds was observed. It is known that upon the binding of Ct-DNA with the metal complexes, an evident “hypochromic shift” occurs in the absorbance of the ligand centred band.34 On increasing Ct-DNA, all the metal complexes exhibited a hypochromic and a slight red-shifted (bathochromic shift) band in the absorption spectra. The hypochromic values observed in the presence of DNA were in the range 4.06–15.95%, and their red shifts are by 1–3 nm. The presence of hyperchromism indicates the formation of complex between DNA and the metal complexes.34 The intrinsic binding constant Kb calculated from the plots of [DNA]/(εa − εf) verses [DNA] was obtained from the ratio of the slope to the intercept (please see Methods). Using the hypochromic shifts, the intrinsic binding constant Kb for DNA binding by the ligand SB and the metal complexes C1, C2 and C3 were determined to be 2.84 × 10⁵, 1.97 × 10⁵, 1.35 × 10⁵ and 1.22 × 10⁵ M−1 respectively. These studies indicate that all the three metal complexes have binding constant in the similar range indicating a similar mode of binding to the Ct-DNA.34 However, complex C1 showed higher binding affinity towards the Ct-DNA followed by C2 and C3. These results suggest the binding of compounds to the Ct-DNA. Since, the apparent binding constants of the compounds are in the range of 105 M−1 it can be predicted that these complexes bind to the DNA in an intercalation mode.34,47–49 The exceptionally high value of Kb for the compound C1, advocates the complex is an ardent binder of DNA. Since such high binding constant is generally characteristic of DNA binding by intercalation, so we undertake that the ligand SB and complexes C1, C2 and C3 bind DNA mainly by intercalation, however electrostatic interactions, H-bonding as well as interactions with the negatively charged phosphate groups of DNA may also offer their role towards overall binding strength.34,49. (see detail below in Docking study).
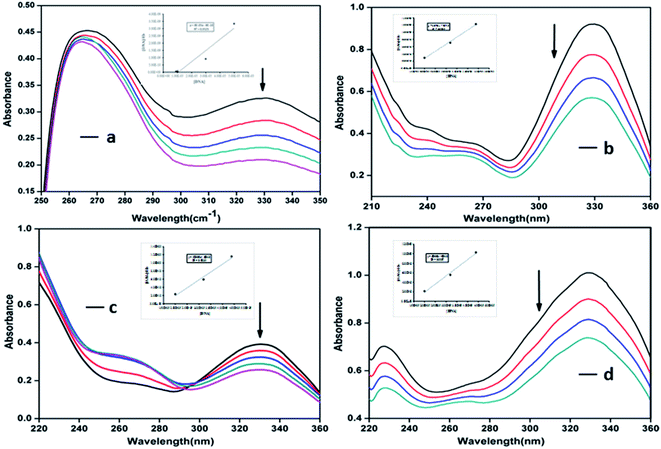 |
| | Fig. 6 Absorption spectra of the ligand SB (a) and complexes C1 (b), C2 (c) and C3 (d) in the presence of increasing amounts of Ct-DNA at room temperature in 5 mM Tris–HCl/NaCl buffer (pH = 7.4) at 25 °C. The arrow shows the absorbance changing upon increasing the DNA concentration. The plots of [DNA]/(εa − εf) versus [DNA] for the ligand and the complexes are shown as insets in respective graphs (a), (b), (c) and (d). | |
3.3.3. Nuclear morphology study. Changes in the morphology of the nucleus is an important feature of cell death. Condensed chromatin and fragmented nucleus are the distinguishing feature of the apoptotic cell death. To determine the effect of complexes on the nuclear morphology and nature of cell death (apoptosis or necrosis), DAPI staining was used upon the treatment of compounds (C1–C3). As shown in Fig. 7A, in control cells, a uniform level of blue fluorescence in the nucleus was seen which specifies that nearly all cells are alive and healthy. However, upon treating the cells with 15 μM complexes (C1–C3), morphological changes in the nucleus can be observed. In the complex treated cells, fragmented nuclei were observed suggesting the presence of apoptotic bodies.50 Treatment with compounds for 24 h (15 μM), C1–C3 shows about 36%, 25% and 24% apoptotic cells, respectively (Fig. 7B). Results obtained from stained cells, showed a significant higher percentage of compound C1 treated cell undergoing apoptosis. In our case, we have seen apoptotic cells instead of necrotic feature of cells upon long exposure (data not shown). Our data suggests that complexes (C1–C3) drive the cells through apoptotic mode of cell death in HeLa cells.
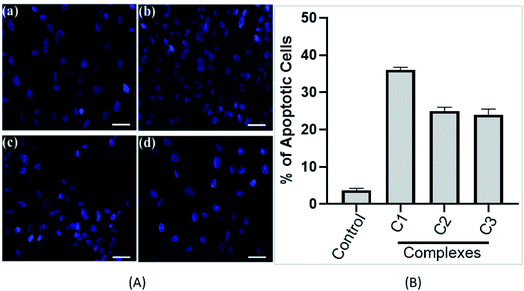 |
| | Fig. 7 (A) Metal complexes induce cancer cell apoptosis. Florescence images of cervical cancer (HeLa) cells displaying morphological changes; (a) in absence of complexes (control) and on exposure to complexes (b) C1 complex, (c) C2 complex and (d) C3 complex detected with DAPI (blue) staining. Arrows indicate apoptotic nuclear fragmentation. Experiment was performed three times. Representative figure is shown. Scale bars, 10 μm. (B) Bar graph represents the percentage of apoptotic cells determine by DAPI staining. Value represents the mean ± SD, n = 3. | |
3.3.4 Intracellular reactive oxygen species (ROS) production is involved in metal-complex induced apoptosis. ROS is known to play an important role in activating the cell death pathways. Such chemical species are not only produced under pathological conditions but also during physiological conditions like cellular metabolic processes. Various studies have shown that ROS damages DNA, RNA and also bring about the oxidation of proteins and lipids. To study the impact of metal complexes on oxidative stress, intracellular ROS production in compound treated HeLa cells was measured by DAFH-DA (2′,7′-dichlorofluorescein diacetate), a non-fluorescent membrane permeable probe, which oxidizes in the presence of peroxides to the highly fluorescent DCF (2′,7′-dichlorofluorescein).39 As shown in Fig. 8, the ROS levels generated in response to 15 μM (24 h) of compounds (C1–C3) treatments were significantly higher than control cells. Interestingly, ROS generated by C1 was significantly higher than C2 and C3. These results suggest that the complexes C1–C3 may induce apoptotic pathways mediated by ROS.
 |
| | Fig. 8 Determination of intracellular ROS level (DCF-DA assay) in human cervical cancer cell line HeLa, treated with solvent control and with different complex C1, C2 & C3 at 15 μM; each for 24 h. Results are expressed as fold increase with respect to control. Each value represent mean ± SD, of five independent experiments. | |
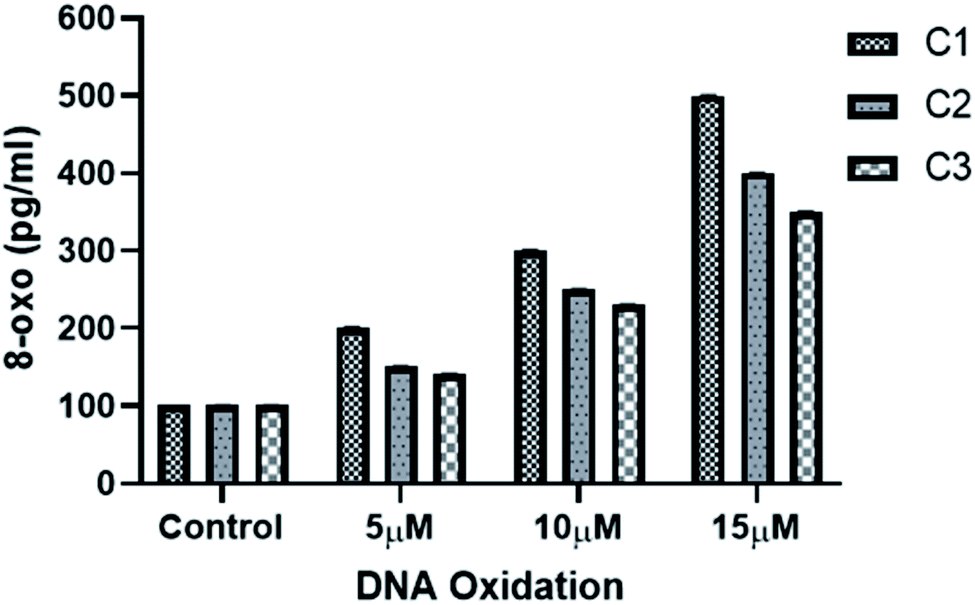
3.3.5 Metal complexes induced DNA oxidation and DNA damage in HeLa cells. DNA damage is a natural phenomenon happening in all cells in daily life of a cell. Most of the DNA damage happens by DNA oxidation which leads to the formation of different lesions including oxidized bases, apurinic/apyrimidinic (AP) sites, and DNA single- and/or double-strand breaks. Oxidation of guanine base is more common as compared to other DNA bases mainly due to its low oxidation potential.51,52 8-hydroxy-2′-deoxyguanosine (8-oxo-dG) is the most common form of oxidized guanine and hence is a good indicator for measuring DNA oxidation.51,52 Increased levels of ROS in metal complexes treated HeLa cells may cause DNA damage. Hence, to explore the effect of metal complexes on DNA oxidation DNA damage, production of 8-oxo-dG was evaluated. Cellular 8-oxo-dG formation was examined using 8-oxo detection ELISA kit (see Methods). As shown in (Fig. 9), treating HeLa cells for 24 h with increasing concentration of metal complexes have resulted in increased formation of 8-oxo-dG in the genomic DNA for all the three complexes. As expected, complex C1 produced more 8-oxo-dG as compared to C2 and C3 which is consistent to the higher generation of ROS by complex C1 than C2 and C3 (Fig. 8). These results indicate that the ROS generated by metal complexes are tightly correlated with DNA damage and DNA binding. Moreover, these results are also in agreement with the nuclear morphological studies (Fig. 7).
 |
| | Fig. 9 Determination of 8-oxo-dG of HeLa cells genomic DNA. HeLa cells were incubated with increasing concentrations of metal-complexes for 24 h and the amount of 8-oxo-dG formation was assessed using ELISA kit (see Methods). Each value represent mean ± SD, of three independent experiments. | |
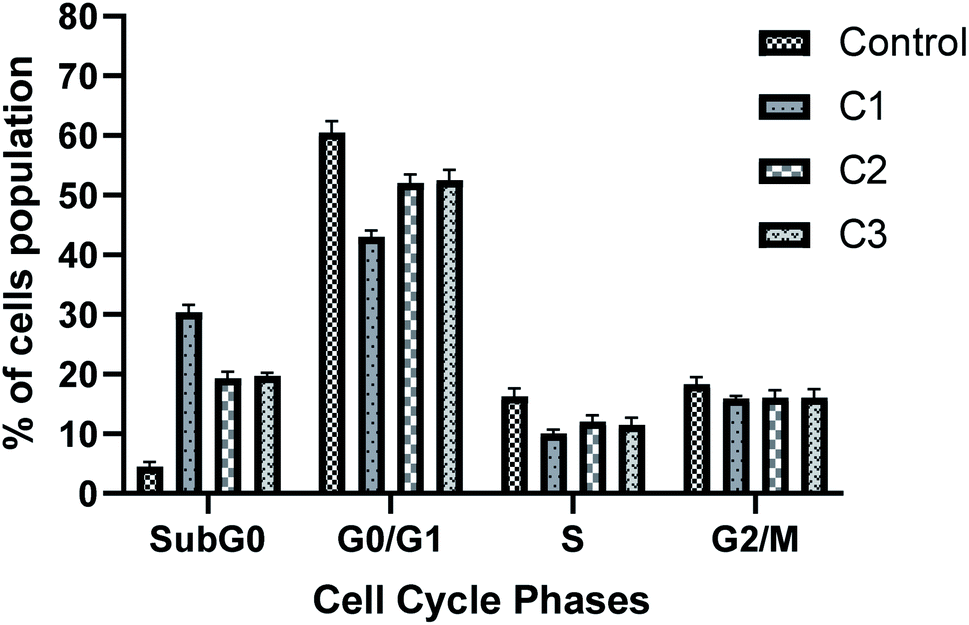
3.3.6 Cell cycle analysis. Cell cycle progression is impaired by DNA damage. Also, our results have shown the antiproliferative role of complexes in HeLa cells. Thus, we next analysed the cell cycle of HeLa cells after incubating the cells with respective complexes with 15 μM for 24 h. Fig. 10 shows the distribution of cells in different phases of cell cycle. As the FACS analysis showed, treatment with HeLa cells with the complexes significantly increased the cell population in the SubG0 phase as that of control (4.5% in control, 30.3% in C1, 19.3% in C2 and 19.7% in C3 treated cells), which shows the apoptotic cell population. However, treatment of metal complexes led to a decrease in G0/G1 cell population (60.5% in control, 43.1% in C1, 52.1% in C2 and 52.5% in C3 treated cells), and which is more prominent in the C1 treated cells (Fig. 10). A slight decrease in S phase cell population was also observed for all complex treated cells.
 |
| | Fig. 10 Metal complexes induce apoptosis in HeLa cancer cells. Cell cycle analysis was performed upon treatment of cells with 15 μM of metal complexes for 24 h. After fixation, cell cycle analysis was performed with propidium iodide staining. Bar graph represents the percentage of cell population in different phases of cell cycle. Value represents the mean ± SD from three independent experiments. | |
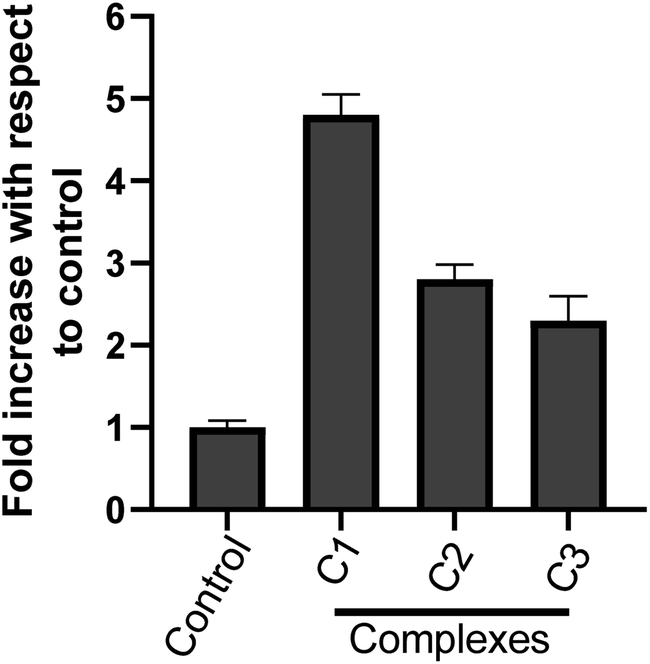
3.3.7 Metal complexes-increased caspase-3 activity in HeLa cells. Caspase-3 enzyme is a crucial mediator and an important upstream factor of programmed cell death (apoptosis). Activation of caspase-3 leads to apoptosis.53,54 Our cell cycle analysis and nuclear morphological studies has established the occurrence of cell death by apoptosis upon metal complex treatment. Hence, we investigated the effect of metal complexes on caspase-3 activation. The caspase-3 enzyme activity was analysed spectrophotometrically. It was found that the complexes C1, C2 and C3 treatment (15 μM) for 24 h increased caspase-3 enzyme activity in HeLa cervical cancer cells (Fig. 11) as compare to control. However, C1 treatment resulted in a significantly higher (p < 0.05) caspase-3 activity than C2 and C3. These results strongly suggest the involvement of caspase-3 in the complex-induced apoptosis.
 |
| | Fig. 11 Effect of metal complexes on caspase-3 activity in HeLa cells. Cells were treated with solvent control and with different complex C1, C2 & C3 at 15 μM; each for 24 h and cytosolic extracts were used for caspase-3 activity. Results are expressed as fold increase with respect to control. Each value represent mean ± SD, of three independent experiments performed in duplicate. | |
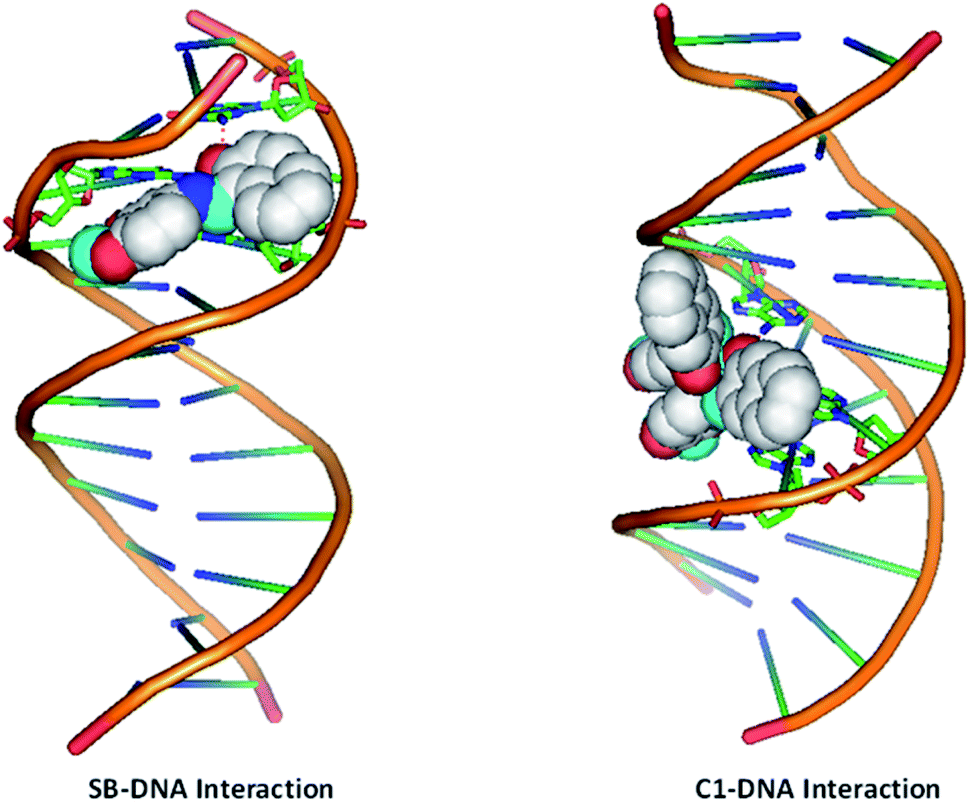
3.3.8 Molecular docking studies. Based on our spectroscopic and cell culture-based studies we found that compound C1 to be a better candidate against the cancer cells, hence, we performed the molecular docking studies using the promising lead compound C1 and SB to the DNA molecule. Molecular docking experiments of complex C1 and SB were carried out with DNA duplex of the sequence d(CGCGAATTCGCG)2 dodecamer (PDB ID: 1BNA) in order to predict the preferred orientation of the complex inside the DNA helix and to substantiate the spectroscopic results.55 2D structure of the synthesized ligand molecules were converted to energy minimized 3D structures and used for docking studies. DNA duplex of sequence d(CGCGAATTCGCG)2 dodecamer was taken as the target receptor. The Lamarckian genetic algorithm, inculcated in the docking program AutoDock 4.2, was employed to satisfy the purpose. Crystal structure was obtained from Protein Data Bank (https://www.rcsb.org) with the PDB ID 1BNA. Molecular docking calculations were carried out with Auto dock vina.56 The conformation with the lowest binding free energy was used for analysis. All molecular docked models were prepared using PyMOL viewer. Docked images are shown in Fig. 12. On analysing the docked structures, it is evident that the ligand and its metal complex C1 fit well into the A-T rich region of target DNA. Both SB and C1 are stabilized in the A-T rich region through various interactions, such as van der Waals and hydrophobic interactions. Binding affinity values of the docked target compounds were found to be in the range of −12.6 to −10.1 kcal mol−1.
 |
| | Fig. 12 Docking study of the binding of SB and C1 to DNA. | |
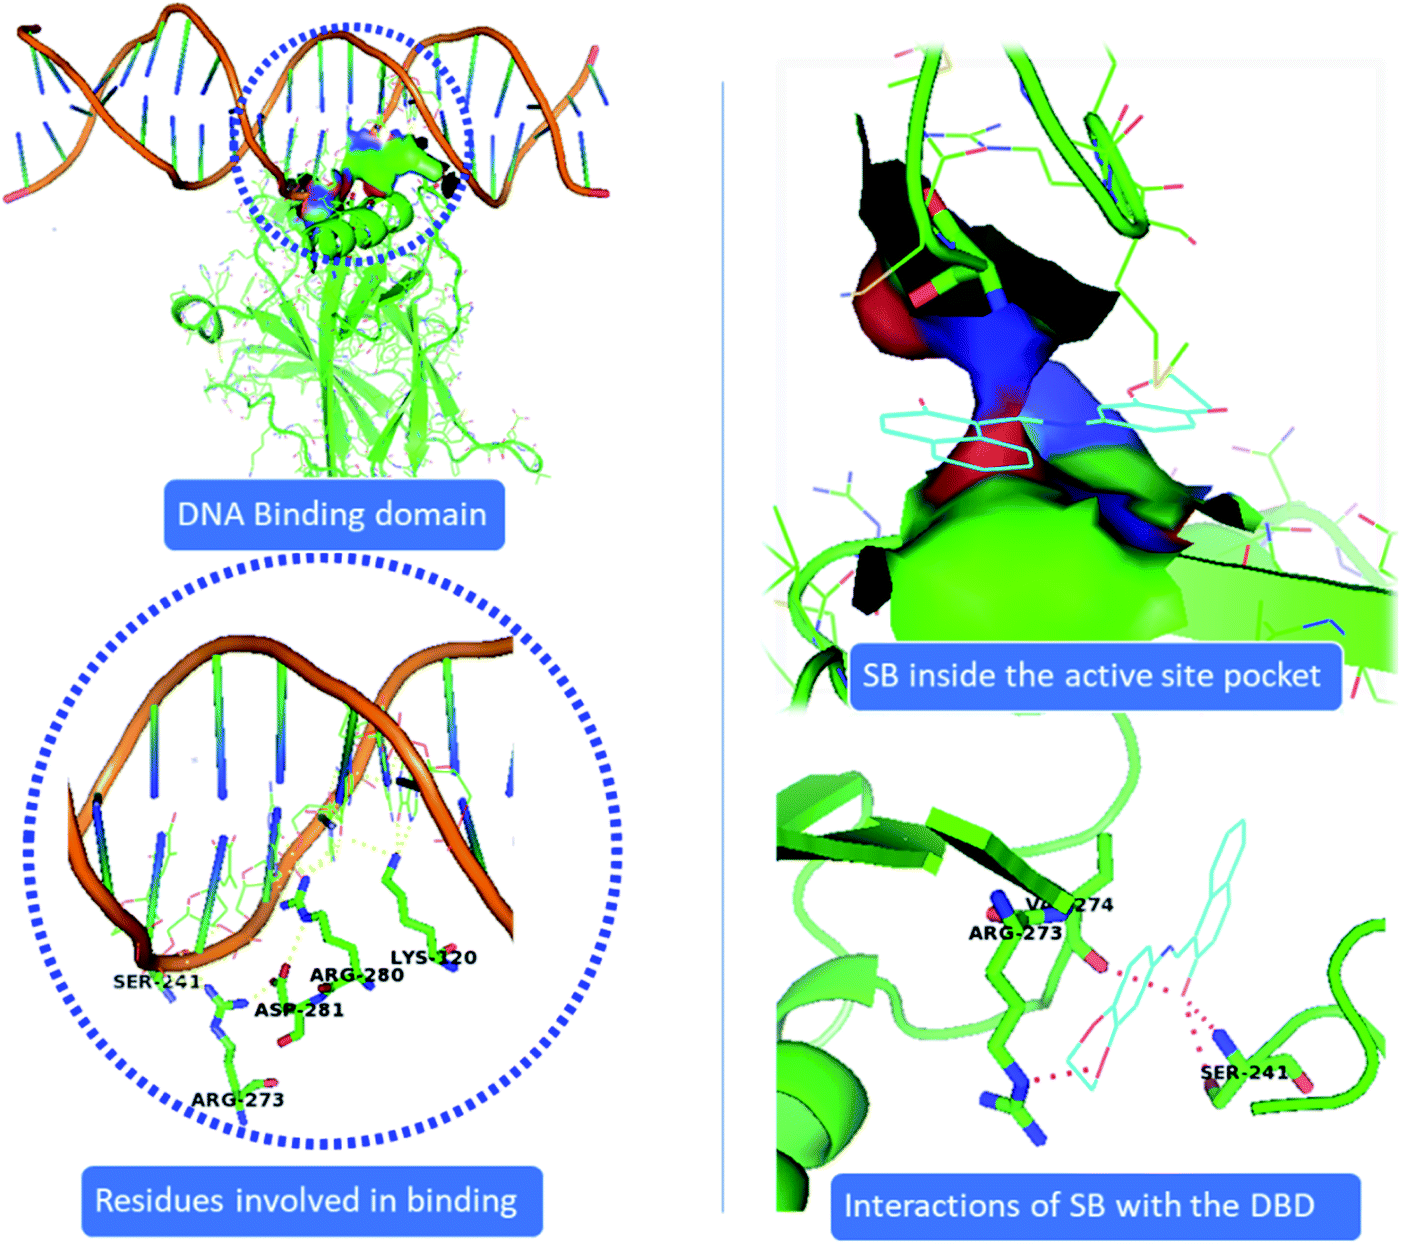
Our data shows that metal complex C1 induces DNA damage by binding to the DNA molecule, inhibits cell growth and further causes cell death. Owing to the importance of p53 transcription factor in regulating cellular stress, DNA damage repair function along with its pivotal role in deciding cell death and survival, we intended to investigate the ability of C1 in binding the p53. P53 mediates most of its function though binding to the DNA molecule. Therefore, we looked into the effect of compound C1 and ligand SB on the p53 binding ability to the DNA using molecular docking studies. Crystal structure of the p53 complexed with DNA molecule57 was obtained from Protein Data Bank (https://www.rcsb.org) with the PDB ID 1TSR (see Methods for detail). Fig. 13 shows that p53DBD interacts with DNA via LYS120, SER241, ARG273, ARG280, and ARG281 residues. However, unlike the strong interaction of both SB and C1 with DNA (Fig. 12), we observed that complex C1 goes inside the p53DBD pocket but doesn't show any remarkable interactions with DNA (data not shown). This could be because the complex undergoes demetalation inside the cell and the ligand is actually responsible for the biological activity.58,59 This presumption however demands more mechanistic studies and other factors such as cellular environment which can affect the metal complexes by redox pathways, ligand exchange, expansion or contraction of the coordination sphere with the change in pH, among others, cannot be ruled out. In this study, we found that the Cu based metal complex C1 showed interesting anticancer property which could be related to the potential of copper to form tetrahedral, square planar and distorted octahedral complexes. Once inside the cell a copper complex can change its geometry, undergo ligand exchange or a one-electron reduction of Cu(II) to Cu(I) in a hypoxic environment could release the ligands as has been observed in some Co(III) and Cu(II) complexes.60,61
 |
| | Fig. 13 Docking study of the binding of SB to the p53DBD. P53 DBD shows interaction via LYS120, SER241, ARG273, ARG280, and ARG281 whereas, SB shows interaction with SER241, ARG273 and VAL274 inside the same binding pocket. | |
Interestingly, we found that the ligand SB binds the same DNA binding pocket of p53DBD and thus mimicking similar interactions as that of p53DBD and DNA. SB fits the binding pocket of p53DBD where it makes contact with critical residues SER241, ARG273 and VAL274 of p53DBD which are also responsible to bind DNA (Fig. 13). Importantly, both the DNA and the SB share residues SER241 and ARG273 of p53DBD, further suggesting a common binding pocket for both SB and DNA (Fig. 13). Therefore, we presume that binding of SB will block or disengage the p53 binding to the cognate DNA binding sites and thus negatively affect p53 DNA repair function and other DNA stress responses mediated by p53.
3.3.9 Implications of metal-complexes in cervical cancer treatment. Cervical cancer is the fourth most frequent cancer in women with an estimated 570000 new cases in 2018 representing around 7% of all female cancers. Diagnosing of cervical cancer at an early stage and providing access to effective treatment can significantly improve the likelihood of survival.69 While the diagnosis of advanced, recurrent, or persistent disease is often incurable. Chemotherapy based treatment in cervical cancer is mainly cisplatin-based. However, reports of the use of new metal complexes against cervical cancer are also available.28Since our data is primarily based on HeLa cell, which is derived from cervical cancer, we believe that our results will have an important implication for the treatment of cervical cancer. It is worth noting that unlike most of the cancers, p53 is not mutated in HeLa cells (cervical cancer derived cells). Most of the tumor-related p53 mutations, called hotspot mutations, occur in the DNA-binding core domain (p53DBD) of p53. ARG273, an important DNA–contact amino acid, is one of the most frequently altered amino acid residues in human cancer.62 However, p53 ARG273 is not mutated in cervical cancer, a residue also important for the binding of ligand, SB and that would negatively impact p53-DNA binding. Mechanistically, we believe that binding of the metal complex, namely, C1 and ligand SB to the DNA causes the DNA damage which in turn will attract DNA repair protein, p53. Similarly, binding of SB to the p53DBD will inhibit the normal DNA protective functions of p53 and could lead to further increase in DNA damage. The inability of SB bound p53 to mediate the DNA repair pathway will lead to increased destabilization of the cellular genomic DNA due to increase in DNA damage and lack of p53 function, that could trigger apoptosis mediated cell death, as we observed in this work. P53 regulate the apoptotic processes at various levels by regulating several proapoptotic proteins. In our experiments, we found the induction of apoptotic hall mark protein, caspase-3 upon treatment with metal complexes.63–65 A higher level of caspase-3 induction by complex C1 could be positively attributed to a higher level of ROS and the subsequent DNA damage generated by compound C1 (Fig. 8 and 9) which was significantly higher than compound C2 and C3. Our results are also in agreement with other reports of metal complexes inducing apoptosis via caspase-3 pathway.66–68
4. Conclusions
In conclusion, through the present work new heterocyclic Schiff base complexes (C1–C3) have been described. Various physicochemical techniques supported the successful formation of the compounds. The complexes exhibit in vitro cytotoxic activity against human keratinocyte (HaCaT) and human cervical cancer (HeLa) cell lines, with the potency of C1, being even higher than that of the widely used drug cisplatin (IC50 = 27.2 ± 1.71 μM) against the human cervical cancer (HeLa) cell line. The antiproliferative activity of complexes (C1–C3) was further proved by nuclear morphological staining and ROS studies. Complex C1 can not only inhibit the proliferation of the HeLa cancer cell line, but also induce apoptosis. Furthermore, absorption studies demonstrated that the complexes effectively bind to DNA through an intercalative mode, in the order of SB > C1 > C2 > C3. These complexes, particularly the copper complex C1 presented herein exhibits considerable biological activity and the studies can contribute to the rational design of novel potential anticancer agents.
Author contributions
MYW and AAH designed and supervised the project. MAM, MKR and AM performed experiments, analysed data, prepared Figures and wrote the main manuscript text. All authors discussed the results and implications and commented on the manuscript at all stages.
Conflicts of interest
The authors declare no competing interests.
Acknowledgements
M. A. M. gratefully acknowledges Council of Scientific and Industrial Research (CSIR), New Delhi, India for the financial assistance in the form of Senior Research Fellowship for this work [File No.: 09/466(0215)2K19 EMR-1].
References
- R. L. Siegel, K. D. Miller and A. Jemal, CA: Cancer J. Clin., 2020, 70, 7–30 Search PubMed.
- J. Fares, M. Y. Fares, H. H. Khachfe, H. A. Salhab and Y. Fares, Signal Transduction Targeted Ther., 2020, 5, 28 CrossRef PubMed.
- C. A. Klein, Nat. Rev. Cancer, 2020, 20, 681–694 CrossRef CAS.
- X. Jin, Z. Demere, K. Nair, A. Ali, G. B. Ferraro, T. Natoli and T. R. Golub, Nature, 2020, 588, 331–336 CrossRef CAS.
- G. Karuna and J. Massagué, Nat. Med., 2021, 27, 34–44 CrossRef.
- S. P. Jackson and J. Bartek, Nature, 2009, 461, 1071–1078 CrossRef CAS PubMed.
- R. A. Alderden, M. D. Hall and T. W. Hambley, J. Chem. Educ., 2006, 83, 728–734 CrossRef CAS.
- S. P. Fricker, Dalton Trans., 2007, 43, 4903–4917 RSC.
- N. P. Barry and J. P. Sadler, Chem. Commun., 2013, 49, 5106–5131 RSC.
- A. T. Baudino, Curr. Drug Discovery Technol., 2015, 12, 3–20 CrossRef PubMed.
- C. Sawyers, Nature, 2004, 432, 294–297 CrossRef CAS PubMed.
- E. Giovannetti and J. A. Rodriguez, Cancer Drug Resist., 2018, 1, 82–86 Search PubMed.
- X. Ke and L. Shen, Front. Lab. Med., 2017, 1, 69–75 CrossRef.
- V. Talwar, P. K. Babu and S. Raina, Curr. Med. Res. Pract., 2017, 7, 99–105 CrossRef.
- T. Ozaki and A. Nakagawara, Cancers, 2011, 3, 994–1013 CrossRef CAS.
- T. J. Zilfou and W. S. Lowe, Cold Spring Harbor Perspect. Biol., 2009, 1, a001883 Search PubMed.
- S. Pandey, L. K. Pandey, A. K. Saxena and N. J. Patel, J. Obstet. Gynecol. India, 2016, 66, 383–388 CrossRef PubMed.
- J. Chen, Cold Spring Harbor Perspect. Med., 2016, 6, a026104 CrossRef.
- R. Ashraf, Hamidullah, M. Hasanain, P. Praveen, M. Mayank, L. R. Singh, M. Q. Siddiqui, K. Rituraj, V. S. Koneni and S. Jayanta, Sci. Rep., 2017, 7, 45287 CrossRef CAS PubMed.
- M. Weller, Cell Tissue Res., 1998, 292, 435–445 CrossRef CAS PubMed.
- K. Hientz, A. Mohr, D. Bhakta-Guha and T. Efferth, Oncotarget, 2017, 8, 8921–8946 CrossRef PubMed.
- M. Martinez-Rivera and Z. H. Siddik, Biochem. Pharmacol., 2012, 83, 1049–1062 CrossRef CAS PubMed.
- J. L. Arnold, Annu. Rev. Cancer Biol., 2019, 3, 21–34 CrossRef.
- C. J. Brown, C. F. Cheok, S. C. Verma and P. D. Lane, Trends Pharmacol. Sci., 2011, 32, 53–62 CrossRef CAS PubMed.
- U. I. Amarasena, S. Chatterjee, A. J. Walters, R. Wood-Baker and M. K. Fong, Cochrane Database Syst. Rev., 2015, 8, CD006849 Search PubMed.
- M. A. Malik, O. A. Dar, P. Gull, M. Y. Wani and A. A. Hashmi, MedChemComm, 2018, 9, 409–436 RSC.
- P. C. Bruijnincx and P. J. Sadler, Curr. Opin. Chem. Biol., 2008, 12, 197–206 CrossRef CAS.
- U. Ndagi, N. Mhlongo and M. E. Soliman, Drug Des., Dev. Ther., 2017, 11, 599–616 CrossRef CAS PubMed.
- P. Jia, R. Ouyang, P. Cao, X. Tong, X. Zhou, T. Lei and S. J. Zhou, J. Coord. Chem., 2017, 70, 2175–2201 CrossRef CAS.
- Z. Zhang, H. Wang, M. Yan, H. Wang and C. Zhang, Mol. Med. Rep., 2017, 15, 3–11 CrossRef CAS.
- C. Marzano, M. Pellei, F. Tisato and C. Santini, Anti-Cancer Agents Med. Chem., 2009, 9, 185–211 CrossRef CAS PubMed.
- C. Santini, M. Pellei, V. Gandin, M. Porchia, F. Tisato and C. Marzano, Chem. Rev., 2014, 114, 815–862 CrossRef CAS.
- N. Graf and S. J. Lippard, Adv. Drug Delivery Rev., 2012, 64, 993–1004 CrossRef CAS PubMed.
- M. A. Malik, M. K. Raza, O. A. Dar, M. Abid, M. Y. Wani, A. S. Al-Bogami and A. A. Hashmi, Bioorg. Chem., 2019, 87, 773–782 CrossRef CAS PubMed.
- M. Marloye, G. Berger, M. Gelbcke and F. Dufrasne, Future Med. Chem., 2016, 8, 2263–2286 CrossRef CAS PubMed.
- E. Alessio and Z. Guo, Eur. J. Inorg. Chem., 2017, 12, 1539–1540 CrossRef.
- M. Raman, V. Muthuraj, S. Ravichandran and A. Kulandaisamy, J. Chem. Sci., 2003, 115, 161–167 CrossRef.
- A. Mohammed, M. V. Bhusainahalli, C. Ramesh, B. O. Yogesh, M. Kempegowda, S. K. Gopinath and K. K. Tapas, Chem. Biol., 2010, 17, 903–913 CrossRef PubMed.
- F. Salehi, H. Behboudi, G. Kavoosi and S. K. Ardestani, Sci. Rep., 2018, 8, 1–16 CAS.
- D. Wu and P. Yotnda, J. Visualized Exp., 2011, 57, 3357 Search PubMed.
- M. S. Nair and R. S. Joseyphus, Spectrochim. Acta, Part A, 2008, 70, 749–753 CrossRef.
- A. B. P. Lever, Inorganic Electronic Spectroscopy, Elsevier, Amsterdam, 2nd edn, 1984 Search PubMed.
- K. Gałczyńska, Z. Drulis-Kawa and M. Arabski, Molecules, 2020, 25, 3492 CrossRef.
- C. P. Tan, Y. Y. Lu, L. N. Ji and Z. W. Mao, Metallomics, 2014, 6, 978–995 CrossRef CAS.
- M. Arbyn, E. Weiderpass, L. Bruni, S. de Sanjosé, M. Saraiya, J. Ferlay and F. Bray, Lancet Glob. Health, 2020, 8, e191–e203 CrossRef.
- O. M. Salem, M. Vilková, J. Janočková, R. Jendželovský, P. Fedoročko, J. Imrich and M. Kožurková, Med. Chem. Res., 2017, 26, 2309–2321 CrossRef CAS.
- S. S. Bhat, A. A. Kumbhar, H. Heptullah, A. A. Khan, V. V. Gobre, S. P. Gejji and V. G. Puranik, Inorg. Chem., 2011, 50, 545–558 CrossRef CAS PubMed.
- B. J. Pages, D. L. Ang, E. P. Wright and J. R. Aldrich-Wright, Dalton Trans., 2015, 44, 3505–3526 RSC.
- A. N. Kate, A. A. Kumbhar, A. A. Khan, P. V. Joshi and V. G. Puranik, Bioconjugate Chem., 2014, 25, 102–114 CrossRef CAS.
- J. Zhang and M. Xu, Cell Res., 2000, 10, 205–211 CrossRef CAS PubMed.
- D. G. Deavall, E. A. Martin, J. M. Horner and R. Roberts, J. Toxicol., 2012, 2012, 645460 Search PubMed.
- D. Mangal, D. Vudathala, J. H. Park, H. S. Lee, T. M. Penning and I. A. Blair, Chem. Res. Toxicol., 2009, 22, 788–797 Search PubMed.
- A. G. Porter and R. U. Jaenicke, Cell Death Differ., 1999, 6, 99–104 CrossRef CAS.
- S. McComb, P. K. Chan, A. Guinot, H. Hartmannsdottir, S. Jenni, M. P. Dobay and B. C. Bornhauser, Sci. Adv., 2019, 5, eaau9433 CrossRef CAS PubMed.
- H. R. Drew, R. M. Wing, T. Takano, C. Broka, S. Tanaka, K. Itakura and R. E. Dickerson, Proc. Natl. Acad. Sci. U. S. A., 1981, 78, 2179–2183 CrossRef CAS.
- O. Trott and A. J. Olson, J. Comput. Chem., 2010, 31, 455–461 CAS.
- Y. Cho, S. Gorina, P. D. Jeffrey and N. P. Pavletich, Science, 1994, 265, 346–355 CrossRef CAS PubMed.
- K. L. Haas and K. J. Franz, Chem. Rev., 2009, 109, 4921–4960 CrossRef CAS PubMed.
- R. K. Sodhi and S. Paul, Cancer Ther. Oncol. Int. J., 2019, 14, 555883 Search PubMed.
- G. O. Ahn, K. J. Botting, A. V. Patterson, D. C. Ware, M. Tercel and W. R. Wilson, Biochem. Pharmacol., 2006, 71, 1683–1694 CrossRef CAS.
- L. L. Parker, S. M. Lacy, L. J. Farrugia, C. Evans, D. J. Robins, C. C. O'Hare and I. J. Stratford, J. Med. Chem., 2004, 47, 5683–5689 CrossRef CAS.
- B. Kamaraj and A. Bogaerts, PLoS One, 2015, 10, e0134638 CrossRef.
- A. Garai, A. Kumar, M. Kastan and J. Bartek, Nature, 2004, 432, 316–323 CrossRef.
- M. S. Soengas, R. M. Alarcón, H. Yoshida, A. J. Giaccia, R. Hakem, T. W. Mak and S. W. Lowe, Science, 1999, 284, 156–159 CrossRef CAS PubMed.
- J. Fridman and S. Lowe, Oncogene, 2003, 22, 9030–9040 CrossRef CAS PubMed.
- K. I. Ansari, S. Kasiri, J. D. Grant and S. S. Mandal, J. Biomol. Screening, 2011, 16, 26–35 CrossRef CAS PubMed.
- A. Kyzioł, A. Cierniak, J. Gubernator, A. Markowski, M. Jeżowska-Bojczuk and U. K. Komarnicka, Dalton Trans., 2018, 47, 1981–1992 RSC.
- N. Pradhan, B. M. Pratheek, A. Garai, A. Kumar, V. S. Meena, S. Ghosh and P. K. Maiti, Cell Biol. Int., 2014, 38, 1118–1131 CrossRef CAS PubMed.
- R. L. Siegel, K. D. Miller and A. Jemal, Ca-Cancer J. Clin., 2020, 70, 7–30 CrossRef.
Footnotes |
| † Electronic supplementary information (ESI) available. CCDC 1959243. For ESI and crystallographic data in CIF or other electronic format see DOI: 10.1039/d1ra06227a |
| ‡ Division of Chemistry and Chemical Engineering, California Institute of Technology, Pasadena, CA 91125, United States. |
|
| This journal is © The Royal Society of Chemistry 2021 |
Click here to see how this site uses Cookies. View our privacy policy here. 
 Open Access Article
 This Open Access Article is licensed under a Creative Commons Attribution-Non Commercial 3.0 Unported Licence
 c,
Arif Mohammedd,
Mohmmad Younus Wani
c,
Arif Mohammedd,
Mohmmad Younus Wani