
 Open Access Article
 This Open Access Article is licensed under a Creative Commons Attribution-Non Commercial 3.0 Unported Licence
Effect of methylene chain length of perovskite-type layered [NH3(CH2)nNH3]ZnCl4 (n = 2, 3, and 4) crystals on thermodynamic properties, structural geometry, and molecular dynamics†
Ae Ran Lim *ab
*ab
aDepartment of Carbon Convergence Engineering, Jeonju University, Jeonju 55069, Korea
bDepartment of Science Education, Jeonju University, Jeonju 55069, Korea. E-mail: aeranlim@hanmail.net; arlim@jj.ac.kr
First published on 23rd November 2021
Abstract
The structure of organic–inorganic perovskite [NH3(CH2)4NH3]ZnCl4 was determined; the lattice constants with monoclinic structure were determined to be a = 7.2527 Å, b = 8.1101 Å, c = 10.3842 Å, and β = 80.3436°. The crystal was almost thermally stable up to approximately 560 K. The endothermic peaks at 481 K and 506 K were assigned to the phase transition of the material. In addition, the structural characteristics and molecular dynamics of the cation were studied via magic angle spinning nuclear magnetic resonance experiments. Based on the results, the effects of the length of the CH2 group in the cation of the [NH3(CH2)nNH3]ZnCl4 (n = 2, 3, and 4) crystals were considered. Regardless of whether n was even or odd, the differences in the thermal and physical properties were minimal. Moreover, a difference in molecular motion relative to the length of the cation was observed only at high temperatures. These results provide useful information about the thermal stability and molecular dynamics of [NH3(CH2)nNH3]ZnCl4 crystals and are expected to facilitate potential applications of such compounds in supercapacitors, batteries, and fuel cells.
1. Introduction
Organic–inorganic hybrid compounds with perovskite structures have been extensively investigated in recent years.1 An interesting class of compounds with perovskite structures is the diammonium series, which forms layered perovskite halogen salts, as well as the monoammonium series, which has the formula [CnH2n+1NH3]2MX4 (n = 2, 3, …; M = Mn, Co, Cu, Zn, Cd, X = Cl, Br).2–14 The diammonium series [NH3(CH2)nNH3]MX4 has been studied because of its H-bonds and excellent stability.11–16 [NH3(CH2)nNH3]MX4 compounds with zero- and two-dimensional hybrid perovskite structures have attracted considerable attention in recent years. For M = Mn, Cu, and Cd, the structure consists of a corner-shared octahedron (MX6)2− positioned between the organic layers and is two-dimensional. For M = Co and Zn, isolated tetrahedral structures form inorganic (MX4)2− layers between layers of organic cations and are zero-dimensional.17–22 [NH3(CH2)nNH3]ZnCl4 (M = Zn and X = Cl) compounds crystallize in a perovskite-like structure, in which the link between adjacent ZnCl4 octahedral planes is formed by the alkylene chains with NH3 groups at both ends. The [NH3(CH2)nNH3] organic chains extend along the longest c-axis, are located between the inorganic layers, and are connected to these layers through N–H⋯Cl hydrogen bonding.23,24 Hence, the distance between two neighboring inorganic layers depends on the length of the organic chain. The Zn atom is surrounded by four Cl atoms to form the ZnCl4 tetrahedra. These compounds are of considerable interest because of the diversity of their crystal structures, which govern their thermodynamic properties and structural dynamics. Materials such as perovskites are expected to be used for a variety of applications, including photovoltaics, photocatalysis, batteries,25 energy storage, and micro-and nanoelectronics.26,27 The [NH3(CH2)nNH3]ZnCl4 studied here is expected to be used in various applications as it can improve relatively weak thermal stability and eco-friendly.The synthesis and characterization of [NH3(CH2)nNH3]ZnCl4 crystals with n = 2 and 3 have been reported based on X-ray diffraction.23,24 Recently, the physicochemical properties and structural dynamics of crystals with n = 2 and 3 were investigated in terms of the changes in chemical shifts and nuclear magnetic resonance (NMR) spin–lattice relaxation times with temperature.28,29 Although these compounds have several applications, the physical properties of [NH3(CH2)4NH3]ZnCl4 crystals have not been discussed in detail.
Physicochemical properties are essential for understanding the structural dynamics of the [NH3(CH2)4NH3] cation in the [NH3(CH2)4NH3]ZnCl4 crystal. Solid state NMR has proven a useful method for study of local structure and mobility.30 By studying the spin–lattice relaxation time T1ρ of the each nuclei in different environments, it is possible to obtain information about the dynamical processes occurring in different parts.
The aim of this study was to investigate the thermodynamic properties and molecular dynamics of 1,4-butanediyldiammonium tetrachlorozincate ([NH3(CH2)4NH3]ZnCl4) crystals with n = 4. The crystal structures, phase-transition temperatures, and thermodynamic properties of the crystals were investigated using X-ray diffraction, thermogravimetric analysis (TGA), and differential thermal analysis (DTA). In addition, the chemical shifts and spin–lattice relaxation time T1ρ were analyzed using 1H magic angle spinning (MAS) NMR, 13C MAS NMR, and static 14N NMR, according to the temperature change, to determine the characteristics of the [NH3(CH2)4NH3] cation. The effects of the length of the CH2 group in the cation of the [NH3(CH2)4NH3]ZnCl4 crystal were considered, along with previously reported effects in [NH3(CH2)2NH3]ZnCl4 and [NH3(CH2)3NH3]ZnCl4. The results provide insights into the structural dynamics of [NH3(CH2)nNH3]ZnCl4 crystals (n = 2, 3, and 4) based on the methylene chain length and are expected to facilitate potential applications in the future.
2. Experimental method
An aqueous solution containing NH2(CH2)4NH2·2HCl and ZnCl2 was slowly evaporated at a constant temperature of 300 K to produce single crystals of [NH3(CH2)4NH3]ZnCl4. The transparent crystals were produced within 3–4 weeks and exhibited some good quality shapes. The structure of the crystal at 298 K was analyzed using single-crystal X-ray diffraction at the Seoul Western Center of the Korea Basic Science Institute (KBSI). The crystals were mounted on a Bruker D8 Venture equipped with a 1 μs micro-focus sealed tube with Mo-Kα radiation and a PHOTON III M14 detector.TGA and DTA experiments were performed on a thermogravimetric analyzer (TA Instrument) at a heating rate of 10 K min−1 between from 300 to 873 K under N2 gas. In addition, optical observations were performed using an optical polarizing microscope in the temperature range of 300–680 K, with a Linkam THM-600 heating stage.
NMR spectra of [NH3(CH2)4NH3]ZnCl4 crystals were obtained using a Bruker 400 MHz Avance II + solid-state NMR spectrometer at the Seoul Western Center, KBSI. The Larmor frequencies for the 1H MAS NMR and 13C MAS NMR experiments were 400.13 and 100.61 MHz, respectively. The MAS rate to minimize the spinning sideband was 10 kHz, and tetramethylsilane (TMS) was used as the standard for NMR chemical shifts. The T1ρ values were obtained using a 90° − τ pulse followed by a spin-lock pulse with a duration of τ; the width of the 90° pulse for 1H and 13C was 3.5–3.9 μs. In addition, static 14N NMR spectra were measured under a Larmor frequency of 28.90 MHz. The 14N NMR experiments were performed using one pulse with a 90° pulse width of 6 μs. The chemical shift measurements were referenced using NH4NO3 as the standard sample. The temperature was changed by adjusting the heater current and nitrogen gas flow, and it was maintained within ±0.5 K.
3. Results and discussion
3.1 Crystal structure
The X-ray powder diffraction pattern of the [NH3(CH2)4NH3]ZnCl4 is presented in ESI 1.† Single-crystal X-ray diffraction experiments were conducted on [NH3(CH2)4NH3]ZnCl4 at 298 K, and the structure was determined to be triclinic with the P1 space group. The lattice constants were determined to be a = 7.2839 ± 0.0001 Å, b = 8.1354 ± 0.0001 Å, c = 10.4592 ± 0.0002 Å, and α = 77.6527 ± 0.0005°, β = 80.3358 ± 0.0004°, γ = 82.8355 ± 0.0005° (ESI 2†). In addition, the structures, lattice constants, and space groups of [NH3(CH2)nNH3]ZnCl4 (n = 2, 3, and 4) were shown in ESI 3.† Among the three single crystals, the previously reported crystal structure for [NH3(CH2)3NH3]ZnCl4 with n = 3 is shown in Fig. 1 (CCDC number: 1227730).23 | ||
| Fig. 1 Structure of [NH3(CH2)3NH3]ZnCl4 crystal at 300 K (CCDC number: 1227730). | ||
3.2 Thermal properties
The TGA and DTA experiments were conducted at a heating rate of 10 K min−1; the results shown in Fig. 2. The TGA curve shows that the crystal is almost stable up to approximately 560 K. The endothermic peaks at 481 K (=TC1) and 506 K (=TC2) on the DTA curve were assigned to the phase transition of the material. The molecular weight loss near 560 K marks the onset of partial thermal decomposition (Td). [NH3(CH2)4NH3]ZnCl4 undergoes a loss in molecular weight with increasing temperature. The amount remaining as solid residue was calculated from the molecular weights. Additionally, weight losses of 12% and 25% occurred at temperatures of 604 K and 622 K, respectively, due to the loss of the HCl and 2HCl moieties. Near 900 K, 95% of the total weight of the crystal was lost. To understand the TGA results, the change in the appearance of the crystals with the increase in temperature was confirmed based on optical polarizing microscopy. Even when the temperature rises from 300 K to 490 K, the single crystal is transparent and colorless, but when the temperature reaches 520 K, it starts to melt slightly, and a considerable amount of it melts at 543 K (Fig. 3). | ||
| Fig. 2 Thermogravimetric analysis (TGA) and differential thermal analysis (DTA) curves of [NH3(CH2)4NH3]ZnCl4. | ||
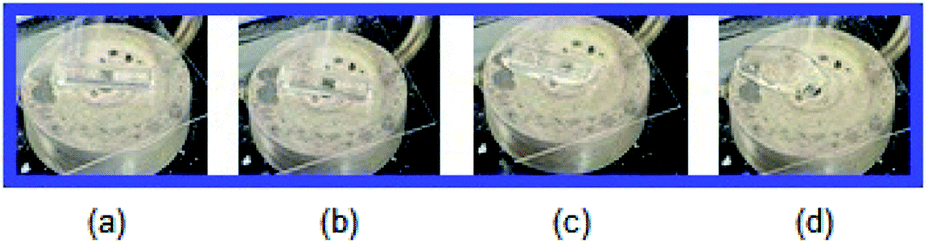 | ||
| Fig. 3 Changes in crystal by optical polarizing microscopy at (a) 300 K, (b) 490 K, (c) 520 K, and (d) 543 K for [NH3(CH2)4NH3]ZnCl4. | ||
3.3 The 1H MAS NMR
The 1H MAS NMR spectra of the [NH3(CH2)4NH3]ZnCl4 crystals were recorded according to the temperature change, and the results of the 1H chemical shifts are shown in Fig. 4; the spinning sidebands are marked with pluses. The 1H chemical shift at 300 K was recorded at 6.95 ppm. Below 380 K, only one resonance line is observed, but the NMR spectrum has an asymmetric shape; the left (a) and right (b) sides at the full-width-at-half-maximum (FWHM) are not equal. The asymmetric shape of the resonance line corresponds to the overlapping lines of 1H in NH3 and CH2. The 1H NMR chemical shifts were observed to be temperature-independent, which implies that the environment around 1H does not change with temperature. However, above 380 K, the 1H signal was split into four sharp lines (2, 3, 4, and 5), matching the number of 1H signals in different environments. The number 1 denotes 1H in NH3, and the remaining four signals represent 1H in CH2, arbitrarily indicated by the numbers 2, 3, 4 and 5. The temperature-sensitive above 380 K, indicating that the structure of the environment surrounding 1H in the [NH3(CH2)4NH3] cation changes. | ||
| Fig. 4 MAS 1H NMR chemical shifts of [NH3(CH2)4NH3]ZnCl4 as a function of temperature. | ||
The 1H MAS NMR spectra were measured with several delay times at each given temperature. The plot of spectral intensities against the delay times is described by a single exponential function. The decay rate of the proton magnetization is characterized by the spin–lattice relaxation time T1ρ:30,31
| P(τ)/P(0) = exp(−τ/T1ρ), | (1) |
Here, P(τ) and P(0) are the signal intensities at times τ and τ = 0, respectively. The T1ρ is an important experimental quantify for the study of the local dynamics. From the slope of the logarithm of intensity–delay time plots, the 1H T1ρ values were determined at several temperatures. An example of magnetization decay at 300 K is represented by the intensity of the signal against the delay time from 0.2 to 150 ms, as shown in Fig. 5. The intensities indicated by arrow vs. delay time are described by a single exponential function from the slope of their recovery traces. Moreover, the 1H T1ρ values in [NH3(CH2)4NH3]ZnCl4 were obtained as a function of inverse temperature, as shown in Fig. 6. As the temperature rises, T1ρ gradually increases without anomalous changes till 350 K, after which it decreases slightly. The Ea values were calculated from T1ρα![[thin space (1/6-em)]](https://www.rsc.org/images/entities/char_2009.gif) exp(±Ea/kBT), where Ea is the activation energy for molecular motion, kB is the Boltzmann constant, and T is the temperature. And, Ea values were determined to be 5.56 ± 0.43 kJ mol−1 at low temperatures and 2.30 ± 0.94 kJ mol−1 at high temperatures, as indicated by the solid lines in Fig. 6.
exp(±Ea/kBT), where Ea is the activation energy for molecular motion, kB is the Boltzmann constant, and T is the temperature. And, Ea values were determined to be 5.56 ± 0.43 kJ mol−1 at low temperatures and 2.30 ± 0.94 kJ mol−1 at high temperatures, as indicated by the solid lines in Fig. 6.
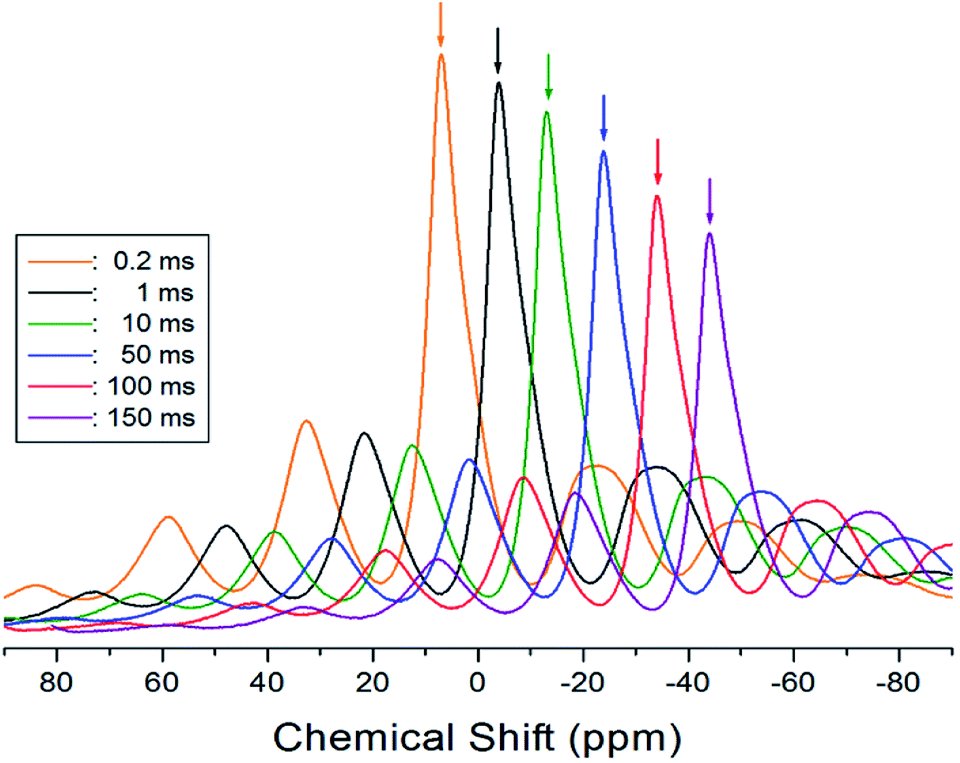 | ||
| Fig. 5 Magnetization recovery curves of the MAS 1H NMR spectrum in [NH3(CH2)4NH3]ZnCl4 at 300 K, for delay times of 0.2–160 ms. | ||
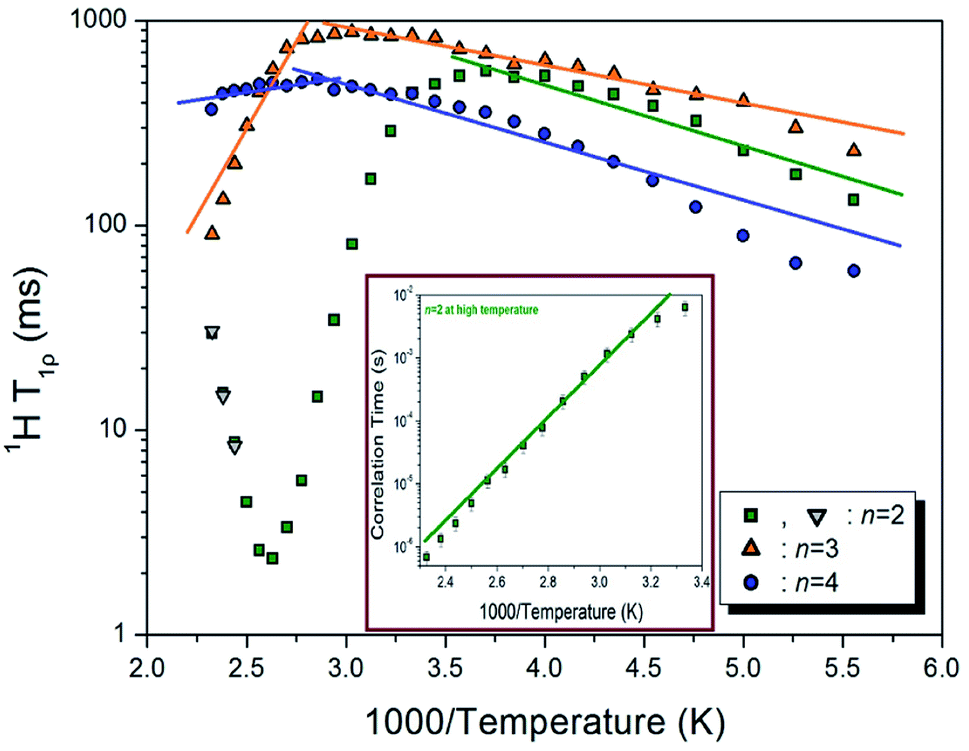 | ||
| Fig. 6 1H NMR spin–lattice relaxation times T1ρ of [NH3(CH2)nNH3]ZnCl4 (n = 2, 3, and 4) as a function of inverse temperature. The solid lines represent activation energy (inset: correlation times for T1ρ as a function of inverse temperature for n = 2). | ||
To understand the effect of the methylene chain length, we compared our results with previously reported findings regarding [NH3(CH2)2NH3]ZnCl4 and [NH3(CH2)3NH3]ZnCl4 (with n = 2 and 3).28,29 The 1H T1ρ results for the three compounds (n = 2, 3, and 4) are shown in Fig. 6 as a function of the inverse temperature. In the case of n = 2, as the temperature rises, T1ρ gradually increases and then reaches a maximum value of 570 ms at 270 K, before rapidly decreasing above 300 K. As shown in Fig. 6, T1ρ subsequently reaches its minimum value near 380 K and then tends to increase again.28 This trend between 300 and 430 K indicates the existence of molecular motion. The T1ρ values are related to the correlation time τC for molecular motion, as per the Bloembergen–Purcell–Pound (BPP) theory,32 which states that the local field fluctuation is caused by thermal motion. The τC–1000/T plot, represented by the olive line on a logarithmic scale, is shown in the inset of Fig. 6. The Ea values for 1H below and above 300 K were estimated to be 4.91 ± 0.62 and 78.17 ± 4.39 kJ mol−1, respectively. On the other hand, for n = 3, T1ρ initially increased and then abruptly decreased when the temperature increased. The T1ρ values of the protons were 100–1000 ms, and these values decreased abruptly at 360 K. The values of Ea for 1H at low and high temperatures were 3.53 ± 0.02 and 31.86 ± 3.82 kJ mol−1, respectively.29
The Ea values at low and high temperatures for the three compounds are listed in Table 1. At low temperatures, Ea was almost the same as the length of CH2 in the cation, whereas at high temperatures, Ea tended to decrease.
| 1H Ea (kJ mol−1) | 13C Ea (kJ mol−1) | |||
|---|---|---|---|---|
| Low temp. | High temp. | Low temp. | High temp. | |
| n = 2 | 4.91 ± 0.62 | 78.17 ± 4.39 | 2.23 ± 0.45 | 38.88 ± 7.33 |
| n = 3 | 3.53 ± 0.02 | 31.86 ± 3.82 | 1.57 ± 0.21 | 1.57 ± 0.21 |
| n = 4 | 5.56 ± 0.43 | 2.30 ± 0.94 | 0.72 ± 0.29 | 6.11 ± 0.58 |
3.4 The 13C MAS NMR
The 13C MAS NMR chemical shifts for CH2 in the [NH3(CH2)4NH3]ZnCl4 crystal were recorded at several temperatures. One of the MAS 13C NMR spectra at 300 K is displayed in Fig. 7, which shows that CH2-a in the [NH3(CH2)4NH3] cation is far from NH3 and that CH2-b is located near NH3. The signal for the TMS reference was measured at 38.3 ppm, and this value was set to 0 ppm for the 13C chemical shift. The 13C NMR chemical shifts of CH2 were separated into two inequivalent lines for CH2-a and CH2-b in [NH3(CH2)4NH3]ZnCl4. The CH2-a and CH2-b resonance lines themselves were also split into two signals each. This is because the environments of the four carbons in the cation are slightly different. 13C chemical shifts were observed at 24.88 and 26.26 ppm for CH2-a and at 40.70 and 41.24 ppm for CH2-b. In addition, the 13C NMR chemical shifts were nearly temperature-independent (ESI 4†). | ||
| Fig. 7 MAS 13C NMR chemical shifts for CH2-a and CH2-b of [NH3(CH2)4NH3] ZnCl4 at 300 K. | ||
The 13C T1ρ relaxations are not affected by spin diffusion, due to the small dipolar coupling, which arises because of the low natural abundance of 13C. The intensity changes of the 13C NMR spectrum for various delay times in [NH3(CH2)4NH3]ZnCl4 were measured, and all the decay curves for CH2-a and CH2-b were plotted using a single exponential function. The 13C T1ρ values shown in Fig. 8 were obtained from the slope of the recovery traces for CH2-a and CH2-b, in order to understand the differences in dynamics of 13C at different sites. As the temperature increased, the T1ρ values increased at all temperatures. The 13C T1ρ values for CH2-b close to NH3 are smaller than those for CH2-a; this indicates that the 13C T1ρ values for CH2-b are more flexible than those for CH2-a. The Ea values represented by the solid lines at low and high temperatures are 0.72 ± 0.29 and 6.11 ± 0.58 kJ mol−1, respectively.
 | ||
| Fig. 8 13C NMR spin–lattice relaxation times T1ρ of [NH3(CH2)nNH3]ZnCl4 (n = 2, 3, and 4) as a function of inverse temperature. The solid lines represent activation energy. | ||
To understand the effect of the length n of the CH2 group in the [NH3(CH2)nNH3] cation, we compared [NH3(CH2)2NH3]ZnCl4, [NH3(CH2)3NH3]ZnCl4, and [NH3(CH2)4NH3]ZnCl4 with n = 2, 3, and 4. The 13C T1ρ results are also shown in Fig. 8 for the three compounds (n = 2, 3, and 4) as a function of the inverse temperature. In the case of n = 2, the 13C T1ρ value decreases sharply above 300 K with increasing temperature. The 13C T1ρ value at 300 K is 8.35 ms, and at 430 K, it sharply drops to 0.16 ms.28 The activation energies calculated from the slopes of the logT1ρ vs. inverse temperature curves are determined to be 2.23 ± 0.45 and 38.88 ± 7.33 kJ mol−1 below and above 300 K, respectively. In addition, the Ea values for CH2-b below 300 K are almost identical to those of CH2-a within the experimental error range. In the case of n = 3, the 13C T1ρ values decreased slightly with increasing temperature but remained between 20 and 60 ms. Ea was 1.57 ± 0.21 kJ mol−1 at all temperatures.
3.5 Static 14N NMR
Static 14N NMR investigations of [NH3(CH2)4NH3]ZnCl4 single crystals were conducted over a temperature range of 180–430 K. The 14N spectra were obtained using the one-pulse method using static NMR. Two 14N NMR signals were expected from the quadrupole interactions under a spin number of I = 1.30 The 14N NMR spectrum varied with increasing temperature, as shown in Fig. 9. The measurements were performed by keeping the c-axis of the single crystals parallel to the direction of the magnetic field. It was not easy to get 14N were signals because we were measuring at the low frequency of 28.90 MHz. The four plots in the graph, shown in Fig. 9, were attributed to the two inequivalent NH3-a and NH3-b ions. The two inequivalent 14N resonance lines due to NH3-a and NH3-b are related to the two types of 13C resonance lines due to CH2-a and CH2-b. NH3-a and NH3-b were arbitrarily determined for NH3. The four resonance lines of the two pairs decreased with increasing temperature to minima near 250 K (red circle) and 370 K (olive square), respectively, and then increased again. Symbols with the same colors indicate the same pairs for 14N. In addition, the change in the 14N resonance frequency with temperature is due to structural geometry change, which means a change in the quadrupole coupling constant.34 the chemical shifts of the 14N signals changed almost continuously without any anomalous changes. The changes in the 14N chemical shift as a function of temperature were attributed to the variations in the structure of the N–H⋯Cl hydrogen bonds, indicating changes in the atomic configurations near the 14N nuclei. | ||
| Fig. 9 14N resonance frequency of [NH3(CH2)4NH3]ZnCl4 single crystal as a function of temperature. | ||
4. Conclusions
Based on information obtained from NMR analyses of the methylene chain length, the structural dynamics of the [NH3(CH2)nNH3] cation in [NH3(CH2)nNH3]ZnCl4 crystals were analyzed in this study. We compared the physical properties of previously reported [NH3(CH2)2NH3]ZnCl4 and [NH3(CH2)3NH3]ZnCl4 crystals with those of [NH3(CH2)4NH3]ZnCl4 examined in this study.The 1H chemical shifts for the NH3(CH2)nNH3 cation (n = 2, 3, and 4) were found to be nearly temperature-independent. The two inequivalent CH2-a and CH2-b were distinguished through 13C NMR experiments, and the two inequivalent 14N were distinguished based on 14N NMR results.
The behavior of T1ρ for molecular motions with a correlation time τC is described in two regimes: fast- and slow-motion regimes. At low temperatures, the 1H T1ρ values for all three crystals indicated fast motion: ω1τC ≪ 1, T1ρ−1αexp(Ea/kBT). Their values at high temperatures indicated slow motion: ω1τC ≫ 1, T1ρ−1αω1−2exp(Ea/kBT).30,33 However, the 13C T1ρ values at low and high temperatures for n = 2 and 3 indicated slow motion. In the case of n = 4, 13C T1ρ at all temperatures undergoes the fast motion, unlike in the cases of n = 2 and 3. In addition, the 1H and 13C Ea values, measured according to the length of the CH2 groups in the cation chain, decreased because 1H and 13C became more flexible with increasing length. According to the NMR T1ρ result, as the length of the cation increases, the motion of the methylene chain becomes flexible at high temperatures. This result correlates with the effect of electron–phonon interactions on the luminescence of single crystals of 2D perovskite reported by Gong et al.35 The NMR measurements of T1ρ, density functional theory simulations and experimental atomic displacements reveal that molecular motion was slowest and most rigid in the brightest emitter.
Solid-state NMR provides information of the material's thermal stability, structural change, and dynamics of the molecular motion depending on the temperature. The molecular motion differed according to the length of the cation and the temperature, and our solid-state NMR study on perovskites can therefore highlight potentials for each perovskite material for specific applications.
Conflicts of interest
There are no conflicts to declare.Acknowledgements
This research was supported by the Basic Science Research program through the National Research Foundation of Korea, funded by the Ministry of Education, Science, and Technology (grant numbers 2018R1D1A1B07041593 and 2016R1A6A1A03012069).References
- A. R. Lim, J. Solid State Chem., 2021, 295, 121909 CrossRef CAS.
- N. Narita and I. Yamada, J. Phys. Soc. Jpn., 1996, 65, 4054 CrossRef CAS.
- D. B. Mitzi, J. Chem. Soc., Dalton Trans., 2001, 1, 1 RSC.
- K. Pradeesh, J. J. Baumberg and G. Vijaya Prakash, Appl. Phys. Lett., 2009, 95, 173305 CrossRef.
- Z. Cheng and J. Lin, CrystEngComm, 2010, 12, 2646 RSC.
- K. Pradeesh, G. S. Yadav, M. Singh and G. Vijaya Prakash, Mater. Chem. Phys., 2010, 124, 44 CrossRef CAS.
- S. Saikumar, J. J. Ahmad, G. Baumberg and G. Vijaya Prakash, Scr. Mater., 2012, 67, 834 CrossRef.
- A. R. Lim, J. Solid State Chem., 2021, 302, 122438 CrossRef CAS.
- S. Ahmad, C. Hanmandlu, P. K. Kanaujia and G. Vijaya Prakash, Opt. Mater. Express, 2014, 4, 1313 CrossRef CAS.
- S. Gonzalez-Carrero, R. E. Galian and J. Perez-Prieto, Part. Part. Syst. Charact., 2015, 32, 709 CrossRef CAS.
- B. Staskiewicz, O. Czupinski and Z. Czapla, J. Mol. Struct., 2014, 1074, 723 CrossRef CAS.
- B. Staskieqicz, I. Turowska-Tyrk, J. Baran, C. Gorecki and Z. Czapla, J. Phys. Chem. Solids, 2014, 75, 1305 CrossRef.
- Z. Czapla, J. Przeslawski, M. Crofton, J. Janczak, O. Czupinski, A. Ingram and M. Kostrzewa, Phase Transitions, 2017, 90, 637 CrossRef CAS.
- S. K. Abdel-Adal, G. Kocher-Oberlehner, A. Ionov and R. N. Mozhchil, Appl. Phys. A: Mater. Sci. Process., 2017, 123, 531 CrossRef.
- R. Kind, S. Plesko, P. Gunter, J. Ross and J. Fousek, J. Phys. Chem. Solid., 2015, 75, 1305 Search PubMed.
- M. F. Mostafa, A. S. Atallah and R. Emrick, Appl. Phys., 1997, 81, 4134 CAS.
- C. Sourisseau, G. Lucazeau and A. J. Dianoux, J. Phys., 1983, 44, 967 CrossRef CAS.
- K. Chhor, J. F. Bocquet and C. Pommier, J. Chem. Thermodyn., 1985, 17, 379 CrossRef CAS.
- V. V. Eremenko, V. I. Fomin and V. S. Kurnosov, Phys. B, 1994, 194–196, 187 CrossRef CAS.
- J.-C. Bissey, N. Filloleau, N.-B. Chanh, R. Berger and S. Flandrois, Solid State Commun., 1998, 106, 385 CrossRef CAS.
- M. M. Bogdan, M. I. Kobets and E. N. Khats'ko, Low Temp. Phys., 1999, 25, 192 CrossRef CAS.
- S. J. Lee, M. Y. Choi and A. R. Lim, ACS Omega, 2021, 6, 15392 CrossRef CAS PubMed.
- W. T. A. Harrison, Acta Crystallogr., Sect. E: Struct. Rep. Online, 2005, 61, m1951 CrossRef CAS.
- A. Kallel, J. Fail, H. Fuess and A. Daoud, Acta Crystallogr., Sect. B: Struct. Crystallogr. Cryst. Chem., 1980, 36, 2788 CrossRef.
- W.-J. Yin, T. Shi and Y. Yan, Adv. Mater., 2014, 26, 4653 CrossRef CAS PubMed.
- W.-Q. Liao, Y. Zhang, C.-L. Hu, J.-G. Mao, H.-Y. Ye, P.-F. Li, S. D. Huang and R.-G. Xiong, Nat. Commun., 2015, 6, 7338 CrossRef PubMed.
- B. Staskieqicz and A. Staskieqicz, J. Phys. Chem. Solids, 2017, 106, 65 CrossRef.
- A. R. Lim, ACS Omega, 2020, 5, 31417 CrossRef CAS PubMed.
- A. R. Lim, S. H. Kim and Y. L. Joo, Sci. Rep., 2021, 11, 8408 CrossRef CAS PubMed.
- A. Abragam, The Principles of Nuclear Magnetism, Oxford University press, 1961 Search PubMed.
- R. K. Harris, Nuclear Magnetic Resonance Spectroscopy, Pitman, London, 1983 Search PubMed.
- N. Bloembergen, E. M. Purcell and R. V. Pound, Phys. Rev., 1948, 73, 679 CrossRef CAS.
- A. R. Lim, RSC Adv., 2021, 11, 17622 RSC.
- M. B. Yoon, W. J. Lee and A. R. Lim, RSC Adv., 2020, 10, 34800 RSC.
- X. Gong, O. Voznyy, A. Jain, W. Liu, R. Sabatini, Z. Piontkowski, G. Walters, G. Bappi, S. Nokhrin, O. Bushuyev, M. Yuan, R. Comin, D. McCamant, S. O. Kelley and E. H. Sargent, Nat. Mater., 2018, 17, 550 CrossRef CAS PubMed.
Footnote |
| † Electronic supplementary information (ESI) available. See DOI: 10.1039/d1ra07656f |
| This journal is © The Royal Society of Chemistry 2021 |