 Open Access Article
Evaluation of enzymatic and magnetic properties of γ-glutamyl-[1-13C]glycine and its deuteration toward longer retention of the hyperpolarized state†
Yohei Kondo a,
Yutaro Saito
 a,
Abdelazim Elsayed Elhelalyb,
Fuminori Hyodob,
Tatsuya Nishihara‡
a,
Marino Itodaa,
Hiroshi Nonaka§
a,
Abdelazim Elsayed Elhelalyb,
Fuminori Hyodob,
Tatsuya Nishihara‡
a,
Marino Itodaa,
Hiroshi Nonaka§
 a,
Masayuki Matsuoc and
Shinsuke Sando
 *ad
*ad
aDepartment of Chemistry and Biotechnology, Graduate School of Engineering, The University of Tokyo, 7-3-1 Hongo, Bunkyo-ku, Tokyo 113-8656, Japan. E-mail: ssando@chembio.t.u-tokyo.ac.jp
bDepartment of Radiology, Frontier Science for Imaging, School of Medicine, Gifu University, 1-1 Yanagido, Gifu 501-1194, Japan
cDepartment of Radiology, School of Medicine, Gifu University, 1-1 Yanagido, Gifu 501-1194, Japan
dDepartment of Bioengineering, Graduate School of Engineering, The University of Tokyo, 7-3-1 Hongo, Bunkyo-ku, Tokyo 113-8656, Japan
First published on 17th November 2021
Abstract
Dynamic nuclear polarization (DNP) is an emerging cutting-edge method of acquiring metabolic and physiological information in vivo. We recently developed γ-glutamyl-[1-13C]glycine (γ-Glu-[1-13C]Gly) as a DNP nuclear magnetic resonance (NMR) molecular probe to detect γ-glutamyl transpeptidase (GGT) activity in vivo. However, the detailed enzymatic and magnetic properties of this probe remain unknown. Here, we evaluate a γ-Glu–Gly scaffold and develop a deuterated probe, γ-Glu-[1-13C]Gly-d2, that can realize a longer lifetime of the hyperpolarized signal. We initially evaluated the GGT-mediated enzymatic conversion of γ-Glu–Gly and the magnetic properties of 13C-enriched γ-Glu–Gly (γ-Glu-[1-13C]Gly and γ-[5-13C]Glu–Gly) to support the validity of γ-Glu-[1-13C]Gly as a DNP NMR molecular probe for GGT. We then examined the spin-lattice relaxation time (T1) of γ-Glu-[1-13C]Gly and γ-Glu-[1-13C]Gly-d2 under various conditions (D2O, PBS, and serum) and confirmed that the T1 of γ-Glu-[1-13C]Gly and γ-Glu-[1-13C]Gly-d2 was maintained for 30 s (9.4 T) and 41 s (9.4 T), respectively, even in serum. Relaxation analysis of γ-Glu-[1-13C]Gly revealed a significant contribution of the dipole–dipole interaction and the chemical shift anisotropy relaxation pathway (71% of the total relaxation rate at 9.4 T), indicating the potential of deuteration and the use of a lower magnetic field for realizing a longer T1. In fact, by using γ-Glu-[1-13C]Gly-d2 as a DNP probe, we achieved longer retention of the hyperpolarized signal at 1.4 T.
Introduction
The cell surface-bound enzyme γ-glutamyl transpeptidase (GGT) catalyzes a reaction that initiates the cellular uptake of the biological antioxidant glutathione (GSH).1 The γ-glutamyl group of its natural substrate GSH is accurately recognized by GGT, and the γ-peptide bond is hydrolyzed or glutamic acid (Glu) is transferred to acceptors such as amino acids and peptides. The resulting cysteinyl–glycine (Cys–Gly) undergoes further metabolism by dipeptidases to generate cysteine (Cys) and glycine (Gly). These amino acids are then taken up by cells and resynthesized into intracellular GSH.2 Thus, GGT is an important enzyme involved in the redox state through GSH homeostasis in vivo. In particular, GGT is abundantly expressed in cancers such as soft tissue sarcoma and ovarian adenocarcinoma.3 Thus, GGT could be a useful cancer biomarker, and the detection of GGT expression and its activity in vivo are of biological and medical importance.The expression and activity of GGT have been detected using various detection modalities. For example, GGT expression in vivo can be visualized using positron emission tomography (PET),4,5 but this approach cannot directly detect GGT activity. Fluorescent molecular probes for detecting GGT activity have been extensively studied, and some have been applied to fluorescence-guided surgery.6,7 Furthermore, molecular imaging in vivo using hyperpolarization has recently attracted attention because it significantly improves the sensitivity of nuclear magnetic resonance and imaging (NMR/MRI).8
Dissolution dynamic nuclear polarization (d-DNP) is a reliable method of hyperpolarization that can increase the detection sensitivity of 13C-enriched biomolecules, including 13C-pyruvic acid, and acquire physiological information about metabolism and pH in vivo.9,10 DNP NMR using 13C-pyruvic acid has also been clinically applied to detect human prostate cancers, indicating the medical and biological value of DNP NMR.11,12
We recently developed γ-glutamyl-[1-13C]glycine (γ-Glu-[1-13C]Gly) as a DNP NMR molecular probe to non-invasively detect GGT activity in vivo (Fig. 1).13 The structure of γ-Glu-[1-13C]Gly comprises a γ-Glu group as a GGT recognition moiety and [1-13C]Gly as a signaling moiety. The γ-Glu-[1-13C]Gly probe was converted to the product, [1-13C]Gly, by an enzymatic reaction with GGT. The 13C chemical shift change between the probe and the product was 4.3 ppm, which is large enough to distinguish in vivo. The spin-lattice relaxation time (T1) correlates with the retention time of the hyperpolarized state, and the probe and product had sufficiently long T1 values of 30 s (9.4 T, H2O) and 45 s (9.4 T, H2O), respectively, to detect GGT activity in rat kidneys. Since then, γ-Glu-[1-13C]Gly has been applied in studies of rat kidneys function, subcutaneous ovarian carcinoma, and MiaPaCa-2 xenografts, as well as glioma models, and it should have further applications in vivo.14–17 However, the structure–activity relationship and detailed magnetic parameters of γ-Glu-[1-13C]Gly, which are important for DNP MRI studies, have not been investigated.
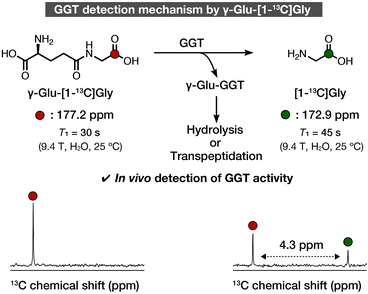 | ||
| Fig. 1 Schematic illustration of detection of GGT using γ-Glu-[1-13C]Gly. 13C Chemical shift and T1 values are cited from ref. 13. Colored atoms indicate isotope-enriched 13C. | ||
Here, we report an evaluation of the enzymatic and magnetic properties of γ-Glu-[1-13C]Gly and the development of a deuterated probe, γ-Glu-[1-13C]Gly-d2, that can achieve longer lifetime of the hyperpolarized signal than the conventional probe.
Experimental
Synthesis
To a 25 mL round-bottom flask with a magnetic stirring bar, N-Cbz-γ-Glu(OBn)-OSu (403 mg, 861 μmol, 1.0 equiv.) was added. After adding THF (2.0 mL), H2O (2.0 mL), [1-13C]Gly-d2 (66.8 mg, 856 μmol), and Et3N (349 μL, 2.50 mmol, 2.9 equiv.), the reaction mixture was stirred at room temperature for 30 min. The resulting mixture was evaporated to remove the solvent. After acidifying with 0.1 M HCl aq., the residue was extracted with EtOAc (30 mL × 2) and washed with 0.1 M HCl aq. (30 mL × 2) and brine (30 mL × 1). The resulting solution was dried over anhydrous Na2SO4, filtered, and concentrated under reduced pressure. The residue was subjected to silica-gel column chromatography (CH2Cl2/MeOH) to afford N-Cbz-Glu(OBn)-[1-13C]Gly-d2 (305 mg, 83% yield based on [1-13C]Gly-d2) as a white solid.
1H NMR (400 MHz, CDCl3) δ 7.38–7.29 (m, 10H), 6.50 (brs, 1H), 5.66 (d, J = 7.6 Hz, 1H), 5.21–5.14 (m, 2H), 5.10 (s, 2H), 4.49–4.44 (m, 1H), 4.07–3.94 (m, 0.16H, deuterated), 2.34–2.21 (m, 3H), 2.00–1.91 (m, 1H); 13C NMR (100 MHz, CDCl3) δ 172.7 (13C-labeled), 171.9, 170.9, 156.8, 136.1, 135.3, 128.8, 128.8, 128.5, 128.3, 67.7, 67.5, 53.7, 32.2, 28.8, two carbons are not observed due to overlapping, one carbon is not observed due to peak broadening; HRMS (ESI) m/z calcd for C2113CH22D2N2NaO7 [M + Na]+: 454.1635, found 454.1637.
1H NMR (400 MHz, D2O) δ 3.93 (brs, 0.16H, deuterated), 3.83 (t, J = 6.2 Hz, 1H), 2.59–2.46 (m, 2H), 2.25–2.11 (m, 2H); 13C NMR (100 MHz, D2O) δ 177.4 (13C-labeled), 175.2, 174.7, 54.9, 43.7 (brs, deuterated carbon), 32.1, 26.9, 13C NMR was acquired under the neutral condition by adjusting pD using NaOD aqueous solution; HRMS (ESI) m/z calcd for C613CH10D2N2NaO5 [M + Na]+: 230.0797, found 230.0799.
Glu production monitoring with UHPLC
To 100 μL of the substrate solution (5 mM of γ-Glu–Gly, γ-Glu–Gly–Gly, and GSH, or 0, 0.3125, 0.625, 1.25, 2.5, and 5.0 mM of Glu in 0.1 M PB as calibration samples) was added GGT enzyme solution (1 U mL−1 in 0.1 M PB, 15 μL) or 0.1 M PB (15 μL). The reaction mixtures were incubated at 37 °C for 30 min or 60 min. The reaction was quenched by adding GGT inhibitor solution (10 mM of GGsTop® in DMSO, 5 μL). To the vessel containing 80 μL of 50 mM borate buffer (pH 8.0) containing EDTA (20 mM) and 20 μL of 4-fluoro-7-nitrobenzofurazan (20 mM) solution in acetonitrile was added 20 μL of the enzymatic reaction mixture. The resulting mixture was incubated at 60 °C. The 4-fluoro-7-nitrobenzofurazan labeling reaction was quenched by adding 40 μL of 50 mM HCl aqueous solution. The solution was filtered and used for UHPLC analysis. The concentration of Glu that was produced by GGT-mediated reaction from the substrates was quantified by comparing the fluorescent intensity with that of calibration samples of Glu. One unit of GGT was defined as the amount of the enzyme that generates 1.0 μmol of p-nitroaniline from γ-Glu–p-nitroanilide per minute at 37 °C (2.5 mM γ-Glu–p-nitroanilide in 0.1 M PB).T1 measurements
T1 values were determined by inversion recovery method using JEOL JNM-ECS 400 (9.4 T), JEOL JNM-ECA 500 (11.7 T), and JEOL JNM-ECA 600 (14.1 T). Measurement conditions: D2O, PBS, or mouse serum containing 10% D2O, 10 mM of the compounds, 37 °C. pD was adjusted to 7.4 ± 0.1 with DCl aq. or NaOD aq. in D2O. pH was adjusted to 7.4 ± 0.1 with HCl aq. or NaOH aq. in PBS. For the measurements in PBS, glass capillary containing D2O was used to get the lock signal. All T1 measurements were conducted under thermal equilibrium state (n = 3).NMR measurements for 13C chemical shift
13C chemical shift of probes and products were determined in D2O using 1,4-dioxane (67.19 ppm) as an internal standard at 9.4 T. Measurement conditions: 5 mM of the substrate, 37 °C, D2O. pD was adjusted to 7.4 ± 0.1 with DCl aq. or NaOD aq. All measurements were conducted at thermal equilibrium state.R1DD analysis
1H–13C dipole–dipole (DD) relaxation is caused by DD interactions mainly due to nearby 1H nuclei. The extent of DD relaxation can be denoted using the relaxation rate, R1DD. R1DD was estimated with a method utilizing NOE. Measurement conditions: 9.4 T, 10 mM, 37 °C, D2O. pD was adjusted to 7.4 ± 0.1 by DCl aq. or NaOD aq. See the detailed protocols described in the previous report.19R1CSA analysis
Chemical shift anisotropy (CSA) relaxation is caused by CSA of the nucleus and molecular tumbling. The extent of CSA relaxation can be denoted using the relaxation rate, R1CSA. R1CSA was estimated by measuring T1 at various external magnetic field strength (9.4, 11.7, and 14.1 T) under thermal equilibrium state according to the previous reports.20,21 R1CSA contribution at 9.4 T was calculated using the following eqn (1).| R1CSA(9.4 T) = R1(9.4 T) − R1(0 T) | (1) |
Hyperpolarized experiments
Sample preparation for hyperpolarized experiments
To 82.5 mg of γ-Glu-[1-13C]Gly was added 38 μL of 5 M NaOH aqueous solution, 60 μL of H2O, and 15 μL of 10 M NaOH aqueous solution, successively. Similarly, to 81.6 mg of γ-Glu-[1-13C]Gly-d2 was added 38 μL of 5 M NaOH aqueous solution, 60 μL of H2O, and 15 μL of 10 M NaOH aqueous solution, successively. After dissolving the probes, the final volumes became 180 μL for both γ-Glu-[1-13C]Gly and γ-Glu-[1-13C]Gly-d2. Therefore, the final concentration of NaOH and the probes were 1.9 M and 2.2 M, respectively.Hyperpolarized dynamic 13C NMR
25 μL of 2.2 M γ-Glu-[1-13C]Gly or γ-Glu-[1-13C]Gly-d2 in 1.9 M NaOH aqueous solution with 15 mM OX063 was hyperpolarized using the HyperSense DNP polarizer for 1 h. Hyperpolarized probe solution was acquired by the dissolution process with 3 mL of PBS containing 0.3 mM EDTA. 600 μL of hyperpolarized probe solution was used for acquiring dynamic 13C NMR (flip angle = 10°, repetition time = 4.5 s) with a 1.4 T Spinsolve 60 Carbon High Performance benchtop NMR apparatus.Results and discussion
Validation of γ-Glu–Gly scaffold and 13C-enrichment of C1 in Gly residue
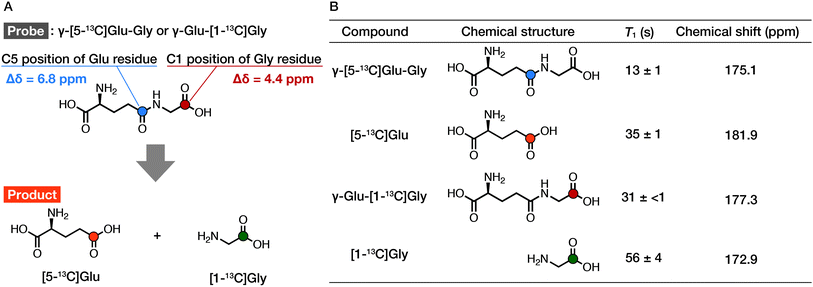
We prepared γ-[5-13C]Glu–Gly according to Scheme S1.† The 13C chemical shift of each probe/product in D2O under neutral conditions was determined at 9.4 T using 1,4-dioxane (67.19 ppm) as an internal standard for 13C NMR (Fig. 3B). The chemical shift differences between the probe and the product were 6.8 ppm for γ-[5-13C]Glu–Gly/[5-13C]Glu and 4.4 ppm for γ-Glu-[1-13C]Gly/[1-13C]Gly. The chemical shift change given by γ-Glu-[1-13C]Gly/[1-13C]Gly was distinguishable in vivo. The chemical shift change of 6.8 ppm by γ-[5-13C]Glu–Gly/[5-13C]Glu was even larger, suggesting that both pairs can clearly distinguish the hyperpolarized signals of the probe and the product.
We then evaluated the T1 values of each probe and product at 9.4 T using inversion recovery (Fig. 3B). The T1 of γ-[5-13C]Glu–Gly was 13 ± 1 s (9.4 T, 10 mM, D2O, 37 °C), and that of the corresponding product, [5-13C]Glu, was 35 ± 1 s (9.4 T, 10 mM, D2O, 37 °C). The T1 value of the conventional probe, γ-Glu-[1-13C]Gly, was 31 ± <1 s (9.4 T, 10 mM, D2O, 37 °C), and that of the corresponding product, [1-13C]Gly, was 56 ± 4 s (9.4 T, 10 mM, D2O, 37 °C). The results of measuring the T1 of γ-[5-13C]Glu–Gly and γ-Glu-[1-13C]Gly revealed that the T1 of the carbonyl carbons in the same molecule can differ ∼2-fold depending on the 13C-labeling position (13 ± 1 vs. 31 ± <1 s). These results indicated that the chemical shift changes of both pairs of the probe and the product were sufficient (6.8 vs. 4.4 ppm), whereas the T1 of γ-[5-13C]Glu–Gly was much shorter than that of γ-Glu-[1-13C]Gly (13 ± 1 vs. 31 ± <1 s). Therefore, γ-Glu-[1-13C]Gly with the longer T1, is the preferred DNP probe for detecting GGT because the probe must retain the hyperpolarized signal long enough to generate an obvious enzymatic reaction product.
Relaxation mechanism analysis of γ-Glu-[1-13C]Gly and γ-Glu-[1-13C]Gly-d2
We first investigated the T1 relaxation effect of the α-1H of the Gly residue of the probe (Fig. 4A). We synthesized γ-Glu-[1-13C]Gly-d2 as shown in Scheme 1. The quantitative N-hydroxyl succinimide (NHS) esterification proceeded using 1-ethyl-3-(3-dimethylaminopropyl)carbodiimide hydrochloride (EDCI·HCl) as a coupling agent. The NHS ester can be purified by extraction and recrystallization, and isolated in 99% yield. By coupling of the NHS ester with [1-13C]Gly-d2,24 N-Cbz-γ-Glu(OBn)-[1-13C]Gly-d2 was synthesized. γ-Glu-[1-13C]Gly-d2 was then obtained via hydrogenation to deprotect Cbz and Bn groups. Details of the synthetic procedure are described in the Experimental section. This scheme can provide sufficient amounts (gram scale) of γ-Glu-[1-13C]Gly and γ-Glu-[1-13C]Gly-d2.
T1 measurements of γ-Glu-[1-13C]Gly and γ-Glu-[1-13C]Gly-d2 under various solvent conditions
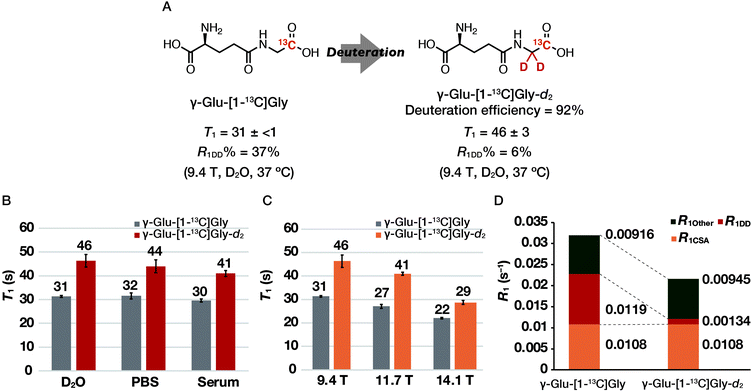
The T1 of γ-Glu-[1-13C]Gly and γ-Glu-[1-13C]Gly-d2 was evaluated at 9.4 T under various solvent conditions. In the previous report, only the T1 at 25 °C in H2O has been reported. However, T1 values in PBS and serum are also important for DNP NMR/MRI experiments because hyperpolarized probes are often dissolved in aqueous buffers and circulate in biological media to reach a target site after administration in vivo. Thus, we measured the T1 of γ-Glu-[1-13C]Gly and γ-Glu-[1-13C]Gly-d2 at 9.4 T in D2O, PBS, and serum (Fig. 4B). The results showed that even in mouse serum, the T1 was 30 ± 1 s for γ-Glu-[1-13C]Gly and 41 ± 1 s for γ-Glu-[1-13C]Gly-d2 (9.4 T, 10 mM, mouse serum with 10% D2O, 37 °C), which was comparable to that in D2O. These results suggested that the hyperpolarization lifetime of these probes should be sufficient, even in a biological environment.T1 and R1DD analysis of γ-Glu-[1-13C]Gly and γ-Glu-[1-13C]Gly-d2
We measured the T1 of γ-Glu-[1-13C]Gly-d2 to determine the DD relaxation effect of the α-1H of the Gly residue (Fig. 4A). The deuteration efficiency of γ-Glu-[1-13C]Gly-d2 was 92% and the T1 was 46 ± 3 s (9.4 T, 10 mM, D2O, 37 °C). Deuteration of the α-1H of the Gly residue in γ-Glu-[1-13C]Gly resulted in a 1.5-fold longer T1 (46 ± 3 vs. 31 ± <1 s).We investigated how α-deuteration of the Gly residue reduced the contribution of DD relaxation of the probe to overall T1 relaxation (Fig. 4A). The relaxation rate of the nucleus, R1 (=1/T1), is described as the sum of the contributions from independent relaxation factors as denoted in eqn (2).25,26
 | (2) |
Analysis of R1CSA and T1 measurements of γ-Glu-[1-13C]Gly and γ-Glu-[1-13C]Gly-d2 at various magnetic field strengths
We measured the T1 of γ-Glu-[1-13C]Gly and γ-Glu-[1-13C]Gly-d2 at 9.4, 11.7, and 14.1 T to determine the contribution of the magnetic field-dependent relaxation pathway. The CSA relaxation mechanism increases in proportion to the square of the external magnetic field strength (B0).20,21 Assuming that magnetic field-dependent relaxation mechanisms other than CSA are negligible, R1CSA can be estimated by examining the magnetic field dependence of T1. The results of the T1 measurements of γ-Glu-[1-13C]Gly and γ-Glu-[1-13C]Gly-d2 in D2O at 9.4, 11.7, and 14.1 T showed that T1 tends to become shorter with increasing magnetic field strengths of 9.4, 11.7, and 14.1 T (γ-Glu-[1-13C]Gly: 31 ± <1, 27 ± 1, and 22 ± <1 s respectively; γ-Glu-[1-13C]Gly-d2: 46 ± 3, 41 ± 1, and 29 ± 1 s, respectively; Fig. 4C). This is because relaxation due to CSA increases at higher magnetic field strength, and results in a shorter T1. The contribution of R1CSA to total R1 calculated from the R1–B02 plot in D2O was 34% for γ-Glu-[1-13C]Gly at 9.4 T (Fig. 4D and S1†). This result is consistent with the fact that carbonyl 13C generally exhibits a large relaxation due to the CSA mechanism.22 Together with the results of the R1DD analysis, 71% of the relaxation pathway of γ-Glu-[1-13C]Gly at 9.4 T was accounted for by the DD and CSA relaxation mechanisms (Fig. 4D).Relaxation due to the DD and CSA mechanisms must be reduced to further extend the hyperpolarization signal lifetime of γ-Glu-[1-13C]Gly. The DD relaxation can be reduced to 6% by deuterating the α-1H of the Gly residue of γ-Glu-[1-13C]Gly. In addition, the contribution of R1CSA can be reduced by a lower magnetic field strength, meaning that the hyperpolarization signal lifetime of both γ-Glu-[1-13C]Gly and γ-Glu-[1-13C]Gly-d2 should be extended in a lower magnetic field along with the longer T1. Especially, γ-Glu-[1-13C]Gly-d2 should realize the longer T1 and thus the longer retention of the hyperpolarized signal at lower magnetic field by reducing both R1DD and R1CSA.
Dynamic 13C NMR spectra of hyperpolarized γ-Glu-[1-13C]Gly and γ-Glu-[1-13C]Gly-d2 at 1.4 T
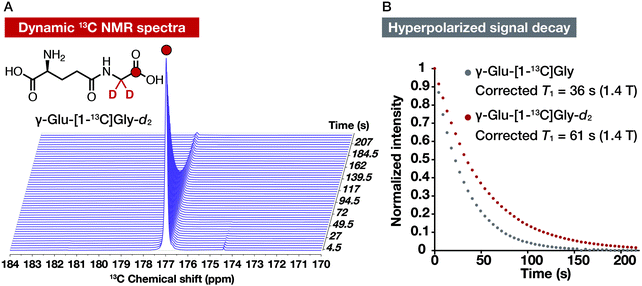
We acquired dynamic 13C NMR spectra of hyperpolarized γ-Glu-[1-13C]Gly and γ-Glu-[1-13C]Gly-d2 at 1.4 T to demonstrate the utility of the deuterated probe for further T1 elongation by reducing both R1DD and R1CSA. We hyperpolarized γ-Glu-[1-13C]Gly under the condition without glassing reagents (2.2 M γ-Glu-[1-13C]Gly in 1.9 M NaOH with 15 mM OX063) using the HyperSense DNP polarizer. After dissolving the cryogenic sample by 3 mL of PBS containing 0.3 mM EDTA, hyperpolarized γ-Glu-[1-13C]Gly solution (600 μL) was used to acquire dynamic 13C NMR spectra with a 1.4 T benchtop NMR apparatus. γ-Glu-[1-13C]Gly-d2 was also hyperpolarized with the same procedure. Both of the probes gave the enhanced 13C NMR signals (Fig. 5A and S2†). T1 of γ-Glu-[1-13C]Gly-d2 calculated from the hyperpolarized signal decay was 61 s at 1.4 T (corrected T1 considering magnetic loss during successive acquisition pulses), which was longer than that of γ-Glu-[1-13C]Gly (36 s, Fig. 5B). As we expected, γ-Glu-[1-13C]Gly-d2 showed the longer T1 at 1.4 T than 9.4 T (44 ± 3 s at 9.4 T vs. 61 s at 1.4 T). The experimentally obtained T1 value of γ-Glu-[1-13C]Gly-d2 (61 s at 1.4 T) was shorter than the extrapolated value from the R1–B02 plot in D2O (101 s at 1.4 T, Fig. S1†). The reason the experimentally determined T1 (61 s at 1.4 T, corrected) calculated from the signal decay curve is shorter than the extrapolated T1 (101 s at 1.4 T) might be explained by coexisting radicals, which are included during the hyperpolarization process. These results, however, indicated that γ-Glu-[1-13C]Gly-d2 is a DNP probe that has a longer T1 than γ-Glu-[1-13C]Gly and thus achieves a longer hyperpolarization signal lifetime at 1.4 T.Conclusions
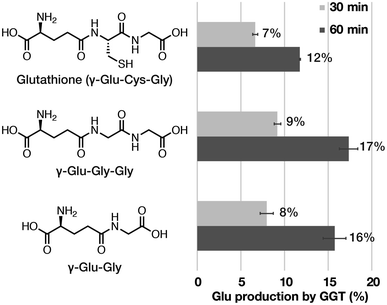
In this study, we evaluated the enzymatic and magnetic properties of γ-Glu-[1-13C]Gly and developed the deuterated probe, γ-Glu-[1-13C]Gly-d2 that can show the longer T1 and thus the longer lifetime of the hyperpolarized signal. We found that (1) γ-Glu–Gly showed a rapid enzymatic reaction rate with GGT, (2) γ-Glu-[1-13C]Gly showed a longer T1 than γ-[5-13C]Glu–Gly, another potential 13C-enriched γ-Glu–Gly, (3) 71% of the T1 relaxation of γ-Glu-[1-13C]Gly can be accounted for by the DD and CSA relaxation pathway at 9.4 T, thus allowing T1 elongation by deuteration and lower magnetic field strength, and that (4) γ-Glu-[1-13C]Gly-d2 indeed showed longer retention of the hyperpolarized signal at 1.4 T. These results confirmed the value of γ-Glu-[1-13C]Gly-d2 as a new DNP probe for detecting GGT with a longer lifetime of the hyperpolarized signal. Furthermore, the molecular properties of γ-Glu-[1-13C]Gly-d2 determined herein suggested that γ-Glu-[1-13C]Gly-d2 could be useful for biological studies of GGT.Although the extended hyperpolarization lifetime was demonstrated in vitro, in vivo verification experiments were not tried in this study. The feasibility of the elongated hyperpolarized signal of the deuterated probe in vivo should be investigated in future studies. In addition, there may still be room for further improvement in the molecular design of γ-Glu-[1-13C]Gly before the applications of γ-Glu-[1-13C]Gly could be more widened and significantly contribute to hyperpolarized MR studies. For example, the GGT enzymatic reaction rate of γ-Glu-[1-13C]Gly might still be able to be improved, because γ-Glu-[1-13C]Gly provided only a few percent of the product/probe ratio in the previous in vivo experiments using tumor-bearing xenografts.15,17 DNP probes that can detect GGT with better conversion could be developed by understanding the enzymatic reaction mechanism of GGT.
We believe that the enzymatic properties and various magnetic parameters of γ-Glu-[1-13C]Gly and γ-Glu-[1-13C]Gly-d2 determined herein will provide useful information for widespread use as a DNP probe for GGT detection in biological studies, and insights for the development of DNP probes designed de novo in the future.
Author contributions
S. S. conceived and designed the project; Y. K., T. N., and M. I. synthesized compounds with the help of Y. S. and H. N.; Y. K. conducted in vitro enzymatic reaction assay and NMR measurements for T1, chemical shift, and relaxation analysis with the help of Y. S.; A. E. E., F. H., and M. M. organized and/or performed the hyperpolarized experiments; Y. K., Y. S., and S. S. wrote the manuscript, which was edited by all co-authors.Conflicts of interest
There are no conflicts of interest to declare.Acknowledgements
This research was supported by MEXT Q-LEAP [grant number JPMXS0120330644 (to S. S.)]; JSPS KAKENHI [grant numbers JP19H00919 (to S. S.); JP20K15396 (to Y. S.); JP19J22848 (to Y. K.)]; and JSPS Fostering Joint International Research (B) [grant number JP20KK0253 (to F. H. and M. M.)]. We thank Ms Keiko Ideta (Evaluation Center of Materials Properties and Function, Institute for Materials Chemistry and Engineering, Kyushu University) for support with the NMR measurements.References
- J. W. Keillor, R. Castonguay and C. Lherbet, Methods Enzymol., 2005, 401, 449–467 CAS.
- V. I. Lushchak, J. Amino Acids, 2012, 2012, 1–26 CrossRef PubMed.
- M. H. Hanigan, Adv. Cancer Res., 2014, 122, 103–141 CrossRef CAS PubMed.
- H. Khurana, V. K. Meena, S. Prakash, K. Chuttani, N. Chadha, A. Jaswal, D. K. Dhawan, A. K. Mishra and P. P. Hazari, PLoS One, 2015, 10, 1–20 Search PubMed.
- D. Gao, Y. Miao, S. Ye, C. Lu, G. Lv, K. Li, C. Yu, J. Lin and L. Qiu, RSC Adv., 2021, 11, 18738–18747 RSC.
- Z. Luo, R. An and D. Ye, ChemBioChem, 2019, 20, 474–487 CrossRef CAS PubMed.
- Y. Urano, M. Sakabe, N. Kosaka, M. Ogawa, M. Mitsunaga, D. Asanuma, M. Kamiya, M. R. Young, T. Nagano, P. L. Choyke and H. Kobayashi, Sci. Transl. Med., 2011, 3, 1–11 Search PubMed.
- J. H. Ardenkjær-Larsen, B. Fridlund, A. Gram, G. Hansson, L. Hansson, M. H. Lerche, R. Servin, M. Thaning and K. Golman, Proc. Natl. Acad. Sci. U. S. A., 2003, 100, 10158–10163 CrossRef PubMed.
- A. Comment, J. Magn. Reson., 2016, 264, 39–48 CrossRef CAS PubMed.
- Z. J. Wang, M. A. Ohliger, P. E. Z. Larson, J. W. Gordon, R. A. Bok, J. Slater, J. E. Villanueva-Meyer, C. P. Hess, J. Kurhanewicz and D. B. Vigneron, Radiology, 2019, 291, 273–284 CrossRef PubMed.
- J. Kurhanewicz, D. B. Vigneron, J. H. Ardenkjaer-Larsen, J. A. Bankson, K. Brindle, C. H. Cunningham, F. A. Gallagher, K. R. Keshari, A. Kjaer, C. Laustsen, D. A. Mankoff, M. E. Merritt, S. J. Nelson, J. M. Pauly, P. Lee, S. Ronen, D. J. Tyler, S. S. Rajan, D. M. Spielman, L. Wald, X. Zhang, C. R. Malloy and R. Rizi, Neoplasia, 2019, 21, 1–16 CrossRef PubMed.
- M. Fiedorowicz, M. Wieteska, K. Rylewicz, B. Kossowski, E. Piatkowska-Janko, A. M. Czarnecka, B. Toczylowska and P. Bogorodzki, Biocybern. Biomed. Eng., 2021, 41, 1466–1485 CrossRef.
- T. Nishihara, H. A. I. Yoshihara, H. Nonaka, Y. Takakusagi, F. Hyodo, K. Ichikawa, E. Can, J. A. M. Bastiaansen, Y. Takado, A. Comment and S. Sando, Angew. Chem., Int. Ed., 2016, 55, 10626–10629 CrossRef CAS PubMed.
- S. F. Frank, H. A. Yoshihara, M. Itoda, S. Sando and R. Gruetter, Proc. Intl. Mag. Reson. Med., 2018, 26, 3066 Search PubMed.
- T. Seki, M. Itoda, S. Kishimoto, K. Yamamoto, Y. Takakusagi, J. Brender, R. M. Malinowski, T. Nishihara, H. A. I. Yoshihara, H. Nonaka, K. Saito, N. Oshima, J. H. Ardenkjaer-Larsen, J. B. Mitchell, M. C. Krishna and S. Sando, Proc. Intl. Mag. Reson. Med., 2018, 26, 3052 Search PubMed.
- G. Batsios, C. Najac, P. Cao, P. Viswanath, E. Subramani, Y. Saito, A. M. Gillespie, H. A. I. Yoshihara, P. Larson, S. Sando and S. M. Ronen, Sci. Rep., 2020, 10, 6244 CrossRef CAS PubMed.
- T. Seki, K. Yamamoto, N. Oshima, M. Itoda, Y. Kondo, Y. Saito, Y. Takakusagi, S. Kishimoto, J. Brender, R. M. Malinowski, J. H. Ardenkjær-Larsen, H. Nonaka, M. C. Krishna and S. Sando, Proc. Intl. Mag. Reson. Med., 2020, 28, 3032 Search PubMed.
- M. R. Molla, P. Prasad and S. Thayumanavan, J. Am. Chem. Soc., 2015, 137, 7286–7289 CrossRef CAS PubMed.
- Y. Imakura, H. Nonaka, Y. Takakusagi, K. Ichikawa, N. R. Maptue, A. M. Funk, C. Khemtong and S. Sando, Chem.–Asian J., 2018, 13, 280–283 CrossRef CAS PubMed.
- T. D. Alger, W. D. Hamill, R. J. Pugmire, D. M. Grant, G. D. Siltcox and M. Solum, J. Phys. Chem., 1980, 84, 632–636 CrossRef CAS.
- T. C. Wong, T. T. Ang, F. S. Guziec and C. A. Moustakis, J. Magn. Reson., 1984, 57, 463–470 CAS.
- K. R. Keshari and D. M. Wilson, Chem. Soc. Rev., 2014, 43, 1627–1659 RSC.
- Y. Kondo, H. Nonaka, Y. Takakusagi and S. Sando, Angew. Chem., Int. Ed., 2021, 60, 14779–14799 CrossRef CAS PubMed.
- C. Taglang, D. E. Korenchan, C. von Morze, J. Yu, C. Najac, S. Wang, J. E. Blecha, S. Subramaniam, R. Bok, H. F. VanBrocklin, D. B. Vigneron, S. M. Ronen, R. Sriram, J. Kurhanewicz, D. M. Wilson and R. R. Flavell, Chem. Commun., 2018, 54, 5233–5236 RSC.
- E. D. Becker, R. R. Shoup and T. C. Farrar, Pure Appl. Chem., 1972, 32, 51–66 CAS.
- G. C. Levy, Acc. Chem. Res., 1973, 6, 161–169 CrossRef CAS.
- E. Breitmaier, K. H. Spohn and S. Berger, Angew. Chem., Int. Ed., 1975, 14, 144–159 CrossRef.
- K. F. Kuhlmann and D. M. Grant, J. Am. Chem. Soc., 1968, 90, 7355–7357 CrossRef CAS.
- G. C. Levy, J. D. Cargioli and F. A. L. Anet, J. Am. Chem. Soc., 1973, 95, 1527–1535 CrossRef CAS.
- D. Gust, H. Pearson, I. M. Armitage and J. D. Roberts, J. Am. Chem. Soc., 1976, 98, 2723–2726 CrossRef CAS.
Footnotes |
| † Electronic supplementary information (ESI) available. See DOI: 10.1039/d1ra07343e |
| ‡ Present address: Department of Chemistry and Biological Science, College of Science and Engineering, Aoyama Gakuin University, 5-10-1 Fuchinobe, Chuo-ku, Sagamihara, 252-5258, Japan. |
| § Present address: Department of Synthetic Chemistry and Biological Chemistry, Graduate School of Engineering, Kyoto University, Kyoto University Katsura, Nishikyo-ku, 615-8510, Japan. |
| This journal is © The Royal Society of Chemistry 2021 |

