
 Open Access Article
 This Open Access Article is licensed under a
 Creative Commons Attribution 3.0 Unported Licence
Recent advances in dye and metal ion removal using efficient adsorbents and novel nano-based materials: an overview
Ahmad K. Badawi
 *a,
M. Abd Elkodous
b and
Gomaa A. M. Ali
c
*a,
M. Abd Elkodous
b and
Gomaa A. M. Ali
c
aCivil Engineering Department, El-Madina Higher Institute for Engineering and Technology, Giza, 12588, Egypt. E-mail: Dr.AhmedKaram91@gmail.com; Tel: +20 1114743578
bDepartment of Electrical and Electronic Information Engineering, Toyohashi University of Technology, 1-1 Hibarigaoka, Tempaku-cho, Toyohashi, Aichi 441-8580, Japan
cChemistry Department, Faculty of Science, Al-Azhar University, Assiut, 71524, Egypt
First published on 11th November 2021
Abstract
Excessive levels of dyes and heavy metals in water sources have long been a source of concern, posing significant environmental and public health threats. However, adsorption is a feasible technique for removing dye contaminants and heavy metals from water due to its high efficiency, cost-effectiveness, and easy operation. Numerous researchers in batch studies extensively evaluated various adsorbents such as natural materials, and agriculture-derived and industrial wastes; however, large-scale application is still missing. Nanotechnology is a novel approach that has arisen as one of the most versatile and cost-effective ways for dye and heavy metal removal. Its promotion on large-scale applications to investigate technological, fiscal, and environmental aspects for wastewater decontamination is particularly important. This review critically reviews wastewater treatment techniques, emphasizing the adsorption process and highlighting the most effective parameters: solution pH, adsorbent dosage, adsorbent particle size, initial concentration, contact time, and temperature. In addition, a comprehensive, up-to-date list of potentially effective low-cost adsorbents and nano-sorbents for the removal of dyes and heavy metals has been compiled. Finally, the challenges towards the practical application of the adsorption process based on various adsorbents have been drawn from the literature reviewed, and our suggested future perspectives are proposed.
 Ahmed K. Badawi | Dr Ahmad K. Badawi is an assistant professor in Environmental Engineering. He is working in this field for more than 10 years between teaching in the largest universities and designing in diverse consulting offices in Egypt. He got his M.Sc. degree (2014–2016) and PhD degree (2017–2020) in environmental engineering from Cairo University, Egypt. Dr Badawi works are focusing on municipal and industrial wastewater treatment using different chemical, physical and biological treatment techniques. He evaluated the feasibility of applying algal-bacterial photo-bioreactors for wastewater treatment. He is also investigated different nano-sized materials for industrial wastewater treatment. Dr Badawi is a specialist in pilot plants design, fabrication and implementation. He constructed several pilot plants in different wastewater treatment plants and industries. He has many publications distributed between high impacted journals (Q1 & Q2) and conferences. He served as an acting Co-Editor/Guest Editor for many international journals and as an acting reviewer for several Elsevier, Springer, Sage and Taylor & Francis journals. He received the recognized reviewer award from many international journals. Also, he served as an acting Co-PI for many national and international funded grants with total budget (988 |
 M. Abd Elkodous | Mohamed Abd Elkodous is a PhD student at Toyohashi University of Technology, Toyohashi, Japan since October 2020. He obtained his Bachelor of Science (B. Sc.) degree in bio-physics from Tanta University, Egypt with excellent honor in June 2015. Then, due to his outstanding academic performance, he received full scholarship to study his Master of Science (M. Sc.) degree in Nanoscience and Technology from Nile University, Egypt. He obtained his M. Sc. from School of Engineering and Applied Sciences, in 2018. After that, he worked as a research assistant at Center of Excellence for Stem Cells and Regenerative Medicine (CESC), Zewail City of Science and Technology, Egypt from until August 2019. On October 2019, he started to work at Toyohashi University of Technology, Japan as a research student followed by a PhD studentship on October 2020 after receiving a MEXT scholarship. He published (42) articles in peer-reviewed journals with a total impact factor of (188.31). According to Google scholar, his H-index is (18) and his research work was cited (676) time. Additionally, he presented his research work in more than 20 national and international workshops and conferences covering nanotechnology, renewable energy and biomedical sciences. Mohamed's research focuses on photocatalysis, wastewater treatment and studying the antimicrobial effect of novel nanomaterials against multi-drug resistant bacteria and pathogenic fungi. Additionally, his research is focusing on developing more effective nanomaterial-based devices for supercapacitance and water splitting applications. |
 Gomaa A. M. Ali | Dr Gomaa A. M. Ali is an Associate Professor at the Chemistry Department, Faculty of Science, Al-Azhar University, Egypt. He has 15 years of experience working in the research areas of materials science, nanocomposites, humidity sensing, graphene, supercapacitors, water treatment, and drug delivery. He was awarded his PhD in Advanced Nanomaterials for Energy Storage from UMP, Malaysia. He is the recipient of some national and international prizes and awards such as TWAS-AREP (2018), Obada International Prize (2021), Gold Medal (Archimedes, Russia, 2014), Green Technology Award (CITREX, Malaysia, 2015), Gold Medal (British Invention Show, UK, 2015). He has published over 110 journal articles and 16 book chapters on a broad range of cross disciplinary research fields, including supercapacitor, water treatment, humidity sensing, biosensing, corrosion, and drug delivery. So far, he has more than 2839 citations and an h-index of 31. He has served as Editors of many international journals and a reviewer for more than 50 WoS journals. He is a member of national and international scientific societies, such as the American Chemical Society (ACS) and the Egyptian Young Academy of Sciences (EYAS). He is an Editor of the handbook “Waste recycling technologies for nanomaterials manufacturing” Springer, 2021. |
1. Introduction
During various human activities large quantities of fresh water are used and discarded as wastewaters containing different pollutants. A pollutant means a material/substance that alters the nature of the environment by chemical, biological or physical means, causing subsequent pollution in water, soil, and/or air. Dyes are xenobiotic and natural compounds making substances colored. Colored wastewater release comprises a public health concern as well as a serious environmental issue.1 More than 8000 dyes – whether insoluble or soluble – have been used and manufactured in various industries such as paper, dyeing, pulp, textile, paint, and tannery industries. Dyes are considered a pollutant because of the imparted color to water and their chemical toxicity, which is not acceptable. If these dyes are not properly handled, they can remain stable in the environment for long time, causing significant health impacts.2 For instance, hydrolyzed Reactive Blue 19's (RB19) half-life is about 46 years at 25 °C and pH 7.3 Moreover, most of them contain chromium in their molecular structure, which is carcinogenic.4,5 The dyes are also toxic and mutagenic in many microbiological species, as well as being teratogenic. It may adversely affect the photosynthetic activity in marine life as it reduces light penetration. Furthermore, it can cause serious side effects to human beings, such as renal failure and liver damage.2,6 On the other side, rapid industrialization causes excessive release of heavy metals into the environment and thus causes a global concern because of their chronic toxicity. Cadmium, manganese, arsenic, mercury, chromium, cobalt, copper, lead, iron, vanadium, molybdenum, bismuth, and nickel are often present in industrial wastewaters and originate mainly from mining activities, battery manufacture, metal plating, petroleum refining, pesticides, tanneries, smelting, pigment manufacture, paint manufacture, photographic industries, and printing.7,8 Heavy metals usually occur with concentrations beyond the safe permissible limits, and thus, they should be eliminated. Heavy metals can be accumulated in living organisms and are non-biodegradable, unlike organic wastes, and they could cause many disorders and diseases.9,10 Table 1 summarizes the toxicity and the allowable limits of certain metal ions.| Contaminants | Health hazards | Permissible limit (mg L−1) | |
|---|---|---|---|
| Metal ions | Cr6+ | Headache, nausea, carcinomas, and lung tumors | 0.05 |
| Cu2+ | Liver damage, muscle weakness, insomnia | 2.5 | |
| Ni2+ | Dermatitis, lung cancer, and persistent asthma | 2 | |
| Ar3+ | Lung and kidney cancer and nausea | 0.01 | |
| Cd2+ | Emphysema, cancer and kidney damage | 0.003 | |
| Dyes | Color | — | 15 Pt. Co |
Nthunya et al. evaluated the toxic metal ions levels in certain water sources in Lochiel, South Africa. It was found that some water sources contain high concentrations of toxic metal ions that exceed the WHO set limits.14 On the other side, significant levels of phenols and polycyclic aromatic hydrocarbons (PAHs) were also reported in the Nandoni dam, South Africa as a result of human activity in the area.15 Over the past decade, many operations and processes have been developed to deal with different kinds of pollution. Traditional wastewater treatment operations have been used for wastewater treatment for a long period through microbial and chemicals removal of many types of contaminants threatening the environment and public health.16 The various processes responsible for contaminants removal from wastewater can be classified into biological, physical, and chemical methods.17 Fig. 1 shows the three main types: physical, chemical, and biological processes for wastewater treatment.
 | ||
| Fig. 1 Wastewater treatment unit operations and processes. | ||
During physical unit operations, removing contaminants and screening large debris or solids are achieved by applying physical forces. Large floating material present in the waste flow is grinded using comminutors. Then sedimentation technique is then employed for gravitational settling of large particles suspended in the mixture.18
Chemical unit operations are employed to remove contaminants for wastewater treatment using chemical reaction means. Chemical coagulation of initial wastewater is involved in this kind of operation to promote sedimentation of divided solids and turn them into more settleable flocs.19 Thus, improving the removal efficiency of suspended solids. Soluble substance collection is then maintained within a soluble solution with a proper interface during the adsorption process. Activated carbon (AC) is one of the well-known adsorbents employed in such a process. Chemical agents like chlorine and its alternatives are then used for micro-organisms disinfection. Dichlorination occurs for chlorine residue removal from wastewater; AC may also be employed in this process. Finally, conversion of the dissolved organic and finely divided matter into flocculent inorganic or organic solids is achieved during the biological unit processes. In these processes, bacteria and other micro-organisms convert the colloidal dissolved carbonaceous and organic matter into various gases, which are then removed in sedimentation tanks.
2. Adsorption process and the affecting factor
The adsorption process is a chemical technique and is considered among the most promising routes for industrial wastewater treatment. The ease of operation, along with the superior ability to remove non-biodegradable contaminants, classified the adsorption process as one of the most popular wastewater treatment techniques, especially for the treatment of industrial effluents.20–23 Further merits of the adsorption process, such as possible economic regeneration of the adsorbent and little sludge generation, make it among the essential treatment processes for water-consuming industries, such as textile and paints industries. Extensive research has shown the efficacy of the adsorption process for textile and paints wastewater treatment.7,21,24 Several batch and continuous studies were performed for the adsorption of dyes and metals ions and achieved respectable contaminants deduction in a short contact time.24,25 Generally, the adsorption process is mainly affected by several environmental factors such as; pH, adsorbent dose, agitation rate, contact time, temperature, and the physical characteristics of the used sorbent material, including sorbent surface area and particle size.21,26 Edison GilPavas et al. reported a unique method that incorporated sequential electrocoagulation (EC) and electro-oxidation (EO) with AC adsorption to treat industrial textile wastewater.27 Adsorption process on AC with 1200 m2 g−1 BET surface area and 30 mesh size was employed to minimize active chlorine and other materials that lead to remained toxicity after the sequential (EC + EO) processes. Their results revealed that EC and EO achieved 88% reduction of COD, total discoloration, and 79% mineralization of TOC. In addition, more biocompatible effluent (BOD5/COD = 0.58) was obtained. However, the toxicity was high.By incorporating AC adsorption, effluent toxicity was significantly reduced (Artemia salina mortality = 0%). While, Ayub et al. used EC with adsorption process to remove heavy metals such as Cr, Cu, and Zn.8 Their results showed that Cr, Cu, and Zn removal increased by increasing the applied electric current, the concentration of sodium chloride, and electrocoagulation time. In addition, they found that, under the optimum conditions (applied 2 A electric current, pH = 4, and 60 min of electrolysis time), 100% Cu, 99.2% Zn, and 87.6% Cr, were removed. In addition, Razali et al. prepared WO3 photocatalyst and studied its adsorption performance against palm oil mill effluent (POME) over 300 min.28 Adsorption results showed that the WO3-400 °C prepared sample possessed a relatively higher efficiency against pond aeration pollution than anaerobic and cooling ponds. Moreover, WO3 was able to degrade POME in darkness continuously, and color removal of about 48% was achieved.
2.1 Effect of pH
pH is the measure of acidity or alkalinity of an aqueous solution. Studying pH influence is fundamental for the adsorption of dyes and heavy metals removal. The surface charges of sorbent materials and the degree of ionization of acidic and basic compounds are sensitively affected by solution pH.29 Therefore, the contaminants uptake rates might be enhanced or depressed based on the initial value of solution pH. As a result, the hydrogen and hydroxyl ions are adsorbed with great efficiency, which enhances the ability of the adsorption process as the functional groups of the adsorption sites disintegrate, leading to a change in reaction kinetics and equilibrium characteristics.30 Generally, at lower pH value, the uptake rate of dyes will be affected and decreased for cationic dyes adsorption. However, the percentage of dye uptake will be increased for anionic dyes.31 The crucial factor affecting surface adsorption ability and the type of surface-active centers is the point of zero charges (pHpzc).7,31 pHpzc is a common way to gauge or define the electrokinetic properties by determining the pH at which the surface charge is zero. The pH value is exclusively used to represent PZC in systems where H+/OH− are the primary determining ions. Many studies analyzed pHpzc of various adsorbents made from agricultural wastes. It was reported that cationic dye adsorption is favored at pH greater than pHpzc because of the presence of functional groups such as the OH− group, whereas anionic dye adsorption is favored at pH less than pHpzc, where the surface becomes positively charged.32,33 Investigating the optimum pH of the solution is a continuing concern by researchers within the adsorption process. Hameed et al.34 studied methylene blue (MB) eradication from an aqueous solution based on papaya seeds adsorbent. The effect of initial pH has been conducted at pH from 3 to 10 with 50 mg L−1 initial dye concentration. The uptake rate of MB is observed low at pH 3 and significantly enhanced up to pH 4. It may be attributed to the positive surface charge; as a result, making (H+) ions in contrast with dye cations causes a decrease in the uptake rate of the dye. Similar results were stated for the adsorption of MB on grass waste,35 yellow passion fruit peel,36 and Citrus limetta peel.37 In contrast, at a high pH range, the uptake rate of dyes will be affected and increased for cationic dyes adsorption. This demonstrates that alkalinity improves the electropositive adsorption of substances where acidity decreases the adsorption of positively charged dye due to electrostatic repulsion.31 However, the percentage of dye uptake will be decreased for the adsorption of anionic dyes. It illustrates that the lower uptake rate of cationic dyes at acidic pH may be attributed to the excess presence of (H+) ions competing with the dye cation groups for adsorption sites. It was reported in ref. 38 that the maximum dye uptake for cationic dyes, C.I. basic blue 9 (BB9) and C.I. basic green 4 (BG4) were 352.76 and 293.32 mg g−1, respectively at pH > 5 on to anionic poly-γ-glutamic acid-based adsorbent. Similar results were reported in ref. 39 for the adsorption of basic red 2 (BR12) dye. The maximum of BR12 adsorption onto animal bone meal adsorbent was achieved at pH > 9.1. Zhan et al.40 reported that adsorption of Pb, Cu, and Zn metal ions onto modified crosslinked cellulose/sodium alginate adsorbent was increased with an increase in solution pH (Fig. 2a). Similarly, Sadegh et al.41 reported the increased adsorption rate of methyl orange (MO) onto functionalized MWCNTs with an increase in solution pH (Fig. 2b).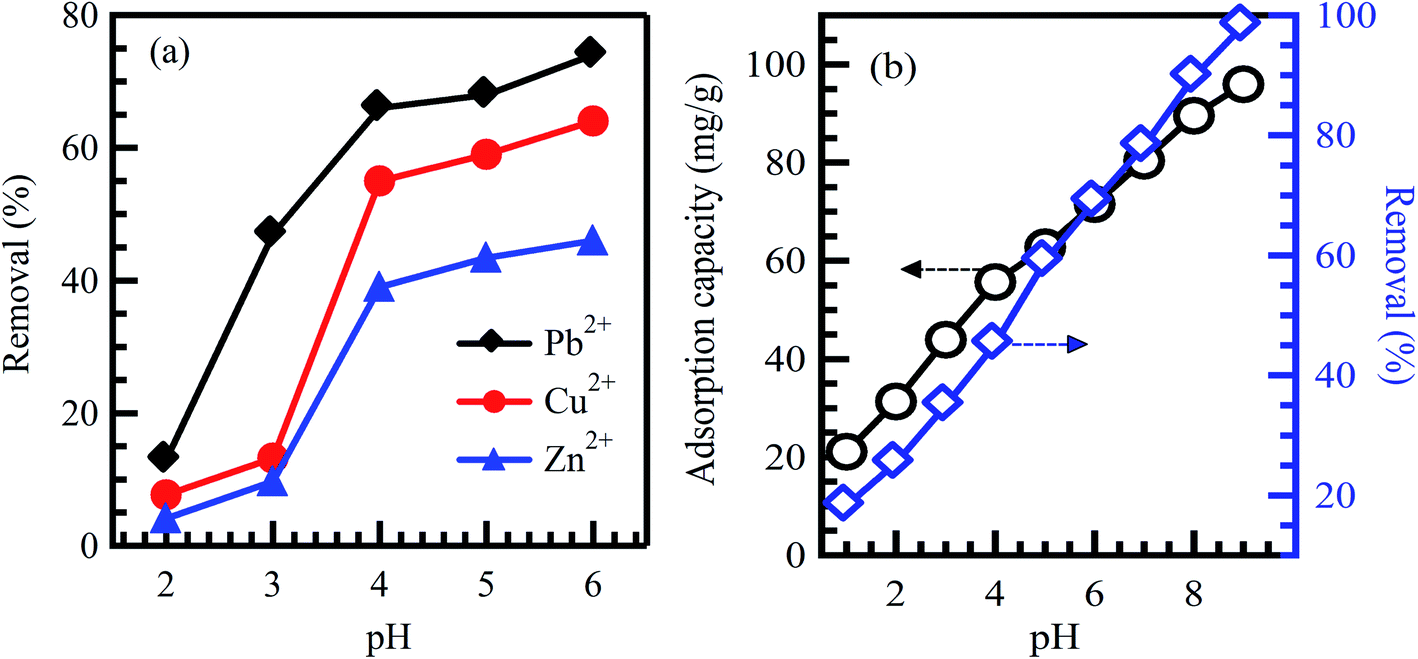 | ||
| Fig. 2 Effect of initial solution pH on the adsorption of (a) Pb2+, Cu2+ and Zn2+ on modified crosslinked cellulose/sodium alginate adsorbent, reproduced with permission from ref. 40, copyright, Royal Society of Chemistry, 2018; and (b) MO dye on functionalized MWCNTs, reproduced with permission from ref. 41, copyright, Springer, 2019. | ||
2.2 Effect of adsorbent dosage
The effect of adsorbent dosage is an important factor to be considered as it plays a key role in improving the efficiency of the treatment process.21 At constant dye concentrations, the removal efficiency of the dye increases with adsorbent dose due to the availability of adsorption sites accompanying the great surface area. Accordingly, this could increase the efficiency of removing dyes and reduce the concentrations of other undesirable contaminants like heavy metals.42 Baby et al.43 reported that adsorption of Cr6+, Pb2+, Cd2+, and Zn2+ onto palm kernel shell adsorbent was increased with an increase in adsorbent dosage (Fig. 3). The same conclusion was reported by Li et al.42 for the adsorption of Zn2+, Cu2+, Cd2+, and Pb2+ onto Fe3O4/MnO2 nano-composites. On the other hand, the adsorbent dosage is particularly at the heart of applying any economic study of adsorbent per unit of wastewater to be treated. After studying the effect of adsorbents doses on the treatment process, it becomes clear that the treatment as a whole is economical, as it did not need large doses of the adsorbent material, which was expensive regarding preparation or regeneration. Ahmad et al.44 indicated a significant positive impact of AC dosage on the removal of COD and color from real textile effluent. However, by utilizing dose >0.3 gm, a slight low effect is detected on the removal of COD and color thanks to the unsaturation of adsorption sites throughout the adsorption process. Similar behavior was observed for AC resulting from coconut waste of metal ions; Pb2+, Hg2+, and Cu2+ removal from industrial effluents.45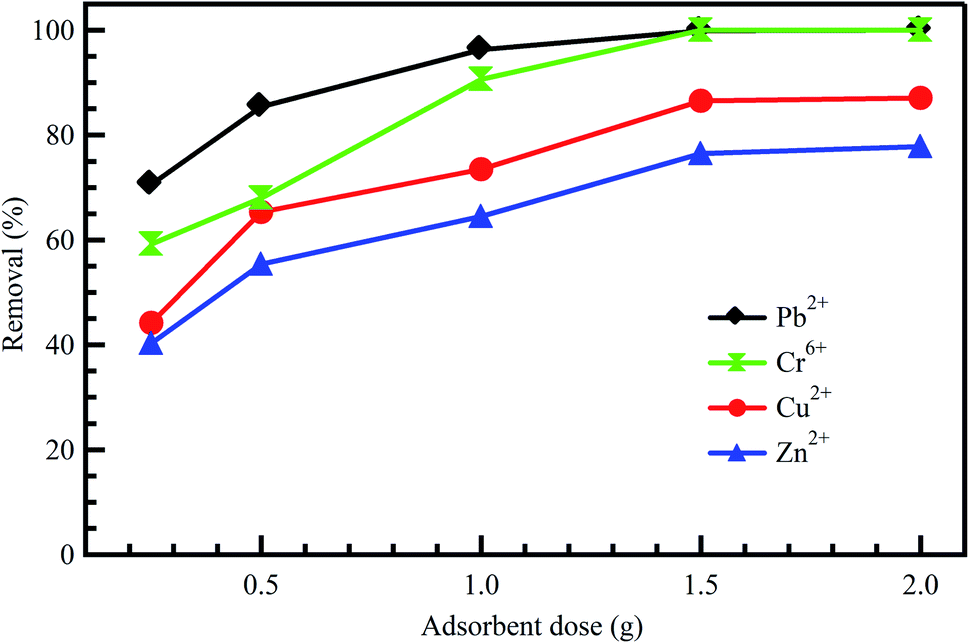 | ||
| Fig. 3 Effect of adsorbent dose on the adsorption of diverse metal ions onto palm kernel shell, reproduced with permission from ref. 43, copyright, Nature, 2019. | ||
2.3 Effect of contact time
Commonly, long contact time increases the adsorption capacity and contaminant removal efficiency.46 In the beginning, the amount of adsorbed contaminant onto the adsorbent surface rises fast, and after some time, the adsorption process decelerates down and reaches a constant value.47 This could be credited to the amount of the adsorbed contaminant at the state of dynamic equilibrium. The essential contact time to achieve this equilibrium state is called equilibrium time.48 The amount of the adsorbed contaminant at the equilibrium time imitates the extreme adsorption rate of the sorbent material under operating conditions.47 Agarwal et al.49 reported that the adsorption rate of bromothymol blue dye on polyvinyl alcohol adsorbent is increased effectively when the interaction time increases at different temperatures (Fig. 4a).49 Furthermore, Lee et al.50 reported the same conclusion for the adsorption of Fe3+ on graphene oxide aerogel adsorbent (Fig. 4b).50 In conclusion, the equilibrium state is credited to reducing adsorption rates due to the absence of available sites for contaminant adsorption (saturation state).51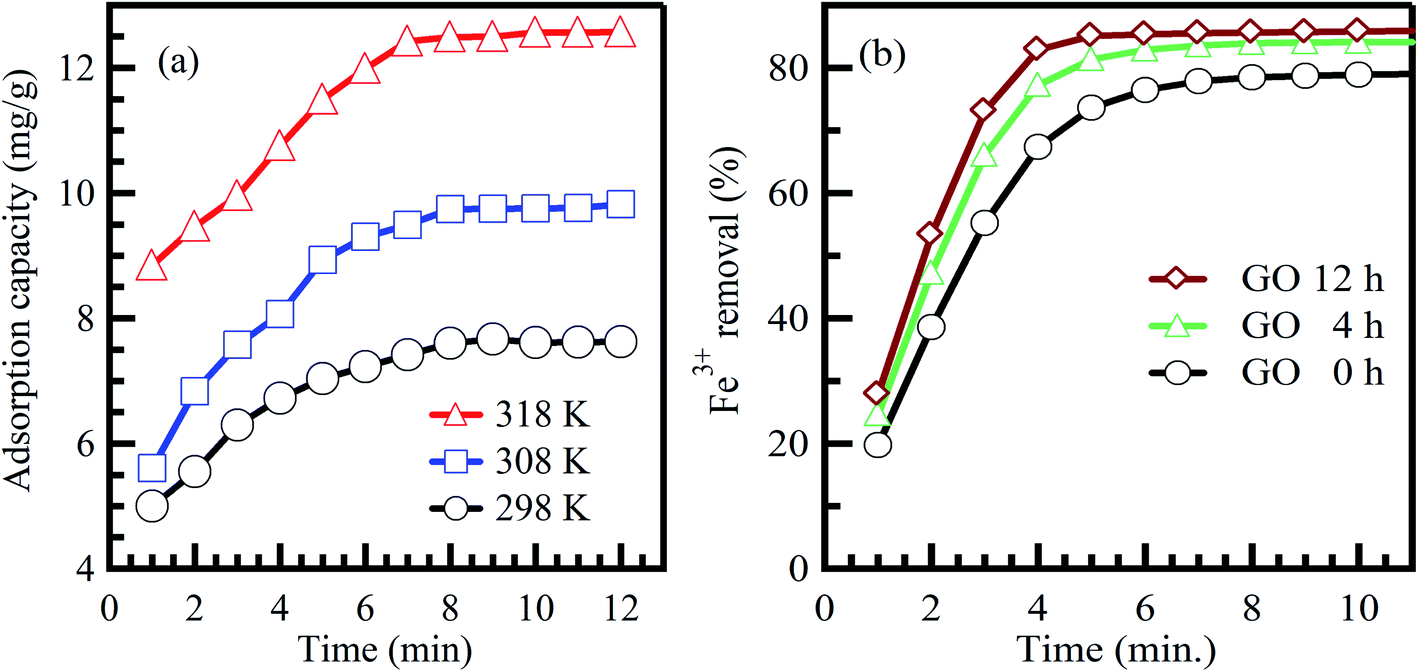 | ||
| Fig. 4 Effect of contact time on the adsorption of (a) bromothymol blue dye on polyvinyl alcohol adsorbent, adapted with permission from ref. 49, copyright, Elsevier, 2016, and (b) Fe3+ on graphene oxide aerogel adsorbent, adapted with permission from ref. 50, copyright, Elsevier, 2019. | ||
2.4 Effect of initial concentration
Initial concentration delivers a vital energetic force for improving mass transfer resistances of contaminant molecules between the solid phases and aqueous solution. Therefore, a greater initial contaminant concentration improves the adsorption rate and demands a longer equilibrium time.31 Commonly, at low concentrations, the ratio between the initial numbers of contaminant molecules to the accessible surface area is low. Consequently, the adsorption rate is not influenced by the initial contaminant concentration.52 Nevertheless, at high concentrations, the vacant adsorption sites become fewer, and therefore, the contaminant removal rates rely on the initial concentration.53 At constant adsorbent doses, adsorption capacity rises compared to the contaminant concentration. However, the removal percentage declines, demonstrating that residual contaminant concentration is greater than the initial concentration.21 Zhang et al.54 reported a reduction in the adsorption rate of MO dye, accompanied by an increment in the MO concentration from 20 to 400 mg L−1. Khodaie et al.55 also reported the same behavior for the adsorption of MB dye onto ZnCl2 corn husk AC (Fig. 5).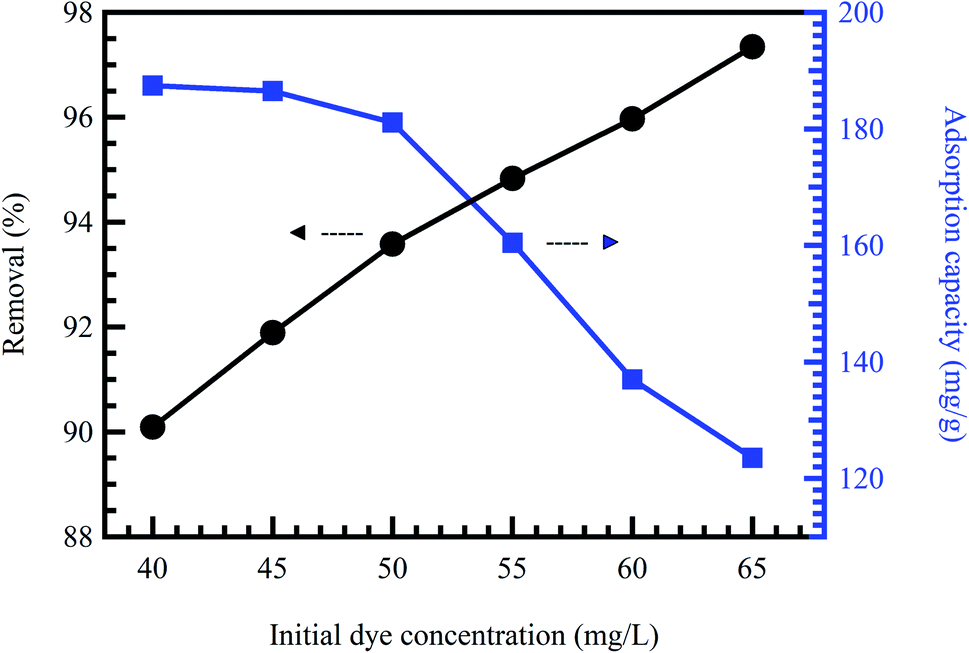 | ||
| Fig. 5 Effect of initial MB concentration onto ZnCl2 corn husk AC adsorbent at pH = 4, and adsorbent dose = 0.3 g L−1, reproduced with permission from ref. 55, copyright, Hindawi, 2013. | ||
2.5 Effect of temperature
Temperature change has a chief impact on the adsorption rate as it can progress the diffusion rate of the adsorbent molecules through the external layer and the inner pores of the sorbent material particles, thanks to the lessening in the solution viscosity.56 Furthermore, temperature change could also raise the tendency of deaggregation of the adsorbent for a particular adsorbate. Generally, at elevated temperatures, the equilibrium of the adsorption process could be reduced, demonstrating the adsorption reaction's exothermic nature. The high rise in temperature could moreover cause an upsurge in the kinetic energy among contaminant molecules57 and adsorbent particles, the result of the advanced collision rate between sorbent material and contaminant molecules.58 Fig. 6 shows the effect of temperature on the adsorption of MB dye onto activated corn husk carbon.55 The results demonstrated that dye adsorption is temperature dependent. The mobility of the dye molecule increased as temperature increased. This means that the dye molecule efficiently interacts with the absorbent material when the surface temperature is raised. In conclusion, temperature could mark the adsorbent's chemical potential and could affect the desorption step and, as a result, affect the adsorption equilibrium reversibility. Many works have been conducted to determine the influence of solution pH, contact time, adsorbent dose, initial concentration, and temperature on dyes and metal ions adsorption, as summarized in Table 2.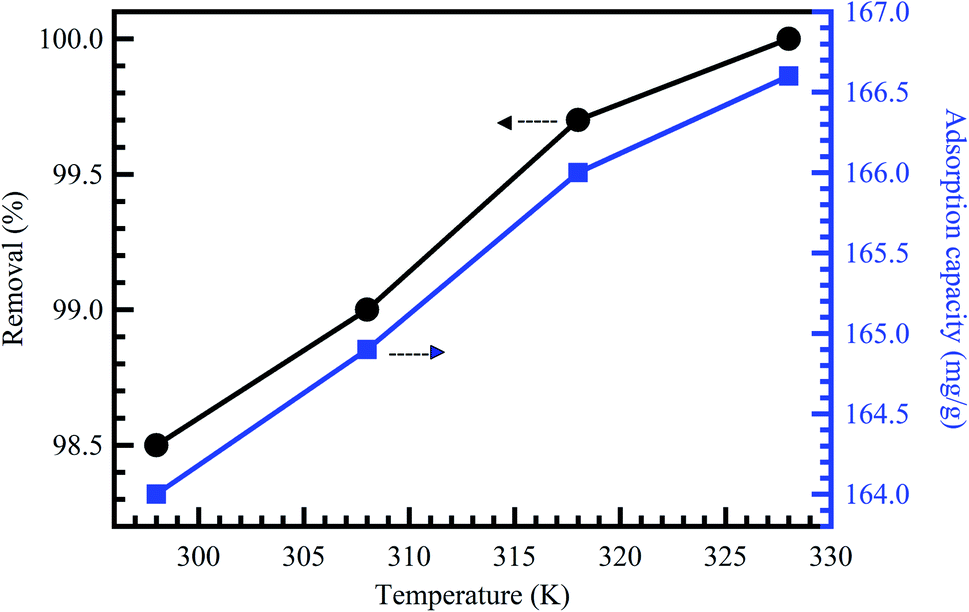 | ||
| Fig. 6 Effect of temperature on the adsorption of MB dye onto activated corn husk carbon, reproduced with permission from ref. 55, copyright, Hindawi, 2013. | ||
| Contaminant | Adsorbent | pH | Adsorbent dosage | Contact time (min) | Initial concentration (mg L−1) | Temp. (°C) | Adsorption capacity (mg g−1) | Ref. | |
|---|---|---|---|---|---|---|---|---|---|
| Dyes | MG | Peroxide treated rice husk | 11 | 0.2 g/100 mL | 45 | 30 | 30 | 26.6 | 59 |
| MB | Pine leaves | 9.2 | 15 mg/50 mL | 100 | 10 | 30 | 126.58 | 60 | |
| Brilliant green | NaOH treated sawdust | 2.9 | 4 g L−1 | 180 | 200 | 30 | 46.51 | 61 | |
| Crystal violet | Kaolin | 7 | 1 g L−1 | 5 | 20 | 22 | 45 | 62 | |
| Lavfix fast rad | MgO | 6 | 25 mg/100 mL | 45 | 25 | 25 | 92.16 | 63 | |
| Heavy metal ions | Cr6+ | CuO | 3 | 1 g L−1 | 10 | 20 | 25 | 13.1 | 64 |
| Pb2+ | MNCPs | 5 | 7.5 mg L−1 | 15 | 10 | 25 | 53.33 | 65 | |
| Ag2+ | MnO2 nanotubes@rGO hydrogel | 5 | 0.2 g L−1 | 120 | 200 | 25 | 138.2 | 66 | |
| Zn2+ | MnO2 nanotubes@rGO hydrogel | 5 | 0.2 g L−1 | 120 | 200 | 25 | 83.9 | 66 | |
| Cr3+ | Treated orange peel | 3 | 0.1 g/100 mL | 120 | 10 | 25 | 9.43 | 57 | |
| Fe3+ | Pretreated orange peel | 3 | 0.1 g/100 mL | 120 | 30 | 25 | 18.19 | 57 | |
| Cu2+ | Fe3O4 | 7 | 10 mg/100 mL | 30 | 2 | 25 | 14.18 | 67 | |
3. Synthesis and properties of adsorbent materials
3.1 Carbon nanomaterials
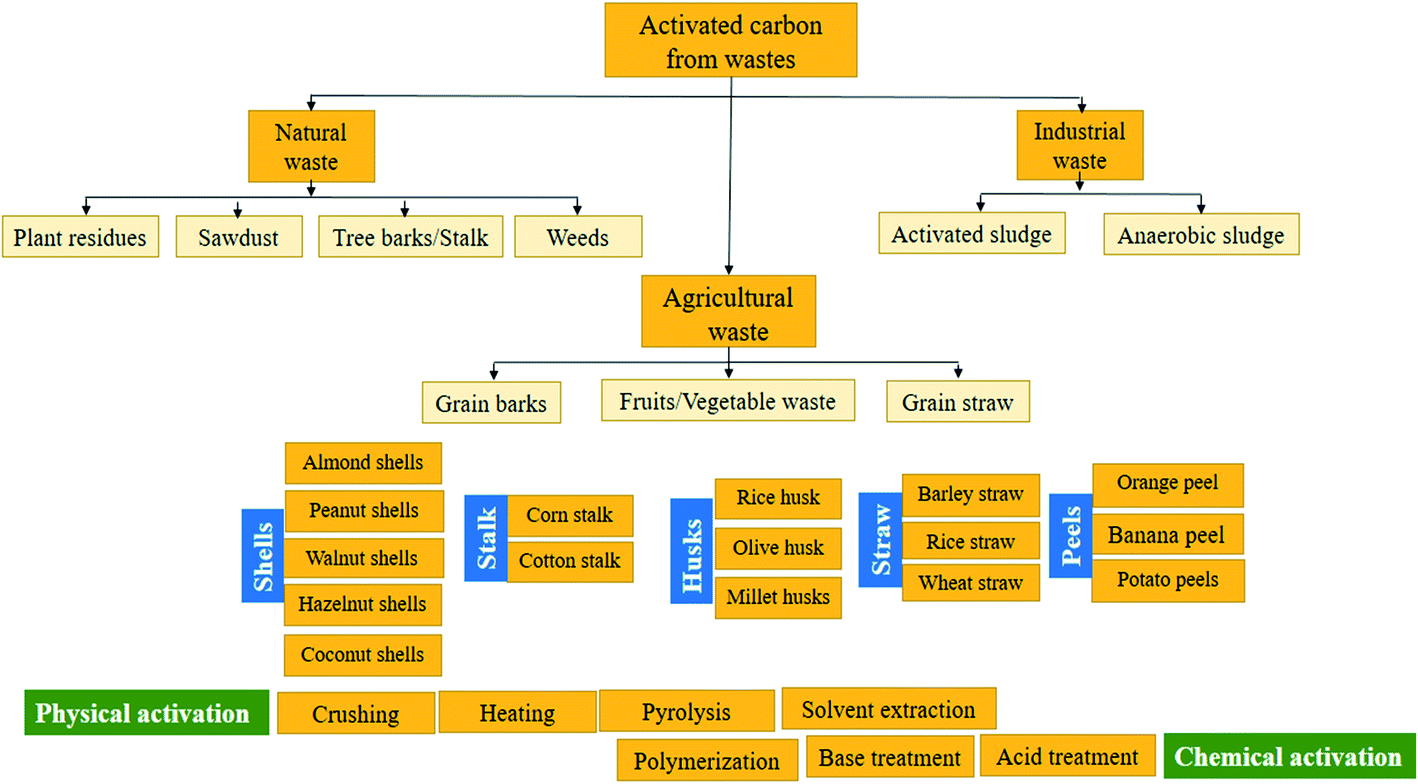 | ||
| Fig. 7 Different sources and methods used for the extraction of AC. | ||
Ahmad et al. used the phosphoric acid-assisted chemical activation method to prepare AC from bamboo waste for color reduction and COD of a real textile mill effluent.44 In a typical procedure, the raw material (40 g) was mixed with a certain volume of concentrated phosphoric acid (40 wt%) under occasional stirring. Then, impregnated samples were dried for 3 days under sunlight. After that, precursor activation was performed for 2 h at 500 °C under pure N2 gas flow (150 cm3 g−1) with 10 °C min−1 heating rate in a tubular furnace. After activation, samples were left to cool down to room temperature, followed by washing many times with hot distilled water (D.W.) (70 °C) until pH reached 6–7. Finally, at 110 °C for 24 h, samples were dried and then stored in plastic containers. They got AC maximum yield value of nearly 30.213%. In addition, the extracted mesoporous AC material possessed a BET surface area of about 988.23 m2 g−1, 0.69 cm3 g−1 total pore volume, and an average pore diameter of 2.82 nm.
Activated carbon possesses unique properties such as large surface area and great ability to remove both organic and inorganic contaminants. The efficiency of the adsorption process based on commercial AC (CAC) has been extensively evaluated to remove dyes and metals ions from industrial effluents.7,21 Gomez et al.56 assessed the removal of various toxic acid dyes (acid orange 61, acid red 97, and acid brown 425) onto CAC from individual solutions and in mixtures. It was revealed that CAC is efficient for acid dyes removal at different contact times from 0 to 250 min. Activated charcoal has been proficiently evaluated as an adsorbent to eradicate several toxic dyes (bromophenol blue, alizarine red-S, methyl violet, phenol red, malachite green (MG), erichrome black-T, and MB) from aqueous solutions.76 The impact of pH, contact time, and temperature on the adsorption performance has also been considered. It was concluded that the adsorption of all the dyes on activated charcoal declines at high pH and elevated temperatures. The great surface area is a fundamental property of CAC and its porous structure, enhancing the adsorption capacity of extensive types of pollutants from effluents.77 Nevertheless, the uneconomical characteristic is one of the most frequently stated problems by using CAC in industrial wastewater treatment along with the regeneration of saturated carbon is also costly and not straightforward.21 Table 3 summarizes a non-exhaustive list of CAC and its efficiency in removing various dyes and metal ions.
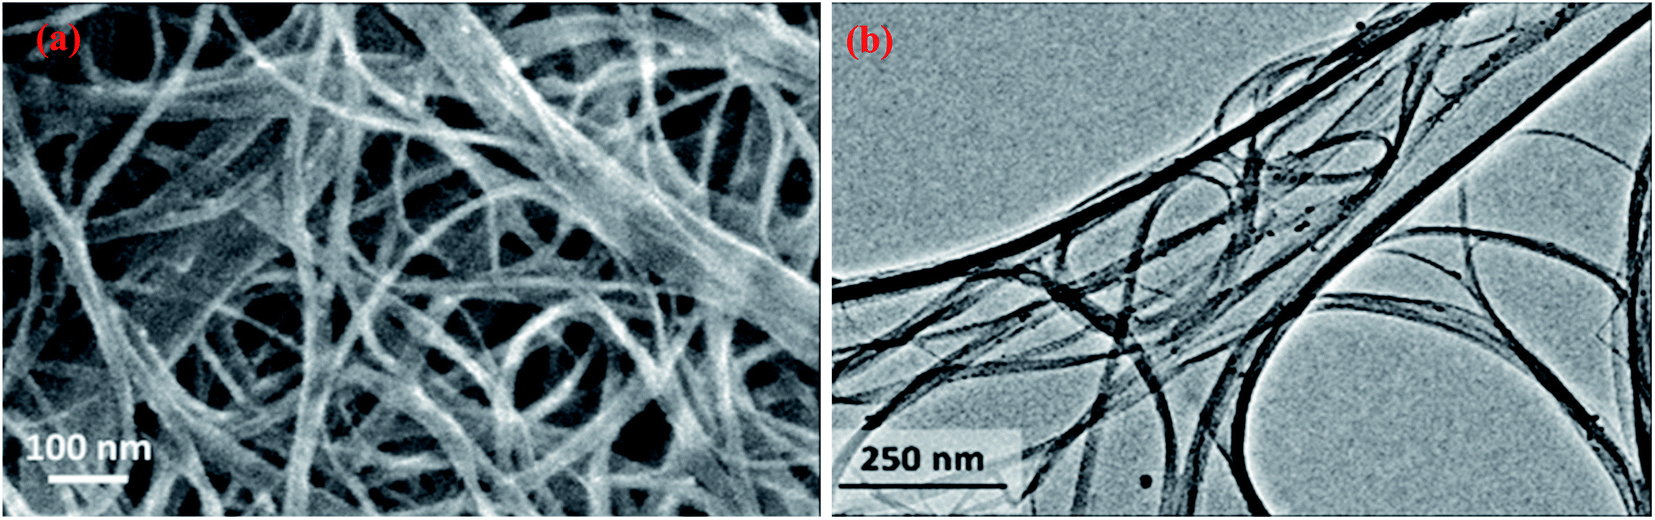 | ||
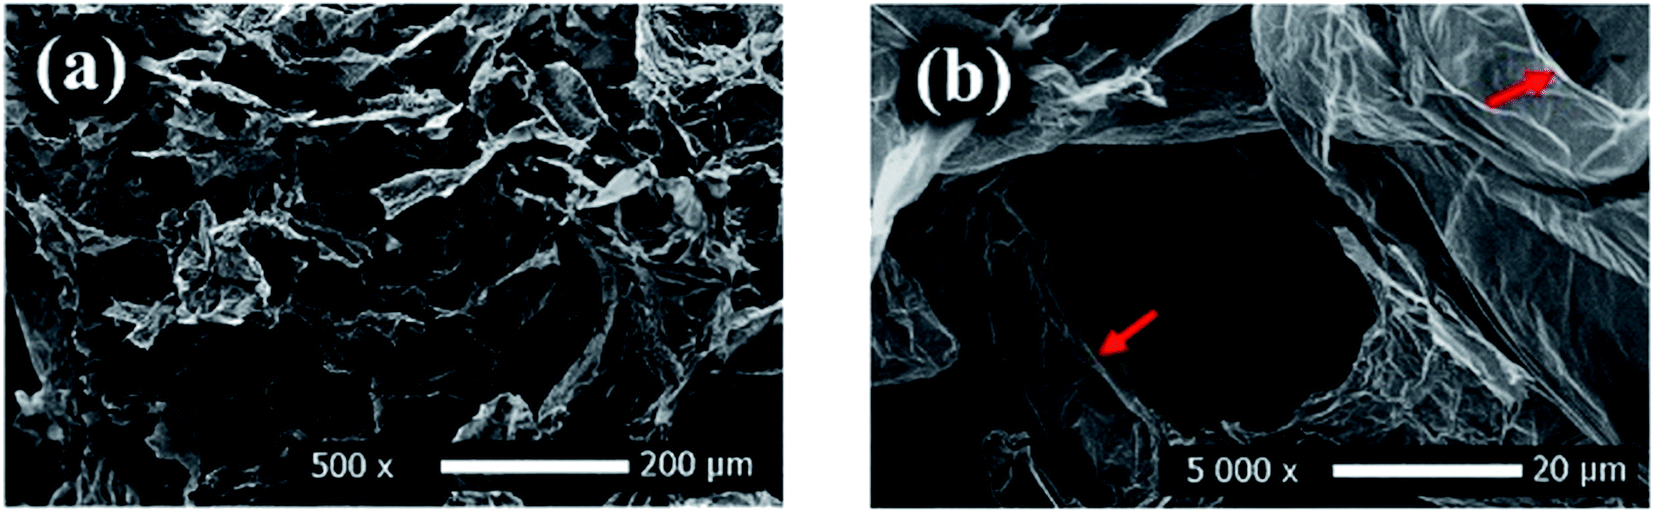
| Fig. 8 SEM (a) and TEM (b) images showing the morphology of SWCNTs, adapted with permission from ref. 91, copyright, Elsevier, 2016. | ||
| CNTs-based materials | Type of CNTs | Preparation method | Diameter (nm) | BET surface area (m2 g−1) | Length (nm) | Ref. |
|---|---|---|---|---|---|---|
| Bare CNTs | MWCNTs | Ultrasonic atomization and heat treatment | 5–10 | 113.14 | 1000 | 92 |
| CNTs/poly(etheretherketone) | MWCNTs | Coprecipitation injection molding | 200 | — | 10![[thin space (1/6-em)]](https://www.rsc.org/images/entities/char_2009.gif) 000–30000 000–30000 |
93 |
| CNTs/Cu | MWCNTs | Alloying method | 15–20 | — | 150–300 | 94 |
| CNTs | — | Methane chemical vapor depositions | 40–60 | 49.9–128.5 | — | 95 |
| CNTs | SWCNTs | Electric arc method | 20 | — | 700 | 96 |
| Polymer/CNTs | MWCNTs | Mechanical mixing process | 10–15 | — | 100–1000 | 97 |
 | ||
| Fig. 9 Structure representations of (a) ideal graphene sheet, (b) SWCNT, and (c) MWCNTs. | ||
Extensive research has shown that CNTs have a massive absorptive capacity to adsorb extensive ranges of pollutants such as heavy metals and dyes.98,99 Zeng et al.100 investigated the removal of organic dyes (MG) onto entangled CNTs as porous material to improve the adsorption process. The composites acquired over the polymerization with polyaniline (PANI) influenced bulky surface areas. The CNT/PANI composites revealed a 15% advanced adsorption rate of 13.95 mg g−1 than PANI at an initial dye concentration of 16 mg L−1. In another study, MWCNTs were also reported as an effective nanocomposite beads supported by chitosan for the removal of nitrates (NO3−) from water reached 96.8% for a 50 mg L−1 NO3− water solution.101 The adsorption capacity of CNTs is highly dependent on the porosity and surface functionalization, as shown in Fig. 10.41
 | ||
| Fig. 10 Adsorption of methyl orange on MWCNTs, adapted with permission from ref. 41, copyright, Springer, 2019. | ||
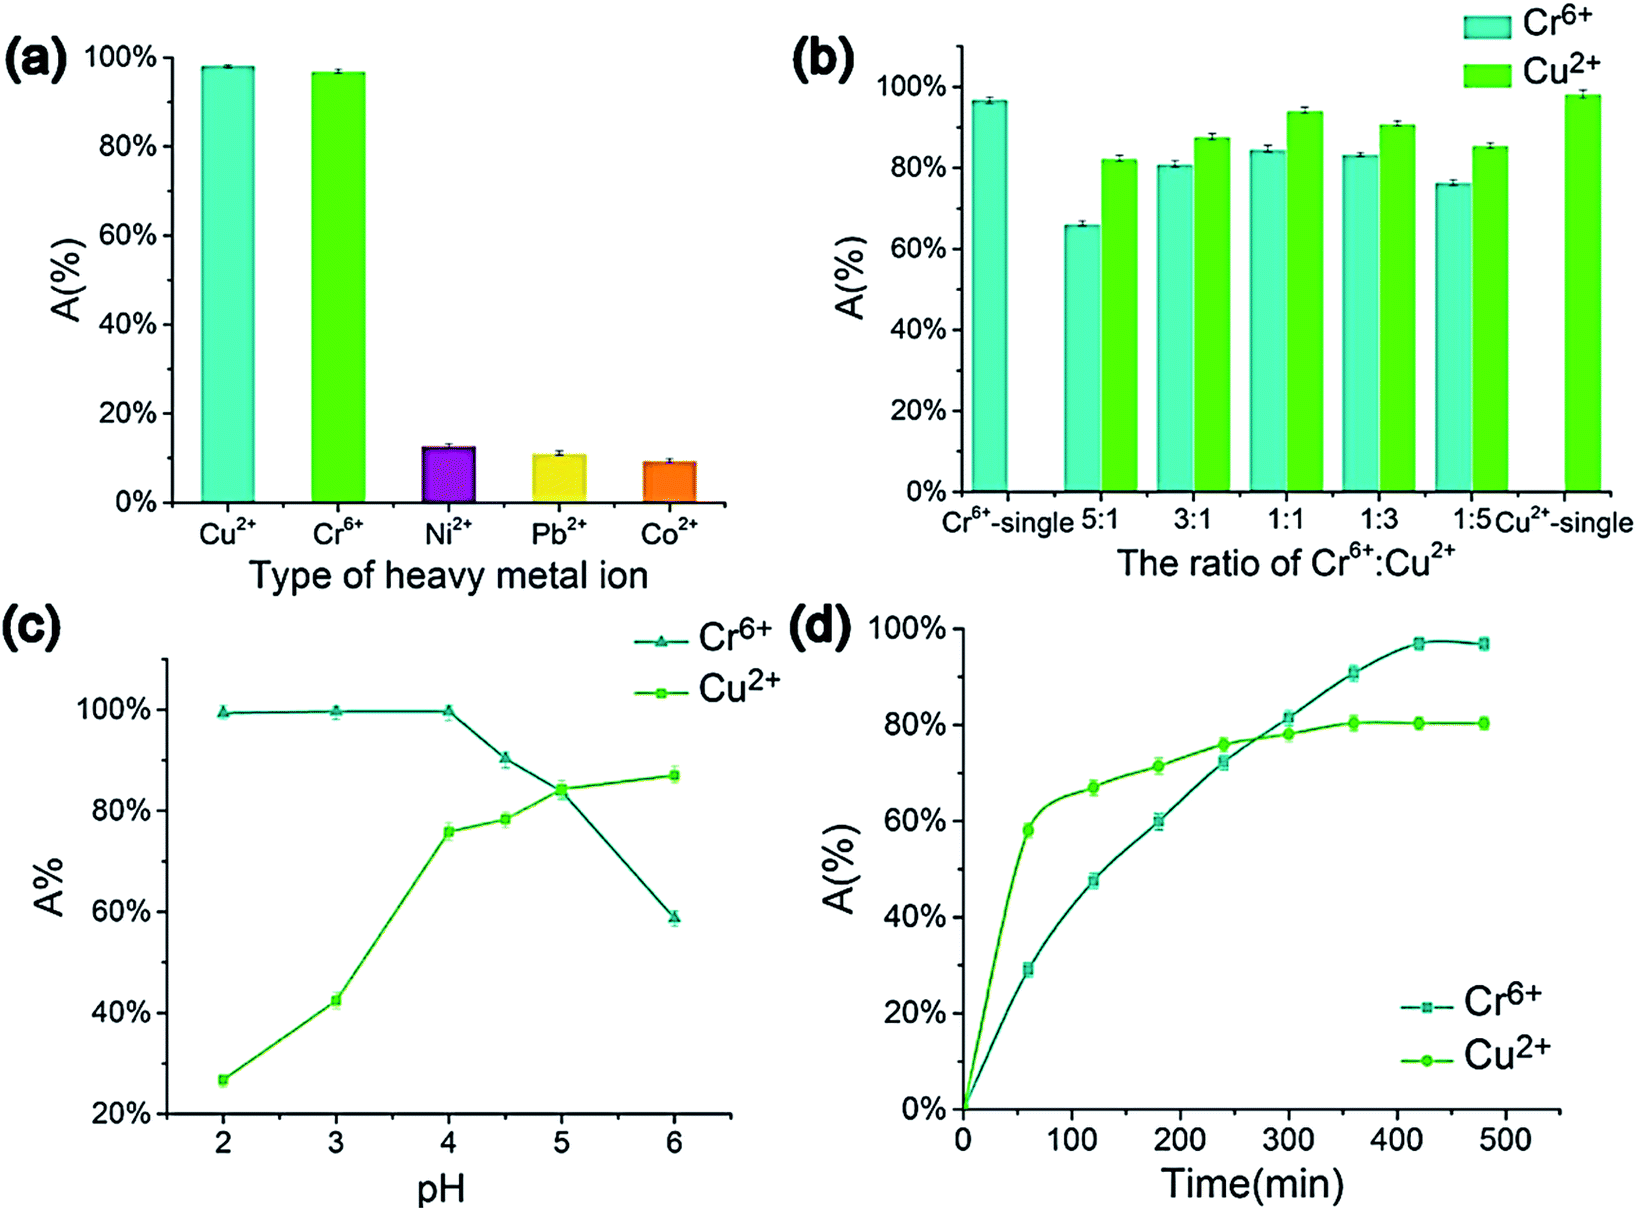
Atieh et al.102 suggested eliminating Cr6+ ions onto CNTs supported by AC from contaminated water. The achieved maximum adsorption capacity on AC-CNT coated adsorbent was recorded as 9.0 mg g−1. As a result, it seems that AC-CNT coated adsorbent is of utmost effectiveness for chromium ions removal. CNTs coated by manganese oxide (MnO2/CNTs) were utilized to eradicate Pb2+ ions from an aqueous solution.103 It was stated that the Pb2+ removal rate reduced with the decline of pH. The maximum adsorption capacity was 78.74 mg g−1, compared with not coated CNTs throughout the initial 15 min. For the adsorption of heavy metals and tetracyclines by MWCNTs, Chen et al. prepared a composite tablet based on ionic liquid-MWCNTs (IL-MWCNTs).104 It was found that benzothiazole ionic liquid (N-butyl benzothiazole hexafluoroborate, [C4Bth][PF6]) is selective for these pollutants, as a result, it was loaded into MWCNTs before tableting. Their results showed that the adsorption efficiency of TCs, Cr6+ and Cu2+ could reach 99.76, 94.10, and 84.60%, respectively, by one tablet, as shown in Fig. 11. In addition, the prepared tablet could be reused, with adsorption efficiency exceeding 90%. The adsorption capacity of CNTs on the removal of dyes and heavy metals is listed in Table 5.
 | ||
| Fig. 11 Impacts of metal ions' type (a) Cr6+ to Cu2+ ratio, (b) pH, (c) adsorption time, and (d) on the metal ions' adsorption efficiency (composite tablet adsorbed with 10 mg L−1 concentration under 40 °C temperature for 600 min in 4.5 pH, 5 mL of metal ion aqueous solution (1 mg L−1), 130 rpm), adapted with permission from ref. 104, copyright, Elsevier, 2021. | ||
| Adsorbent | Contaminant | Adsorption capacity (mg g−1) | Ref. |
|---|---|---|---|
| MWCNTs | MO | 25.73 | 41 |
| MWCNTs | Sufranine O | 43.48 | 105 |
| MWCNTs | Procion red MX-5B | 44.68 | 106 |
| MWCNTs | Reactive blue 4 | 502.5 | 107 |
| SWCNTs | Reactive blue 4 | 567.7 | 107 |
| MWCNTs | Pb2+ | 4.00 | 108 |
| MWCNTs | Ni2+ | 7.53 | 109 |
| SWCNTs | Ni2+ | 9.22 | 109 |
| SWCNTs | Zn2+ | 43.66 | 110 |
| CNTs | Pb2+ | 49.95 | 111 |
Jameel et al. reported the detailed methods for the preparation of rGO from graphite. Firstly, to isolate graphite, graphite from several pencils was extracted after removing the wooden part. Then, it was refined using a pestle (mortar) after polishing it from any remaining wood residues. Secondly, a modified Hummers' method was used to prepare GO.114 Finally, rGO was prepared from graphene oxide as the following, prepared graphene oxide (0.3 g) was added to (50 mL) freshly prepared lemon peels solution (5%) (reducing agent), then the mixture was heated at 55 °C for (2 h), graphene oxide color changed from greenish-yellow to greenish indicating the formation of rGO.115
In addition, green reduction of GO into rGO was presented by Wijaya et al., using the peel extract of kaffir lime (Citrus hystrix).116 Both GO, and kaffir lime peel extract with different (v/v) ratios were mixed and stirred at (600 rpm) for 8 h. Then, mixtures were washed well and sonicated for 30 min, until a clear solution was obtained. Finally, the resultant materials were dried using a vacuum oven. UV-Vis analysis was used to confirm the reduction of GO into rGO, as shown in Fig. 12. The GO transformation into rGO was revealed by the loss of the shoulder peak at ∼343 nm representing n → π* for the C![[double bond, length as m-dash]](https://www.rsc.org/images/entities/char_e001.gif) O group. In addition, GO color changes from brown to blackish after reduction via the peels extract of kaffir lime.
O group. In addition, GO color changes from brown to blackish after reduction via the peels extract of kaffir lime.
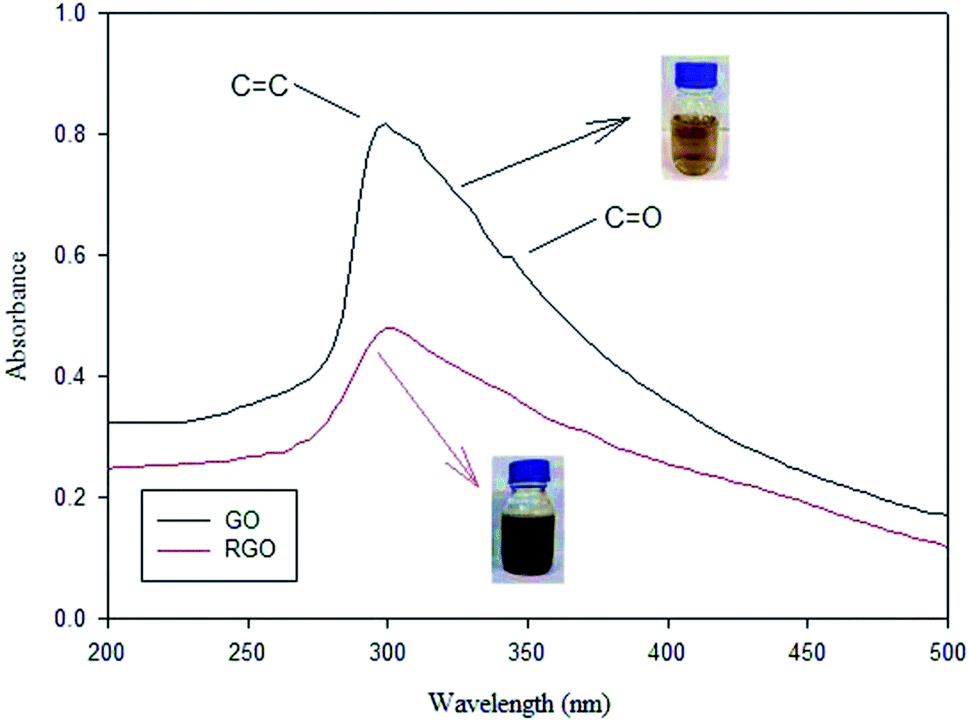 | ||
| Fig. 12 UV-Vis spectra of GO and rGO, adapted from ref. 116, copyright, Nature, 2020. | ||
Graphene and its derivatives are alternative carbonaceous sorbent nanomaterials, which are a type of one or numerous atomic layered graphite, offers exceptional two-dimensional structure as shown in Fig. 13a and b.117 Qian et al. reported the preparation of lignin–poly(N-methylaniline)–rGO hydrogel for both lead ions and MB dye removal.118 Obtained adsorption capacity of about 753.5 and 201.7 mg g−1 were obtained for Pb2+ ions and MB, respectively.
 | ||
| Fig. 13 SEM images (a and b) of rGO showing its unique layered structure, adapted with permission from ref. 117, copyright, American Chemical Society, 2021. | ||
Zhao et al.119 synthesized graphene oxide nanosheets as sorbent materials for Cd2+ and Co2+ ions removal from aqueous solution. The reported results revealed the reliance of heavy metal ions sorption on solution pH, ionic strength, and the abundant surface functional groups of the graphene oxide nanosheets. Also, Chandra et al.120 prepared magnetite graphene sorbent material possessing about 10 nm particle size. Great adsorption capacities were reported for As3+ and As5+, indicating the great adsorption capacity attributable to the improved adsorption sites in the graphene composite. In addition, Lee et al.50 studied the effect of flake size graphene oxide aerogel on Fe3+ adsorption and they found that capacity of 133.3 mg g−1 was obtained.50 Fig. 14 shows how Fe3+ ions binded to graphene oxide aerogel with different flake sizes.50
 | ||
| Fig. 14 Fe3+ ions adsorption at GO aerogel with (a) larger flakes size (b) smaller flakes size, adapted with permission from ref. 50, copyright, Elsevier, 2019. | ||
Reduced graphene oxide/NiO nanocomposites showed a good adsorption behaviour of Cr6+ of 198 mg g−1.121 While Chang et al. reported preparing a recyclable MnFe2O4@TiO2 core–shell magnetic composite loaded onto rGO as a unique adsorbent composite for ciprofloxacin Cu2+ removal from water.122 Under acidic conditions, the prepared composite showed good insolubility. Their results recorded a maximum adsorption capacity of 122.87 and 225.99 mg g−1 for CIP and Cu2+, respectively. In addition, adsorption profiles followed the Langmuir isotherm and pseudo-second-order kinetics. After 6 times of recycling, 76.56 and 118.45 mg g−1 adsorption capacities for CIP and Cu2+, respectively, were obtainable, as shown in Fig. 15.
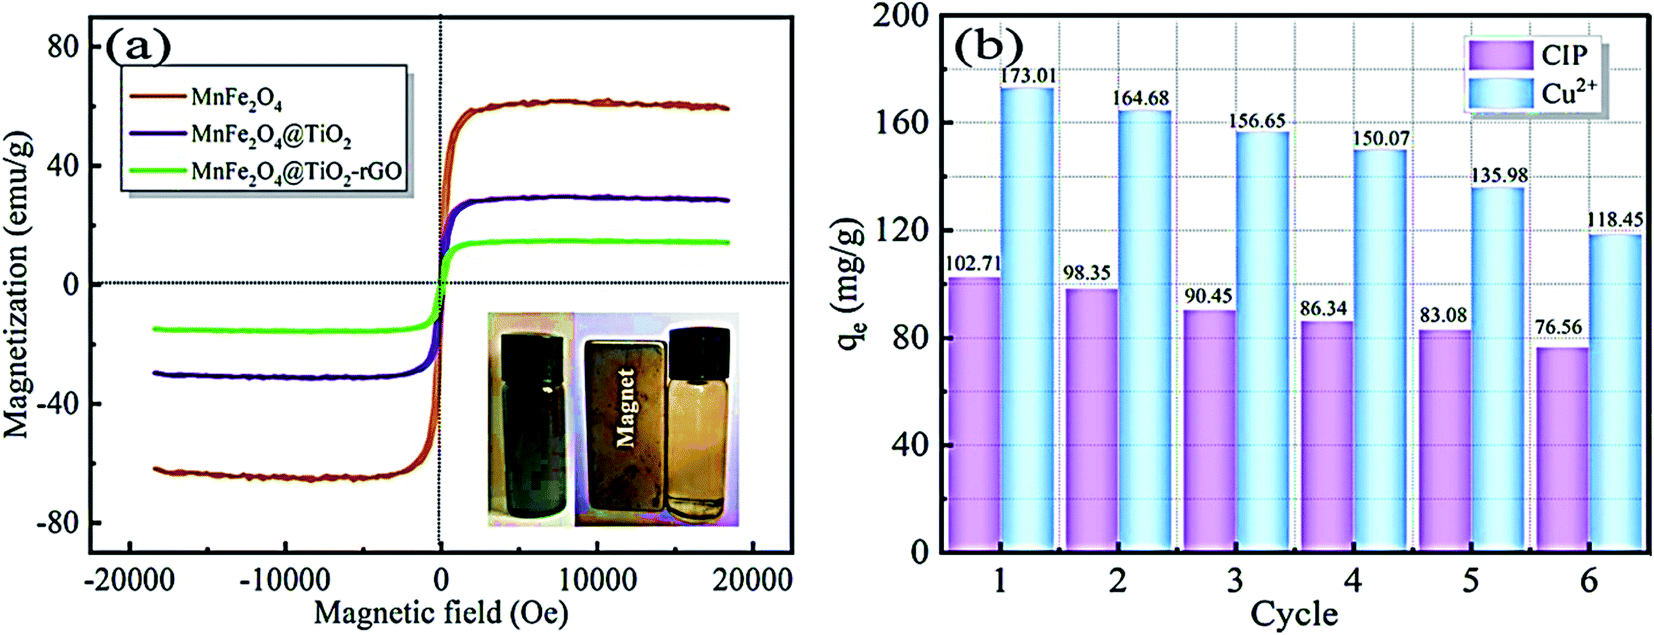 | ||
| Fig. 15 (a) Magnetic properties of the prepared composite, (b) reusability of the prepared composite for the adsorption of CIP and Cu2+, adapted with permission from ref. 122, copyright, Elsevier, 2021. | ||
3.2 Low-cost adsorbents
Recent developments in the adsorption process have heightened the need for studying the feasibility of utilizing effective economic sorbent materials. As a result, a greater focus was given to investigate economical ways of getting AC to replace the commercial one.72,74,123 Several researchers examine AC extracted from various wastes such as; straw,68 oil palm fiber,69 sunflower seed hull,70 Hevea brasiliensis seed coat,52 coir pith,71 and date-pit.75 On the other side, a supreme decrease in color (91.84%) and COD (75.21%) was recorded, proving that bamboo waste can be applied in the extraction of AC for textile effluents treatment. In another research,124 the elimination effectiveness of a cypress cone-based AC was investigated for the COD, color, and turbidity removal from real textile wastewater. Based on the achieved results, the diminution in color, turbidity, and COD reduction was 80.4, 67.1, and 19%, respectively. Generally, it was reported that cypress cone-based AC also represents a promising material for the preparation of AC for industrial wastewater treatment. Table 6 represents a non-exhaustive list of AC diverted from different wastes and its adsorption capacity of various contaminants.| AC waste precursor | Contaminant | Adsorption capacity (mg g−1) | Ref. |
|---|---|---|---|
| Bamboo dust | MB | 7.20 | 68 |
| Groundnut shell | 7.50 | 68 | |
| Coconut shell | 8.16 | 68 | |
| Apricot stone | 32.25 | 53 | |
| Apricot stone | 36.68 | 53 | |
| Rice husk | 37.57 | 68 | |
| Straw | 42.60 | 68 | |
| Rice husk | Acid yellow 36 | 86.90 | 125 |
| Sawdust | 183.80 | 125 | |
| Mahogany sawdust | Direct green B | 327.90 | 126 |
| Mahogany sawdust | 518.00 | 126 | |
| Bamboo dust | Pb2+ | 2.15 | 82 |
| Nut shells | Cd2+ | 104.17 | 85 |
Additionally, numerous researchers have reported the great performance of AC for heavy metals removals, such as nickel, cobalt, cadmium, copper, and chromium.127,128 The adsorption of Cd2+ and Hg2+ on ozonized AC has been reported.129 The authors concluded that electrostatic forces were leading for the Cd2+ adsorption and the dispersive forces were dominant in the Hg2+ adsorption. Kadirvelu et al.128 revealed that the AC extracted from agricultural wastes can effectively eliminate Hg2+ and Ni2+ from aquatic solutions in a short time with high removal rates. A study was examined to assess the adsorption rate of CAC and bamboo dust carbon (BDC) to exclude Pb2+ ions from metal industry effluent.82 The achieved results exposed BDC as a remarkable adsorbent for the deduction of Pb2+ ions and can be an alternative adsorbent to CAC to remove metal ions from water.
Agricultural wastes are considered an inevitable source of undesirable solid waste. However, they are abundant in nature and require little processing to be reused as low-cost sorbent materials. The optimal use of agricultural wastes is represented in many treatment processes based on the adsorption process.51 Numerous researchers recorded the feasibility of using agricultural waste to remove dyes and metal ions.7,24,49,73,137,138 Many agricultural waste materials are used as sorbent materials for the elimination of different types of dyes from water at diverse operating conditions; grass waste,35 orange peel,130 yellow passion fruit peel,36 mango seed,131 garlic peel,132 pineapple stem,133 phoenix tree leaf,134 peanut hull135 and palm kernel shell.74,139 These materials are obtainable and may have potential as sorbents owing to their physicochemical characteristics and negligible price. Various organic compounds (lignin, cellulose, and hemicellulose) with polyphenolic groups are useful for binding dyes through different mechanisms.24 The efficiency of utilizing spent green tea leaf powder waste (SGTLP) for the decolorization of textile wastewater was reported in literature.140 The recorded results revealed high color removal efficiency at acidic medium and elevated temperature. From the viewpoints of waste recycling, the use of SGTLP has a remarkable effect on colour adsorption and representing an economical attractive alternative for textile wastewater treatment.
Batzias et al.141 reported great adsorption performance of beech saw dust as an economical sorbent material for MB and basic red 22 removals. Additionally, the authors verified the potential of the beech saw dust adsorbent after treating with CaCl2, which advanced the adsorption properties of the original material. In ref. 132, the application of garlic peels (GP) has been investigated to remove MB dye from an aqueous solution. The supreme adsorption capacities were 82.64, 123.45, and 142.86 mg g−1 at 303, 313, and 323 K, respectively. The authors concluded that GP could potentially apply basic dyes removal attributable to the great existence of polar functional groups. The adsorption capacity of some agriculture waste sorbents for the exclusion of numerous dyes and heavy metals is itemized in Table 7.
| Waste precursor | Contaminant | Adsorption capacity (mg g−1) | Ref. |
|---|---|---|---|
| Phoenix tree leaf | MB | 89.70 | 134 |
| Pineapple stem | 119.05 | 133 | |
| Mango seeds | 142.86 | 131 | |
| Garlic peel | 142.86 | 132 | |
| Broad bean peel | 192.70 | 142 | |
| Alfa stems | 200.00 | 33 | |
| Citrus limetta peel | 227.30 | 37 | |
| Jackfruit peel | 285.71 | 143 | |
| Guava leaf powder | 295.00 | 144 | |
| Pomelo (Citrus grandis peel) | 344.83 | 145 | |
| Papaya seeds | 555.56 | 34 | |
| Wheat shells | 21.50 | 146 | |
| Yellow passion fruit peel | 6.80 | 36 | |
| Coir pith | CR | 6.72 | 71 |
| Orange peel | Acid violet 170 | 19.88 | 130 |
| Mixture almond shell | Direct red 80 | 20.50 | 147 |
| Peanut hull | Reactive black 5 | 55.50 | 135 |
| Olive stones | Cd2+ | 0.58 | 148 |
| Potato peels | Cr6+ | 13.09 | 149 |
| Mango leaves | Cu2+ | 15.77 | 150 |
| Peanut shell | Cu2+ | 25.30 | 151 |
| Peanut shell | Cr3+ | 27.86 | 151 |
| Sunflower leaves | Cu2+ | 89.37 | 152 |
| Orange peel | Pb2+ | 204.50 | 153 |
In another study, Feng et al.154 indicated that the chemically modified orange peels have enhanced contaminants' adsorption more than the unmodified orange peels. The obtained results indicated a maximum adsorption capacity of the modified orange peels for Pb2+, Cd2+, and Ni2+ ions removal as 476.1, 293.3, and 162.6 mg gm−1, respectively, at a contact time of 150 min and pH 5.5. Also, Lugo et al.57 investigated the elimination of Cr3+ and Fe3+ from aquatic solutions onto orange peels adsorbent. The results revealed that the optimum adsorption capacity of orange peel for Cr3+ and Fe3+ was 9.43 and 18.19 mg g−1, respectively. In conclusion, agricultural waste materials demonstrated efficient, low-cost adsorbents for contaminants removal.
While, waste red mud (RM) was obtained from Worsley Alumina, Australia's downstream slurry pond. By filtration of the slurry, solid materials were collected and then dried at 110 °C overnight. Two samples were prepared by heat treatment at 800 °C overnight and acid-treatment using (1 N) HNO3 solution at room temperature for 24 h. Post-treatment, the latter sample was filtered, purified, and dried overnight at 110 °C.
Daily, enormous quantities of industrial solid wastes are produced without a proper treatment method. Recently, searching for an effective environmental method to reuse these wastes has become a concern to many researchers. On account of the great ability of these materials to adsorption, in addition to being inexpensive, numerous works have shown the ability of these wastes to adsorb dyes and heavy metals from wastewaters, as presented in Table 8. There are many types of industrial waste sorbent materials, such as fly ash, red mud, blast furnace sludge, metal hydroxide sludge, etc. Coal fly ash has been evaluated156 for real textile effluent treatment. The obtained results revealed that coal fly ash is efficient for the textile effluent decoloration up to 83.00% and for COD removal up to 61.11% at acidic medium (pH ≤ 2), temperature >20 °C, contact time of 3–5 min and adsorbent dose of 12–40 g L−1. The adsorption capability of metal hydroxide sludge has been assessed for the removal of azo reactive dyes.157 The authors revealed that metal hydroxide sludge was a positively charged adsorbent with a great adsorption capacity of up to 62 mg g−1. Khan et al.158 have examined iron oxide activated red mud (IOARM) for cadmium elimination from aqueous solution. The optimum operating conditions were recorded as pH 6.0, contact time 90 min, dose 6.0 g L−1, initial concentration 400 mg L−1, and temperature 300 K. The obtained results revealed that IOARM is a capable adsorbent for cadmium removal from water based on natural conditions.
While, the efficient removal of Congo red dye was reported by Madan et al., using high-silica zeolitic particles (core) functionalized with ZnO nanoflakes (shell) prepared by precipitation method.164 In brief, KOH (1.48 g) was added to (65 mL) methanol solution, which was added drop-by-drop to another solution containing Zn(CH3COOH)·2H2O (2.95 g) dissolved in (125 mL) of methanol, the resultant solution was left under constant stirring for 2.5 h. After washing the obtained precipitate with methanol, it was immersed in a nanoparticle seeding solution containing methanol, n-butanol, and chloroform. After that, it was dried at 350 °C. Furthermore, prepared solutions of hexamethylenetetramine (1% w/v), polyethylenimine (3.3% v/v), and zinc nitrate (2.6% w/v) were obtained by dissolution in water (30 mL) to prepare ZnO nanoflakes on the obtained zeolite (1.5 mL) of ammonia solution was added to a mixture of (30 mL) PEI solution, (50 mL) HMTA solution, and (30 mL) zinc nitrate solution. Then, (1 g) of previously prepared zeolite powder was added, and the mixture was left under stirring at 95 °C for 4 h. Finally, the obtained mixture was filtered, washed many times with D.I.W., and activated for 30 min at 450 °C. Fig. 16 presents TEM analysis of the prepared nanocomposite, confirming ZnO nanoflakes distribution on zeolite particles' surface.
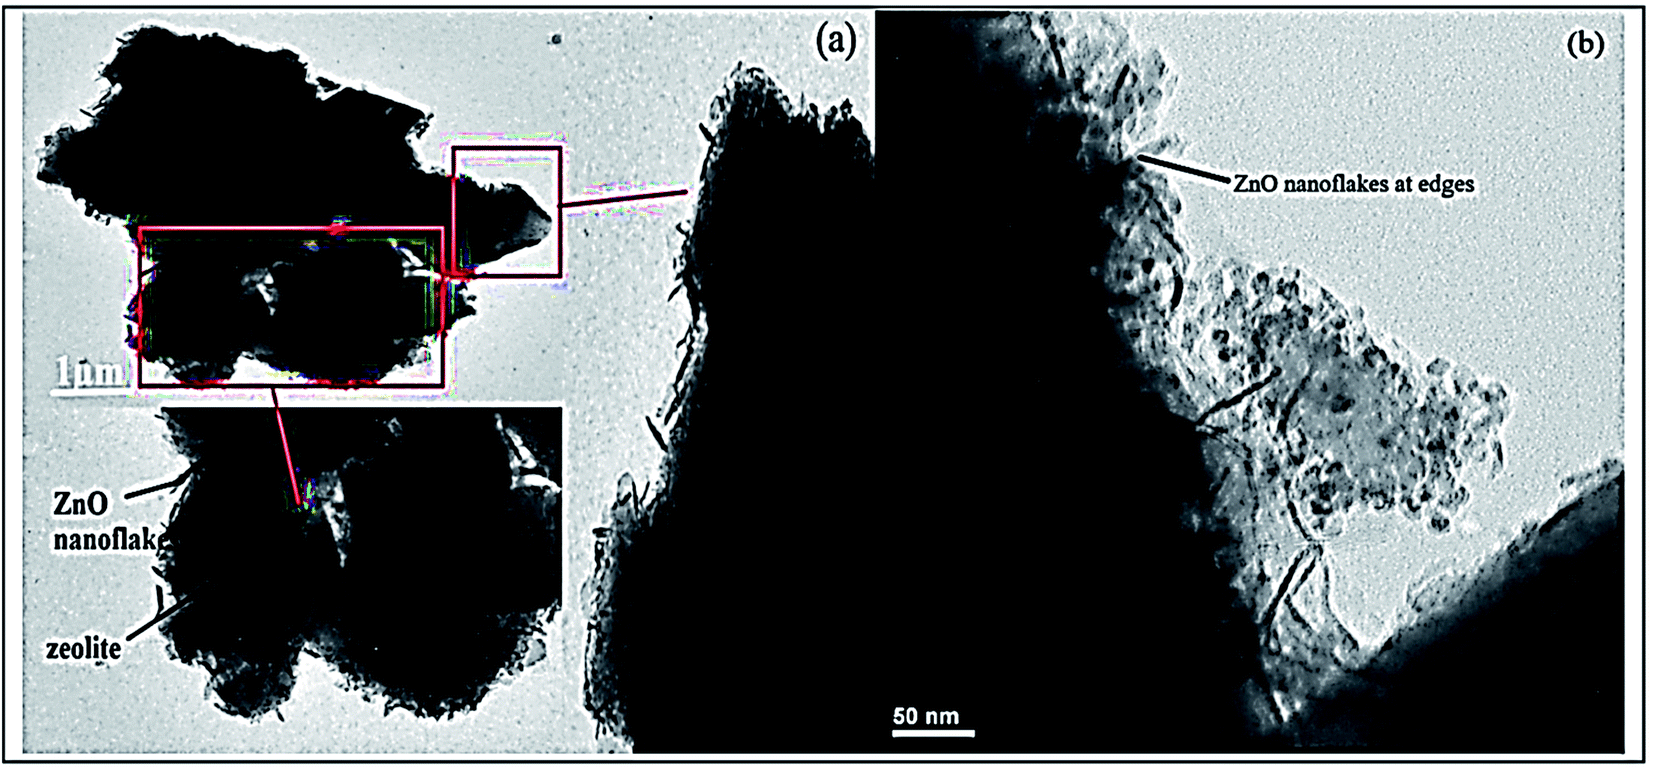 | ||
| Fig. 16 TEM analysis of the prepared ZnO@Ze nanocomposite at different magnifications (a and b), adapted with permission from ref. 164, copyright Elsevier, 2019. | ||
Recent trends in low-cost sorbent materials have led to a proliferation of studies evaluating natural materials for adsorption. These natural materials are eco-friendly, economical, abundant, and have the dramatic ability for adsorption.165 The high adsorption ability of natural materials is considered a sequence of their great surface area and the net negative charge on the minerals structure, which bounces the competence to adsorb positively charged contaminants.48 Different natural materials such as clay, zeolite, and siliceous materials have been proposed for dyes and heavy metals removal from wastewater (Table 9).
| Adsorbents | Contaminant | Adsorption capacity (mg g−1) | Ref. |
|---|---|---|---|
| Alunite | Reactive red 124 | 2.85 | 171 |
| Zeolite | Basic dye | 55.86 | 172 |
| Clay | MB | 300.00 | 173 |
| Clay | Methyl green | 427.00 | 173 |
| Clay | Methyl violet | 526.00 | 173 |
| Clay | Neutral red | 567.00 | 173 |
| Zeolite | Mn2+ | 76.78 (mmol kg−1) | 174 |
| Zeolite | Zn2+ | 133.85 (mmol kg−1) | 174 |
| Zeolite | Cu2+ | 141.12 (mmol kg−1) | 174 |
| Zeolite | Co2+ | 244.13 (mmol kg−1) | 174 |
Clay minerals such as bentonite, kaolinite, and diatomite demonstrate a strong affinity for cationic and anionic dyes. Nevertheless, the adsorption ability for basic dye is much better than for acid dye due to the ionic charges on the dyes and clay character. The bentonite capacity for the removal of basic dyes was demonstrated to be 360.5 mg g−1 by the authors in ref. 166. Similar results have been reported in ref. 167 basic blue 9 dye removal. Moreover, the adsorption capacity of Fullers Earth and CAC was compared in ref. 168 for MB dye from an aqueous solution. The authors revealed that Fullers Earth is more efficient than CAC. Sdiri et al.169 studied the removal of Cu2+ and Zn2+ based on natural clay from diverse aqueous systems, as shown in Fig. 17. The obtained results presented that respectable adsorption capacities can be reached under pH 6, 1 h, and 1 g L−1 adsorbent dose at room temperature. In conclusion, natural clay adsorbent showed potential adsorption for Zn2+ ions removal than Cu2+ ions.
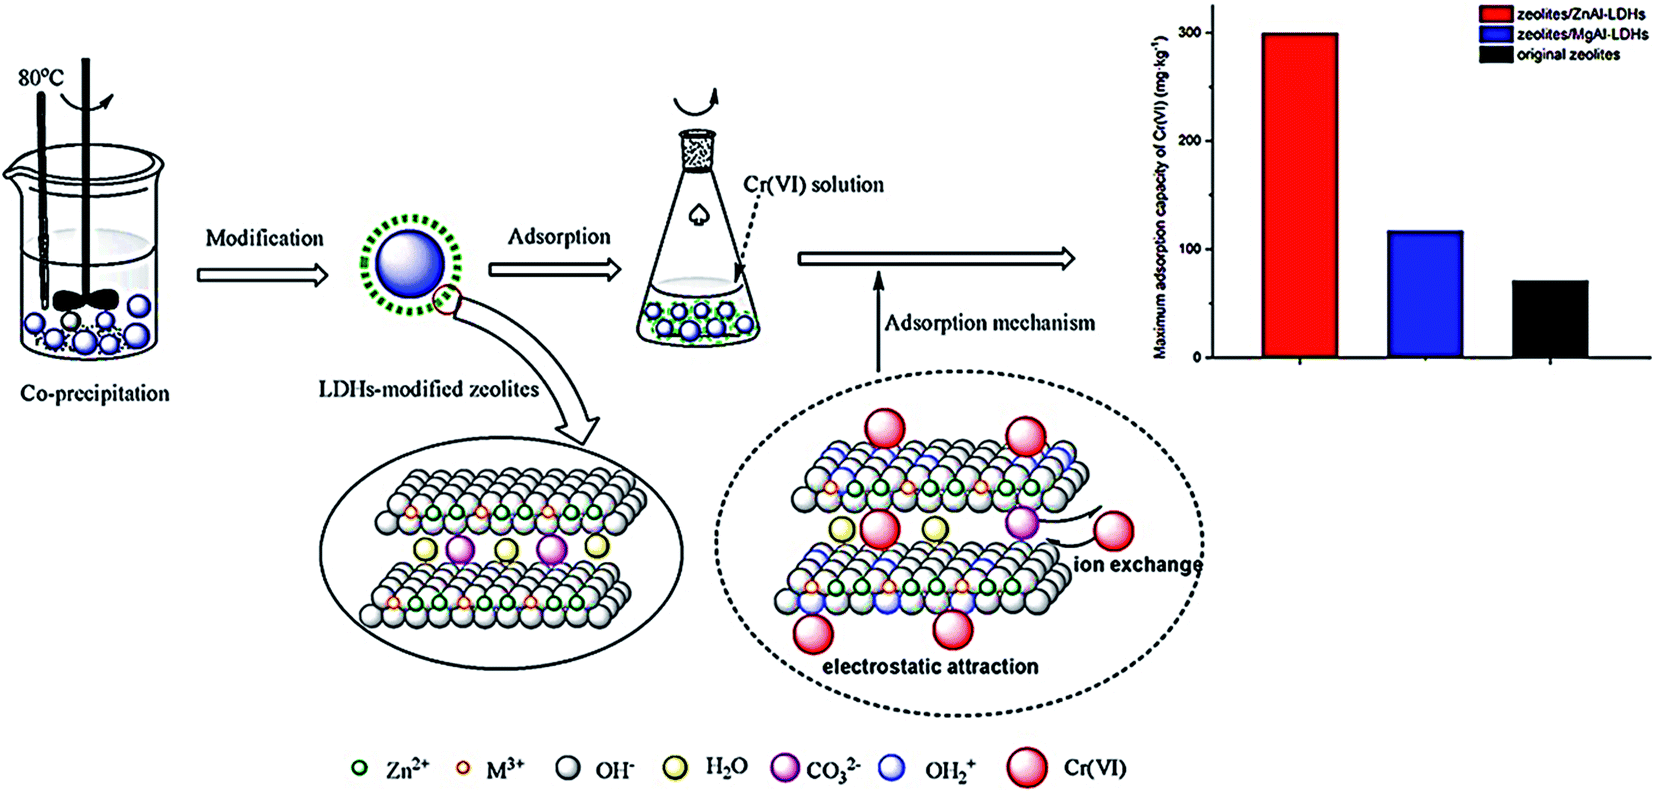 | ||
| Fig. 17 Removal difference of Cr6+ by modified zeolites coated with MgAl and ZnAl-layered double hydroxides, adapted with permission from ref. 170, copyright, Elsevier, 2021. | ||
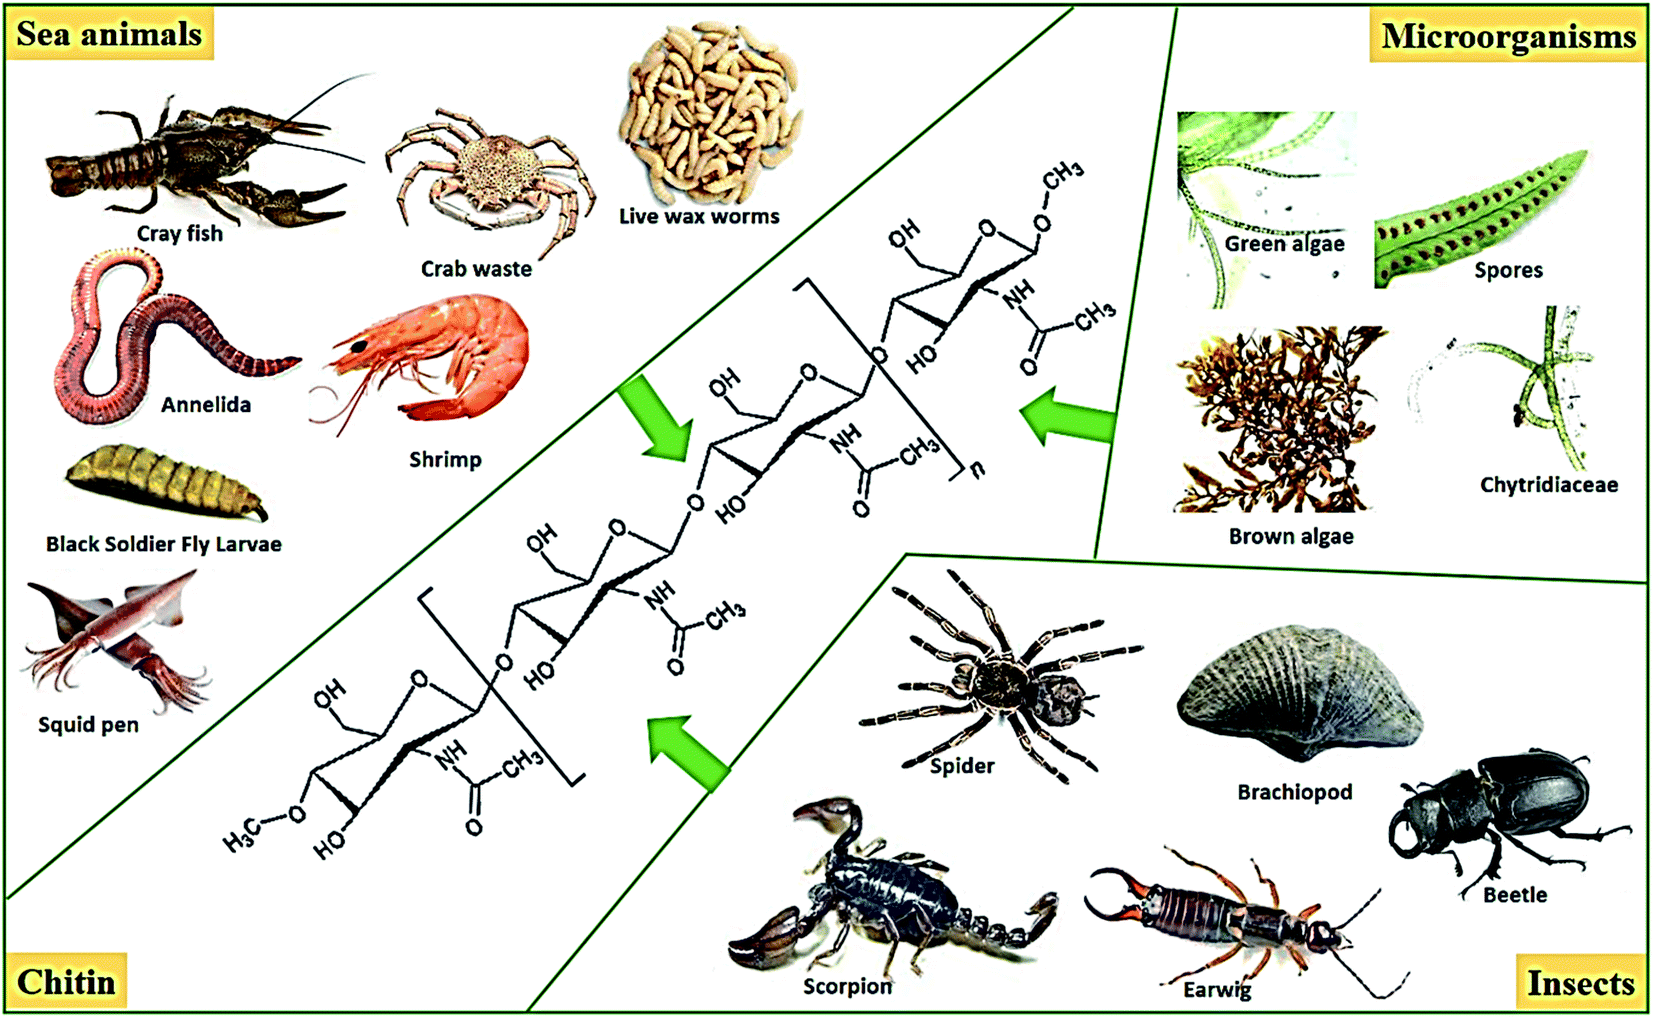 | ||
| Fig. 18 Sources of chitin. | ||
The great adsorption capability of biosorbents is heavily reported. The adsorption rate of some biosorbents to exclude many dyes and metal ions is listed in Table 10. Fu and Viraraghavan demonstrated the Aspergillus niger (dead fungal biomass) adsorption performance in diverse studies.177–180 The studies showed a notable performance for Aspergillus niger fungi application as an adsorbent for dyes removal. Aksu et al.181 reported a great adsorption capacity (588.2 mg gm−1) for reactive black 5 dye using Rhizopus arrhizus biomass. Also, Waranusantigul et al.182 reported the applicability of using Spirodela polyrrhiza biomass to exclude methylene blue dye. Chitosan has an extensive consideration as a competent adsorbent thanks to its great contents of amino and hydroxyl functional groups compared to AC. It showed great potential for adsorption of varied contaminants, for example, dyes and heavy metals. The adsorption on chitosan has been reported for acid dyes removal by the authors in ref. 183. They concluded maximum adsorption capacities of chitosan for acid orange 12 (973.3 mg gm−1), acid orange 10 (922.9 mg gm−1), acid red 73 (728.2 mg gm−1), and acid red 18 (693.2 mg gm−1). Cardoso et al.79 compared Spirulina platensis microalgae (SP) and CAC to absorb reactive red 120 (RR-120) dye from aqueous solutions. The determined adsorption capacities of RR-120 dye have been reported 482.2 and 267.2 mg gm−1 for the SP and CAC adsorbents, respectively, at pH 2 and 298 K. It was also investigated by the authors that SP and CAC adsorbents presented respectable performance, 97.1 and 96.5%, respectively, of a dye mix at elevated saline concentrations. The removal of cadmium as a toxic heavy metal was assessed using CAC, chitosan and chitosan/AC composite adsorbents.83 The obtained results by the authors have revealed the maximum adsorption capacities of CAC, chitosan and chitosan/AC composite as 10.30, 10.00, and 52.63 mg gm−1, respectively at optimum operating conditions pH 6 and adsorbent dose 6 g L−1. Chitosan-based nanofibres were also evaluated for 3-methyl-4-nitrophenol removal from aqueous solutions. The findings revealed significant adsorption capacity reached 90% for at least 3 consecutive cycles.184
| Biosorbent | Contaminant | Maximum adsorption capacity (mg g−1) | Ref. |
|---|---|---|---|
| Algae (green algae Ulva lactuca) | Dye (methylene blue) | 40.2 | 189 |
| Algae (brown algae Cystoseira barbatula Kutzing) | Dye (methylene blue) | 38.61 | 190 |
| Fungi (Aspergillus niger) | Heavy metal (Cu2+) | 15.6 | 191 |
| Fungi (Aspergillus niger) | Heavy metal (Pb2+) | 34.4 | 191 |
| Fungi (Aspergillus niger) | Heavy metal (Cr6+) | 6.6 | 191 |
| Bacterial biomass (Bacillus thuringiensis) | Heavy metal (Ni2+) | 45.9 | 192 |
| Chitosan | Acid orange 12 | 973.3 | 183 |
| Chitosan | Acid orange 10 | 922.9 | 183 |
| Chitosan | Acid red 73 | 728.2 | 183 |
| Chitosan | Acid red 18 | 693.2 | 183 |
| Chitosan | Acid green 25 | 645.1 | 183 |
Cellulose based adsorbents (CBA) are considered promising and cost-effective for removing dyes and metal ions from water.185,186 Because of the abundance of hydroxyl, carboxyl, and phenolic groups throughout the backbones of cellulose, CBA have the ability to bind contaminants effectively. Moreover, the porous structure of cellulose which allows active agents to disperse inside the substrates.187,188 Li et al., 2020 (ref. 186) applied the liquid phase reduction technique to load sawdust cellulose on zero-valent iron to remove arsenic and Cr3+ ions from aqueous solution. The results revealed high adsorption capacities reached 111.37 and 268.7 mg g−1 for arsenic and Cr3+ ions, respectively. Porous magnetic cellulose/Fe3O4 beads was also investigated for MB and rhodamine B (RhB) dyes removal from aqueous solution.185 The maximum adsorption capacity reached 1186.8 and 151.8 mg g−1, respectively. Li et al.188 developed an innovative composite adsorbent based on dissolved cellulose fibres and microfibrillated cellulose modified by nano-sized CaCO3 as a pore forming agent for MB dye removal. The results showed maximum adsorption capacity of MB at 303 mg g−1. Moreover, fine aminated cellulose/montmorillonite mesoporous composite beads achieved great adsorption rate for auramine O dye reached 1336.2 mg g−1 at 55 °C.
3.3 Metals and metal oxide-based nanomaterials
:1, v/v) ratio via stirring for 15 min. Then, sodium borohydride (1.10 M) reducing agent was dipped to the mixture under constant stirring with (1–2 drops per second) rate. Finally, the sample was filtered, washed with water and ethanol, and dried under a vacuum. While Ebrahiminezhad et al. prepared ultra-small clusters of zero-valent iron nanoparticles by green method to remove MO.194 The mean diameter of the prepared particles was about 19 nm, as shown in Fig. 19. (9 mL) of Mediterranean cypress (Cupressus sempervirens) leaf extract was vigorously stirred in a (50 mL) round bottom flask at ambient temperature. Then, 1 mL of FeCl3·6H2O (1 M) solution was injected into the flask under constant stirring for 24 h. After that, the formed black precipitate was collected by centrifugation, followed by D.I.W. washing three times to remove reaction residuals. Finally, the collected powder was dried at 50 °C in the oven.
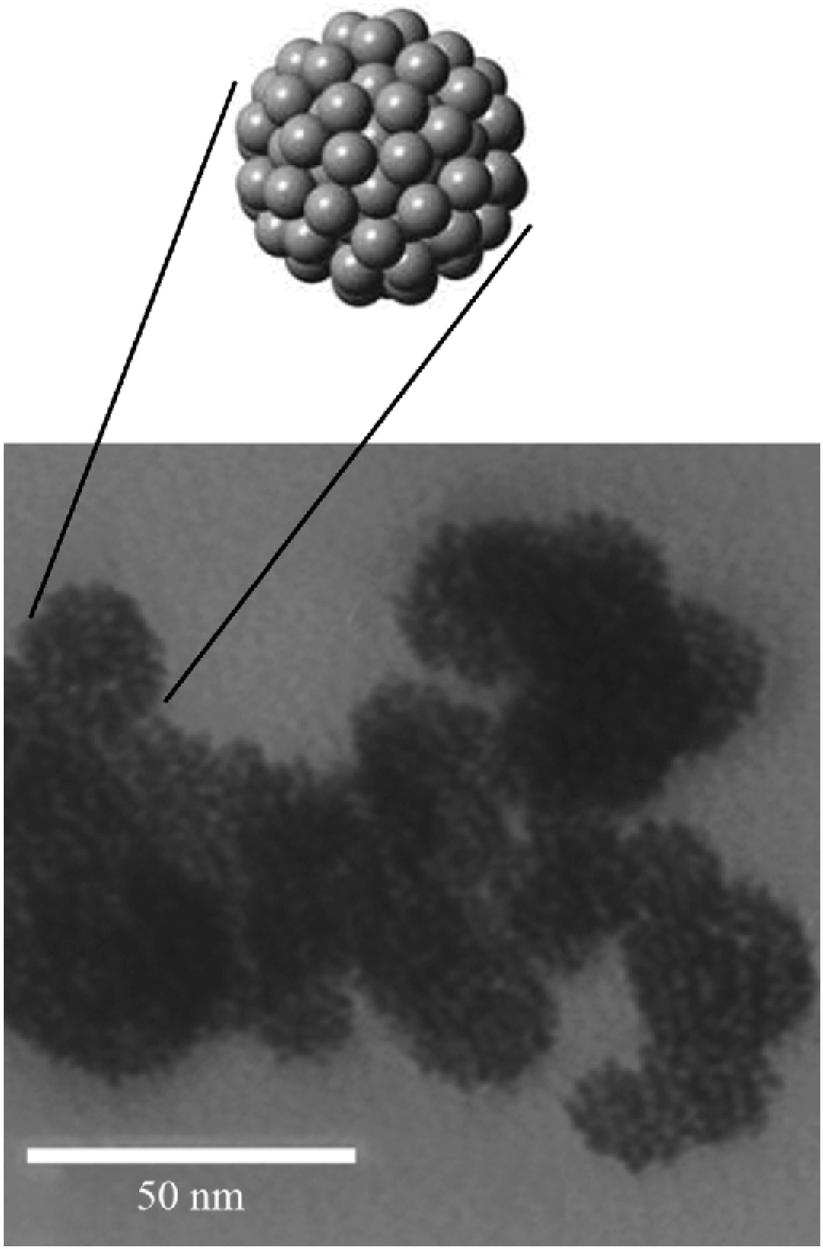 | ||
| Fig. 19 TEM micrograph of the prepared zero-valent iron NPs, adapted with permission from ref. 194, copyright, Elsevier, 2018. | ||
| Metal oxide | Preparation method | Tested dye/heavy metal | Capacities (mg g−1)/removal efficiency (%) | Size range/crystallite size (nm)/surface area (m2 g−1) | Ref. |
|---|---|---|---|---|---|
| MgO | Green synthesis using Tecoma stans (L.) extract | Congo red (CR) and crystal violet (CV) | 142.17–150.49 | SR: from 20 to 50 | 195 |
| Microwave-assisted combustion method | CR and trypan blue | 136–132 | Average particle size 18 | 4 | |
| Precipitation method | Reactive blue 19 (RB19), reactive red 195 (RR 195), CR, MB, and rhodamine B | 549.45 to RB19, 348.43 to CR, and 442.48 to RR195 | CS: 37/SA: 154.85 | 196 | |
| Green synthesis using Aspergillus niger | Textile wastewater containing Cr, Co, Pb, Cd, and Ni, heavy metals | 94.2% ± 1.2%, 63.4% ± 1.7%, 72.7% ± 1.3%, 74.1% ± 1.8%, and 70.8% ± 1.5% | SR: nano-rectangular (18.6–27.6) and nano-rods (30–85) | 197 | |
| TiO2 | Sol–gel/green synthesis using Tridax procumbens leaf extract | MO | 273.37 at 303 K | — | 198 |
| CdS/TiO2 decorated carbon nanofibers | Electrospinning method | MB reactive black 5, and reactive orange 16 | 95% removal after 5 min | — | 199 |
| MgFe2O4–TiO2@GO | Ultrasonication method | MB | 99% removal at 50 ppm/0.05 g conc. and adsorbent dose | SR: from 20 to 30 – SA: 58.48 | 200 |
| AC/TiO2/chitosan | Impregnation method | Safranin O | 357.14 | SR: 29.83–50 – SA: 834.477 | 201 |
| Al2O3/GO-based cellulose | Green synthesis | Fluoride | 5.34 in pH 5 after 120 min | CS of Al2O3: 5.52 | 202 |
| ZnO | Green synthesis | CR – malachite green | 92.30% after 120 min to 90.7% after 90 min | MD: 44 – CS: 37.86 – SA: 63.09 | 203 |
 | ||
| Fig. 20 Schematic presentation of the steps used to prepare CNFST composite matrix loaded with C-dots, rGO, and SWCNTs, adapted from ref. 204 with copyright permission from Elsevier, 2020. | ||
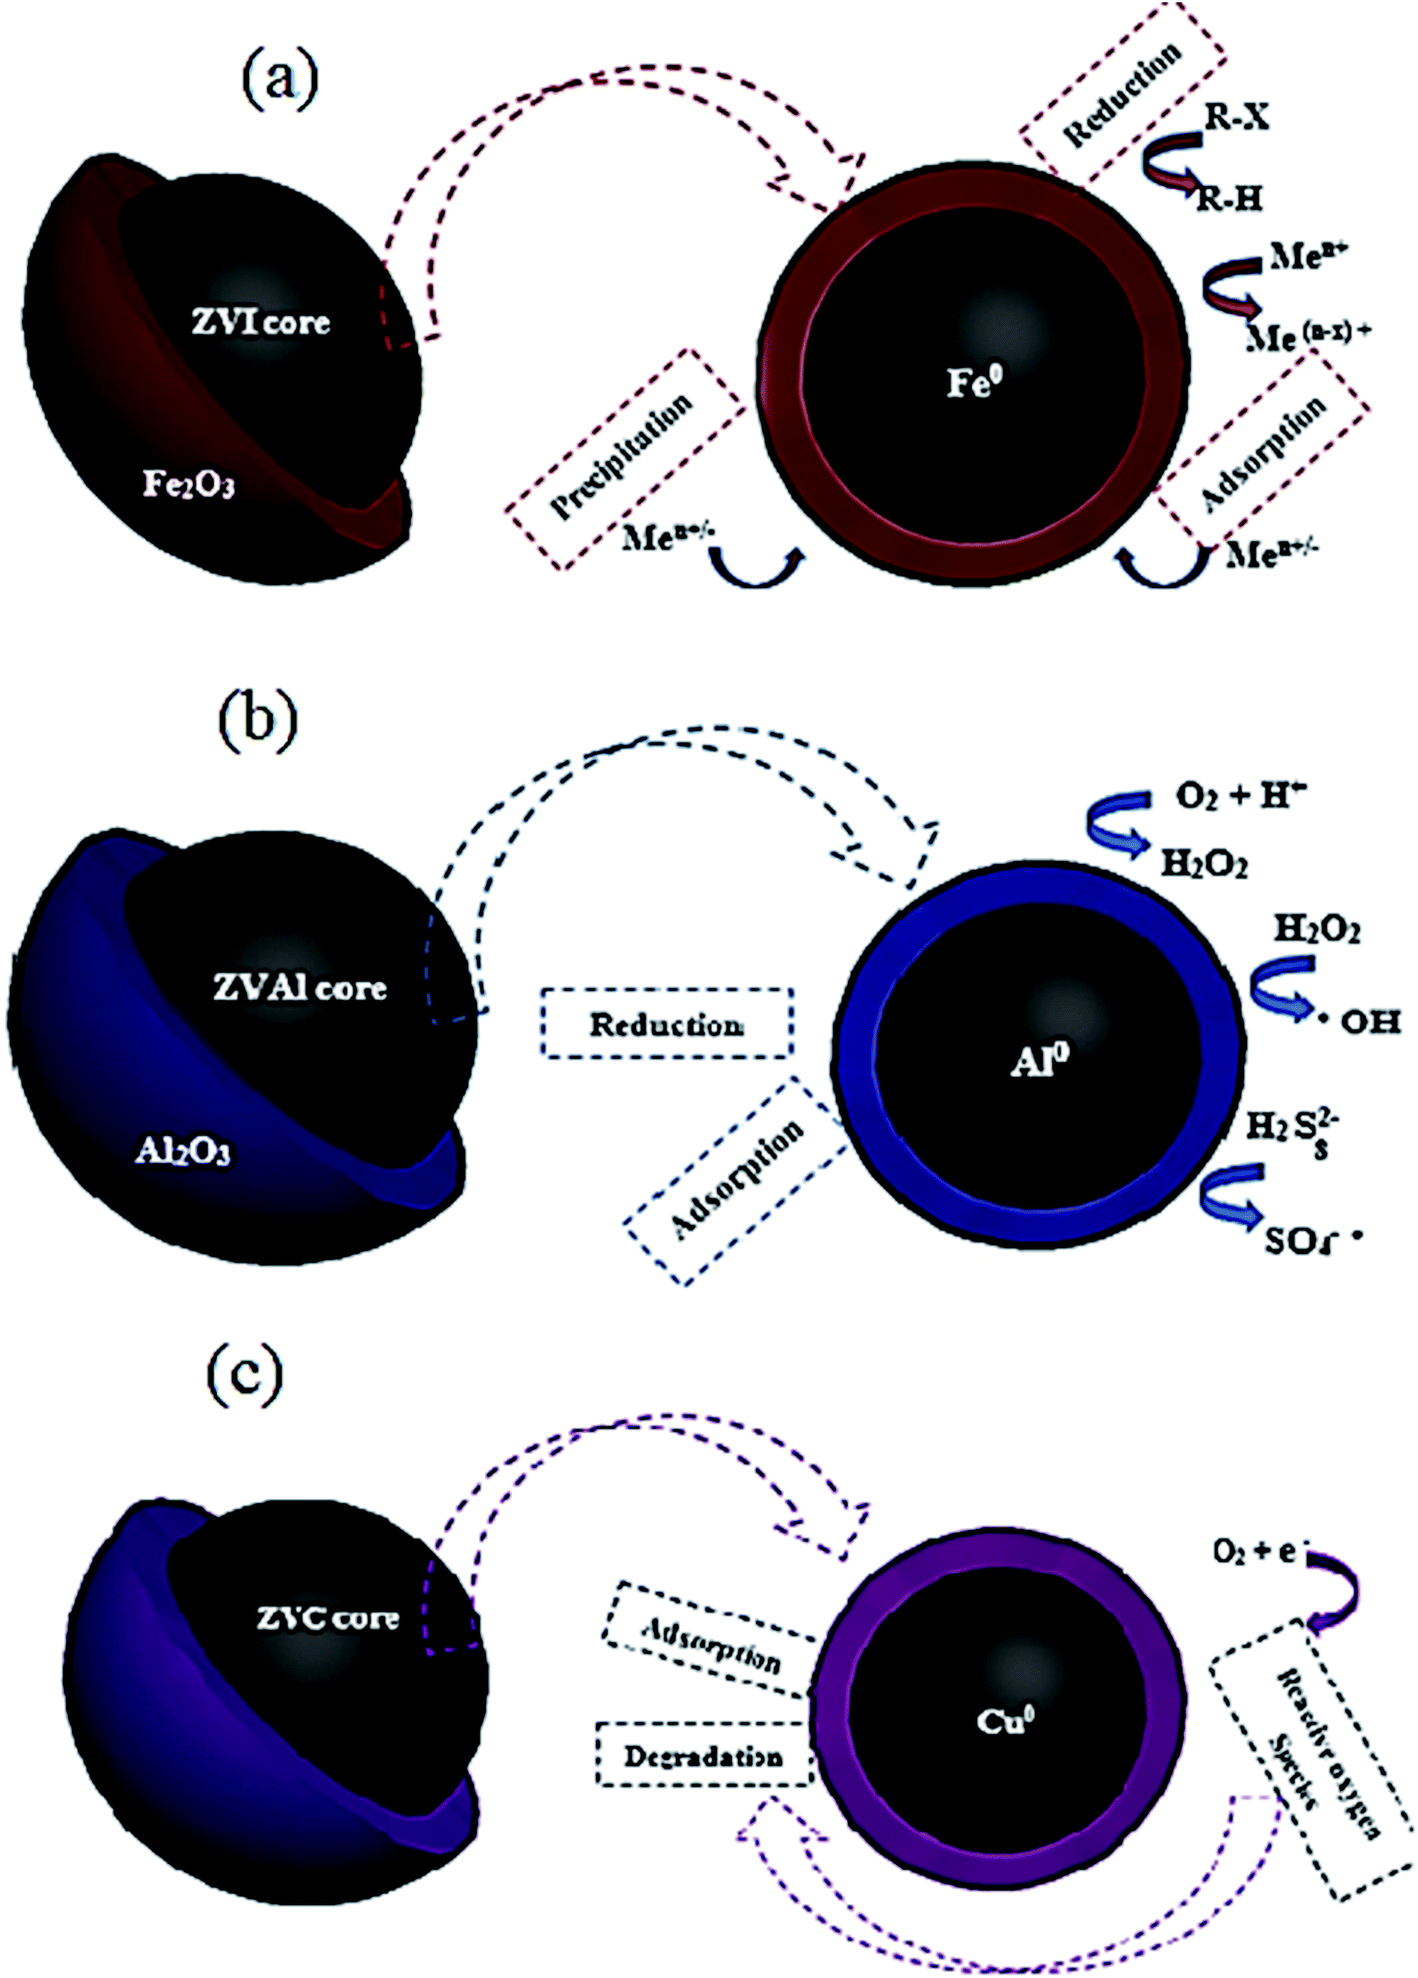 | ||
| Fig. 21 Nano zero-valent iron (a) aluminum (b), and copper (c) core–shell structures with different mechanisms of contaminants removal. | ||
In early research, the disperse red 1 azo dye adsorption on nZVI has been evaluated.209 About 98% color removal was recorded in a fairly short time 10 min. Also, the capability of adsorbing MB basic dye was studied at optimum operating conditions of pH 9.5, adsorbent dosage 0.5 g L−1, and contact time of 1 min.208 The extreme adsorption rate of nZVI towards MB was 208.33 mg g−1, demonstrating a promising adsorbent for dying effluents treatment. In another study,206 the authors examined the removal of Cr6+ on bentonite-supported nano zero-valent iron (B-nZVI) and unsupported nZVI. The B-nZVI showed great removal results 99% of Cr6+ at 250 rpm and 35 °C with 50 mg L−1 initial concentration of Cr6+. In a comparative study,2 the concert of using nZVI and AC was examined for the removal of color from real textile wastewater. The results showed the enhanced color removal for the two examined adsorbents reached 84% for the AC and 80% for the nZVI at same operating conditions 0.8 g L−1 dose and 20 min contact time. A scaling up treatment study was investigated by Badawi et al.210 to assess the viability of using nZVI in a combined treatment system for the color removal from real textile wastewater. The results revealed maximum colour removal reached 98.4% at 0.8 g L−1 dose. The separation and recycling process was applicable depending on the magnetic properties of the nano iron particles. Lately, nano zero-valent aluminum (nZVAl) has gained an increasing interest in the field of wastewater treatment through its abundant surface area and high surface reactivity.211 It was observed that nZVAl can generate hydroxyl and sulfate radicals, eliminating non-biodegradable contaminants in a short reaction time from water.212 Fig. 21b shows the core structure on nZVAl particle with different mechanisms of contaminants removal. Zero-valent aluminum is considered efficient sorbent material and has a higher catalytic activity to treat industrial wastewaters.211,212 The superior performance of nZVAl in removing dyes and heavy metals from wastewater has been investigated by a numerical study.213–215 Guo et al. found that ZVAl revealed an exceptional ability for the acid orange 7 (AO7) degradation under ultrasonic irradiation.213 It was reported that the decolorization rate improved with the increase of ZVAl dose and power density. About 96% removal rate was reported for the AO7 dye at pH 2.5, 30 min contact time, 20 mg L−1 initial dye concentration, 2 g L−1 ZVAl dose and 20 kHz with 300 W ultrasound. In another study,215 the authors have studied the treatment of textile effluent by advanced oxidation processes (AOPs) based on ZVAl. Experiments were conducted for the removal of COD, color and ammoniacal nitrogen removal by using different combinations with ZVAl; ZVAl/O2, ZVAl/Fe3+/O2, ZVAl/Fe3+/O2/H2O2 and ZVAl/Fe3+/O2/persulfate processes. Maximum removal results were recorded 97.9, 94.4 and 58.3% for COD, color and ammoniacal nitrogen removal, respectively 1 g L−1 ZVAl, 0.5 g L−1 Fe3+ and 6.7 g L−1 H2O2 in 3 h of reaction time. On the other side, the significant ability of activated ZVAl in eradicating Cr6+ from wastewater was testified by the authors in ref. 214. The exclusion rate of Cr6+ was enhanced with the increased load of acid washed ZVAl at low initial pH. About 98% removal rate was reported at optimum operating conditions: 180 min contact time, 0.4 g L−1 acid washed ZVAl dose at initial pH 2.0 for the eradication of Cr6+ from synthetic wastewater holding 20.0 mg L−1 Cr6+.
Improvement of the cost-effective sorbent material is essentially required to develop the band gap energy of the nanomaterials. Copper-based nanomaterials could offer an efficient, economical way for wastewater treatment thanks to their unique chemical, electrical, optical and thermal properties.86 Enormous researchers have examined nano zero-valent copper (nZVC) for the degradation of chemical pollutants,216,217 nitrate removal,218,219 phenol removal,220 and dyes degradation.193,221 Fig. 21c shows the core–shell structure of the nZVC nanoparticles.
The effectiveness of using nZVC as a catalyst in combination with H2O2 and ultrasound irradiation for phenol degradation from an aqueous solution has been reported.220 The results exposed that the degradation of phenol is massive in the presence of nZVC with H2O2, which can be credited to the enhanced production of OH radicals in the medium. The maximum degradation rate extended to be 65% using 1 g L−1 of nZVC in the presence of 20 mM H2O2 after 60 min of sonication. In another study,193 the authors performed experimental investigations on the reactive blue 4 (RB4) dye degradation using nZVC. The degradation reaction was enhanced at low pH < 4 (acidic medium). About 90% removal rate was recorded in 10 min of reaction time. In the experiment of reusing the recovered ZVC nanoparticles, a slight loss of catalytic activity was observed, showing a degradation rate of 73% in the second cycle of the nanomaterial use.
| Adsorbent | Contaminant | Adsorption capacity (mg g−1) | Ref. |
|---|---|---|---|
| MgO | Indanthren blue | 86.50 | 63 |
| MgO | Levafix fast red CA | 92.16 | 63 |
| MgO | Reactive brilliant red X3B | 277.78 | 225 |
| MgO | Congo red | 303.03 | 225 |
| TiO2 | Cr6+ | 12.60 | 226 |
| TiO2 | Pb2+ | 21.70 | 227 |
| TiO2 | Ni2+ | 39.30 | 227 |
| Al2O3 | Pb2+ | 41.20 | 227 |
| Al2O3 | Ni2+ | 35.90 | 227 |
| Al2O3 | Cu2+ | 47.90 | 227 |
| TiO2 | Cu2+ | 50.20 | 227 |
| MnO2/gelatin | Cd2+ | 105.10 | 228 |
| Al2O3 | Cd2+ | 118.90 | 227 |
| TiO2 | Cd2+ | 120.10 | 227 |
| MgO | Cd2+ | 135.00 | 227 |
| MgO | Pb2+ | 148.60 | 227 |
| MgO | Cu2+ | 149.10 | 227 |
| MgO | Ni2+ | 149.90 | 227 |
| MnO2/gelatin | Pb2+ | 318.70 | 228 |
| ZnO | Zn2+ | 357.00 | 229 |
| ZnO | Cd2+ | 387.00 | 229 |
| ZnO | Hg2+ | 714.00 | 229 |
3.4 Nanocomposite materials
Numerous nanomaterials have been studied and developed to remove serious contaminants such as heavy metals and color from industrial wastewaters with low cost and high efficiency. The admirable characteristic of these materials is their nanosized scale and their large surface area associated with their small size. Moreover, the exceptional electron conduction properties could offer sorbent nanomaterials with excellent evaluation in heavy metals and dyes removal from real industrial wastewaters. The synergistic effect of the nanocomposites also plays a critical role in the adsorption performance. Thus, many types of hybrid nanocomposite materials from metal/metal oxide (Fe/MgO),230 metal oxide/carbon materials (NiO/graphene),231 metal oxide/metal oxide (Fe3O4/MnO2, Co3O4/SiO2),232,233 metal oxide/carbon materials (MWCNTs-Fe3O4),234 and metal oxide/polymer materials (Fe3O4/polypyrrole)235 have been prepared and tested for dyes and metal ions removal. Abd Elkodous et al. reported a new TiO2-based nanocomposite decorated with different carbon materials to remove chloramine-T from water.236 MWCNTs-Fe3O4 nanocomposite showed high adsorption efficiency of 238.78 mg g−1 toward Hg2+.234 In addition, Co3O4/SiO2 showed a high ability to adsorb MB (53.87 mg g−1).232 Moreover, γ-Fe2O3–polypyrrole nanocomposite showed a high adsorption capacity of 464 mg g−1 of MB.2354. Limitations and future challenges
Table 13 reviews the advantages and margins of various sorbent materials for industrial effluents treatment. It was reported that AC, CNTs, and graphene adsorbents could be considered to have the supreme ability for adsorption; however, it's costly to be regenerated. For the low-cost adsorbents, including agriculture, industrial waste adsorbents, natural materials, and biosorbents, large-scale continuous feed studies are needed to maximize the eco-friendly benefits of using these kinds of adsorbents. The nano-based adsorbents are considered great sorbent materials and are easy to regenerate but have some aggregation limits, affecting the adsorption rate.| Adsorbent | Limitations | Advantages | Ref. |
|---|---|---|---|
| AC | Cost demanding through the regeneration process | Great adsorption performance and economically attractive when extracted from waste materials | 21, 26, 44 and 56 |
| Agriculture, industrial waste adsorbents, natural materials, and biosorbents | Needs more investigations in large scale continuous feed operations | Eco-friendly, high surface area, relatively high adsorption capacities, and low or zero cost demanding | 7, 24 and 34 |
| CNTs | Relatively expensive | Large surface area, great adsorption capacity, and easy to be modified | 102, 237 and 238 |
| Graphene | Relatively expensive | Exceedingly large surface area, great adsorption capacity, and easy to be modified | 120, 223 and 239 |
| Zero valent nanoparticle | Aggregation limits the adsorption rate | Small particle size, great surface area, low cost, degradation, great adsorption capacity, and easy to regenerate | 209 and 218 |
| Oxide nanoparticle | Aggregation limits the adsorption rate | Small particle size, fairly high efficiency, low cost, easy to separate when using iron oxide particles, easy to regenerate | 229 and 240 |
5. Conclusions
This review has attempted to cover the common adsorption process operating conditions and an extensive range of non-conventional economic adsorbents to give an idea about the various types of low-cost sorbent materials used for dyes and metal ions removal from wastewater. Vitally significant characteristics for a satisfying adsorbent could be summarized as follow: (a) high porosity and great surface area can guarantee the availability of more adsorption sites, (b) great ion exchange ability, (c) abundant existing in nature and at enormous quantities, (d) possible to be of regenerated, (e) eco-friendly and (f) economic. ACs are commanding adsorbents that can powerfully eradicate several contaminants from polluted water; nevertheless, their limited utilization at large-scale applications due to high production costs and difficulty in regeneration. Numerous economic adsorbents have been reported to cover the need for low-cost and effective adsorbents that can eliminate dyes and metal ions from contaminated waters. For instance, agriculture, industrial waste materials, natural materials, and biomass absorbents. Numerous research studies extensively evaluate these sorbent materials; however, the large-scale application is still gapped. Nanotechnology is a novel way that emerged among the most efficient and economic adsorbents. However, it also needs to promote the application on a large scale to assess all technical, economic, and environmental aspects for use in wastewater treatment.Conflicts of interest
The authors declared no potential conflicts of interest concerning this article's research, authorship, and/or publication.References
- H. Islam, H. Abbasi, A. Karam, A. H. Chughtai and M. Ahmed Jiskani, Sci. Prog., 2021, 104 DOI:10.1177/00368504211026143
.
- A. K. Badawi, E. S. Bakhoum and K. Zaher, Arabian J. Sci. Eng., 2021, 1–16 Search PubMed
- W. W. Ngah and M. Hanafiah, Bioresour. Technol., 2008, 99, 3935–3948 CrossRef PubMed
- B. Priyadarshini, T. Patra and T. R. Sahoo, J. Magnesium Alloys, 2021, 9, 478–488 CrossRef CAS
- T. Tatarchuk, N. Paliychuk, R. B. Bitra, A. Shyichuk, M. Naushad, I. Mironyuk and D. Ziółkowska, Desalin. Water Treat., 2019, 150, 374–385 CrossRef CAS
- A. Dalvand, M. H. Ehrampoush, M. T. Ghaneian, M. Mokhtari, A. A. Ebrahimi, R. Malek Ahmadi and A. H. Mahvi, J. Environ. Health Sustainable Dev., 2017, 2, 333–339 CAS
- R. Chakraborty, A. Asthana, A. K. Singh, B. Jain and A. B. H. Susan, Int. J. Environ. Anal. Chem., 2020, 1–38 CrossRef
- S. Ayub, A. Siddique, M. Khursheed, A. Zarei, I. Alam, E. Asgari and F. Changani, Desalin. Water Treat., 2020, 179, 263–271 CrossRef CAS
- V. K. Gupta, P. J. M. Carrott, M. M. L. Ribeiro Carrott and Suhas, Crit. Rev. Environ. Sci. Technol., 2009, 39(10), 783–842 CrossRef
- L. N. Nthunya, L. Gutierrez, S. Derese, E. N. Nxumalo, A. R. Verliefde, B. B. Mamba and S. D. Mhlanga, J. Chem. Technol. Biotechnol., 2019, 94, 2757–2771 CrossRef CAS
- K. Rehman, F. Fatima, I. Waheed and M. S. H. Akash, J. Cell. Biochem., 2018, 119, 157–184 CrossRef CAS PubMed
- A. Jaiswal, A. Verma and P. Jaiswal, J. Environ. Pathol., Toxicol. Oncol., 2018, 37, 183–197 CrossRef PubMed
- J. O. Duruibe, M. O. C. Ogwuegbu and J. N. Egwurugwu, Int. J. Phys. Sci., 2007, 2, 112–118 Search PubMed
- L. N. Nthunya, M. L. Masheane, S. P. Malinga, E. N. Nxumalo, B. B. Mamba and S. D. Mhlanga, Phys. Chem. Earth, Parts A/B/C, 2017, 100, 94–100 CrossRef
- L. N. Nthunya, N. P. Khumalo, A. R. Verliefde, B. B. Mamba and S. D. Mhlanga, Phys. Chem. Earth, Parts A/B/C, 2019, 112, 228–236 CrossRef
- S. Mbakop, L. N. Nthunya and M. S. Onyango, Processes, 2021, 9, 611 CrossRef CAS
- A. R. Fernández-Alba, L. H. Guil, G. D. a. López and Y. Chisti, Anal. Chim. Acta, 2001, 426, 289–301 CrossRef
- A. Elawwad, A. Karam and K. Zaher, Pol. J. Environ. Stud., 2017, 26(4), 1493–1500 CrossRef CAS
- A. Karam, E. S. Bakhoum and K. Zaher, Int. J. Sustain. Eng., 2020, 1–13 CAS
- I. K. Kapdan and F. Kargi, Enzyme Microb. Technol., 2002, 30, 195–199 CrossRef CAS
- N. C. Corda and M. S. Kini, A Review on Adsorption of Cationic Dyes using Activated Carbon. MATEC Web of Conferences, 2018, 144, 02022 Search PubMed
- M. Fawzy, M. Nasr, A. M. Abdel-Rahman, G. Hosny and B. Raheem Odhafa, Int. J. Phytorem., 2019, 1–10 Search PubMed
- L. N. Nthunya, M. L. Masheane, M. George, M.-B. Kime and S. D. Mhlanga, J. Water Chem. Technol., 2019, 41, 81–86 CrossRef
- K. S. Bharathi and S. T. Ramesh, Appl. Water Sci., 2013, 3, 773–790 CrossRef
- Z. Cai, Y. Sun, W. Liu, F. Pan, P. Sun and J. Fu, Environ. Sci. Pollut. Res., 2017, 24, 15882–15904 CrossRef CAS PubMed
- M. A. Ahmad, N. Ahmad and O. S. Bello, Water, Air, Soil Pollut., 2014, 225, 2057 CrossRef
- E. GilPavas, I. Dobrosz-Gómez and M.-Á. Gómez-García, J. Electroanal. Chem., 2020, 878, 114578 CrossRef CAS
- N. A. M. Razali, W. N. W. Salleh, N. Rosman, N. H. Ismail, S. Z. N. Ahmad, F. Aziz, L. W. Jye and A. F. Ismail, Mater. Today: Proc., 2020, 42(1), 22–27 Search PubMed
- E. N. El Qada, S. J. Allen and G. M. Walker, Chem. Eng. J., 2006, 124, 103–110 CrossRef CAS
- M. Naushad, A. A. Alqadami, Z. A. AlOthman, I. H. Alsohaimi, M. S. Algamdi and A. M. Aldawsari, J. Mol. Liq., 2019, 293, 111442 CrossRef CAS
- M. A. M. Salleh, D. K. Mahmoud, W. A. W. A. Karim and A. Idris, Desalination, 2011, 280, 1–13 CrossRef CAS
- J. E. Aguiar, J. A. Cecilia, P. A. S. Tavares, D. C. S. Azevedo, E. R. Castellón, S. M. P. Lucena and I. J. Silva, Appl. Clay Sci., 2017, 135, 35–44 CrossRef CAS
- L. Boumehdi Toumi, L. Hamdi, Z. Salem and K. Allia, Desalin. Water Treat., 2015, 53, 806–817 CrossRef CAS
- B. H. Hameed, J. Hazard. Mater., 2009, 162, 939–944 CrossRef CAS PubMed
- B. H. Hameed, J. Hazard. Mater., 2009, 166, 233–238 CrossRef CAS PubMed
- F. A. Pavan, A. C. Mazzocato and Y. Gushikem, Bioresour. Technol., 2008, 99, 3162–3165 CrossRef CAS PubMed
- S. Shakoor and A. Nasar, J. Taiwan Inst. Chem. Eng., 2016, 66, 154–163 CrossRef CAS
- B. S. Inbaraj, C. P. Chiu, G. H. Ho, J. Yang and B. H. Chen, J. Hazard. Mater., 2006, 137, 226–234 CrossRef CAS PubMed
- M. El Haddad, R. Mamouni, N. Saffaj and S. Lazar, J. Assoc. Arab Univ. Basic Appl. Sci., 2012, 12, 48–54 CAS
- W. Zhan, C. Xu, G. Qian, G. Huang, X. Tang and B. Lin, RSC Adv., 2018, 8, 18723–18733 RSC
- H. Sadegh, G. A. M. Ali, S. Agarwal and V. K. Gupta, Int. J. Environ. Res., 2019, 13, 523–531 CrossRef CAS
- Q. Li, F. Yang, J. Zhang and C. Zhou, SN Appl. Sci., 2020, 2, 1–11 CAS
- R. Baby, B. Saifullah and M. Z. Hussein, Sci. Rep., 2019, 9, 1–11 CrossRef PubMed
- A. A. Ahmad and B. H. Hameed, J. Hazard. Mater., 2009, 172, 1538–1543 CrossRef CAS PubMed
- T. S. Anirudhan and S. S. Sreekumari, J. Environ. Sci., 2011, 23, 1989–1998 CrossRef CAS
- V. K. Gupta, J. Environ. Manage., 2009, 90, 2313–2342 CrossRef CAS PubMed
- C. R. Holkar, A. J. Jadhav, D. V. Pinjari, N. M. Mahamuni and A. B. Pandit, J. Environ. Manage., 2016, 182, 351–366 CrossRef CAS PubMed
- M. Rafatullah, O. Sulaiman, R. Hashim and A. Ahmad, J. Hazard. Mater., 2010, 177, 70–80 CrossRef CAS PubMed
- S. Agarwal, H. Sadegh, M. Majid, A. S. H. Makhlouf, G. A. M. Ali, A. O. H. Memar, R. Shahryari-ghoshekandi, I. Tyagi and V. K. Gupta, J. Mol. Liq., 2016, 218, 191–197 CrossRef CAS
- S. P. Lee, G. A. M. Ali, H. Algarni and K. F. Chong, J. Mol. Liq., 2019, 277, 175–180 CrossRef CAS
- A. B. Albadarin, M. N. Collins, M. Naushad, S. Shirazian, G. Walker and C. Mangwandi, Chem. Eng. J., 2017, 307, 264–272 CrossRef CAS
- B. H. Hameed and F. B. M. Daud, Chem. Eng. J., 2008, 139, 48–55 CrossRef CAS
- C. Djilani, R. Zaghdoudi, F. Djazi, B. Bouchekima, A. Lallam, A. Modarressi and M. Rogalski, J. Taiwan Inst. Chem. Eng., 2015, 53, 112–121 CrossRef CAS
- J. Zhang, Q. Zhou and L. Ou, J. Chem. Eng. Data, 2012, 57, 412–419 CrossRef CAS
- M. Khodaie, N. Ghasemi, B. Moradi and M. Rahimi, J. Chem., 2013, 2013, 383985 Search PubMed
- V. Gomez, M. S. Larrechi and M. P. Callao, Chemosphere, 2007, 69, 1151–1158 CrossRef CAS PubMed
- V. Lugo-Lugo, C. Barrera-Díaz, F. Ureña-Núñez, B. Bilyeu and I. Linares-Hernández, J. Environ. Manage., 2012, 112, 120–127 CrossRef CAS PubMed
- E. Oguz and B. Keskinler, Colloids Surf., A, 2005, 268, 124–130 CrossRef CAS
- B. Ramaraju, P. Manoj Kumar Reddy and C. Subrahmanyam, Environ. Prog. Sustainable Energy, 2014, 33, 38–46 CrossRef CAS
- M. T. Yagub, T. K. Sen and H. M. Ang, Water, Air, Soil Pollut., 2012, 223, 5267–5282 CrossRef CAS
- V. S. Mane and P. V. V. Babu, Desalination, 2011, 273, 321–329 CrossRef CAS
- B. K. Nandi, A. Goswami, A. K. Das, B. Mondal and M. K. Purkait, Sep. Sci. Technol., 2008, 43, 1382–1403 CrossRef CAS
- T. G. Venkatesha, R. Viswanatha, Y. A. Nayaka and B. K. Chethana, Chem. Eng. J., 2012, 198, 1–10 CrossRef
- V. K. Gupta, R. Chandra, I. Tyagi and M. Verma, J. Colloid Interface Sci., 2016, 478, 54–62 CrossRef CAS PubMed
- R. Hasanzadeh, P. N. Moghadam, N. Bahri-Laleh and M. Sillanpää, J. Colloid Interface Sci., 2017, 490, 727–746 CrossRef CAS PubMed
- T. Zeng, Y. Yu, Z. Li, J. Zuo, Z. Kuai, Y. Jin, Y. Wang, A. Wu and C. Peng, Mater. Chem. Phys., 2019, 231, 105–108 CrossRef CAS
- J. Gao, Y. He, X. Zhao, X. Ran, Y. Wu, Y. Su and J. Dai, J. Colloid Interface Sci., 2016, 481, 220–228 CrossRef CAS PubMed
- N. Kannan and M. M. Sundaram, Dyes Pigm., 2001, 51, 25–40 CrossRef CAS
- I. A. W. Tan, A. L. Ahmad and B. H. Hameed, Desalination, 2008, 225, 13–28 CrossRef CAS
- N. Thinakaran, P. Baskaralingam, M. Pulikesi, P. Panneerselvam and S. Sivanesan, J. Hazard. Mater., 2008, 151, 316–322 CrossRef CAS PubMed
- C. Namasivayam and D. Kavitha, Dyes Pigm., 2002, 54, 47–58 CrossRef CAS
- G. A. M. Ali, O. A. Habeeb, H. Algarni and K. F. Chong, J. Mater. Sci., 2018, 54, 683–692 CrossRef
- O. A. Habeeb, K. Ramesh, G. A. M. Ali and R. M. Yunus, J. Wuhan Univ. Technol., Mater. Sci. Ed., 2017, 32, 305–320 CrossRef
- O. A. Habeeb, K. Ramesh, G. A. M. Ali and R. M. Yunus, Desalin. Water Treat., 2017, 84, 205–214 CrossRef CAS
- M. H. El-Naas, S. Al-Zuhair and M. A. Alhaija, J. Hazard. Mater., 2010, 173, 750–757 CrossRef CAS PubMed
- M. J. Iqbal and M. N. Ashiq, J. Hazard. Mater., 2007, 139, 57–66 CrossRef CAS PubMed
- S. Babel and T. A. Kurniawan, J. Hazard. Mater., 2003, 97(1), 219–243 CrossRef CAS PubMed
- M. Uğurlu, A. Gürses and M. Açıkyıldız, Microporous Mesoporous Mater., 2008, 111, 228–235 CrossRef
- N. F. Cardoso, E. C. Lima, B. Royer, M. V. Bach, G. L. Dotto, L. A. A. Pinto and T. Calvete, J. Hazard. Mater., 2012, 241, 146–153 CrossRef PubMed
- M. K. Purkait, A. Maiti, S. Dasgupta and S. De, J. Hazard. Mater., 2007, 145, 287–295 CrossRef CAS PubMed
- M. C. Ribas, M. A. Adebayo, L. D. T. Prola, E. C. Lima, R. Cataluña, L. A. Feris, M. J. Puchana-Rosero, F. M. Machado, F. A. Pavan and T. Calvete, Chem. Eng. J., 2014, 248, 315–326 CrossRef CAS
- N. Kannan and T. Veemaraj, J. Chem., 2009, 6, 247–256 CAS
- S. Hydari, H. Sharififard, M. Nabavinia and M. Reza Parvizi, Chem. Eng. J., 2012, 193, 276–282 CrossRef
- S. Babel and T. A. Kurniawan, Chemosphere, 2004, 54, 951–967 CrossRef CAS PubMed
- A. F. Tajar, T. Kaghazchi and M. Soleimani, J. Hazard. Mater., 2009, 165, 1159–1164 CrossRef PubMed
- S. M. Abdelbasir and A. E. Shalan, Korean J. Chem. Eng., 2019, 36, 1209–1225 CrossRef CAS
- B. Makgabutlane, L. N. Nthunya, M. S. Maubane-Nkadimeng and S. D. Mhlanga, J. Environ. Chem. Eng., 2021, 9, 104736 CrossRef CAS
- S. M. Seyed Arabi, R. S. Lalehloo, M. R. T. B. Olyai, G. A. M. Ali and H. Sadegh, Phys. E Low-dimens. Syst. Nanostruct., 2019, 106, 150–155 CrossRef CAS
- B. Maazinejad, O. Mohammadnia, G. A. M. Ali, A. S. H. Makhlouf, M. N. Nadagouda, M. Sillanpää, A. M. Asiri, S. Agarwal, V. K. Gupta and H. Sadegh, J. Mol. Liq., 2020, 298, 112001 CrossRef CAS
- B. G. P. Singh, C. Baburao, V. Pispati, H. Pathipati, N. Muthy, S. R. V. Prassana and B. G. Rathode, Int. J. Res. Pharm. Chem., 2012, 2, 523–532 Search PubMed
- A. J. Clancy, E. R. White, H. H. Tay, H. C. Yau and M. S. P. Shaffer, Carbon, 2016, 108, 423–432 CrossRef CAS
- Y. Zhang, W. Zhou, H. Chen, G. Duan, H. Luo and Y. Li, Ceram. Int., 2021, 47, 10013–10018 CrossRef CAS
- J. Cao, Y. Lu, H. Chen, L. Zhang and C. Xiong, J. Biomater. Sci., Polym. Ed., 2018, 29, 428–447 CrossRef CAS PubMed
- S. Fu, X. Chen and P. Liu, Mater. Sci. Eng., A, 2020, 771, 138656 CrossRef CAS
- D. Zhang, L. Shi, J. Fang, X. Li and K. Dai, Mater. Lett., 2005, 59, 4044–4047 CrossRef CAS
- A. Pénicaud, F. Dragin, G. Pécastaings, M. He and E. Anglaret, Carbon, 2014, 67, 360–367 CrossRef
- T. Kuang, L. Chang, F. Chen, Y. Sheng, D. Fu and X. Peng, Carbon, 2016, 105, 305–313 CrossRef CAS
- C. Santhosh, V. Velmurugan, G. Jacob, S. K. Jeong, A. N. Grace and A. Bhatnagar, Chem. Eng. J., 2016, 306, 1116–1137 CrossRef CAS
- T. Madrakian, A. Afkhami, M. Ahmadi and H. Bagheri, J. Hazard. Mater., 2011, 196, 109–114 CrossRef CAS PubMed
- Y. Zeng, L. Zhao, W. Wu, G. Lu, F. Xu, Y. Tong, W. Liu and J. Du, J. Appl. Polym. Sci., 2013, 127, 2475–2482 CrossRef CAS
- M. L. Masheane, L. N. Nthunya, S. P. Malinga, E. N. Nxumalo and S. D. Mhlanga, Phys. Chem. Earth, Parts A/B/C, 2017, 100, 212–224 CrossRef
- M. A. Atieh, Procedia Environ. Sci., 2011, 4, 281–293 CrossRef CAS
- H. Wang, A. Zhou, F. Peng, H. Yu and J. Yang, J. Colloid Interface Sci., 2007, 316, 277–283 CrossRef CAS PubMed
- C. Chen, X. Feng and S. Yao, J. Cleaner Prod., 2021, 286, 124937 CrossRef CAS
- M. Ghaedi, S. Haghdoust, S. N. Kokhdan, A. Mihandoost, R. Sahraie and A. Daneshfar, Spectrosc. Lett., 2012, 45, 500–510 CrossRef CAS
- C.-H. Wu, J. Hazard. Mater., 2007, 144, 93–100 CrossRef CAS PubMed
- F. M. Machado, C. P. Bergmann, E. C. Lima, B. Royer, F. E. de Souza, I. M. Jauris, T. Calvete and S. B. Fagan, Phys. Chem. Chem. Phys., 2012, 14, 11139–11153 RSC
- H. J. Wang, A. L. Zhou, F. Peng, H. Yu and L. F. Chen, Mater. Sci. Eng., A, 2007, 466, 201–206 CrossRef
- C. Lu and C. Liu, J. Chem. Technol. Biotechnol., 2006, 81, 1932–1940 CrossRef CAS
- R. Q. Long and R. T. Yang, J. Am. Chem. Soc., 2001, 123, 2058–2059 CrossRef CAS PubMed
- Y.-H. Li, S. Wang, J. Wei, X. Zhang, C. Xu, Z. Luan, D. Wu and B. Wei, Chem. Phys. Lett., 2002, 357, 263–266 CrossRef CAS
- V. Dutta, P. Singh, P. Shandilya, S. Sharma, P. Raizada, A. K. Saini, V. K. Gupta, A. Hosseini-Bandegharaei, S. Agarwal and A. Rahmani-Sani, J. Environ. Chem. Eng., 2019, 7, 103132 CrossRef CAS
- K. C. Lai, L. Y. Lee, B. Y. Z. Hiew, S. Thangalazhy-Gopakumar and S. Gan, J. Environ. Sci., 2019, 79, 174–199 CrossRef PubMed
- O. Akhavan, Carbon, 2010, 48, 509–519 CrossRef CAS
- R. R. Jameel and L. H. Alwan, Eur. J. Mol. Clin. Med., 2020, 7, 412–421 Search PubMed
- R. Wijaya, G. Andersan, S. Permatasari Santoso and W. Irawaty, Sci. Rep., 2020, 10, 667 CrossRef CAS PubMed
- S. P. Lee, G. A. M. Ali, H. H. Hegazy, H. N. Lim and K. F. Chong, Energy Fuels, 2021, 35(5), 4559–4569 CrossRef CAS
- H. Qian, J. Wang and L. Yan, J. Bioresour. Bioprod., 2020, 5, 204–210 CrossRef CAS
- G. Zhao, J. Li, X. Ren, C. Chen and X. Wang, Environ. Sci. Technol., 2011, 45, 10454–10462 CrossRef CAS PubMed
- V. Chandra, J. Park, Y. Chun, J. W. Lee, I.-C. Hwang and K. S. Kim, ACS Nano, 2010, 4, 3979–3986 CrossRef CAS PubMed
- K. Zhang, H. Li, X. Xu and H. Yu, Microporous Mesoporous Mater., 2018, 255, 7–14 CrossRef CAS
- L. Chang, Y. Pu, P. Jing, Y. Cui, G. Zhang, S. Xu, B. Cao, J. Guo, F. Chen and C. Qiao, Appl. Surf. Sci., 2021, 541, 148400 CrossRef CAS
- O. A. Habeeb, K. Ramesh, G. A. M. Ali and R. M. Yunus, Malaysian J. Anal. Sci., 2017, 21, 334–345 CrossRef
- M. Khellouf, R. Chemini, Z. Salem, M. Khodja and D. Zeriri, Arabian J. Sci. Eng., 2019, 44, 10079–10086 CrossRef CAS
- P. K. Malik, Dyes Pigm., 2003, 56, 239–249 CrossRef CAS
- P. K. Malik, J. Hazard. Mater., 2004, 113, 81–88 CrossRef CAS PubMed
- J. M. Dias, M. C. M. Alvim-Ferraz, M. F. Almeida, J. Rivera-Utrilla and M. Sánchez-Polo, J. Environ. Manage., 2007, 85, 833–846 CrossRef CAS PubMed
- K. Kadirvelu, M. Kavipriya, C. Karthika, M. Radhika, N. Vennilamani and S. Pattabhi, Bioresour. Technol., 2003, 87, 129–132 CrossRef CAS PubMed
- M. Sánchez-Polo and J. Rivera-Utrilla, Environ. Sci. Technol., 2002, 36, 3850–3854 CrossRef PubMed
- R. Sivaraj, C. Namasivayam and K. Kadirvelu, Waste Manag., 2001, 21, 105–110 CrossRef CAS PubMed
- K. V. Kumar and A. Kumaran, Biochem. Eng. J., 2005, 27, 83–93 CrossRef CAS
- B. H. Hameed and A. A. Ahmad, J. Hazard. Mater., 2009, 164, 870–875 CrossRef CAS PubMed
- B. H. Hameed, R. R. Krishni and S. A. Sata, J. Hazard. Mater., 2009, 162, 305–311 CrossRef CAS PubMed
- R. Han, W. Zou, W. Yu, S. Cheng, Y. Wang and J. Shi, J. Hazard. Mater., 2007, 141, 156–162 CrossRef CAS PubMed
- M. Ş. Tanyildizi, Chem. Eng. J., 2011, 168, 1234–1240 CrossRef CAS
- M. S. Anantha, V. Jayanth, S. Olivera, D. Anarghya, K. Venkatesh, B. K. Jayanna, H. P. Sachin and H. B. Muralidhara, Environ. Nanotechnol. Monit. Manag., 2021, 15, 100447 Search PubMed
- O. A. Habeeb, K. Ramesh, G. A. M. Ali and R. M. Yunus, J. Teknol., 2017, 79, 1–10 Search PubMed
- O. A. Habeeb, K. Ramesh, G. A. M. Ali, R. M. Yunus and O. A. Olalere, IIUM Eng. J., 2017, 18, 13–25 CrossRef
- O. A. Habeeb, K. Ramesh, G. A. M. Ali and R. M. Yunus, J. Chem. Eng. Ind. Biotechnol., 2017, 1, 1–17 Search PubMed
- C. H. Weng, Y. T. Lin, Y. J. Chen and Y. C. Sharma, Color. Technol., 2013, 129, 298–304 CAS
- F. A. Batzias and D. K. Sidiras, J. Hazard. Mater., 2004, 114, 167–174 CrossRef CAS PubMed
- B. H. Hameed and M. I. El-Khaiary, J. Hazard. Mater., 2008, 154, 639–648 CrossRef CAS PubMed
- B. H. Hameed, J. Hazard. Mater., 2009, 162, 344–350 CrossRef CAS PubMed
- V. Ponnusami, S. Vikram and S. N. Srivastava, J. Hazard. Mater., 2008, 152, 276–286 CrossRef CAS PubMed
- B. H. Hameed, D. K. Mahmoud and A. L. Ahmad, Colloids Surf., A, 2008, 316, 78–84 CrossRef CAS
- Y. Bulut and H. Aydın, Desalination, 2006, 194, 259–267 CrossRef CAS
- F. D. Ardejani, K. Badii, N. Y. Limaee, S. Z. Shafaei and A. R. Mirhabibi, J. Hazard. Mater., 2008, 151, 730–737 CrossRef PubMed
- N. Babakhouya, S. Boughrara and F. Abad, Am. J. Environ. Sci., 2010, 6, 470–476 CrossRef CAS
- M. A. Abdullah and A. G. D. Prasad, Int. J. Chem. Eng. Res., 2009, 1, 51–62 Search PubMed
- P.-S. Ong, S.-T. Ong and Y.-T. Hung, Asian J. Chem., 2013, 25(11), 6141–6145 CrossRef CAS
- A. Witek-Krowiak, R. G. Szafran and S. Modelski, Desalination, 2011, 265, 126–134 CrossRef CAS
- H. Benaissa and M. A. Elouchdi, Chem. Eng. Process., 2007, 46, 614–622 CrossRef CAS
- S. Liang, X. Guo, N. Feng and Q. Tian, J. Hazard. Mater., 2009, 170, 425–429 CrossRef CAS PubMed
- N. Feng, X. Guo, S. Liang, Y. Zhu and J. Liu, J. Hazard. Mater., 2011, 185, 49–54 CrossRef CAS PubMed
- S. Wang, Y. Boyjoo, A. Choueib and Z. H. Zhu, Water Res., 2005, 39, 129–138 CrossRef CAS PubMed
- C. Zaharia and D. Suteu, Environ. Sci. Pollut. Res., 2013, 20, 2226–2235 CrossRef CAS PubMed
- S. Netpradit, P. Thiravetyan and S. Towprayoon, Water Res., 2003, 37, 763–772 CrossRef CAS PubMed
- T. A. Khan, S. A. Chaudhry and I. Ali, J. Mol. Liq., 2015, 202, 165–175 CrossRef CAS
- M. Shirzad-Siboni, S. J. Jafari, O. Giahi, I. Kim, S.-M. Lee and J.-K. Yang, J. Ind. Eng. Chem., 2014, 20, 1432–1437 CrossRef CAS
- W. Huang, S. Wang, Z. Zhu, L. Li, X. Yao, V. Rudolph and F. Haghseresht, J. Hazard. Mater., 2008, 158, 35–42 CrossRef CAS PubMed
- H. Nadaroglu, E. Kalkan and N. Demir, Desalination, 2010, 251, 90–95 CrossRef CAS
- A. Papandreou, C. J. Stournaras and D. Panias, J. Hazard. Mater., 2007, 148, 538–547 CrossRef CAS PubMed
- P. Wu, Y. Tang and Z. Cai, RSC Adv., 2018, 8, 8805–8812 RSC
- S. Madan, R. Shaw, S. Tiwari and S. K. Tiwari, Appl. Surf. Sci., 2019, 487, 907–917 CrossRef CAS
- G. Crini, Bioresour. Technol., 2006, 97, 1061–1085 CrossRef CAS PubMed
- A. G. Espantaleon, J. A. Nieto, M. Fernandez and A. Marsal, Appl. Clay Sci., 2003, 24, 105–110 CrossRef CAS
- S. Guiza, M. Bagane, A. H. Al-Soudani and H. B. Amore, Adsorpt. Sci. Technol., 2004, 22(3), 245–255 CrossRef CAS
- G. Atun, G. Hisarli, W. S. Sheldrick and M. Muhler, J. Colloid Interface Sci., 2003, 261, 32–39 CrossRef CAS PubMed
- A. T. Sdiri, T. Higashi and F. Jamoussi, Int. J. Environ. Sci. Technol., 2014, 11, 1081–1092 CrossRef CAS
- X. Zhang, Z. Song, Y. Dou, Y. Xue, Y. Ji, Y. Tang and M. Hu, Colloids Surf., A, 2021, 621, 126583 CrossRef CAS
- M. Özacar and İ. A. Şengil, J. Hazard. Mater., 2003, 98, 211–224 CrossRef
- V. Meshko, L. Markovska, M. Mincheva and A. E. Rodrigues, Water Res., 2001, 35, 3357–3366 CrossRef CAS PubMed
- S. Guiza, M. Bagane, A. H. Al-Soudani and H. B. Amore, Adsorpt. Sci. Technol., 2004, 22, 245–255 CrossRef CAS
- E. Erdem, N. Karapinar and R. Donat, J. Colloid Interface Sci., 2004, 280, 309–314 CrossRef CAS PubMed
- U. Farooq, J. A. Kozinski, M. A. Khan and M. Athar, Bioresour. Technol., 2010, 101, 5043–5053 CrossRef CAS PubMed
- A. Srinivasan and T. Viraraghavan, J. Environ. Manage., 2010, 91, 1915–1929 CrossRef CAS PubMed
- Y. Fu and T. Viraraghavan, Bioresour. Technol., 2001, 79, 251–262 CrossRef CAS PubMed
- Y. Fu and T. Viraraghavan, Adv. Environ. Res., 2002, 7, 239–247 CrossRef CAS
- Y. Fu and T. Viraraghavan, Bioresour. Technol., 2002, 82, 139–145 CrossRef CAS PubMed
- Y. Z. Fu and T. Viraraghavan, AATCC Rev., 2001, 1, 36–40 CAS
- Z. Aksu and S. Tezer, Process Biochem., 2000, 36, 431–439 CrossRef CAS
- P. Waranusantigul, P. Pokethitiyook, M. Kruatrachue and E. S. Upatham, Environ. Pollut., 2003, 125, 385–392 CrossRef CAS PubMed
- Y. C. Wong, Y. S. Szeto, W. Cheung and G. McKay, Process Biochem., 2004, 39, 695–704 CrossRef
- L. N. Nthunya, M. L. Masheane, S. P. Malinga, E. N. Nxumalo and S. D. Mhlanga, Water SA, 2018, 44, 377–386 CrossRef CAS
- B. Li, Q. Zhang, Y. Pan, Y. Li, Z. Huang, M. Li and H. Xiao, Int. J. Biol. Macromol., 2020, 163, 309–316 CrossRef CAS PubMed
- X. Li, J. Zhang, H. Xie, Y. Pan, J. Liu, Z. Huang, X. Long and H. Xiao, Environ. Sci. Pollut. Res., 2020, 27, 33234–33247 CrossRef CAS PubMed
- S. Chen, S. Jiang and H. Jiang, J. Bioresour. Bioprod., 2020, 5, 238–247 CrossRef CAS
- Y. Li, H. Xiao, Y. Pan and L. Wang, ACS Sustainable Chem. Eng., 2018, 6, 6994–7002 CrossRef CAS
- A. El Sikaily, A. Khaled, A. E. Nemr and O. Abdelwahab, Chem. Ecol., 2006, 22, 149–157 CrossRef CAS
- D. Caparkaya and L. Cavas, Acta Chim. Slov., 2008, 55, 547–553 CAS
- A. Y. Dursun, G. Uslu, Y. Cuci and Z. Aksu, Process Biochem., 2003, 38, 1647–1651 CrossRef CAS
- A. Öztürk, J. Hazard. Mater., 2007, 147, 518–523 CrossRef PubMed
- C. R. Marcelo, G. A. Puiatti, M. A. Nascimento, A. F. Oliveira and R. P. Lopes, J. Nanomater., 2018, 2018, 4642038 Search PubMed
- A. Ebrahiminezhad, S. Taghizadeh, Y. Ghasemi and A. Berenjian, Sci. Total Environ., 2018, 621, 1527–1532 CrossRef CAS PubMed
- D. T. C. Nguyen, H. H. Dang, D.-V. N. Vo, L. G. Bach, T. D. Nguyen and T. V. Tran, J. Hazard. Mater., 2021, 404, 124146 CrossRef CAS PubMed
- N. Cao, X. Zhao, M. Gao, Z. Li, X. Ding, C. Li, K. Liu, X. Du, W. Li, J. Feng, Y. Ren and T. Wei, Sep. Purif. Technol., 2021, 275, 119236 CrossRef CAS
- A. Fouda, S. E.-D. Hassan, E. Saied and M. F. Hamza, J. Environ. Chem. Eng., 2021, 9, 105346 CrossRef CAS
- K. Latha and S. A. Selvi, Int. J. Adv. Sci. Eng. Res., 2020, 293–304 Search PubMed
- B. Pant, N. A. M. Barakat, H. R. Pant, M. Park, P. S. Saud, J.-W. Kim and H.-Y. Kim, J. Colloid Interface Sci., 2014, 434, 159–166 CrossRef CAS PubMed
- J. Kaur and M. Kaur, Ceram. Int., 2019, 45, 8646–8659 CrossRef CAS
- S. Sharafinia, A. Farrokhnia and E. Ghasemian, Phys. Chem. Res., 2021, 9, 605–621 Search PubMed
- N. Singh, S. Kumari, N. Goyal and S. Khan, Environ. Nanotechnol. Monit. Manag., 2021, 15, 100444 Search PubMed
- M. Batool, S. Khurshid, Z. Qureshi and W. M. Daoush, Chem. Pap., 2021, 75, 893–907 CrossRef CAS
- M. Abd Elkodous, G. S. El-Sayyad, M. I. A. Abdel Maksoud, R. Kumar, K. Maegawa, G. Kawamura, W. K. Tan and A. Matsuda, J. Hazard. Mater., 2020, 124657 Search PubMed
- J. Yang, B. Hou, J. Wang, B. Tian, J. Bi, N. Wang, X. Li and X. Huang, Nanomaterials, 2019, 9, 424 CrossRef CAS PubMed
- L.-n. Shi, Y.-M. Lin, X. Zhang and Z.-l. Chen, Chem. Eng. J., 2011, 171, 612–617 CrossRef CAS
- S. Li, W. Wang, F. Liang and W.-x. Zhang, J. Hazard. Mater., 2017, 322, 163–171 CrossRef CAS PubMed
- S. Arabi and M. R. Sohrabi, Water Sci. Technol., 2014, 70, 24–31 CrossRef CAS PubMed
- M. Barreto-Rodrigues, J. Silveira, J. A. Zazo and J. J. Rodriguez, J. Environ. Chem. Eng., 2017, 5, 628–634 CrossRef CAS
- A. K. Badawi and K. Zaher, J. Water Process. Eng., 2021, 40, 101963 CrossRef
- P. V. Nidheesh, J. Khatri, T. S. A. Singh, R. Gandhimathi and S. T. Ramesh, Chemosphere, 2018, 200, 621–631 CrossRef CAS PubMed
- S. Yang, D. Zheng, T. Ren, Y. Zhang and J. Xin, Water Res., 2017, 123, 704–714 CrossRef CAS PubMed
- A. Wang, W. Guo, F. Hao, X. Yue and Y. Leng, Ultrason. Sonochem., 2014, 21, 572–575 CrossRef CAS PubMed
- F. Fu, W. Han, Z. Cheng and B. Tang, Desalin. Water Treat., 2016, 57, 5592–5600 CrossRef CAS
- J. Khatri, P. V. Nidheesh, T. S. A. Singh and M. S. Kumar, Chem. Eng. J., 2018, 348, 67–73 CrossRef CAS
- P. V. F. de Sousa, A. F. de Oliveira, A. A. da Silva, B. G. Vaz and R. P. Lopes, Chem. Pap., 2019, 73, 249–260 CrossRef
- X. Ma, Y. Cheng, Y. Ge, H. Wu, Q. Li, N. Gao and J. Deng, Ultrason. Sonochem., 2018, 40, 763–772 CrossRef CAS PubMed
- T. A. Belay, F. M. Lin, C. Y. Lin, H. M. Hsiao, M. F. Chang and J. C. Liu, Water Sci. Technol., 2015, 72, 960–965 CrossRef CAS PubMed
- R. Lucchetti, L. Onotri, L. Clarizia, F. Di Natale, I. Di Somma, R. Andreozzi and R. Marotta, Appl. Catal., B, 2017, 202, 539–549 CrossRef CAS
- F. Z. Yehia, G. Eshaq, A. M. Rabie, A. H. Mady and A. E. ElMetwally, Desalin. Water Treat., 2016, 57, 2104–2112 CrossRef CAS
- F. Ghanbari, M. Moradi and M. Manshouri, J. Environ. Chem. Eng., 2014, 2, 1846–1851 CrossRef CAS
- A. Moezzi, A. M. McDonagh and M. B. Cortie, Chem. Eng. J., 2012, 185, 1–22 CrossRef
- X. Liu, R. Ma, X. Wang, Y. Ma, Y. Yang, L. Zhuang, S. Zhang, R. Jehan, J. Chen and X. Wang, Environ. Pollut., 2019, 252, 62–73 CrossRef CAS PubMed
- T. Wang, W. Liu, L. Xiong, N. Xu and J. Ni, Chem. Eng. J., 2013, 215, 366–374 CrossRef
- J. Hu, Z. Song, L. Chen, H. Yang, J. Li and R. Richards, J. Chem. Eng. Data, 2010, 55, 3742–3748 CrossRef CAS
- G. A. Seisenbaeva, G. Daniel, J.-M. Nedelec, Y. K. Gunko and V. G. Kessler, J. Mater. Chem., 2012, 22, 20374–20380 RSC
- S. Mahdavi, M. Jalali and A. Afkhami, Chem. Eng. Commun., 2013, 200, 448–470 CrossRef CAS
- X. Wang, K. Huang, Y. Chen, J. Liu, S. Chen, J. Cao, S. Mei, Y. Zhou and T. Jing, J. Hazard. Mater., 2018, 350, 46–54 CrossRef CAS PubMed
- T. Sheela, Y. A. Nayaka, R. Viswanatha, S. Basavanna and T. G. Venkatesha, Powder Technol., 2012, 217, 163–170 CrossRef CAS
- L. Ge, W. Wang, Z. Peng, F. Tan, X. Wang, J. Chen and X. Qiao, Powder Technol., 2018, 326, 393–401 CrossRef CAS
- K. Zhang, H. Li, X. Xu and H. Yu, Microporous Mesoporous Mater., 2018, 255, 7–14 CrossRef CAS
- H. H. Abdel Ghafar, G. A. M. Ali, O. A. Fouad and S. A. Makhlouf, Desalin. Water Treat., 2015, 53, 2980–2989 CrossRef CAS
- E.-J. Kim, C.-S. Lee, Y.-Y. Chang and Y.-S. Chang, ACS Appl. Mater. Interfaces, 2013, 5, 9628–9634 CrossRef CAS PubMed
- H. Sadegh, G. A. M. Ali, A. S. H. Makhlouf, K. F. Chong, N. S. Alharbi, S. Agarwal and V. K. Gupta, J. Mol. Liq., 2018, 258, 345–353 CrossRef CAS
- R. A. Gopal, M. Song, D. Yang, T. Lkhagvaa, S. Chandrasekaran and D. Choi, Environ. Pollut., 2020, 267, 115498 CrossRef CAS PubMed
- M. Abd Elkodous, A. Hassaan, A. Ghoneim and Z. Abdeen, Characterization and Application of Nanomaterials, 2018, vol. 1 Search PubMed
- J. Ma, F. Yu, L. Zhou, L. Jin, M. Yang, J. Luan, Y. Tang, H. Fan, Z. Yuan and J. Chen, ACS Appl. Mater. Interfaces, 2012, 4, 5749–5760 CrossRef CAS PubMed
- S. M. Bachilo, M. S. Strano, C. Kittrell, R. H. Hauge, R. E. Smalley and R. B. Weisman, Science, 2002, 298, 2361–2366 CrossRef CAS PubMed
- J. Zhao, Z. Wang, J. C. White and B. Xing, Environ. Sci. Technol., 2014, 48, 9995–10009 CrossRef CAS PubMed
- H. R. Mahmoud, S. A. El-Molla and M. Saif, Powder Technol., 2013, 249, 225–233 CrossRef CAS
| This journal is © The Royal Society of Chemistry 2021 |