 Open Access Article
Investigation of apoptosis based on fluorescence lifetime imaging microscopy with a mitochondria-targeted viscosity probe†
Gengjin Zou‡
,
Wenhui Yu‡,
Yunjian Xu,
Yanping Li,
Rui Hu,
Junle Qu and
Liwei Liu
 *
*
Key Laboratory of Optoelectronic Devices and Systems of Guangdong Province, Ministry of Education, College of Physics and Optoelectronic Engineering, Shenzhen University, China. E-mail: liulw@szu.edu.cn
First published on 2nd December 2021
Abstract
Cell apoptosis detection based on the functionality changes of cellular organelles, such as mitochondria, offers a quantitative method compared to morphology-based detection. However, the conventional detection methods for potential variation of the mitochondrial membrane based on fluorescence spectrum changes cannot offer a precise quantification of the degree of apoptosis. Here, a mitochondria-targeted two-photon viscosity probe (TPA-Mit), which sensitively responds to viscosity variations with fluorescence lifetime changes, is designed to detect the viscosity of mitochondria. Noteworthily, the proposed phasor fluorescence lifetime imaging microscopy (phasor-FLIM) allows for more precise quantification (in terms of smaller uncertainty) when estimating the degree of apoptosis with a microviscosity probe. The experimental results of SKOV-3 cells show that the fluorescence lifetime of mitochondria-targeted TPA-Mit increased from 550 ps to 800 ps after 24 hours of paclitaxel (PTX)-induced apoptosis. We believe that our method provides a new means for the measurement of cellular microviscosity and apoptosis monitoring at early stages.
1. Introduction
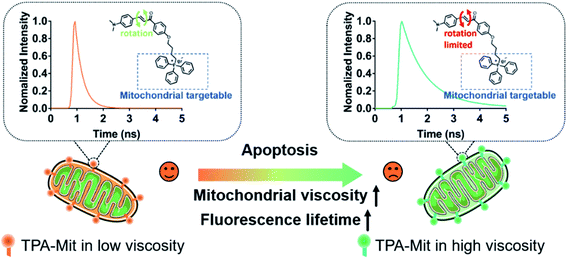
Cell apoptosis, or programmed cell death, is a built-in defense mechanism that plays an important role in the normal development and disease resistance of organisms. Abnormal apoptotic processes and pathways can cause a variety of diseases, including cancers.1,2 Since the apoptosis of tumor cells is an important indicator for evaluation of tumor therapy, apoptosis detection methods are of great significance for the treatment of tumors. Methods of apoptosis detection based on cellular morphology, such as transmission electron microscopy (TEM),3 are regarded as the gold standard in determining cell apoptosis; however, it is difficult to use these methods to quantify the number of cells under apoptosis and/or the early phase of apoptosis. Among the many approaches, mitochondrial functionality examination can offer accurate and sensitive detection at the early stage of cell apoptosis because it always accompanies abnormal mitochondrial function. Mitochondria play an important role in maintaining many physiological functions of individual organisms.4,5 The mitochondrial matrix surrounded by the inner mitochondrial membrane contains high-density enzymes and other proteins. When cells are inactivated or mitochondrial dysfunction occurs, the permeability of the mitochondrial inner membrane increases, leading to a decrease of the mitochondrial membrane potential Δψm.2,6–9 However, the most adopted membrane potential probe, JC-1, can only qualitatively determine the presence/absence of membrane potential. In some literature reports,10,11 the ratio between the green fluorescence (indicating low Δψm) and red fluorescence (indicating high Δψm) has been adopted as a measure of the membrane potential. However, the relation between the ratio and Δψm is not necessarily linear. On the other hand, decreasing membrane potential directly results in abnormal mitochondrial matrix viscosity.2 Therefore, it is of great significance to establish a reasonable monitoring method for the local microviscosity of mitochondria in order to establish a quantified model for cell viability monitoring.12–14 Cell viscosity is one of the main parameters that can affect the interaction of biomolecules, the transmission of chemical signals, and the diffusion of active metabolites within living cells.15–17 Abnormal changes in viscosity are closely related to cell functions and are the cause of various body dysfunctions.18–21 Different subcellular structures have different viscosities, and imaging for detecting the viscosity of single cells has always been an important but challenging area.To date, most molecular viscosity probes for sensing microscopic changes in cellular viscosity have functioned with single-photon excitation;14,22–32 the shallow penetration depth and relatively high photobleaching resulting from the short wavelength limit their application. Two-photon (TP) fluorescent probes with longer excitation wavelengths in the near-infrared range show natural advantages of removing the background fluorescence interference and impairing the phototoxicity induced by the exciting light. Therefore, with the above considerations, it is of significance to devise a new TP fluorescence probe for monitoring intracellular viscosity with mitochondrial targeting capabilities. In the present work, we rationally designed and synthesized an effective mitochondria-targeted TP fluorescence probe via molecular rotor theory. As can be seen from the following sections, the synthesized TPA-Mit responds to viscosity changes with not only varying fluorescence intensities, but also varying fluorescence lifetimes. Indeed, the fluorescence lifetime is extremely sensitive to the microenvironmental factors in which the molecules are located. Fluorescence lifetime imaging microscopy (FLIM) has become an important method in biomedical research with unique advantages.29–37 TP fluorescent molecules can inherently resist photobleaching, out-of-focus fluorescence, uneven illumination and scattered light from samples. The scheme of apoptosis detection based on the fluorescence lifetime variation of mitochondria-targeting TPA-Mit is shown in Fig. 1. Two functional groups, responsible for mitochondrial targeting and TP fluorescence, respectively, are assembled in the probe. When the cells labeled by TPA-Mit enter apoptosis, the microviscosity change of the mitochondria causes a responding fluorescence lifetime change of the probe. Thus, by analyzing the fluorescence lifetime of TPA-Mit, precise monitoring of the mitochondrial viscosity can be realized.
The paper is organized as follows: in the Materials and methods section, the related experiment details, including the TPA-Mit synthesis, cell preparation and phasor-FLIM, are presented. In the Results and discussion section, we firstly present the characteristics of our synthesized TPA-Mit as a viscosity probe. With the verification of viscosity sensitivity, we then apply TPA-Mit in cells to monitor the viscosity of the microenvironment around the mitochondria, with the help of the phasor-FLIM. Finally, we present the experimental results of using TPA-Mit to monitor cell apoptosis, showing the possibility of using TPA-Mit as a cell viability indicator.
2. Materials and methods
2.1 Design and synthesis of TPA-Mit
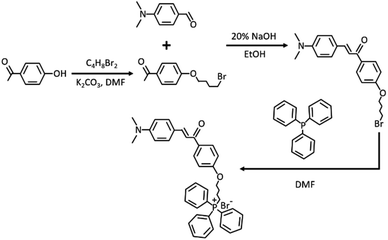
Ethenyl has been widely used as a typical viscosity-responsive functional group for developing fluorescent viscosity probes. Especially, when functional groups with a strong electron donating ability are included, the obtained skeleton showcases enormous potential to develop two-photon fluorophores. With the above consideration, xylene linked with ethenyl via the Clemson reaction served as a two-photon fluorophore. For mitochondrial targeting performance, triphenyl phosphine salt as a typical functional group was further included. The synthesis path of TPA-Mit is shown in Fig. 2.![[thin space (1/6-em)]](https://www.rsc.org/images/entities/char_2009.gif) :
:![[thin space (1/6-em)]](https://www.rsc.org/images/entities/char_2009.gif) EA = 20
EA = 20![[thin space (1/6-em)]](https://www.rsc.org/images/entities/char_2009.gif) :
:![[thin space (1/6-em)]](https://www.rsc.org/images/entities/char_2009.gif) 1). 1H NMR (400 MHz, CDCl3) δ (ppm) = 7.95 (d, J = 8.4 Hz, 2H), 7.75 (d, J = 15.2 Hz, 1H), 7.58 (d, J = 8.4 Hz, 2H), 7.45 (d, J = 15.6 Hz, 1H), 6.91 (d, J = 8.4 Hz, 2H), 6.59 (d, J = 8.4 Hz, 2H), 4.31 (s, 1H), 3.83 (s, 3H), 3.22 (q, J = 6.8 Hz, 2H), 1.26 (t, J = 7.2 Hz, 3H).
1). 1H NMR (400 MHz, CDCl3) δ (ppm) = 7.95 (d, J = 8.4 Hz, 2H), 7.75 (d, J = 15.2 Hz, 1H), 7.58 (d, J = 8.4 Hz, 2H), 7.45 (d, J = 15.6 Hz, 1H), 6.91 (d, J = 8.4 Hz, 2H), 6.59 (d, J = 8.4 Hz, 2H), 4.31 (s, 1H), 3.83 (s, 3H), 3.22 (q, J = 6.8 Hz, 2H), 1.26 (t, J = 7.2 Hz, 3H).![[thin space (1/6-em)]](https://www.rsc.org/images/entities/char_2009.gif) :
:![[thin space (1/6-em)]](https://www.rsc.org/images/entities/char_2009.gif) methyl alcohol = 10
methyl alcohol = 10![[thin space (1/6-em)]](https://www.rsc.org/images/entities/char_2009.gif) :
:![[thin space (1/6-em)]](https://www.rsc.org/images/entities/char_2009.gif) 1).
1).2.2 Reagents and drugs
The mitochondrial tracker for the co-localization test, MitoTracker Green FM (Mito-G), was purchased from Thermo Fisher Scientific. The mitochondrial membrane potential probe, JC-1, as well as the protein transport inhibitor, glycerol, were purchased from XLreagent (China). CCK-8 was purchased from Abbkine (US). Paclitaxel (PTX) was purchased from Tokyo Chemical Industry.2.3 Cell culture
All the cells used in the present work were SKOV-3 human ovarian cancer cells (ATCC, Manassas, U.S.A.). The cells were cultured in Dulbecco's modified Eagle's medium (DMEM) supplemented with 10% fetal bovine serum (FBS) and 1% antibiotic-antimycotic solution (Gibco, Invitrogen, US) at 37 °C in a humidified 5% CO2 incubator. Before fluorescence imaging, the cells were isolated at the exponential growth phase with trypsin solution (1% poly-vinyl pyrrolidone, 0.2% EGTA and 0.25% trypsin containing 0.02% EDTA) at 37 °C for three minutes. After washing with phosphate buffer saline (PBS), the SKOV-3 cells were seeded in 35 mm glass Petri dishes with 3 × 10⁴ cells for the subsequent experiments.2.4. Co-localization study of mitochondria and the TPA-Mit probe
The SKOV-3 cells were seeded in glass Petri dishes for 12 hours until the cell density reached 70–80% for fluorescence imaging. Before imaging, the cells were stained with 0.2 μM TPA-Mit and 2 μM Mito-G for 20 minutes and were then washed with PBS three times. Here, single-photon instead of TP fluorescence imaging was adopted for co-localization for better performance of the Mito-G probe. The fluorescence images were obtained with a confocal laser scanning microscope (A1RMP, Nikon, Japan) with an oil-immersion 60× objective (NA = 1.4, Nikon, Japan). The samples were excited at 488 nm, and the single-photon fluorescence was collected at 525/50 nm for the Mito-G and at 595/50 nm for our synthesized TPA-Mit. The co-localization between the two probes was then estimated by the Pearson coefficient between the captured images; this was accomplished by the Nis-element AR software that came with the confocal microscope.2.5 TP fluorescence microscopy and FLIM
For the TP fluorescence microscopy and FLIM, SKOV-3 cells were prepared by a method similar to that in the single-photon fluorescence imaging described above. The TP fluorescence images were captured using a commercial TP laser scanning microscope described in our previous work.38,39 Specifically, a femtosecond pulsed laser (Chameleon Discovery, Coherent) with a pulse width of 100 fs and repetition frequency of 80 MHz was applied as the excitation laser source. The wavelength was selected to be 840 nm for the TP excitation, and the TP fluorescence was collected at the 580/50 nm channel. A high-speed time-resolved photomultiplier tube (HPM-100-40, Becker & Hickl GmbH, Germany) transformed the photons to electronic signals, and a time-correlated single photon counting (TCSPC) module (SPC-150/DCC-100, Becker & Hickl GmbH, Germany) was connected synchronously to realize FLIM imaging. The system uses a resonant scanning head (A1RMP Nikon, Japan) for high-speed and high-resolution scanning. In the experiment, an oil-immersion 60× objective (NA = 1.4, Nikon, Japan) was used, and 512 × 512-pixel images were obtained.The fluorescence lifetime information of the samples was obtained by performing exponential curve fitting on the fluorescence lifetime data of each pixel in the acquired image. Here, a double exponential function was applied for the fluorescence data:
I(t) = I0(α1![[thin space (1/6-em)]](https://www.rsc.org/images/entities/char_2009.gif) e−t/τ1 + α2 e−t/τ1 + α2![[thin space (1/6-em)]](https://www.rsc.org/images/entities/char_2009.gif) e−t/τ2), e−t/τ2),
| (1) |
| τm = (α1τ1 + α2τ2)/(α1 + α2). | (2) |
The software SPCImage (Becker & Hickl, Germany) was applied for fitting the fluorescence decay curves and for calculating the lifetimes. The pseudo-color lifetime images were generated by assigning a value of the mean lifetime τm to a color at each pixel, and they were weighted by the pixel intensity.35
2.6 Phasor approach to FLIM data analysis
The phasor approach was used to filter out the fluorescence lifetime of the mitochondria-targeted TPA-Mit. For the phasor-FLIM, the fluorescence decay curve of each pixel was converted into Fourier space. The phasor of the Fourier component corresponding to the excitation repetition rate (i.e., 80 MHz in our case) was mapped into a phasor diagram, in which the x and y components in Cartesian coordinates are given by:41
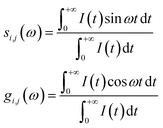 | (3) |
Hence, the position of each phasor is directly related to the lifetime. More importantly, similar fluorescence decays are easily recognized, and the points in the image where they originate can be painted using color cursors. In this way, all possible single-exponential lifetimes are mapped into a universal circle with a radius of 1/2, in which the point (1, 0) corresponds to τ = 0 and the point (0, 0) corresponds to τ = ∞. The phasors that deviate from the universal circle can be readily decomposed into two phasors lying on the universal circle by vector algebra with given weighting coefficients. In this way, any cluster of the phasors in the phasor diagram corresponds to a given type of decay and can be selected out to identify the corresponding pixel locations in the FLIM image. The cluster assignment can not only distinguish between different similar fluorescence lifetime values, but can also distinguish the spatial distribution and positioning in the image. In our experiment, as can be seen in the following sections, the phasor-FLIM analysis allows us to isolate the pixels corresponding to mitochondria-targeted TPA-Mit from the background autofluorescence, which results in a more precise quantification of the desired fluorescence lifetime.
2.7. Cell apoptosis preparation
In this experiment, the SKOV-3 cells were treated with PTX for 0 h to 24 h to induce apoptosis and with a series of concentrations from 0 to 10 μM. The cells then were incubated with 1 μM JC-1 working solution at 37 °C for 20 minutes, and then the unloaded JC-1 staining buffer was removed by washing three times with PBS. The MMP dye JC-1 was used to evaluate the effect of PTX on cellular apoptosis, since MMP variation always accompanies cellular apoptosis. When the MMP is high, the polymer form of JC-1 aggregates into the matrix of the mitochondria (J-aggregates), resulting in red fluorescence. When the MMP is low, JC-1 cannot accumulate in the matrix of the mitochondria and exists as a monomer, resulting in green fluorescence. The ratio between the green and the red fluorescence intensity was used to evaluate the mitochondrial membrane potential change induced by cell apoptosis.2.8. Statistical analyses
All statistical analyses were performed using GraphPad Prism 7.0 (GraphPad, La Jolla, CA, USA). Each experimental condition was performed in 10 samples and repeated at least once. Data were reported as mean ± standard deviation and analyzed using t tests (and nonparametric tests). We denote different P-values as *P < 0.05, **P < 0.01, ***P < 0.001 and ****P < 0.0001. In general, P < 0.05 was considered to indicate a statistically significant difference.3. Results and discussion
3.1 TPA-Mit characterization
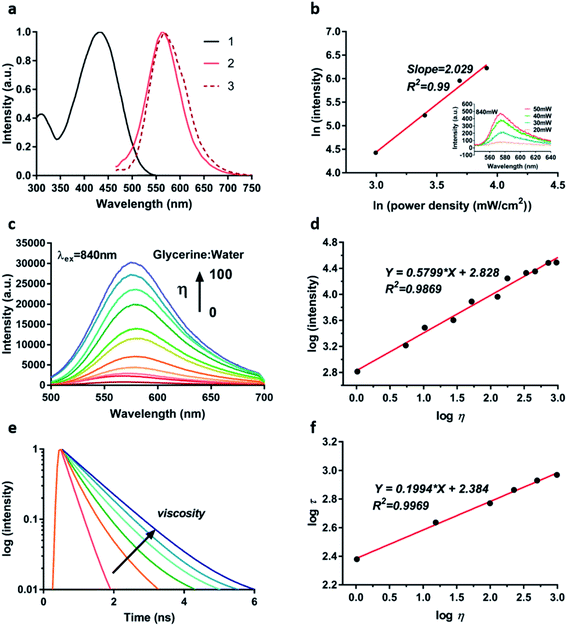
With the synthesized TPA-Mit in hand, we first measured its optical properties. Fig. 3a shows the spectra of absorption, single-photon fluorescence emission and TP fluorescence emission of TPA-Mit dissolved in PBS. It shows that the single-photon and the TP emission spectra of TPA-Mit were similar. The TP absorptivity of a femtosecond laser with different central wavelengths (Fig. S1†) of TPA-Mit was tested in order to determine the best excitation wavelength for TP imaging, which is 840 nm. We measured the fluorescence intensities corresponding to different incident intensities to calculate the number of photons involved in the fluorescence of TPA-Mit at 840 nm by:
ln![[thin space (1/6-em)]](https://www.rsc.org/images/entities/char_2009.gif) Iem = B + n Iem = B + n![[thin space (1/6-em)]](https://www.rsc.org/images/entities/char_2009.gif) ln ln![[thin space (1/6-em)]](https://www.rsc.org/images/entities/char_2009.gif) Iex, Iex,
| (4) |
![[thin space (1/6-em)]](https://www.rsc.org/images/entities/char_2009.gif) Iem and ln
Iem and ln![[thin space (1/6-em)]](https://www.rsc.org/images/entities/char_2009.gif) Iex, present a good linear relationship with a slope n = 2 (R2 = 0.99). The figure shows that TPA-Mit undergoes two-photon absorption when excited at 840 nm, and the inset shows the emission of TPA-Mit with increasing excitation power.
Iex, present a good linear relationship with a slope n = 2 (R2 = 0.99). The figure shows that TPA-Mit undergoes two-photon absorption when excited at 840 nm, and the inset shows the emission of TPA-Mit with increasing excitation power.
Next, in order to verify the effectiveness of TPA-Mit as a viscosity probe, we tested the fluorescence intensity response of TPA-Mit under different viscosities (water/glycerol system, Table S1†). The fluorescence emission spectra and normalised spectra of TPA-Mit under different solvent viscosities were tested. As shown in Fig. 3c and S2,† TPA-Mit has the weakest fluorescence in pure water (glycerine![[thin space (1/6-em)]](https://www.rsc.org/images/entities/char_2009.gif) :
:![[thin space (1/6-em)]](https://www.rsc.org/images/entities/char_2009.gif) water = 0). As the volume ratio of glycerine to water increases, the viscosity of the solvent in which TPA-Mit is located increases from 1.03 cP to about 950 cP (99% glycerol), and the emission intensity of TPA-Mit increases significantly with the increase of the solvent viscosity. The emission intensity and solvent viscosity of TPA-Mit can be correlated with the Forster–Hoffmann equation as:42,43
water = 0). As the volume ratio of glycerine to water increases, the viscosity of the solvent in which TPA-Mit is located increases from 1.03 cP to about 950 cP (99% glycerol), and the emission intensity of TPA-Mit increases significantly with the increase of the solvent viscosity. The emission intensity and solvent viscosity of TPA-Mit can be correlated with the Forster–Hoffmann equation as:42,43
log![[thin space (1/6-em)]](https://www.rsc.org/images/entities/char_2009.gif) I = C + m I = C + m![[thin space (1/6-em)]](https://www.rsc.org/images/entities/char_2009.gif) log log![[thin space (1/6-em)]](https://www.rsc.org/images/entities/char_2009.gif) η, η,
| (5) |
![[thin space (1/6-em)]](https://www.rsc.org/images/entities/char_2009.gif) η of the solvent viscosity and log
η of the solvent viscosity and log![[thin space (1/6-em)]](https://www.rsc.org/images/entities/char_2009.gif) I of the fluorescence intensity (R2 = 0.9869, m = 0.5799). Correspondingly, we calculated the TP absorption cross-section and the absorption spectra of TPA-Mit under different viscosities; as shown in Fig. S3,† the absorbance and the absorption cross-section show increments along with the viscosity. The “turn on” feature of the fluorescence probe in high-viscosity media can be explained by molecular rotor theory. Under high viscosity conditions, single bond rotation in the excited state is hindered, which impairs the non-radiative conversion process of excited electrons for enhanced fluorescence emission. More importantly, the response of the fluorescence lifetime of TPA-Mit to different viscosities was tested. As shown in Fig. 3e and f, as the solution viscosity increases, the fluorescence lifetime of TPA-Mit increases significantly, and there is a good linear relationship between the logarithm of solvent viscosity log
I of the fluorescence intensity (R2 = 0.9869, m = 0.5799). Correspondingly, we calculated the TP absorption cross-section and the absorption spectra of TPA-Mit under different viscosities; as shown in Fig. S3,† the absorbance and the absorption cross-section show increments along with the viscosity. The “turn on” feature of the fluorescence probe in high-viscosity media can be explained by molecular rotor theory. Under high viscosity conditions, single bond rotation in the excited state is hindered, which impairs the non-radiative conversion process of excited electrons for enhanced fluorescence emission. More importantly, the response of the fluorescence lifetime of TPA-Mit to different viscosities was tested. As shown in Fig. 3e and f, as the solution viscosity increases, the fluorescence lifetime of TPA-Mit increases significantly, and there is a good linear relationship between the logarithm of solvent viscosity log![[thin space (1/6-em)]](https://www.rsc.org/images/entities/char_2009.gif) η and the logarithm of fluorescence lifetime log
η and the logarithm of fluorescence lifetime log![[thin space (1/6-em)]](https://www.rsc.org/images/entities/char_2009.gif) τ with a slope of m = 0.1994 (R2 = 0.9969). In addition, we tested the changes of the fluorescence lifetime of TPA-Mit in different solution environments. The results in Fig. S4† show that the lifetime of TPA-Mit changed little with the variation of the other conditions, such as the pH, the polarity, and the solubility of the solution, except for the change of viscosity. The cytotoxicity test of the TPA-Mit, shown in Fig. S5,† presented high cell viability even at 2 μM of TPA-Mit, which is well above the working concentration (0.2 μM).
τ with a slope of m = 0.1994 (R2 = 0.9969). In addition, we tested the changes of the fluorescence lifetime of TPA-Mit in different solution environments. The results in Fig. S4† show that the lifetime of TPA-Mit changed little with the variation of the other conditions, such as the pH, the polarity, and the solubility of the solution, except for the change of viscosity. The cytotoxicity test of the TPA-Mit, shown in Fig. S5,† presented high cell viability even at 2 μM of TPA-Mit, which is well above the working concentration (0.2 μM).
As a summary of the optical and biological characterization of TPA-Mit, the probe shows excellent TP excitation and sensitivity to medium viscosity in terms of its fluorescence lifetime. In the following sections, the synthesized TPA-Mit was used to quantitatively detect the microviscosity of cells.
3.2 Intracellular performance of TPA-Mit
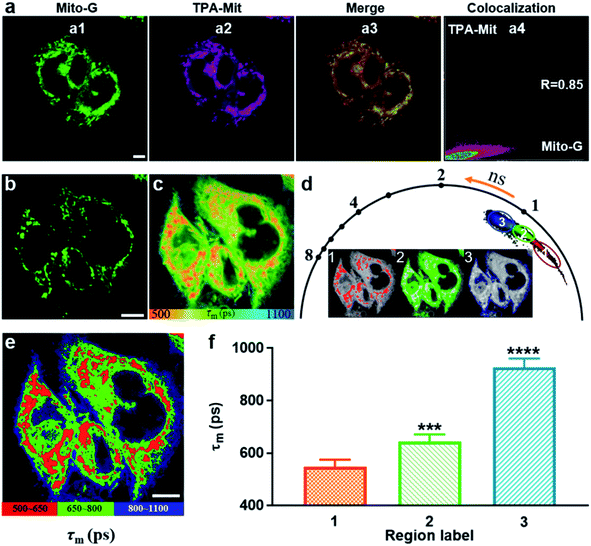
The validity verification of TPA-Mit as a viscosity probe in cells was carried out in two steps: mitochondria targeting verification and a viscosity responding test. For the first step, we performed a co-localization experiment between TPA-Mit (0.2 μM) and a commercial mitochondria probe, Mito-G (0.5 μM, Molecular Probes). The procedures of sample preparation and single-photon confocal fluorescence imaging of the sample can be found in Section 2.4. Fluorescence images of the intracellular distribution of TPA-Mit (in the 595/50 nm channel) and Mito-G (in the 525/50 nm channel) are shown in Fig. 4a. The Pearson coefficient of the TPA-Mit (red) and the Mito-G (green) fluorescence images was calculated to be 0.85, and the cross section through the image is shown in Fig. S6,† indicating that TPA-Mit can target mitochondria in cells well.For the second step, the fluorescence lifetime imaging analysis of TPA-Mit in SKOV-3 cells was studied using TP-FLIM. SKOV-3 cells were inoculated in a culture dish and stained with 0.2 μM TPA-Mit. The sample was illuminated with an 840 nm (1.5 mW after the objective) femtosecond laser, and the TP fluorescence images (Fig. 4b) and TP FLIM images (Fig. 4c) were collected at 580/50 nm. The FLIM images show a distinct short lifetime pattern that resembles the TP fluorescence images. The longer lifetime background was attributed to the untargeted free TPA-Mit, which is distributed mainly in the cellular membrane and cytoplasm. To verify our assumption, we performed FLIM of SKOV-3 cells without TPA-Mit with the same excitation power and found that the fluorescence lifetime could not be obtained due to the lack of a sufficient photon count. When we increased the excitation power to about 10 mW, weak self-fluorescence lifetime of cells was obtained, as shown in Fig. S5.† The fluorescence lifetime was around 1100 ps, which corresponds to the fluorescence lifetime of flavin adenine dinucleotide (FAD).44 This means that the short-lifetime FLIM image in Fig. 4c is mainly generated from the mitochondria-targeted and the free TPA-Mit.
Therefore, in order to analyze the viscosity variations corresponding to different cellular structures along with apoptosis, we used the phasor-FLIM method to isolate regions with different lifetimes (Fig. 4d). In the phasor-FLIM approach, the analysis of the FLIM images was performed by detecting clusters of pixel values in specific regions of the phasor plot. We selected pixels with similar lifetimes in the phasor diagram and assigned different pseudo-colors to generate the FLIM images accordingly (the inset images in Fig. 4d). The region selection in the phasor diagram was based on the criterion that the region corresponding to mitochondria (region 1 in the phasor diagram in Fig. 4d) had the best consistence with the TP image (Fig. 4b). The maximum Pearson coefficient between the TP image of the mitochondria and the pixels recognized by the phasor-FLIM approach was 0.82 and was used in the following analysis. Additionally, selection based on the threshold of the photon count (threshold = 500 photons) was performed, as shown in Fig. S8.† The two approaches showed almost the same result, since both methods are, in essence, based on the integrated photon number. This optimized the selection of mitochondria-targeted TPA-Mit, allowing for more precise quantification of the desired fluorescence lifetime. Two other regions with longer lifetimes were also separated (labeled as 2 and 3 in Fig. 4d). The FLIM image after phasor isolation is shown in Fig. 4e. Compared with the TP image of SKOV-3 cells in Fig. 4b, it can be seen that the three regions of the FLIM image correspond to the cell mitochondria, cytoplasm, and cell membrane. The average (n = 10) lifetimes of region 1, region 2 and region 3 are 557 ps, 643 ps, and 926 ps, respectively (Fig. 4f), and the representative decays are shown in Fig. S9.† Since the fluorescence lifetime of TPA-Mit only responds to the viscosity change according to Fig. S4,† this result clearly indicates differences of the viscosity in different cellular structures. The viscosities estimated by the FLIM method are 61 cP, 134 cP and 881 cP, which is in coincidence with previous reports.13,45,46
3.3 Viscosity probing of cell apoptosis via TPA-Mit
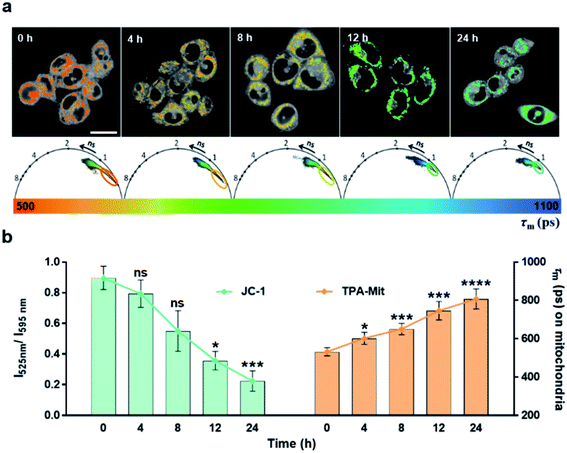
The experimental results presented above showed the capability of TPA-Mit for mitochondria targeting and viscosity sensing. Hence, we further explored the microviscosity-sensing procedure of cells under apoptosis using TPA-Mit to target mitochondria. The apoptosis was induced by PTX treatment of healthy cells. Because PTX has been proven to promote the polymerization of microtubules and stabilize the microstructure, it effectively affects the growth cycle of cancer cells and induces apoptosis.47,48 After the preparation and fluorescence imaging described in Section 2.7, the result of applying 10 μM PTX to treat SKOV-3 cells for different durations is shown in Fig. 5.The mitochondrial membrane potential probe, JC-1, was adopted to evaluate the degree of apoptosis by detecting the change of the fluorescence intensity ratio between the fluorescence channels at 525 nm and 595 nm. When the mitochondrial membrane potential decreases as the cells enter apoptosis, JC-1 cannot exist as a polymer in the mitochondrial matrix. At this time, the intensity of red fluorescence in the mitochondria is reduced, while the green fluorescence in the cytoplasm is significantly increased. Therefore, one can use the ratio of the fluorescence intensity of JC-1 in the green channel (525/50 nm) to that in the red channel (595/50 nm) to indicate the activity of SKOV-3 cells after PTX treatment. The control and the experimental groups were stained with 2 μM JC-1 and 0.2 μM TPA-Mit, respectively. It is shown in the left bar chart of Fig. 5b that the mitochondrial membrane potential decreased as the PTX treatment time increased from 0 h to 24 h. This shows that the cells started to undergo apoptosis, resulting in a decrease of the potential across the mitochondrial membrane due to the membrane permeability change. For the TPA-Mit-treated group, the mitochondrial region was first isolated with the phasor-FLIM method described above in the 580/50 nm fluorescence channel, and the result is shown in Fig. 5a. The average fluorescence lifetime of the isolated regions, as shown in Fig. 5b (the right bar chart), increased from the initial 550 ps to 800 ps after 24 h of PTX treatment, indicating a significant viscosity increment as the degree of apoptosis of the cells increased. This result confirms a previous report13,23,49 that high density of enzymes and other proteins will gather in the mitochondrial matrix surrounded by the inner membrane at the early stage of cell apoptosis because the permeability of the inner membrane increases, and an increment of the microviscosity results. More studies using different agents to induce apoptosis were carried out, showing a change in the fluorescence lifetime (Fig. S10†). These results shows that high sensitivity of cell apoptosis monitoring can be achieved using our proposed method. It is especially useful at the early stage of apoptosis, which is in our case, when the cell morphology does not change significantly.
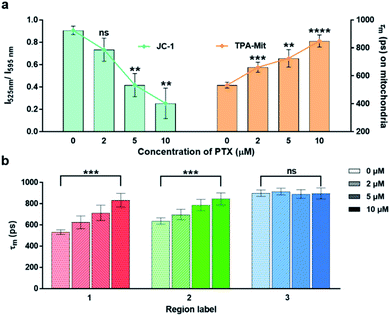
The effect of the concentration of PTX on the cell apoptosis was also investigated, as shown in Fig. 6. The mitochondrial membrane potential probing by JC-1 and the viscosity measurement by TPA-Mit was performed after 24 h of PTX treatment with 2 μM, 5 μM and 10 μM concentrations.
This shows that both the mitochondrial membrane potential and the microviscosity increased with higher PTX concentration, indicating a higher cell apoptosis degree. However, our method using the fluorescence lifetime change of a viscosity-sensitive probe results in higher precision (lower standard deviation) as well as a more significant difference, as shown in Fig. 6a. The variations of the fluorescence lifetime in region 2 (corresponding to cytoplasm) and region 3 (corresponding to the cellular membrane) are shown in Fig. 6b. The fluorescence lifetime of region 2 increased with higher PTX concentration, while it remained almost constant for region 3. This may be caused by the accumulation of cytoplasmic lipid droplets in the cytoplasm during cell apoptosis.22,50
4. Conclusion
We have investigated the microviscosity changes of mitochondria during cell apoptosis using our synthesized mitochondria-targeted viscosity probe, TPA-Mit. The functional groups, triphenyl phosphine salt and xylene linked with ethenyl, were successfully assembled on the probe, resulting in good mitochondrial targeting and two-photon excitation fluorescence. Optical characterization of the synthesized TPA-Mit was performed in extracellular experiments, showing high sensitivity of the fluorescence lifetime to the viscosity of the medium. Taking advantage of this characteristic of TPA-Mit, we investigated the microviscosity changes of mitochondria during cell apoptosis. Phasor-FLIM was adopted in order to isolate the fluorescence lifetime corresponding to mitochondria. Experiments show that the mitochondrial viscosity increased as the cells underwent apoptosis induced by PTX. Compared to the existing method for cell apoptosis detection via the mitochondrial potential measurement based on fluorescence intensity variations, our method can offer higher precision, benefiting from the inherent characterization of the molecular fluorescence lifetime.Funding
The National Key Research and Development Program of China (2017YFA0700402). National Natural Science Foundation of China (61935012, 61961136005, 61620106016, 61835009); Shenzhen Key Projects (JCYJ20200109105404067); Shenzhen Fundamental Research Program (JCYJ20180305124902165); Shenzhen International Cooperation Research Project (GJHZ20190822095420249).Data availability
Data underlying the results presented in this paper are not publicly available at this time but may be obtained from the authors upon reasonable request.Conflicts of interest
The authors declare no conflicts of interest.References
- C. M. Pfeffer and A. T. K. Singh, Int. J. Mol. Sci., 2018, 19, 448 CrossRef PubMed.
- M. Castedo, K. Ferri, T. Roumier, D. Metivier, N. Zamzami and G. Kroemer, J. Immunol. Methods, 2002, 265, 39–47 CrossRef CAS PubMed.
- Y. Otsuki, Z. L. Li and M. A. Shibata, Prog. Histochem. Cytochem., 2003, 38, 275–339 CrossRef PubMed.
- D. C. Wallace, Nat. Rev. Cancer, 2012, 12, 685–698 CrossRef CAS PubMed.
- J. Nunnari and A. Suomalainen, Cell, 2012, 148, 1145–1159 CrossRef CAS PubMed.
- T. Hirsch, S. A. Susin, I. Marzo, P. Marchetti, N. Zamzami and G. Kroemer, Cell Biol. Toxicol., 1998, 14, 141–145 CrossRef CAS PubMed.
- C. E. J. Dieteren, S. C. A. M. Gielen, L. G. J. Nijtmans, J. A. M. Smeitink, H. G. Swarts, R. Brock, P. H. G. M. Willems and W. J. H. Koopman, Proc. Natl. Acad. Sci. U.S.A., 2011, 108, 8657–8662 CrossRef CAS PubMed.
- S. Desagher and J. C. Martinou, Trends Cell Biol., 2000, 10, 369–377 CrossRef CAS PubMed.
- C. Brenner and G. Kroemer, Science, 2000, 289, 1150–1151 CrossRef CAS PubMed.
- M. Yang and W. J. Brackenbury, Front. Physiol., 2013, 4, 185 CAS.
- S. Salvioli, A. Ardizzoni, C. Franceschi and A. Cossarizza, FEBS Lett., 1997, 411, 77–82 CrossRef CAS PubMed.
- H. Zhu, J. L. Fan, J. J. Du and X. J. Peng, Acc. Chem. Res., 2016, 49, 2115–2126 CrossRef CAS PubMed.
- Z. Yang, Y. He, J. H. Lee, N. Park, M. Suh, W. S. Chae, J. F. Cao, X. J. Peng, H. Jung, C. Kang and J. S. Kim, J. Am. Chem. Soc., 2013, 135, 9181–9185 CrossRef CAS PubMed.
- M. G. Ren, B. B. Deng, K. Zhou, X. Q. Kong, J. Y. Wang and W. Y. Lin, Anal. Chem., 2017, 89, 552–555 CrossRef CAS PubMed.
- Z. G. Yang, J. F. Cao, Y. X. He, J. H. Yang, T. Kim, X. J. Peng and J. S. Kim, Chem. Soc. Rev., 2014, 43, 4563–4601 RSC.
- K. Luby-Phelps, Int. Rev. Cytol., 2000, 192, 189–221 CAS.
- S. T. Kinsey, B. R. Locke and R. M. Dillaman, J. Exp. Biol., 2011, 214, 263–274 CrossRef PubMed.
- A. G. Tsai, P. Cabrales and M. Intaglietta, Crit. Care Med., 2005, 33, 1662–1663 CrossRef PubMed.
- W. Osterode, C. Holler and F. Ulberth, Diabetic Med., 1996, 13, 1044–1050 CrossRef CAS PubMed.
- O. Nadiv, M. Shinitzky, H. Manu, D. Hecht, C. T. Roberts, D. Leroith and Y. Zick, Biochem. J., 1994, 298, 443–450 CrossRef CAS PubMed.
- A. M. Aleardi, G. Benard, O. Augereau, M. Malgat, J. C. Talbot, J. P. Mazat, T. Letellier, J. Dachary-Prigent, G. C. Solaini and R. Rossignol, J. Bioenerg. Biomembr., 2005, 37, 207–225 CrossRef CAS PubMed.
- N. Gupta, S. I. Reja, V. Bhalla, M. Gupta, G. Kaur and M. Kumar, J. Mater. Chem. B., 2016, 4, 1968–1977 RSC.
- H. Zhu, J. L. Fan, M. Li, J. F. Cao, J. Y. Wang and X. J. Peng, Chem.–Eur. J., 2014, 20, 4691–4696 CrossRef CAS PubMed.
- T. C. OwYong, S. Y. Ding, N. Wu, T. Fellowes, S. J. Chen, J. M. White, W. W. H. Wong and Y. N. Hong, Chem. Commun., 2020, 56, 14853–14856 RSC.
- H. Wang, L. Zhou, F. Z. Cai, X. B. Shen, J. Q. Sun, Y. Wei, D. X. Feng, Z. J. Feng and J. He, Chem. Pap., 2020, 74, 1071–1078 CrossRef CAS.
- H. Wang, F. Z. Cai, L. Zhou, J. He, D. X. Feng, Y. Wei, Z. J. Feng, X. X. Gu, U. Kajsa and Z. J. Hu, New J. Chem., 2019, 43, 8811–8815 RSC.
- K. Zhou, M. G. Ren, B. B. Deng and W. Y. Lin, New J. Chem., 2017, 41, 11507–11511 RSC.
- D. D. Su, C. L. Teoh, N. Y. Gao, Q. H. Xu and Y. T. Chang, Sensors, 2016, 16, 1397 CrossRef PubMed.
- K.-N. Wang, G. Qi, H. Chu, X.-J. Chao, L.-Y. Liu, G. Li, Q. Cao, Z.-W. Mao and B. Liu, Mater. Horiz., 2020, 7, 3226–3233 RSC.
- K.-N. Wang, L.-Y. Liu, D. Mao, S. Xu, C.-P. Tan, Q. Cao, Z.-W. Mao and B. Liu, Angew. Chem., Int. Ed., 2021, 60, 15095–15100 CrossRef CAS PubMed.
- X. Peng, Z. Yang, J. Wang, J. Fan, Y. He, F. Song, B. Wang, S. Sun, J. Qu, J. Qi and M. Yang, J. Am. Chem. Soc., 2011, 133, 6626–6635 CrossRef CAS PubMed.
- M.-X. Hou, L.-Y. Liu, K.-N. Wang, X.-J. Chao, R.-X. Liu and Z.-W. Mao, New J. Chem., 2020, 44, 11342–11348 RSC.
- X. J. Peng, Z. G. Yang, J. Y. Wang, J. L. Fan, Y. X. He, F. L. Song, B. S. Wang, S. G. Sun, J. L. Qu, J. Qi and M. Yang, J. Am. Chem. Soc., 2011, 133, 6626–6635 CrossRef CAS PubMed.
- A. S. Klymchenko, Acc. Chem. Res., 2017, 50, 366–375 CrossRef CAS PubMed.
- W. Becker, J. Microsc., 2012, 247, 119–136 CrossRef CAS PubMed.
- C. Poudel, I. Mela and C. F. Kaminski, Methods Appl. Fluoresc., 2020, 8, 024005 CrossRef CAS PubMed.
- A. L. Trinh, S. Ber, A. Howitt, P. O. Valls, M. W. Fries, A. R. Venkitaraman and A. Esposito, Methods Appl. Fluoresc., 2019, 7, 044001 CrossRef CAS PubMed.
- S. Q. Wang, Y. P. Li, Y. H. Zhao, F. R. Lin, J. L. Qu and L. W. Liu, Biomed. Opt. Express, 2021, 12, 1962–1973 CrossRef PubMed.
- B. L. Shen, J. S. Yan, S. Q. Wang, F. F. Zhou, Y. H. Zhao, R. Hu, J. L. Qu and L. W. Liu, Theranostics, 2020, 10, 1849–1860 CrossRef CAS PubMed.
- A. Sillen and Y. Engelborghs, Photochem. Photobiol., 1998, 67, 475–486 CAS.
- S. Ranjit, L. Malacrida, D. M. Jameson and E. Grafton, Nat. Protoc., 2018, 13, 1979–2004 CrossRef CAS PubMed.
- L. L. Hou, P. Ning, Y. Feng, Y. Q. Ding, L. Bai, L. Li, H. Z. Yu and X. M. Meng, Anal. Chem., 2018, 90, 7122–7126 CrossRef CAS PubMed.
- T. Forster and G. Hoffmann, Z. Phys. Chem., 1971, 75, 63–76 CrossRef.
- M. C. Skala, K. M. Riching, A. Gendron-Fitzpatrick, J. Eickhoff, K. W. Eliceiri, J. G. White and N. Ramanujam, Proc. Natl. Acad. Sci. U. S. A., 2007, 104, 19494–19499 CrossRef CAS PubMed.
- M. K. Kuimova, G. Yahioglu, J. A. Levitt and K. Suhling, J. Am. Chem. Soc., 2008, 130, 6672–6673 CrossRef CAS PubMed.
- J. T. Mika, A. J. Thompson, M. R. Dent, N. J. Brooks, J. Michiels, J. Hofkens and M. K. Kuimova, Biophys. J., 2016, 111, 1528–1540 CrossRef CAS PubMed.
- D. A. Yardley, J. Control Release, 2013, 170, 365–372 CrossRef CAS PubMed.
- B. A. Weaver, Mol. Biol. Cell, 2014, 25, 2677–2681 CrossRef PubMed.
- M. K. Kuimova, S. W. Botchway, A. W. Parker, M. Balaz, H. A. Collins, H. L. Anderson, K. Suhling and P. R. Ogilby, Nat. Chem., 2009, 1, 69–73 CrossRef CAS PubMed.
- J. Boren and K. M. Brindle, Cell Death Differ., 2012, 19, 1561–1570 CrossRef CAS PubMed.
Footnotes |
| † Electronic supplementary information (ESI) available. See DOI: 10.1039/d1ra06697h |
| ‡ Authors contributed equally to this work. |
| This journal is © The Royal Society of Chemistry 2021 |

