 Open Access Article
Effects of thermal treatments on the hydrophobicity and anticorrosion properties of as-grown graphene coatings
Wei Chang a,
Branko N. Popovb and
Chen Li*a
aDepartment of Mechanical Engineering, University of South Carolina, Columbia, SC 29208, USA. E-mail: li01@cec.sc.edu
bDepartment of Chemical Engineering, University of South Carolina, Columbia, SC 29208, USA
First published on 10th November 2021
Abstract
Graphene grown on metal substrates has been reported to provide efficient and robust hydrophobicity during water vapor condensation on metal surfaces. However, due to the intrinsic negative coefficient of thermal expansion (CTE) of graphene, the potential thermal stress in real application environments can cause CTE mismatch and then damage the protective graphene coatings, leading to loss of surface hydrophobicity and anticorrosion properties. In this study, the effect of thermal treatments on anticorrosion properties and subsequent hydrophobicity of the graphene surface has been investigated. The as-grown graphene on nickel (Ni–Gr) is explored in terms of survival under severe thermal cycling (up to 14.62 °C s−1) and effectively maintains its surface properties. As a comparison, the as-grown graphene on copper (Cu–Gr) easily peeled off from the metal surface due to the thermal stress and intercalation of oxides. The thermal treatment at 200 °C under ambient atmosphere can elevate the corrosion rate 2.2 times and 29 times on the Ni–Gr and Cu–Gr surfaces compared to situations without thermal treatments, respectively. This study shows that the Ni–Gr surface is significantly more robust than the Cu–Gr surface as a sustainable hydrophobic surface in a complicated thermal environment.
Introduction
Metal corrosion is a critical problem due to its degradation effect on metal properties such as electrical and thermal conductivity under humid conditions. Protective coatings are essential for the long-term uses of metals as efficient anticorrosion barriers.1–3 Graphene has attracted great scientific interest because of its extraordinary properties such as high thermal and electrical conductivity.4–6 Graphene is highly impermeable to gases7,8 and robust against oxidation up to 500 °C,9,10 suggesting that graphene films could be an effective anticorrosion barrier over a large working temperature region and corrosive condition. It has been demonstrated that as-grown graphene on Cu surfaces can effectively prevent Cu oxidation under harsh conditions such as thermal treatment in air in short terms11,12 or electrochemical corrosive conditions.13,14 The anticorrosion property of graphene can be further improved by healing the local defects and stack structures of few-layer graphene.15,16 Graphene has also been reported to be a robust hydrophobic coating during water vapor condensations17,18 by promoting the condensation heat transfer rates with ultra-thin thickness. The combination of robust hydrophobicity and preferred anticorrosion property with ultra-thin thickness indicates a great potential of graphene applications under more challenging thermal environments.However, graphene has unusual negative linear thermal expansion coefficient (CTE) compared to most metals.19–21 The potential thermal stress during thermal treatment between graphene and metal substrates could easily break down the original interfacial coupling, providing additional paths for corrosion species and deteriorating the hydrophobicity of graphene coatings. The effect of this macro-scale thermal stress on the sustainability of graphene/metal systems is still elusive. Due to the huge impact induced by robust hydrophobic and anticorrosive surfaces in many industrial applications such as power generation, water harvesting and desalination, sustainable hydrophobicity of the as-grown graphene under challenging thermal environments should be considered.
In this study, the effect of the thermal cycling up to 200 °C (steadily heated and circularly heated) on the hydrophobicity and anticorrosion property of as-grown graphene surfaces was experimentally investigated. The surface hydrophobicity of graphene grown on both nickel and copper with two typical interfacial bonds22,23 and reported to be robust during steam condensation17,18 was characterized by water contact angles (WCAs). The surface corrosion behavior of graphene was also systematically investigated by using electrochemical corrosion techniques. This study showed that as-grown graphene on Ni (Ni–Gr) can provide sustainable hydrophobicity and sufficiently protect the underneath metal from oxidation in air up to 200 °C even with heating/cooling rate up to 14.62 °C s−1. As a comparison, as-grown graphene on Cu (Cu–Gr) could not prevent the underneath metal substrates from oxidation under the same steady thermal treatment, losing its surface hydrophobicity. The corrosion rate of the Ni–Gr surface (4.58 × 10⁻⁸ m per year) was only ∼7.4% of the corrosion rate of the Cu–Gr surface (6.21 × 10⁻⁷ m per year) after the same thermal circulating treatment.
Material and methods
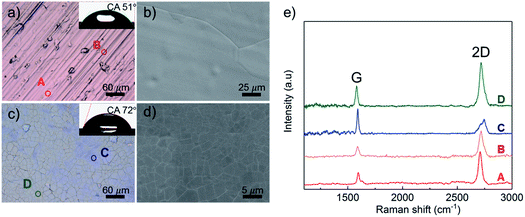
Graphene was fabricated via chemical vapor deposition (CVD) on polycrystalline Cu (Alfa Aesar item no. 13380, thickness 0.127 mm) and Ni (Alfa Aesar item no. 10595, thickness 0.127 mm) foils based on our previous studies.24 To eliminate the potential wet corrosion caused by condensed water vapor from air, samples were then exposed to atmospheric air at room temperature for the surface characterization and thermal treatment within the same day.The full coverage of graphene coatings on both Cu and Ni substrates were examined by optical and scanning electron microscopes (SEM) (Fig. 1a–d). WCAs were commonly used to indicate the ability of the water to wet the solid surface. The larger WCA means the solid surface is more hydrophobic to water.25 Here the WCA was measured to characterize the surface wetting property by a goniometry. The average WCA was then determined by five points on each sample surfaces. Raman spectrum with a 488 nm laser source was used to characterize the graphene surface. Predominant single-layer graphene with full coverage and negligible defect density on Cu substrate was confirmed through the intensity ratio between G and 2D peaks (Fig. 1e).26,27 The fresh graphene coated Cu samples were uniformly colored and shiny. As the carbon solubility in bulk Ni is much higher than that in the bulk Cu, it was difficult to get dominant single-layer graphene on Ni.22 Few-layer graphene with noticeable graphene grain boundaries on Ni substrate was also confirmed by Raman spectrum and SEM images. As shown in Fig. 1c, the Ni–Gr surfaces exhibited a nonuniform color due to a variation of the graphene thickness.
After the full coverage of graphene on metal substrates was confirmed, the graphene samples were heated at 200 °C in air via two different thermal treatments (Fig. 2a). The same batch of samples were separated into two sets. The first set of samples was heated continuously (steadily heated) at 200 °C for two hours and then naturally cooled to room temperature at a cooling rate less than 0.275 °C s−1. The other set of samples were heated continuously at the same temperature for 30 min, then fast cooled to room temperature by taking away from the heating plate for 5 min. Totally 4 cycles of the thermal treatment (circularly heated) were conducted to control an equivalent heating time at 200 °C. Due to the thin thickness and low thermal capacity of all metal sheet samples, a huge temperature gradient over ∼14.62 °C s−1 (Fig. 2b and c) was achieved during heating and cooling process and the local thermal stress was significantly amplificated compared to the steadily heating process.
Results and discussion
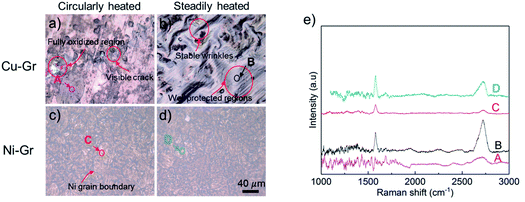
Fig. 3 illustrated the optical images of both Cu–Gr and Ni–Gr sample surface after thermal cycling and steady heating treatments, respectively. On the Cu–Gr surfaces after the thermal cycling treatments, graphene coatings torn apart as confirmed by visible cracks shown in Fig. 3a. A few parts of the surface maintained the shiny color where the Cu surface was still well protected by residue graphene coatings. The grey to dark region indicated partial oxidations of the underneath Cu substrate which may be caused by the graphene peeling off and subsequent air exposure. Further Raman spectrum was used to check these oxidized regions. Typical peaks for graphene (Fig. 3e) were not found, indicating the local peel-off of graphene coatings.As a comparison, after the steadily heated treatment, the Cu–Gr did not exhibit obvious peeling off region of graphene coatings and the area of thermally oxidized region (dark region in Fig. 3a) was much smaller than that after the circularly heat treatment. Typical peaks of Raman spectrum were found on the sample surfaces (Fig. 3e). However, randomly distributed wrinkles of graphene were observed, and the underneath Cu substrates displayed different color compared to the original Cu–Gr surface. This change of color indicated the graphene coated Cu succumbed to oxidation even with the existence of graphene, which could be explained by the migration of oxygen through defects and detachment of graphene from the substrates. In the well-protected regions, no apparent wrinkle was observed, manifesting a different bonding strength of graphene compared to those wrinkled regions. This result agreed with recent studies in which graphene-covered polycrystalline Cu demonstrated a facet-dependent oxidation behavior.28
No distinct differences were observed on the Ni–Gr surfaces after the two types of thermal treatments (Fig. 3c and d). Graphene signal from the Raman spectrum indicated the existence of original graphene coatings. The defects density of Ni–Gr surfaces represented by the D peak intensity26,29 indicated negligible difference after both thermal treatments. However, compared with the optical images of fresh surfaces as illustrated in Fig. 1, the background color of the Ni–Gr surfaces after thermal treatment was changed. The enhanced color contrast between the Ni grain boundaries and its intrinsic region confirmed a slightly variation of oxidants barrier effects after the thermal treatments.
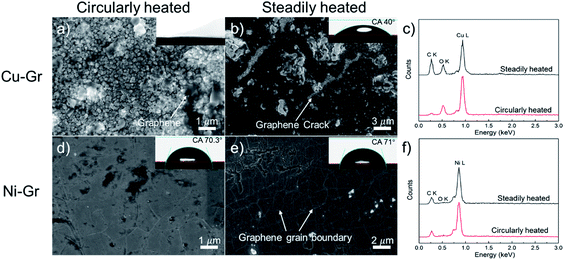
Further detailed studies of graphene surface after thermal treatments were performed via scanning electron microscope (SEM) and WCA measurements. In case of Cu–Gr surfaces, graphene coatings totally peeled off from the underneath Cu substrate and oxides were formed by thermal-cycling heat treatment. As illustrated in Fig. 4a, only a few parts of the graphene were left on the color changed region. The water droplet that used to measure the WCA was fully spread on this sample surface which indicated the loss of surface hydrophobicity. As shown in Fig. 4c, the C![[thin space (1/6-em)]](https://www.rsc.org/images/entities/char_2009.gif) :
:![[thin space (1/6-em)]](https://www.rsc.org/images/entities/char_2009.gif) O stoichiometry from the energy dispersive X-ray analysis (EDAX) is revealed to be 30.3
O stoichiometry from the energy dispersive X-ray analysis (EDAX) is revealed to be 30.3![[thin space (1/6-em)]](https://www.rsc.org/images/entities/char_2009.gif) :
:![[thin space (1/6-em)]](https://www.rsc.org/images/entities/char_2009.gif) 69.7 atomic percent, suggesting a remarkably large area of graphene peeled off. Interestingly, this peel-off phenomenon was not observed on the graphene surfaces steadily heated. However, oxides on defects and small cracks of graphene coating were observed during this thermal treatment process, which escalated the intercalation of oxidizing species below the graphene coating. Fig. 4b illuminated the intercalation of oxides where graphene coatings still covered. The WCA became 40 ± 3°, which was 11° smaller compared to the intrinsic Cu–Gr surface. The C
69.7 atomic percent, suggesting a remarkably large area of graphene peeled off. Interestingly, this peel-off phenomenon was not observed on the graphene surfaces steadily heated. However, oxides on defects and small cracks of graphene coating were observed during this thermal treatment process, which escalated the intercalation of oxidizing species below the graphene coating. Fig. 4b illuminated the intercalation of oxides where graphene coatings still covered. The WCA became 40 ± 3°, which was 11° smaller compared to the intrinsic Cu–Gr surface. The C![[thin space (1/6-em)]](https://www.rsc.org/images/entities/char_2009.gif) :
:![[thin space (1/6-em)]](https://www.rsc.org/images/entities/char_2009.gif) O stoichiometry of these surfaces revealed an apparent increase on the atomic percentage ratio (Fig. 4c).
O stoichiometry of these surfaces revealed an apparent increase on the atomic percentage ratio (Fig. 4c).
Note that the distinct difference resulting from thermal treatments exhibited neglectable effects on the structures of the Ni–Gr surfaces. No obvious cracks or large areas of graphene peeling-off were observed (Fig. 4d and e). The WCA on these surfaces (70.3 ± 3° and 71 ± 3°) were close to that on the original Ni–Gr surface. Moreover, the difference of CTEs between single layer graphene (∼−4.8 × 10⁻⁶ K−1)20 on copper (∼14.7 × 10⁻⁶ K−1)30 was only 14% higher than that of few-layer graphene (∼−2.6 × 10⁻⁶ K−1)20 on nickel (∼14.5 × 10⁻⁶ K−1)30 at the heating temperature of 200 °C. This small difference on the mismatch of CTEs between these two graphene–metal systems under the same thermal treatment cannot be used to explain the huge difference between the Cu–Gr and Ni–Gr systems. The different interfacial bonding between graphene and metal substrates where the adhesion energy of graphene on Ni was reported to be 5.6–7 times higher than that of graphene on Cu24,31 could be the main factor. The strong interfacial bonding in the Ni–Gr system can survive from thermal cycling heat treatment and hence, maintain the graphene functionalities on Ni substrates.
Fig. 4d and e demonstrated the point oxides which were most likely to appear on the graphene grain boundaries. The intrinsic defects such as grain boundaries and atomic vacancies in the graphene opened extra paths for these oxidizing species to reach the underneath substrate. The intensity of O K peaks on Ni–Gr sample surfaces was much less than that on Cu–Gr sample surfaces, agreeing well with the observation on SEM images.
Since the graphene surfaces after thermal treatments appeared to be robust and only small oxides were observed through the SEM images, the X-ray photoelectron spectroscopy (XPS) of these Ni–Gr surfaces was further investigated to identify the surface chemical component development. No obvious peaks of metal oxides were found from O 1s and Ni 2p spectrums in Fig. 5a and b, respectively. Ni substrates were covered by graphene as indicated by Ni 2p signal at the noise level due to the detect depth of XPS. The atomic percentage ratios of Ni![[thin space (1/6-em)]](https://www.rsc.org/images/entities/char_2009.gif) :
:![[thin space (1/6-em)]](https://www.rsc.org/images/entities/char_2009.gif) O
O![[thin space (1/6-em)]](https://www.rsc.org/images/entities/char_2009.gif) :
:![[thin space (1/6-em)]](https://www.rsc.org/images/entities/char_2009.gif) C were 0.01
C were 0.01![[thin space (1/6-em)]](https://www.rsc.org/images/entities/char_2009.gif) :
:![[thin space (1/6-em)]](https://www.rsc.org/images/entities/char_2009.gif) 1.69
1.69![[thin space (1/6-em)]](https://www.rsc.org/images/entities/char_2009.gif) :
:![[thin space (1/6-em)]](https://www.rsc.org/images/entities/char_2009.gif) 98.29 and 0.02
98.29 and 0.02![[thin space (1/6-em)]](https://www.rsc.org/images/entities/char_2009.gif) :
:![[thin space (1/6-em)]](https://www.rsc.org/images/entities/char_2009.gif) 1.66
1.66![[thin space (1/6-em)]](https://www.rsc.org/images/entities/char_2009.gif) :
:![[thin space (1/6-em)]](https://www.rsc.org/images/entities/char_2009.gif) 98.31 for surfaces treated with thermal cycling and steady heat treatments as shown in Table 1, respectively. Apparently, the observed oxide sites on Ni–Gr surfaces were rare and these passivating oxides could sufficiently impede the diffusion process of oxidized species toward the metal surface below the graphene coating.23,28 The Ni–Gr surface with strong interfacial bond can survive from the huge thermal stress during thermal cycles.
98.31 for surfaces treated with thermal cycling and steady heat treatments as shown in Table 1, respectively. Apparently, the observed oxide sites on Ni–Gr surfaces were rare and these passivating oxides could sufficiently impede the diffusion process of oxidized species toward the metal surface below the graphene coating.23,28 The Ni–Gr surface with strong interfacial bond can survive from the huge thermal stress during thermal cycles.
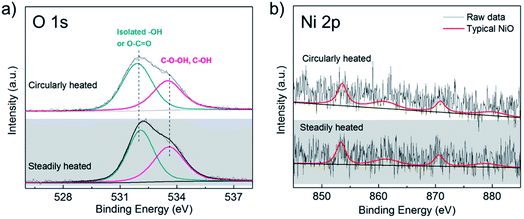 | ||
| Fig. 5 X-ray photoelectron spectroscopy analysis of Ni–Gr surfaces after circularly and steadily heated in air for 2 h: (a) XP O 1s core level lines and (b) Ni 2p core level lines. | ||
| Ni | O | C | ||
|---|---|---|---|---|
| Circularly heated | Mass conc. % | 0.07 | 2.24 | 97.69 |
| Atomic conc. % | 0.01 | 1.69 | 98.29 | |
| Steadily heated | Mass conc. % | 0.10 | 2.20 | 97.69 |
| Atomic conc. % | 0.02 | 1.66 | 98.31 |
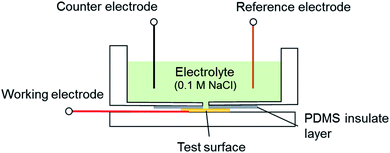
The effect of thermal treatments on the overall corrosion rates were analyzed via Tafel extrapolation method13,14 to explore the mechanism of the robust Ni–Gr surfaces with different thermal treatments. A three-electrode flat-cell (Fig. 6) which consisted of an exposed working electrode area of 0.2826 cm2, a saturated Ag/AgCl reference electrode (Gamry Instruments, part no. 930–29) and a platinum wire as the counter-electrode. Details of Tafel tests and corrosion rate derivation were described in our previous study.32 The original Cu–Gr and Ni–Gr samples were used to measure the benchmark of corrosion rates of graphene coatings without any thermal treatment. It was notable that the curves for Ni–Gr surfaces after thermal treatments was shifted slightly towards to positive potentials and higher corrosion current density compared to fresh Ni–Gr surfaces (Fig. 7a), indicating a marginal degradation on the anticorrosion performance. However, Cu–Gr surfaces exhibited a huge shift to larger negative potential and a significantly higher corrosion current density. As-grown graphene on the Cu substrate after steady thermal treatments revealed negligible protections during the electrochemical reaction, agreeing well with the observation as shown in Fig. 3 and 4. This could be explained by the breakdown of continuous graphene coatings and subsequent local corrosion underneath the graphene coating.
 | ||
| Fig. 7 Tafel plots of (a) Ni–Gr and (b) Cu–Gr samples after different heat treatments. (c) Corrosion rates of Ni–Gr and Cu–Gr surfaces after different heat treatments extracted from Tafel plots. | ||
In Fig. 7c, the corrosion rates on all tested graphene surfaces were summarized. On the original graphene coated Cu and Ni samples, the corrosion rates of 1.69 × 10⁻⁸ m per year on the Ni–Gr surface and 2.14 × 10⁻⁸ m per year on the Cu–Gr surfaces were achieved. Thermal stress induced by thermal-cycle heat treatments demonstrated a slightly worse degradation of corrosion rates of graphene samples compared to those steadily heated samples. The Ni–Gr surface treated by thermal cycling exhibited ∼2.7 times (4.58 × 10−8 m per year) increasement on the corrosion rate, providing a good tolerance of thermal stress effect on corrosion. However, this same thermal approach could elevate the corrosion rate up to 29 times (6.21 × 10−7 m per year) larger compared with the intrinsic surfaces on Cu–Gr samples. The huge difference on corrosion rates between the Ni–Gr and Cu–Gr samples revealed that the wettability and anticorrosion property of graphene surfaces could be highly affected by the thermal treatment. The hydrophobicity of Ni–Gr surface can survive in more challenging thermal environments.
Conclusions
We experimentally investigated the effect of different thermal treatments on the hydrophobicity and anticorrosion properties of two typical graphene–metal systems (Cu–Gr and Ni–Gr surfaces) by varying the heating and cooling rates. Circularly heating can easily degrade the quality of graphene coatings due to the negative CTE of graphene and subsequent intercalations of oxides. However, the strong interfacial bonding between graphene and nickel substrates can survive from fast thermal cycles up to 14.62 °C s−1 and hence, impede the oxidizing species intercalations even when local passivating oxides appeared. The original hydrophobicity of the graphene surface was maintained. This study advances understandings of graphene coatings on the nickel substrate as the sustainable hydrophobic surface, which is more robust than the Cu–Gr system under complicated water vapor condensation environments.Conflicts of interest
The authors declare no conflict of interest.Acknowledgements
This work is supported by National Science Foundation (NSF) program of thermal transport processes under Grant No. 1336443 (Program Manager Dr Jose Lage). The authors greatly appreciate the help from Dr Stavros G. Karakalos (Department of Chemical Engineering, University of South Carolina (USC)) for XPS measurements and analysis.References
- H. Lee, S. B. Jo, H. C. Lee, M. Kim, D. H. Sin, H. Ko and K. Cho, ChemSusChem, 2016, 9, 445–454 CrossRef CAS PubMed.
- D. E. Tallman, G. Spinks, A. Dominis and G. G. Wallace, J. Solid State Electrochem., 2002, 6, 73–84 CrossRef CAS.
- R. B. Comizzoli, R. P. Frankenthal, P. C. Milner and J. D. Sinclair, Science, 1986, 234, 340–345 CrossRef CAS PubMed.
- S. Ghosh, I. Calizo, D. Teweldebrhan, E. P. Pokatilov, D. L. Nika, A. A. Balandin, W. Bao, F. Miao and C. N. Lau, Appl. Phys. Lett., 2008, 92, 151911 CrossRef.
- A. A. Balandin, S. Ghosh, W. Z. Bao, I. Calizo, D. Teweldebrhan, F. Miao and C. N. Lau, Nano Lett., 2008, 8, 902–907 CrossRef CAS PubMed.
- S. Stankovich, D. A. Dikin, G. H. B. Dommett, K. M. Kohlhaas, E. J. Zimney, E. A. Stach, R. D. Piner, S. T. Nguyen and R. S. Ruoff, Nature, 2006, 442, 282–286 CrossRef CAS PubMed.
- J. S. Bunch, S. S. Verbridge, J. S. Alden, A. M. van der Zande, J. M. Parpia, H. G. Craighead and P. L. McEuen, Nano Lett., 2008, 8, 2458–2462 CrossRef CAS PubMed.
- V. Berry, Carbon, 2013, 62, 1–10 CrossRef CAS.
- L. Liu, S. M. Ryu, M. R. Tomasik, E. Stolyarova, N. Jung, M. S. Hybertsen, M. L. Steigerwald, L. E. Brus and G. W. Flynn, Nano Lett., 2008, 8, 1965–1970 CrossRef CAS PubMed.
- S. P. Surwade, Z. T. Li and H. T. Liu, J. Phys. Chem. C, 2012, 116, 20600–20606 CrossRef CAS.
- S. S. Chen, L. Brown, M. Levendorf, W. W. Cai, S. Y. Ju, J. Edgeworth, X. S. Li, C. W. Magnuson, A. Velamakanni, R. D. Piner, J. Y. Kang, J. Park and R. S. Ruoff, ACS Nano, 2011, 5, 1321–1327 CrossRef CAS PubMed.
- D. Kang, J. Y. Kwon, H. Cho, J. H. Sim, H. S. Hwang, C. S. Kim, Y. J. Kim, R. S. Ruoff and H. S. Shin, ACS Nano, 2012, 6, 7763–7769 CrossRef CAS PubMed.
- N. T. Kirkland, T. Schiller, N. Medhekar and N. Birbilis, Corros. Sci., 2012, 56, 1–4 CrossRef CAS.
- D. Prasai, J. C. Tuberquia, R. R. Harl, G. K. Jennings and K. I. Bolotin, ACS Nano, 2012, 6, 1102–1108 CrossRef CAS PubMed.
- Y. H. Wu, W. J. Zhao, X. Y. Zhu and Q. J. Xue, Carbon, 2019, 153, 95–99 CrossRef CAS.
- Z. J. Zhao, T. Y. Hou, N. N. Wu, S. P. Jiao, K. Zhou, J. Yin, J. W. Suk, X. Cui, M. F. Zhang, S. P. Li, Y. Qu, W. G. Xie, X. B. Li, C. X. Zhao, Y. Fu, R. D. Hong, S. S. Guo, D. Q. Lin, W. W. Cai, W. J. Mai, Z. T. Luo, Y. T. Tian, Y. Lai, Y. Y. Liu, L. Colombo and Y. F. Hao, Nano Lett., 2021, 21, 1161–1168 CrossRef CAS PubMed.
- D. J. Preston, D. L. Mafra, N. Miljkovic, J. Kong and E. N. Wang, Nano Lett., 2015, 15, 2902–2909 CrossRef CAS PubMed.
- W. Chang, B. L. Peng, K. Egab, Y. Y. Zhang, Y. Q. Cheng, X. D. Li, X. H. Ma and C. Li, Sci. Bull., 2021, 66, 1877–1884 CrossRef.
- S. Mann, R. Kumar and V. K. Jindal, RSC Adv., 2017, 7, 22378–22387 RSC.
- D. Yoon, Y. W. Son and H. Cheong, Nano Lett., 2011, 11, 3227–3231 CrossRef CAS PubMed.
- C. P. Herrero and R. Ramirez, Phys. Rev. B, 2018, 97, 235426 CrossRef.
- A. Dahal and M. Batzill, Nanoscale, 2014, 6, 2548–2562 RSC.
- R. S. Weatherup, L. D'Arsie, A. Cabrero-Vilatela, S. Caneva, R. Blume, J. Robertson, R. Schloegl and S. Hofmann, J. Am. Chem. Soc., 2015, 137, 14358–14366 CrossRef CAS PubMed.
- W. Chang, S. Rajan, B. L. Peng, C. C. Ren, M. Sutton and C. Li, Carbon, 2019, 153, 699–706 CrossRef CAS.
- S. R. Rao, Hydrophobicity and Contact Angle, in Surface Chemistry of Froth Flotation, Springer, Boston, MA, 2004, DOI:10.1007/978-1-4757-4302-9_8.
- A. Eckmann, A. Felten, A. Mishchenko, L. Britnell, R. Krupke, K. S. Novoselov and C. Casiraghi, Nano Lett., 2012, 12, 3925–3930 CrossRef CAS PubMed.
- L. M. Malard, M. A. Pimenta, G. Dresselhaus and M. S. Dresselhaus, Phys. Rep., 2009, 473, 51–87 CrossRef CAS.
- X. Z. Xu, D. Yi, Z. C. Wang, J. C. Yu, Z. H. Zhang, R. X. Qiao, Z. H. Sun, Z. H. Hu, P. Gao, H. L. Peng, Z. F. Liu, D. P. Yu, E. G. Wang, Y. Jiang, F. Ding and K. H. Liu, Adv. Mater., 2018, 30, 1702944 CrossRef PubMed.
- L. G. Cancado, A. Jorio, E. H. M. Ferreira, F. Stavale, C. A. Achete, R. B. Capaz, M. V. O. Moutinho, A. Lombardo, T. S. Kulmala and A. C. Ferrari, Nano Lett., 2011, 11, 3190–3196 CrossRef CAS PubMed.
- F. C. Nix and D. MacNair, Phys. Rev., 1941, 60, 597–605 CrossRef CAS.
- S. Das, D. Lahiri, D. Y. Lee, A. Agarwal and W. Choi, Carbon, 2013, 59, 121–129 CrossRef CAS.
- W. Chang, P. T. Wang, Y. Y. Zhao, C. C. Ren, B. N. Popov and C. Li, Surf. Coat. Technol., 2020, 398, 126077 CrossRef CAS.
| This journal is © The Royal Society of Chemistry 2021 |

