 Open Access Article
Creative Commons Attribution 3.0 Unported Licence
Virus removal from drinking water using modified activated carbon fibers†
Kamila Domagała *ab,
Jon Bella,
Nur Sena Yüzbasia,
Brian Sinnetc,
Dariusz Katab and
Thomas Graulea
aLaboratory for High Performance Ceramics, Empa, Swiss Federal Laboratories for Materials Science and Technology, Überlandstrasse 129, Dübendorf, Switzerland. E-mail: kamila.domagala@empa.ch
bFaculty of Materials Science and Ceramics, AGH, University of Science and Technology, Krakow, Poland Faculty of Materials Science and Ceramics, al. Adama Mickiewicza 30, Krakow, Poland
cDepartment of Process Engineering, Eawag, Swiss Federal Institute of Aquatic Science and Technology, Überlandstrasse 133, Dübendorf, Switzerland
First published on 23rd September 2021
Abstract
Activated carbon (AC) exhibits superior sorption properties compared to other porous materials, due to well-developed porous structures and high surface areas. Therefore, it is widely applied in its various forms in water purification to remove a diverse range of contaminating species. The presence of viruses in fresh water bodies poses a serious issue for human health. However, AC has not yet been commonly applied to waterborne virus removal. In this study, we present oxidation and copper impregnation treatment procedures of activated carbon fibers (ACFs) that resulted in porous structure and surface chemistry modifications. The effect of these modifications on virus removal was investigated by experimental flow studies and revealed up to 2.8![[thin space (1/6-em)]](https://www.rsc.org/images/entities/char_2009.gif) log10 reduction value (LRV) and 3.6 LRV of MS2 bacterio-phages for non-modified and oxidized ACFs, respectively, emphasizing the advantages of ACF surface functionalization. Copper modified fibers demonstrated a high sensitivity to media composition, resulting in a release of metal and therefore limited virucidal capacity.
log10 reduction value (LRV) and 3.6 LRV of MS2 bacterio-phages for non-modified and oxidized ACFs, respectively, emphasizing the advantages of ACF surface functionalization. Copper modified fibers demonstrated a high sensitivity to media composition, resulting in a release of metal and therefore limited virucidal capacity.
Introduction
Water is of fundamental importance for the survival of aquatic and terrestrial organisms. Yet, water contamination keeps increasing at an alarming rate, with pathogenic viruses becoming of utmost significance for the World Health Organization (WHO) and are classified as a moderate to high threat to human health.1 This includes enteric viruses, which spread through drinking water and lead to serious diseases and even deaths.1,2 This problem especially concerns developing countries, where there is a lack of access to clean drinking water, in combination with poor sanitation and low hygiene levels, accelerating the spreading of waterborne diseases.2The limitations of water treatment technologies associated with low- and middle income countries can be circumvented by the implementation of centralized treatment plants.3,4 Another promising option is the implementation of point-of-use (POU) systems, which allows water treatment at the consumption point.1 The main disadvantages of such technologies are: regular maintenance, spare parts availability, recontamination risk due to unhygienic handling after treatment and high operational costs.2,4,5 POU systems comprise among others, filtration-based technologies, which removes contamination not only by size exclusion, but also via adsorption.
Adsorbent materials for water technologies should exhibit good chemical and mechanical-stability, a large surface area and a developed porous structure, modified surface chemistry for enhanced adsorbate–adsorbent interactions, fast adsorption kinetics and the potential for reuse-regeneration.6 Adsorbent materials for water treatment might display a naturally developed porous structure or they may require physical or chemical activation in order to optimize the porous structure for a particular adsorption application. Natural adsorbents are those such a s clay minerals,7 natural zeolites,8 oxides9 and biopolymers.10,11 The engineered adsorbents include various carbon derived materials (i.e. activated carbon (AC), carbon fibers, carbon nanotubes and graphene)12,13 and inorganic based materials (such as zeolites (silica or alumina based), layered double hydroxides14 or metal organic frameworks15).6,11 There are typically two modes of operation for adsorption based separation, namely batch adsorption and solid–liquid separation, which includes decantation, filtration and centrifugation.6
Activated carbon is one of the most widely applied adsorbent materials, which is utilized in plethora of different technologies (food processing, industrial waste gas separation, volatile organic compounds removal),16 and also in waste-water and drinking water treatment.17,18 AC in water purification is mainly used in its unmodified or oxidized form for various pollutant removal application, i.e. removal of taste/odor compounds, pesticides, dyes, organic contaminations and heavy metals.11,16,19 AC can also be modified with metal species/metal oxides in order to increase the amount adsorbed of the target species from both the gas and liquid phase.20–23
AC is not commonly used for virus removal, exhibiting rather low affinity towards them.23–26 Conversely, Matsushita et al. reported up to 4![[thin space (1/6-em)]](https://www.rsc.org/images/entities/char_2009.gif) log10 reduction value (LRV) in long-term batch studies using grained powdered activated carbon (PAC).27
log10 reduction value (LRV) in long-term batch studies using grained powdered activated carbon (PAC).27
Activated carbon fibers (ACFs) are characterized by a large adsorption capacity due to a high surface area and a well-defined porous structure (wide pore size distribution), which are important characteristics for water treatment.17,18,28 ACFs exhibit 2–50 times higher adsorption rates compared to other AC forms, such as powder or granular (GAC) activated carbon, due to a smaller diameter, higher microporosity and larger surface area.29 ACFs can be functionalized using several different approaches (e.g. plasma, chemical oxidation) in order to optimize the porous structure and surface chemistry, resulting in an improved sorption capacity for target species.30,31 The ACFs surface can be modified, when functionalization is performed, and characteristics such as roughness and porosity can increase, which effectively leads to an increase in adsorption active sites.30,32 Additionally, incorporated oxygen functional groups increase chemical reactivity and hydrophilicity.30 The advantages of ACFs include low hydrodynamic resistance,16 thermal stability beneficial for material thermal regeneration, as well as a prolonged lifetime, and high Hamaker constant,33 which are important properties for virus particles adsorption and retention.
This study focuses on the development of activated carbon fibers that have undergone surface modification by oxidation treatment, followed by Cu-impregnation under controlled pH conditions. The role of porous structure and surface chemistry on the removal of viruses from contaminated drinking water at the point of consumption have been investigated. The postulate that virucidal copper species34,35 create additional adsorption sites for microbes has been investigated. The applicability of carbon fibers and their composites in virus removal was tested with MS2 bacteriophages, an enteric virus surrogate.36
Experimental
Material preparation
Commercial activated carbon fibers (ACF-1603-20) were purchased from Kynol Europa GmbH, high purity 65% HNO3 from Carl Roth, and Cu(NO3)2·3H2O from Merck. All solutions were prepared in ultrapure water (MicroPure UV System), Thermo Scientific (resistivity 18.2 MΩ cm). Gases were obtained from PanGas: for porous structure characterization CO2 (99.995%), N2 (99.995%) were used; for thermal treatment 2 vol% H2 in Ar and N2 ≥99.995% were used; for samples degassing N2 ≥99.995% was used. Chemicals used for Boehm titrations included 0.05 M HCl, 0.05 M NaOH, Phenolphthalein from Carl Roth, Na2CO3 (p.a. ≥99.7%), NaHCO3 (p.a. ≥99.5%) from Merck. Chemicals used for point of zero charge measurements included: NaCl (p.a. ≥99.0%) from Merck. The chemicals used for the Double Agar Layer method were: CaCl2 (Ph. Eur.) from Merck, C6H12O6, and NH2C(CH2OH)3 from VWR Chemicals, MgSO4·7H2O (p.a. ≥98.0%) from Fluka, Tryptic Soy Agar from Difco, Tryptone and Yeast Extract from Carl Roth.The copper-impregnation was achieved by mixing (200 rpm, stir plate), at room temperature for 24 h, 50 mg of either ACFAR or ACFOX+SOX with 25 mL of different initial concentrations (Cinit: 0.05, 0.1 0.5, 1, 2, 2.5, 5, 10, 20 mmol) of Cu(NO3)2·3H2O solution. ACFs were vacuum filtered (PVDF membrane 0.1 μm, 47 mm, Hawach Scientific Co., Ltd) and the concentration of permeated copper was determined by ICP-MS (ICP-MS 7500CE, Agilent). A series of initial pH conditions (pHinit: unmodified– 4.3, 4.0, 2.0 (only for ACROX+SOX), 1.0) were tested during the adsorption process. The resulting optimal combination of Cu2+ concentration of 20 mmol and pHinit equal to 4.0 were used for the preparation of two composites: (i) Cu-impregnated sample oven-dried at 60 °C (CuACFOX+SOX); (ii) H2 treated sample (HCuACFOX+SOX) at 350 °C under H2/Ar atmosphere for 2 h with heating rate 5 °C min−1 in a tube furnace (GHC 120900, Carbolite Gero GmbH & Co. KG).
Material characterization
Surface group characterization
Carbonaceous structure and morphology
More detailed descriptions of sample preparation and measurement details of particular characterization methods are summarized in the ESI.†
Conditioning and MS2 removal tests of ACFs and composites
 | (1) |
Results and discussion
Characterization of functionalized ACFs
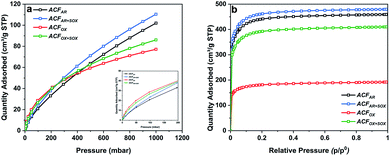
Table S2† summarizes the specific surface areas and porous structure of ACFs assessed by CO2 adsorption at 273 K (Fig. 1a) and N2 at 77 K (Fig. 1b). The Dubinin–Radushkevich equation41 was applied to calculate the micropore volumes (VCO2 <0.7 nm), revealing a high microporosity of the fibers. ACFAR and ACFAR+SOX exhibit a micropore volume equal to 0.108 cm3 g−1, and 0.130 cm3 g−1, respectively, while oxidized samples demonstrate 25% microporosity increase (0.137 cm3 g−1, 0.141 cm3 g−1 for ACFOX and ACFOX+SOX, respectively).According to the IUPAC classification, the N2 adsorption isotherms are type I,42 and the Langmuir equation43 was used to calculate the maximum amount adsorbed and the total pore volume (VN2) of the carbon materials, obtaining 0.453 cm3 g−1 and 0.468 cm3 g−1 for ACFAR and ACFAR+SOX, respectively. Oxidation reduces VN2 to 0.186 cm3 g−1 (ACFOX), while Soxhlet purification causes as light reduction in the N2 total pore volume to VN2 = 0.397 cm3 g−1, compared to the ACFAR sample. Results prove that Soxhlet extraction is opening up the porosity and at the same time does not greatly change the porous structure between purified samples. The micropore radius, calculated based on N2 adsorption, remains almost unchanged and is independent of the treatment, varying around 1 nm. Values obtained for CO2 adsorption revealed an increase of micropore mean radius from 0.26 nm to 0.79 nm for ACFAR and ACFOX, respectively. The details about pore size distribution are enclosed in ESI.†
The specific surface area of ACFAR is equal to 1677 m2 g−1, and this decreased by 60% to 698 m2 g−1 for ACFOX. Such a decrease might be a result of micropore blocking due to newly introduced surface oxygen complexes or formation of humic substances.44,45 Further explanations suggest surface smoothing46,47 or collapse of the pore walls due to the strong treatment conditions used.48 Soxhlet purification significantly increases SSA up to 1652 m2 g−1 for ACFOX+SOX. Elemental analysis results collected in Table 1 reveal significant changes in elemental content. Oxidation led to nearly a 40% carbon decrease and approximately 4 times increase in oxygen content. The nitrogen content increased from 0 (the value below detection limit) to 0.59 wt%, which did not remarkably decrease with the Soxhlet purification. This suggests that nitrogen species are strongly bonded to ACFs and were not removed.
| Carbon sample | EA (wt%) | XPS survey (at%) | |||||
|---|---|---|---|---|---|---|---|
| C | H | N | O | C | O | N | |
| ACFAR | 90.6 | 0.5 | 0.0 | 8.1 | 92.6 | 6.4 | 1.0 |
| ACFAR+SOX | 91.2 | 0.7 | 0.0 | 5.6 | 91.2 | 8.1 | 0.7 |
| ACFOX | 64.8 | 1.1 | 0.6 | 32.9 | 79.5 | 18.3 | 2.2 |
| ACFOX+SOX | 65.0 | 1.0 | 0.4 | 29.7 | 80.6 | 17.6 | 1.8 |
Analysis of XPS Survey spectra (Table 1) reveals a three fold increase in oxygen and two fold increase in nitrogen content after oxidation. Fig. S1† presents the XPS spectra of all ACFs types, while Table 2 shows the analysis of surface functional groups.
| Carbon sample | Components from C 1s profile (at%) | ||||
|---|---|---|---|---|---|
| C sp2 | C–O + C–N | C![[double bond, length as m-dash]](https://www.rsc.org/images/entities/char_e001.gif) O O |
COOH | CO3 | |
| ACFAR | 71.4 | 8.4 | 4.4 | 4.8 | 3.6 |
| ACFAR+SOX | 68.0 | 10.7 | 4.6 | 4.9 | 3.0 |
| ACFOX | 59.4 | 5.9 | 3.3 | 8.8 | 2.2 |
| ACFOX+SOX | 58.9 | 6.5 | 3.3 | 9.8 | 2.1 |
| Carbon sample | Components from O 1s profile (at%) | ||
|---|---|---|---|
OH/C![[double bond, length as m-dash]](https://www.rsc.org/images/entities/char_e001.gif) O O |
COOH/O–C + H2O | O–C![[double bond, length as m-dash]](https://www.rsc.org/images/entities/char_e001.gif) |
|
| ACFAR | 1.4 | 4.0 | 1.0 |
| ACFAR+SOX | 1.0 | 6.6 | 0.5 |
| ACFOX | 6.5 | 10.7 | 1.1 |
| ACFOX+SOX | 6.9 | 9.1 | 1.6 |
| Carbon sample | Components from N 1s profile (at%) | ||||
|---|---|---|---|---|---|
| N–6 (pyridinic) or N–metal, metal–CN | N–5 (pyrrolic) or N–C | (Quaternary) N–Q/NH4+ | (Pyridinic N oxides) N–X/N3+-O, NO2− | N5+–O–C, NO3− | |
| ACFAR | 0.2 | 0.5 | 0.2 | 0.1 | 0.0 |
| ACFAR+SOX | 0.0 | 0.5 | 0.1 | 0.0 | 0.1 |
| ACFOX | 0.1 | 0.3 | 0.4 | 1.2 | 0.2 |
| ACFOX+SOX | 0.2 | 0.4 | 0.4 | 0.8 | 0.1 |
Acid treatment resulted in an increase of carboxylic, hydroxyl and nitrogen functional groups on the ACFs surface. After both treatment steps, a decrease in nitrile groups concentration and increase in concentration of pyridinic oxides: N3+–O–C; NO2− and nitrate (III) groups was noted.45 Results of oxygen content detected with XPS and EA techniques follow the same trend, although XPS only probes the outermost surface, while EA gives the chemical composition of the entire bulk. This indicates that the effect of oxidation is relatively uniform; however, the nitrogen functional groups are more prevalent on the outermost surface, rather than inside fibers porous structure.
Boehm titration results summarized in Table S3† demonstrate an increase of the total amount of functional groups from 0.46 mmol g−1 for ACFAR, to 3.31 mmol g−1 for ACFOX with a significant increase in the concentration of carboxylic groups (2.26 mmol g−1).
Comparison of the pHPZC of fibers, presented in Fig. S2,† shows similar values for as-received fibers: 5.8 and 5.6 for ACFAR, and ACFAR+SOX, respectively. HNO3 treatment resulted in the pHPZC shifting to 1.9 for ACFOX that implies a negative surface charge in aqueous solution, due to the presence of acidic functional groups that release the protons.45 Soxhlet purification slightly decreases the pHPZC to value of 1.5 (ACFOX+SOX).
Raman spectroscopy of ACFs, presented in Fig. S2,† shows the characteristic D (1344 cm−1) and G (1599 cm−1) bands of the analyzed materials: the G band is assigned to graphitic in-plane vibrations with E2g symmetry, while the D band corresponds to the presence of graphitic the defects and disorders.49 Both peaks are very prominent and narrow indicative of a low defective level of the material's carbon structure.50 The second order frequency is split into three bands: G′ (2715 cm−1), D + G (2920 cm−1) and 2D′ (3200 cm−1), suggesting a highly crystalline ordered material.50
Raman spectra are overlapping, indicating that the applied treatment has no significant effect on material structure. Detailed peak analysis (Table 3) confirms almost no difference between the band positions, while the ID/IG intensity ratio slightly decrease within treatment. The ID/IG ratio not only represents the exact change in structure order but also the contribution of heteroatoms introduced during functionalization (O, H, N) that heavily influence the Raman spectra.51
| Carbon sample | ID/IG | AD/AG | WD, cm−1 | WG, cm−1 | D-Peak position, cm−1 | G-peak position, cm−1 |
|---|---|---|---|---|---|---|
| ACFAR | 0.87 | 2.12 | 159.0 | 64.5 | 1344.0 | 1599.0 |
| ACFAR+SOX | 0.82 | 1.81 | 159.0 | 71.7 | 1351.7 | 1600.3 |
| ACFOX | 0.84 | 1.90 | 177.6 | 78.7 | 1352.3 | 1595.7 |
| ACFOX+SOX | 0.92 | 2.08 | 147.0 | 61.6 | 1342.0 | 1599.0 |
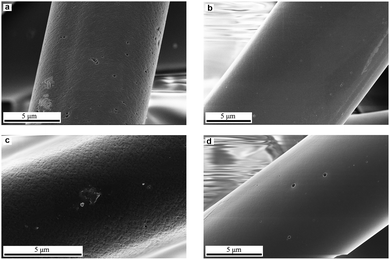
Fig. 2 shows SEM images of the ACFAR and ACFOX. ACFAR exhibit a surface with heterogeneous morphology; as some fibers have a smooth, regular surface while others possess grooves, which could be interpreted as macropores.
The fiber's diameter is in the range 9–18 μm, while length 1.5–4.5 mm. ACFOX SEM images indicate no structural morphological changes, as the fibers exhibit the above-mentioned difference in morphology confirming heterogeneity of the material, even after acid treatment. No change in fibers diameter and length was observed after the oxidation treatment.
Copper-impregnated ACFs
The adsorption of metal ions on AC from aqueous solution is dependent on a number of various factors including metal ion concentration, pH dependent speciation, solution pH, contact time, temperature, amount of carbon used and its surface functionality.52 The amount of metal ions adsorbed on the ACFs surface was determined using the following equation:
 | (2) |
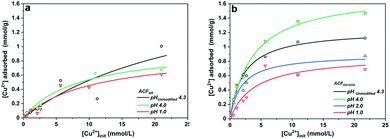
The adsorption of Cu(aq.)2+ onto ACFs can be described by the Langmuir equation,53 Fig. 3 presents the adsorption isotherms for ACFAR and ACFOX+SOX, while the Table S4† shows the parameters derived from Langmuir equation fitting. The adsorption constant (K) is greater for fibers that possess a higher concentration of carboxylic and hydroxide functional groups, while the maximum amount of copper adsorbed (nm) exhibits a strong pH dependence, obtaining higher values when solution pHinit is higher than the fibers pHPZC.
A higher copper uptake was observed for ACFOX+SOX (9.3 wt%) compared ACFAR (4.3 wt%), which was linked to the presence of functional groups (carboxylic and hydroxide groups) and pHPZC,52 also a higher Cinit led to increase in adsorption, due to a greater driving force by a concentration gradient. Adsorption of Cu2+ results in final pH drop, due to the release of hydrogen ions from the surface functional groups indicating an ion exchange mechanism.52,53 This is demonstrated by a clear correlation between the amount of protons released and the amount of copper ions adsorbed for ACFOX+SOX when pHinit > pHPZC (Fig. 4).
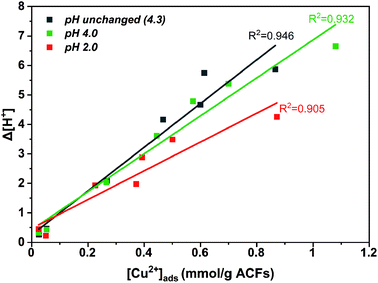 | ||
| Fig. 4 Δ[H+] displacement vs. [Cu2+](ads) adsorbed on functionalized + Soxhlet activated carbon fibers. | ||
This dependence is valid only up to [Cu]init =5 mmol. Furthermore, it is possible that at higher pH values, copper ions are adsorbed to nitrogen functional groups by a coordination mechanism, as at low pH nitrogen groups might be protonated.53 The aforementioned observations indicate that the adsorption is assigned with chemical interactions described by an ion exchange mechanism, involving the displacement of protons after Cu coordination. It suggests that the following surface structures might be formed during copper adsorption:52
| >C–COOH + Cu2+ → C–COOCu+ + H+ | (3) |
| (>C–COOH)2 + Cu2+ → (>C–COO)2Cu + 2H+ | (4) |
>C–OH + Cu2+ → >C![[double bond, length as m-dash]](https://www.rsc.org/images/entities/char_e001.gif) ȮCu+ + H+ ȮCu+ + H+
| (5) |
| >N: + Cu2+H2O → >N–Cu(OH)+ + H+ | (6) |
As-received ACFs did not in display a correlation between desorbed protons and adsorbed copper ions, as they possess insufficient oxygen and nitrogen functional groups for Cu coordination.
These results demonstrate that an enhanced adsorption of aqueous metal ions occurs on ACFs due to functionalization followed by Soxhlet extraction. Thus, the ACFOX+SOX fibers and selected synthesis conditions of [Cu]init = 20 mmol and pHinit equal to 4.0 were used for the preparation of two composites (i) CuACFOX+SOX (Cu-impregnated sample oven-dried at 60 °C) and (ii) HCuACFOX+SOX (Cu-impregnated sample treated at 350 °C under H2/Ar atmosphere). Results of the Cu-composites porous structure characterization are collected in Table S5.† The CO2 adsorption isotherms are shown in Fig. 5a and reveal that for the obtained composites, micropore volume and total pore volume (Fig. 5b) decreased by ∼40–55% in comparison to the ACFOX+SOX, due to pores blockage by adsorbed copper. In the considered pH range, mainly Cu2+ occurs (Fig. S4†), with an ionic radius equal to 0.70 Å,54 the radius of other possible species Cu(H2O)62+ is 0.62–0.94 Å,55 thus it can easily be adsorbed in pores of ACFs. This phenomenon together with other techniques, e.g., Boehm and XPS, allowed for pores and surface analysis, and confirmed copper species adsorption onto ACFs surface and in the pores.
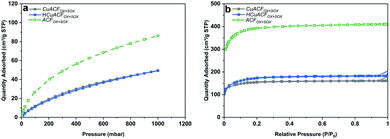 | ||
| Fig. 5 (a) CO2 adsorption isotherms at 273 K; (b) N2 adsorption isotherms at 77 K of activated carbon fibers based composites. | ||
Analysis of the surface chemistry using XPS proves the presence of copper on the ACFs surface and reveals bonding to the oxygen and nitrogen functional groups, but preferentially to the CN groups (Fig. S5 and Table S6†). Additionally, treatment under a H2/Ar atmosphere led to the conversion of the functional groups and changes in copper bonding, as the stability of the functional groups is thermally dependent.56,57
XRD analysis (Fig. S6†) indicates the presence of a Cu phase in HCuACFOX+SOX composite, while the calculated58 crystallite size is equal to 10.5 nm. For the CuACFOX+SOX sample, no copper species were detected, as the metal ions might possibly adsorb mainly in the fiber pores or are not in an amorphous phase. Additional ICP-MS analysis (ESI) of obtained composites revealed a copper content within the samples of 59.7 mgCu g−1 of sample 70.3 mgCu/g of sample for CuACFOX+SOX and HCu ACFOX+SOX, respectively. These results are in accordance with the calculations obtained using eqn (2). The fibers used for synthesis (ACFOX+SOX) contain 0.51 mgCu kg−1 of sample, while ACFOX contains 1.44 mgCu kg−1 of sample.
The pHPZC of CuACFOX+SOX and HCuACFOX+SOX presented on Fig. S7† is equal to 3.4 and 6.9, respectively. The pHPZC was shifted towards higher values due to copper species incorporation, while thermal treatment increased the pHPZC value further. This can be explained due to functional groups decomposition59 and also the presence of copper species with different oxidation states.60
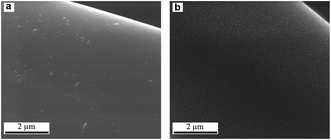
SEM images of composites are depicted in Fig. 6, CuACFOX+SOX exhibits low amount and random distribution of copper species, while in HCuACFOX+SOX sample fibers are uniformly covered by a dense layer of fine Cu particles.61
Stability study of obtained composites
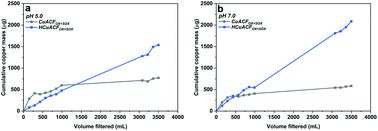
Carbon substrates and composites were rinsed for 24 h with 0.01 M NaCl at pH 5.0 and 7.0, while the copper concentration was monitored in regularly collected permeate samples.Fig. 7a and b‡ shows the dynamic release of copper as a function of filtered volume at pH 5.0 and 7.0. The values represent the cumulative mass of desorbed copper in the total collected permeate volume. It can be observed, that the copper amount released was higher at the beginning, then gradually decreased and saturated for CuACFOX+SOX, while HCuACFOX+SOX exhibited not only a higher level of released copper but also a constant increase with the same ratio over time. The stability of the Cu-composites is affected by media pH, due to enhanced copper solubility under acidic pH values.62
CuACFOX+SOX stability curves saturated after passing ∼3000 mL of solution at both pHs. At pH 5.0, the amount of copper released reached 584 μg, which represents 2 wt% of the total copper content in the sample. At pH 7.0, a 30% increase in copper release was observed in comparison to pH 5.0. The obtained value was 771 μg, which makes up 3 wt% of total copper.
The trend in HCuACFOX+SOX copper release increased progressively with each water volume passed. This indicates either weak copper-fiber bonding or that the stabilization time was too short in order to reach thermodynamic equilibrium. It leads to the conclusion of further or even constant copper release, which demonstrates the destructive impact of thermal treatment onto bonding strength. At pH 5.0, the released copper amount was equal to 2088 μg (7 wt%), while at pH 7.0 it was ∼30–40% lower, reaching 1536 μg, which is equal to 4 wt% of total copper present in the sample.
The presented data indicates the enhanced performance of the CuACFOX+SOX composite and highlights the instability of the HCuACFOX+SOX. An unstable material, such as HCuACFOX+SOX, might have a limited lifetime and pose deleterious health and environmental implications. The presented data indicate that heat treatment of the composite materials results in the conversion of the functional groups59 and re-organization of bonding types between copper and fibers.
MS2 bacteriophage removal test of ACFs and their composites
The MS2 bacteriophages removal studies were conducted after ACFs conditioning. The MS2 concentration was quantified directly after permeate collection (t = 0 h) and again after a 2 hour storage (t = 2 h) period at room temperature. Additionally, the copper concentration in the permeate was measured, to eliminate the effect of continued MS2 inactivation due to metal presence that impacts LRV.12,63ACFAR and ACFOX+SOX
The results of the MS2 removal study at pH 5.5 and 7.3 are shown in Fig. 8a and b‡. ACFAR showed a LRV equal to 2.7 at pH 5.5, while at pH 7.3, the LRV was equal to 1.7. Values recorded at t = 0 h remained almost unchanged in comparison to those obtained after 2 h of storage (t = 2 h): 2.8 and 1.7, respectively. The copper concentration in the permeate was equal to 1.2 μg L−1 at pH 5.5 and 2.0 μg L−1 at pH 7.3, which did not result in additional MS2 inactivation over time.The ACFOX+SOX virucidal performance was 20% higher in comparison to ACFAR, equal to 3.3 LRV at pH 5.5 and 2.1 LRV at pH 7.3, which slightly increased after 2 h of permeate storage to 3.6 LRV at pH 5.5 and 2.4 LRV at pH 7.3, respectively. The permeate Cu concentration was very low – 0.05 and 0.03 μg L−1 at pH 5.5 and 7.3, respectively. The greater virucidal activity of oxidized fibers suggest that the oxidation treatment and the associated changes introduced into material (porosity opening, functional groups presence) are profitable for virus adsorption. Additionally, the higher virus removal at lower pH might be justified by the tendency of MS2 to agglomerate at acidic pH values.64
The virucidal properties presented by ACFAR and ACFOX+SOX were higher than those shown by the granular or powder form of AC. In the filtration test, Hijnen et al. obtained 0.2–0.7 LRV of MS2 bacteriophages for GAC at pilot scale,24 Shimabuku et al. noted 0.32 LRV for 150 g of GAC,23 Gerba et al. reported up to 50% of Poliovirus removal for GAC,26 while Cookson et al. observed <1 LRV.25 In the batch studies, Gerba et al. observed up to 92% of Poliovirus removal for GAC,26 Matsushita et al. noted up to 4 LRV for super-powdered AC, depending on the AC particle size, contact time and solution ionic strength.27
The contribution of following forces were suggested as possible mechanisms responsible for virus removal: electrostatic interactions, van der Waals forces, hydrophobic and steric repulsions.65,66 However, depending on the filtration material specific forces could have higher contribution in virus removal than the other. Adsorption by van der Waals forces are influenced by a fibers great specific surface area and high Hamaker constant.65,67 Well-developed porosity is also profitable, nevertheless the ACFs pores are too small to retain viruses. The higher MS2 removal by ACFAR at pH 5.5 in comparison to pH 7.3 is in accordance with electrostatic adsorption.68 At pH 5.5 electrostatic interactions might dominate the removal process, as the pHPZC of ACFAR is 5.8, while for MS2 is equal to 3.9, therefore surfaces are oppositely charged. At pH 7.3, both fiber and bacteriophage surfaces are negatively charged; hence, electrostatic adsorption is assumed not to be dominant for retention. The same situation occurs at both tested pHs conditions for ACFOX+SOX (pHPZC 1.5), which possess negative charge. Therefore, it can be deduced that there can be other forces responsible for virus removal. The hydrophobic effects can be one of main contributors to virus retention, due to the hydrophobic character of both MS2 and ACFs, that is expected to enhance bacteriophages removal.16,68,69 This is valid for ACFAR; however, the ACFOX+SOX have a greater amount of oxygen functional groups that might change their character to hydrophilic one. Carboxylic groups form intermolecular hydrogen bonds between groups ends when they are protonated, resulting in a decrease in hydrophilicity with pH drop.70,71 Lim et al. discussed the interactions between M13 bacteriophage and different functional groups, indicating that bacteriophages have fewer chances to create hydrogen bonds with carboxylic groups on a short timescale compared to hydroxyl groups at lower pH.70,71 This indicates that the contact time between the ACF material and the microorganism, as well as the type and concentration of oxygen surface functional groups, can significantly alter the physical interactions and is strongly affected by pH.
It can be assumed that MS2 bacteriophages were adsorbed on ACFs surfaces, rather than inactivated, because carbon itself is not recognized to possess antiviral characteristics and to interacts with virus capsid, e.g. carbon is known as a bioinert material applied in implants.72 This presented study did not reveal a strong MS2 adsorption interaction with ACFs, which resulted in facile desorption during further cartridge flushing. Reversible adsorption could be influenced by pH and presence of ions. Therefore, this aspect requires further consideration.68,73
CuACFOX+SOX and HCuACFOX+SOX
A high copper concentration was detected in the permeates, and this could be explained by the presence of a Tris – (tris(hydroxymethyl)aminomethane) buffer used for the preparation of the MS2 test solutions. Tris chelates metal ions, which in this study resulted in an enhanced release of copper from the ACFs Cu-composites, leading to the formation of ligand complexes: Cu(Tris)2+, Cu(Tris)22+, Cu(Tris)42+ or mixed ones,74 as well as destruction of the composites. The stable copper complexes formed with Tris did not interact with the MS2 bacteriophages remaining in the collected permeate. Therefore, further MS2 inactivation over time was not noted. Assuming that the structure of the tested composites was affected, only theoretical explanations of MS2 removal mechanisms can be discussed. Virus removal is due to a contribution of VdW forces, electrostatic adsorption, which occurred for HCuACFOX+SOX at both pHs, as well as, an immediate interactions between copper and MS2 bacteriophages onto the composites surface75–78 that are influenced by copper species oxidation state, morphology (size, shape, distribution).60,79 As a comparison, Shimabuku et al. demonstrated that for 150 g of granular AC modified with 0.5 and 1 w/w% of Cu, a LRV equal to 0.33 and 0.39 LRV respectively.23 GAC modified with Al2O3 resulted in low efficiency of MS2 removal,22 while GAC modified with Ag and CuO exhibited 3 LRV for T4 bacteriophages23This studies proves that fabricated Cu-composites are unstable, because of weak copper-ACFs bonding or removal of copper itself, being exceptionally delicate in water treatment applications, due to its dissolution, interaction or complexation by natural waters compounds.80,81 The copper virucidal properties are indisputable34,35,82 and highly beneficial. However, the copper modified ACFs presented in this study are suggested not to be considered in future studies of water treatment applications due to presence of weak copper–carbon bonds.
Conclusions
ACFs were modified by a combination of HNO3 oxidation and Soxhlet extraction. The process did not markedly affect the structural and morphological features of ACFs and resulted in surface oxidation, functional groups formation, as well as an increase in microporosity. Synthesis of Cu-composites revealed the incorporation of copper onto the fibers' surface, as well as into the porous structure via copper ion exchange mechanism and coordination with surface functional groups followed by displacement of protons.ACFAR and ACFOX+SOX exhibited a great potential towards MS2 bacteriophage removal reaching better virucidal performance (3.6 LRV) than AC in granular or powder forms. Moreover, ACFOX+SOX fibers showed a 20% greater LRV than ACFAR, demonstrating the advantage of ACF surface functional groups incorporation. Further work on ACFs will include applications of higher amount of material, greater volumes of virus solution, bacteriophages that possess different isoelectric point (e.g. ΦX174 or fr)83 and more complex water compositions, e.g. natural organic matter, ions and humic acid, to understand the virial removal capacity and competitive adsorption processes occurring between the target virus and other waterborne species. Copper modified ACFs composites exhibited weak copper-carbon bonds and a high sensitivity to media composition, resulting in a release of metal. Therefore, at the present time, these materials are not suitable for implementation in water purification technologies.
Author contributions
This manuscript was written through contributions of all authors. All authors have given approval to the manuscript final version.Conflicts of interest
There are no conflicts to declare.Acknowledgements
Financial support of this project (private donation) is gratefully acknowledged. The authors also wish to express their gratitude to Ostschweizer Fachhochschule Rapperswil.Notes and references
- WHO, Guidelines for drinking water quality, Geneva, 2011 Search PubMed.
- UNICEF and WHO, Progress on household drinking water, sanitation and hygiene 2000-2017. Special focus on inequalities, 2019 Search PubMed.
- R. Bain, R. Cronk, J. Wright, H. Yang, T. Slaymaker and J. Bartram, PLoS Med., 2014, 11(5), e1001644 CrossRef PubMed.
- C. K. Pooi and H. Y. Ng, npj Clean Water, 2018, 1, 11 CrossRef.
- WHO, Results of round I of the WHO International Scheme to Evaluate Household Water Treatment Technologies, 2016 Search PubMed.
- G. L. Dotto and G. McKay, J. Environ. Chem. Eng., 2020, 8, 103988 CrossRef CAS.
- M. K. Uddin, Chem. Eng. J., 2017, 308, 438–462 CrossRef CAS.
- S. Wang and Y. Peng, Chem. Eng. J., 2010, 156, 11–24 CrossRef CAS.
- M. Sui and L. She, Front. Environ. Sci. Eng., 2013, 7, 795–802 CrossRef CAS.
- J. Sánchez-Martín, J. Beltrán-Heredia and P. Gibello-Pérez, Chem. Eng. J., 2011, 168, 1241–1247 CrossRef.
- E. Worch, Adsorption Technology in Water Treatment, de Gruyter, Berlin, 2012 Search PubMed.
- K. Domagala, C. Jacquin, M. Borlaf, B. Sinnet, T. Julian, D. Kata and T. Graule, Water Res., 2020, 179, 115879 CrossRef CAS PubMed.
- S. C. Smith and D. F. Rodrigues, Carbon, 2015, 91, 122–143 CrossRef CAS.
- K. Grover, S. Komarneni and H. Katsuki, Water Res., 2009, 43, 3884–3890 CrossRef CAS PubMed.
- S. Rojas and P. Horcajada, Chem. Rev., 2020, 120, 8378–8415 CrossRef CAS PubMed.
- R. C. Bansal and M. Goyal, Activated Carbon Adsorption, Tylor & Francis, Boca Raton, 2005 Search PubMed.
- A. K. Haghi, S. Thomas, A. Pourhashemi, A. Hamrang and E. Klodzinska, Nanomaterials and Nanotechnology for Composites: Design, Simulation and Applications, Apple Academic Press Inc, Oakville, 2015 Search PubMed.
- T. Lee, C. H. Ooi, R. Othman and F. Y. Yeoh, Rev. Adv. Mater. Sci., 2014, 36, 118–136 CAS.
- J. Perrich, Activated Carbon Adsorption for Wastewater Treatment, CRC Press, Boca Raton FL, 1981 Search PubMed.
- S. L. Bazana, Q. L. Shimabuku-Biadola, F. S. Arakawa, R. G. Gomes, E. S. Cossich and R. Bergamasco, Int. J. Environ. Sci. Technol., 2019, 16, 6727–6734 CrossRef CAS.
- J. Wang, F. Zhao, Y. Hu, R. Zhao and R. Liu, Chin. J. Chem. Eng., 2006, 14, 478–485 CrossRef CAS.
- B. L. T. Lau, G. W. Harrington, M. A. Anderson and I. Tejedor, Water Sci. Technol., 2004, 50, 223–228 CrossRef CAS PubMed.
- Q. L. Shimabuku, F. S. Arakawa, M. Fernandes Silva, P. Ferri Coldebella, T. Ueda-Nakamura, M. R. Fagundes-Klen and R. Bergamasco, Environ. Technol., 2017, 38, 2058–2069 CrossRef CAS PubMed.
- W. A. M. Hijnen, G. M. H. Suylen, J. A. Bahlman, A. Brouwer-Hanzens and G. J. Medema, Water Res., 2010, 44, 1224–1234 CrossRef CAS PubMed.
- J. T. Cookson and W. J. North, Environ. Sci. Technol., 1967, 1(1), 46–52 CrossRef CAS PubMed.
- C. P. Gerba, M. D. Sobsey, C. Wallis and J. L. Melnick, Environ. Sci. Technol., 1975, 9, 727–731 CrossRef CAS.
- T. Matsushita, H. Suzuki, N. Shirasaki, Y. Matsui and K. Ohno, Sep. Purif. Technol., 2013, 107, 79–84 CrossRef CAS.
- S. Biniak, M. Pakula and A. Swiatkowski, Chemistry and Physics of Carbon A Series of Advances, Marcel Dekker INC., New York, 2001, vol. 27 Search PubMed.
- T. A. Langston and R. D. Granata, J. Compos. Mater., 2014, 48, 259–276 CrossRef.
- S. Tiwari and J. Bijwe, Procedia Technology, 2014, 14, 505–512 CrossRef.
- A. Celzard, A. Albiniak, M. Jasienko-Halat, J. F. Marêché and G. Furdin, Carbon, 2005, 43, 1990–1999 CrossRef CAS.
- L. Wang, N. Liu, Z. Guo, D. Wu, W. Chen, Z. Chang, Q. Yuan, M. Hui and J. Wang, Materials, 2016, 9(3), 206 CrossRef PubMed.
- J. Drzymala, Adv. Colloid Interface Sci., 1994, 50, 143–185 CrossRef CAS.
- G. Borkow, R. W. Sidwell, D. F. Smee, D. L. Barnard, J. D. Morrey, H. H. Lara-Villegas, Y. Shemer-Avni and J. Gabbay, Antimicrob. Agents Chemother., 2020, 51, 7 Search PubMed.
- K. Sunada, M. Minoshima and K. Hashimoto, J. Hazard. Mater., 2012, 235–236, 265–270 CrossRef CAS PubMed.
- W. Grabow, Water SA, 2001, 27, 251–268 Search PubMed.
- M. V. Lopez-Ramon, F. Stoeckli, C. Moreno-Castilla and F. Carrasco-Marin, Carbon, 1999, 37, 1215–1221 CrossRef CAS.
- A. M. Oickle, S. L. Goertzen, K. R. Hopper, Y. O. Abdalla and H. A. Andreas, Carbon, 2010, 48(12), 3313–3322 CrossRef CAS.
- K. Domagala, M. Borlaf, J. Traber, D. Kata and T. Graule, Mater. Lett., 2019, 253, 272–275 CrossRef CAS.
- EPA, Method 1602 : Male-specific (F+) and Somatic Coliphage in Water by Single Agar Layer (SAL) Procedure April 2001, EPA Document 821-R-01-029, 2001 Search PubMed.
- M. M. Dubinin, Carbon, 1983, 21, 359–366 CrossRef CAS.
- IUPAC, Pure Appl. Chem., 1994, 66, 1739–1758 Search PubMed.
- I. Langmuir, J. Am. Chem. Soc., 1916, 38, 2221–2295 CrossRef CAS.
- B. K. Kim, S. K. Ryu, B. J. Kim and S. J. Park, J. Colloid Interface Sci., 2006, 302, 695–697 CrossRef CAS PubMed.
- P. Chingombe, B. Saha and R. J. Wakeman, Carbon, 2005, 43, 3132–3143 CrossRef CAS.
- M. A. Álvarez-Merino, V. López-Ramón and C. Moreno-Castilla, J. Colloid Interface Sci., 2005, 288, 335–341 CrossRef PubMed.
- J. Jang and H. Yang, J. Mater. Sci., 2000, 35, 2297–2303 CrossRef CAS.
- C. Moreno-Castilla, F. Carrasco-Marín, F. J. Maldonado-Hódar and J. Rivera-Utrilla, Carbon, 1998, 36, 145–151 CrossRef CAS.
- G. Zhang, S. Sun, D. Yang, J. P. Dodelet and E. Sacher, Carbon, 2008, 46, 196–205 CrossRef CAS.
- A. Cuesta, P. Dhamelincourt, J. Laureyns, A. Martínez-Alonso and J. M. D. Tascón, Carbon, 1994, 32, 1523–1532 CrossRef CAS.
- J.-S. Roh, Carbon Letters, 2008, 9, 127–130 CrossRef.
- S. Biniak, M. Pakuła, G. S. Szymański and A. Świątkowski, Langmuir, 1999, 15, 6117–6122 CrossRef CAS.
- B. Xiao and K. M. Thomas, Langmuir, 2005, 21, 3892–3902 CrossRef CAS PubMed.
- Ö. Yavuz, Y. Altunkaynak and F. Güzel, Water Res., 2003, 37, 948–952 CrossRef PubMed.
- I. Persson, Pure Appl. Chem., 2010, 82, 1901–1917 CAS.
- V. Bernal, L. Giraldo and J. Moreno-Piraján, C, 2018, 4(4), 62 CAS.
- G. De La Puente, J. J. Pis, J. A. Menéndez and P. Grange, J. Anal. Appl. Pyrolysis, 1997, 43, 125–138 CrossRef CAS.
- A. L. Patterson, Phys. Rev., 1939, 56, 978–982 CrossRef CAS.
- S. Kundu, Y. Wang, W. Xia and M. Muhler, J. Phys. Chem. C, 2008, 112, 16869–16878 CrossRef CAS.
- J. M. Mazurkow, N. S. Yüzbasi, K. W. Domagala, S. Pfeiffer, D. Kata and T. Graule, Environ. Sci. Technol., 2020, 54, 1214–1222 CrossRef CAS PubMed.
- A. Ibrahim, S. Akhtar, M. Atieh, R. Karnik and T. Laoui, Carbon, 2015, 94, 369–377 CrossRef CAS.
- B. Beverskog and I. Puigdomenech, J. Electrochem. Soc., 1997, 144, 3476–3483 CrossRef CAS.
- T. A. Dankovich and J. A. Smith, Water Res., 2014, 63, 245–251 CrossRef CAS PubMed.
- S. Watts, T. R. Julian, K. Maniura-Weber, T. Graule and S. Salentinig, ACS Nano, 2020, 14, 1879–1887 CrossRef CAS PubMed.
- A. Armanious, M. Aeppli, R. Jacak, D. Refardt, T. Sigstam, T. Kohn and M. Sander, Environ. Sci. Technol., 2016, 50, 732–743 CrossRef CAS PubMed.
- H. Malte, Colloids Surf., B, 1999, 14, 105–119 CrossRef.
- S. Maurer, A. Mersmann and W. Peukert, Chem. Eng. Sci., 2001, 56, 3443–3453 CrossRef CAS.
- R. C. Bales, S. R. Hinkle, T. W. Kroeger, K. Stocking and C. P. Gerba, Environ. Sci. Technol., 1991, 25, 2088–2095 CrossRef CAS.
- J. F. Schijven and S. M. Hassanizadeh, Crit. Rev. Environ. Sci. Technol., 2000, 30, 49–127 CrossRef CAS.
- N. Winter, J. Vieceli and I. Benjamin, J. Phys. Chem. B, 2008, 112, 227–231 CrossRef CAS PubMed.
- C. Lim, J. Ko, D. Jeon, Y. Song, J. Park, J. Ryu and D. W. Lee, Chem. Commun., 2019, 2, 1–9 CrossRef CAS.
- T. Thamaraiselvi and S. Rajeswari, Carbon, 2004, 24, 172 Search PubMed.
- R. C. Bales, S. Li, K. M. Maguire, M. T. Yahya and C. P. Gerba, Water Resour. Res., 1993, 29, 957–963 CrossRef.
- B. E. Fischer, U. K. Haering, R. Tribolet and H. Sigel, Eur. J. Biochem., 1979, 94, 523–530 CrossRef CAS PubMed.
- R. Martin and Y. Mariam, in Metal Ions in Biological Systems, ed. H. Sigel, Marcel Dekker, New York, vol. 8, 1979 Search PubMed.
- D. Hutchinson, Antiviral Res., 1985, 5, 193–205 CrossRef CAS PubMed.
- K. Wong, A. R. Morgan and W. Paranchych, Can. J. Biochem., 1974, 52, 950–958 CrossRef CAS PubMed.
- R. B. Thurman and C. P. Gerba, Crit. Rev. Environ. Control, 1989, 18, 295–315 CrossRef.
- L. Xiong, H. Yu, C. Nie, Y. Xiao, Q. Zeng, G. Wang, B. Wang, H. Lv, Q. Li and S. Chen, RSC Adv., 2017, 7, 51822–51830 RSC.
- T. R. Holm, Chem. Speciation Bioavailability, 1990, 2, 63–76 CrossRef CAS.
- J. D. Hem, Study and interpretation of the chemical characteristics of natural water, US Geological Survey Water-Supply Paper, Alexandria, 3rd edn, 1985, vol. 2254 Search PubMed.
- H. Pang, F. Gao and Q. Lu, Chem. Commun., 2009, 1076–1078 RSC.
- J. Heffron, B. McDermid, E. Maher, P. J. McNamara and B. K. Mayer, Water Res., 2019, 163, 114877 CrossRef CAS PubMed.
Footnotes |
| † Electronic supplementary information (ESI) available. See DOI: 10.1039/d1ra06373a |
| ‡ The presented data come from duplicate measurements, statistics and standard error cannot be presented. The results of both tests rounds are comparable. |
| This journal is © The Royal Society of Chemistry 2021 |

