 Open Access Article
Investigation on optical temperature sensing behaviour via Ag island-enhanced luminescence doped β-NaGdF4:Yb3+/Tm3+ films/microfibers†
Muhammad Khuram Shahzad *ab,
Usman Farooqc,
Adil Razad,
Ghulam Abbase,
Muhammad Ikram
 f and
Yundong Zhangb
aInstitute of Physics, Islamia University of Bahawalpur, Bahawalnagar Campus, Pakistan. E-mail: khuram_chukhia@yahoo.com
bNational Key Laboratory of Tunable Laser Technology, Institute of Opto-Electronics, Department of Electronic Science and Technology, Harbin Institute of Technology (HIT), Harbin 150080, China. E-mail: ydzhang@hit.edu.cn
cSchool of Chemistry and Chemical Engineering, Henan University, Kaifeng, China
dJiangsu Key Laboratory of Materials and Technology for Energy Conversion, College of Materials Science and Technology, Nanjing University of Aeronautics and Astronautics, Jiangjun Rd. Campus, 29 Jiangjun Ave., Nanjing 210016, P. R. China
eDepartment of Physics, Riphah International University, Faisalabad Campus, Pakistan
fSolar Cell Applications Research Lab, Department of Physics, Government College University, Punjab 54000, Pakistan
First published on 11th November 2021
Abstract
In this study, silver (Ag) island modified up-conversion nano-particle (NaGdF4:Yb3+/Tm3+) thin films were prepared via electrostatic layer by layer (LBL) and spin coating techniques. The spectroscopic results indicated that adding Ag nanoparticles could significantly enhance the up-conversion emission of NaGdF4:Yb3+/Tm3+ thin films at 452 nm and 476 nm. The maximum enhancement factor of ∼15.6 was reached at 476 nm. Furthermore, we prepared microfibers from upconverting nanoparticles solution, the application of microfibers as active and passive waveguides was analyzed by observing the performance of microfibers with and without Ag under 980 nm excitation of the laser source. The fluorescence intensity ratio (FIR) method was adopted to evaluate microfiber sensitivity. The intensity-based temperature sensitivity of blue emission from a single microfiber containing up-conversion nanomaterials (NaGdF4:Yb3+/Tm3+) and Ag nanoparticles reached up to 0.018 K−1 at 310 K compared to 0.0029 K−1 in Ag-free microfiber. Our results suggest that the novel material can be used to construct new nano-thermometers, useful both in biological experiments as well as industrial research.
1. Introduction
Recently, there has been a surge in scientific interest in fluorescence, which has resulted in numerous applications such as fluorescence sensing, flat panel displays, and light amplification.1–3 The temperature-dependent luminescent behaviour, fluorescence sensing and a noncontact measurement procedure have been analyzed by different research groups.4,5 Generally, sensitizer ions (such as Yb3+) are doped in different host materials and used in thermometry with activator ions (Er3+, Ho3+, and Tm3+). In comparison to activators, the absorption cross-section area of Yb3+ is larger under 980 nm laser source excitations. Therefore, ytterbium (Yb3+) is used as a sensitizer to transfer efficient energy to Tm3+ ions due to the higher absorption cross-section area at the 980 nm laser source. Tm3+ is considered a good candidate for thermal sensing applications due to its high luminescent quenching concentration and abundant energy level for temperature sensing.6–8 Many studies have examined its temperature-dependent luminescent behavior, including its variation in intensity behavior, and have utilized it to fabricate microfibers via up-converting nanomaterials.9,10 Therefore, various researchers have preferred NaGdF4:Yb3+/Tm3+ nanomaterials because of their high photochemical stability, thermal stability, low phonon energy, low toxicity, and highly luminescent efficiency. As such, NaGdF4 is considered one of the outstanding host nanomaterials for thermal sensing.11 However, powder forms of up-converting nanocrystals are oxidized easily at high temperatures, limiting the use of up-conversion nano-particles in different applications.A scheme of thin fluorescent films and fabricated microfibers have been utilized to mitigate these problems in thermal sensing of traditional powders.12 It has the advantages of greater uniformity, a suitable adhesive and higher resolution. Thin films have high light transmittance and low luminescence intensity, which pose considerable thermal sensing challenges. For instance, metal nanoparticles (gold and silver) were mixed with phosphor to upgrade the up-conversion (UC) luminescence of fluorescent films. When the light of a particular wavelength illuminates the nanoparticles, the electromagnetic (EM) field around the surface of nanoparticles increases significantly.
The EM field can extend the fluorescence of the up-conversion nanomaterials (NaGdF4:Yb3+/Tm3+) at a designated point, which is known as metal-enhanced fluorescence (MEF).13 Some results have still been described, focusing on metallic nanoparticles (NPs) with UC materials mainly utilized in the thin film. Moreover, cost-effective and straightforward technique of metal co-doped UC nanoparticles used within the microfibers remains limited.14–16 We investigated the thin film of up-conversion nano-crystal with silver (Ag) and utilized it in microfibers as an idea for temperature sensing. Thus, exploiting metal and up-conversion nanoparticles (UCNPs) across thin films and using them inside the microfibers is designated for transmission losses and thermal sensing behaviour. In this work, silver nanoparticles (Ag NPs) are selected to enhance the luminescence of up-conversion nanomaterials (NaGdF4:Yb3+/Tm3+) films while maintaining impressive stability in average environment temperature. The spectroscopic analysis contributes to good results about highly spectral-dependent luminescence due to the presence of resonance frequency of Ag islands, which is located at 476 nm. As such, the enhancement factor (15.6) is achieved at 476 nm. Moreover, transmission losses of silver and non-silver doped microfibers are investigated. We analyzed the intensity-dependent luminescence of NaGdF4:Yb3+/Tm3+ of microfibers with and without Ag islands. The results at room temperature reveal that the presence of Ag causes a substantial increase in intensity-dependent temperature sensitivity. These analyses will offer a worthy approach to enhance thermal sensitivity.
2. Experimental section
2.1 Materials
Oleic acid (OA), ethanol, silver (Ag) powder, ammonium fluoride (NH4F), sodium hydroxide (NaOH), cyclohexane (C6H12), 1-octadecene (ODE), polydimethyl diallyl ammonium chloride (PDDA), polymethylmethacrylate (PMMA) and chloroform (CHCl3) were purchased from Beijing Chemical Company, China and used without any further purification.2.2 Sample preparation
A hydrothermal procedure was used for the preparation of upstream nanoparticles (β-NaGdF4:Yb3+/Tm3+).17 Rare-earth ions (RE3+) of LnCl3 (Ln = Yb, Tm, Gd) with molar ratios of 18![[thin space (1/6-em)]](https://www.rsc.org/images/entities/char_2009.gif) :
:![[thin space (1/6-em)]](https://www.rsc.org/images/entities/char_2009.gif) 2
2![[thin space (1/6-em)]](https://www.rsc.org/images/entities/char_2009.gif) :
:![[thin space (1/6-em)]](https://www.rsc.org/images/entities/char_2009.gif) 80 were added to a 100 mL three-necked flask. This flask contained 6 mL of OA and 15 mL of 1-octadecene (ODE). The pellucid solution was obtained by heating the mixture at 150 °C. After it cooled down to room temperature, dissolved oxygen and residual water were removed from the solution. Then, 10 mL of a methanol solution containing NaOH (2.5 mmol) and NH4F (4 mmol) was added to the flask. The prepared solution was stirred for 30 minutes to ensure complete dissolution of all fluorides. Furthermore, the solution was heated up to 300 °C, at a rate of 40 °C min−1. Subsequently, the solution was retained at 300 °C for one hour under argon (Ar) atmosphere. The precipitates were cooled down to room temperature and centrifuged at 6000 rpm. Lastly, ethanol was used to wash the precipitate several times and dried at 60 °C in the air for 12 hours to obtain the required sample.
80 were added to a 100 mL three-necked flask. This flask contained 6 mL of OA and 15 mL of 1-octadecene (ODE). The pellucid solution was obtained by heating the mixture at 150 °C. After it cooled down to room temperature, dissolved oxygen and residual water were removed from the solution. Then, 10 mL of a methanol solution containing NaOH (2.5 mmol) and NH4F (4 mmol) was added to the flask. The prepared solution was stirred for 30 minutes to ensure complete dissolution of all fluorides. Furthermore, the solution was heated up to 300 °C, at a rate of 40 °C min−1. Subsequently, the solution was retained at 300 °C for one hour under argon (Ar) atmosphere. The precipitates were cooled down to room temperature and centrifuged at 6000 rpm. Lastly, ethanol was used to wash the precipitate several times and dried at 60 °C in the air for 12 hours to obtain the required sample.
2.3 Preparation of NaGdF4:Yb3+/Tm3+ thin films with Ag islands
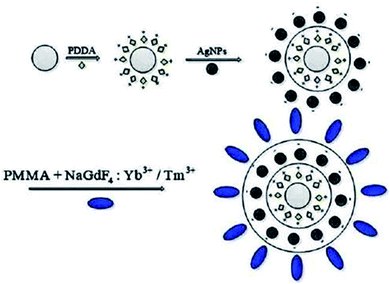
In order to modify the quartz plate, we used an electrostatic layer-by-layer (LBL) technique. Fig. 1 depicts the procedure of fabrication of NaGdF4:Yb3+/Tm3+/Ag thin films. Firstly, the quartz plate was immersed in a polydimethyl diallyl ammonium chloride (PDDA, 0.4 mol L−1) aqueous solution for 70 minutes at room temperature. As a result, a positive charge was induced on the quartz plate. Afterward, the quartz plate was cleaned thrice with de-ionized water. Secondly, to deposit Ag islands on the modified quartz plate, the quartz plate was immersed in the Ag NP solution for 12 h. Then, sequential alternate adsorption of PDDA layers and silver (Ag) layers was performed by applying the same procedure. Also, 0.05 g of β-NaGdF4:18%Yb3+/2%Tm3+ was dispersed in 15 mL of CHCl3, and then 0.6 g of polymethylmethacrylate (PMMA) was dissolved in 30 mL of cyclohexane. PMMA solution was gradually to up-converting nanoparticles and this sample was sonicated for 40 minutes to get a mixture. As a result, a transparent material was obtained. NaGdF4:Yb3+/Tm3+ thin films (the Ag island-modified quartz plate) were prepared using the spin-coating method. Finally, as-synthesized thin films were used for further study after half an hour of the drying process.2.4 Preparation of UCNPs-microfibers
A simple drawing procedure was adopted to fabricate up-converting nanoparticles microfibers in this experiment. During the process, 0.007 g of β-NaGdF4:18%Yb3+/2%Tm3+ was dispersed in 12 mL of chloroform solution and then 0.7 g of PMMA was dissolved in 22 mL of cyclohexane solution. In the next step, the PMMA solution was poured slowly into the UCNPs solution and the final transparent material stock was prepared after sonication of the mixed sample for up to 40 minutes. We fabricated the fiber tip of up to several microns using a flame-heated fiber machine. The uniformly mixed solution was put into the concave dish, the fiber tip was dipped into the solution and then pulled out quickly to prepare microfibers. Finally, as-prepared microfibers were placed on a silicon substrate, and using a dual fiber tip, the microfibers were divided into small ones. Fig. 2a shows the drawing process of microfibers from the composition of Ag and without Ag-doped UCNPs. By applying this setup, microfibers of various diameters could be obtained by changing the pulling speeds.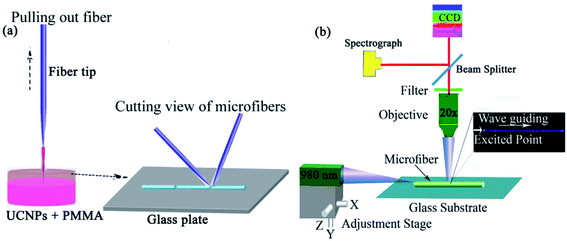 | ||
| Fig. 2 (a) Schematic for the preparation of microfiber, and (b) optical characteristics of the as-synthesized microfiber. | ||
2.5 Optical characteristics of UC-microfibers
The optical properties of microfibers were studied using a compound microscope. The experimental setup is illustrated in Fig. 2b. The microfibers were deposited on a glass plate and a 980 nm laser source via the fiber tip was used to illuminate the microfiber.Transmission losses of microfibers were measured using ×10 (NA = 0.25) and ×20 (NA = 0.65) objectives. A charge-coupled device camera was used to record the emission spectra of microfibers. Furthermore, we measured temperature-sensing luminescence of microfibers at different positions and various temperatures, UC luminescence spectra of microfiber were recorded using an ocean optics (QE Pro) spectrometer. Photoluminescence (PL) properties were studied by exciting different diameters of microfibers at different locations using a 980 nm laser source. But, a 980 nm filter was used to remove the reflection of pumped light. So, the microfiber showed strong blue UCPL emission upon illumination with laser light.
3. Results and discussions
3.1 Surface morphology and spectral characteristics of the NaGdF4:Yb3+/Tm3+ thin film with and without Ag
In order to understand the topography of NaGdF4:Yb3+/Tm3+ thin films with and without Ag islands, atomic force microscopy (AFM) (model: Dimension Icon, Japan) under the tapping mode was used. Moreover, energy dispersive spectrometry (EDS) was performed for elemental analysis. The elemental analyses and surface appearances of NaGdF4:Yb3+/Tm3+ thin films with and without Ag islands are shown in Fig. 3. Fig. 3a shows a minimal difference in the surface roughness between NaGdF4:Yb3+/Tm3+ thin films with and without the Ag islands. | ||
| Fig. 3 (a) AFM images of with and without Ag-doped UCNPs and (b) EDS spectrum of NaGdF4:Yb3+/Tm3+ thin films with Ag islands. | ||
The results indicated that the presence of Ag NPs does not affect the surface morphology of NaGdF4:Yb3+/Tm3+. The EDS spectrum is shown in Fig. 3b, which confirmed that the Ag NPs were coated with a NaGdF4:Yb3+/Tm3+ layer. The detailed surface SEM images of the thin film of NaGdF4:Yb3+/Tm3+ without Ag and NaGdF4:Yb3+/Tm3+ with Ag are shown in Fig. S1.† Moreover, the surface SEM and TEM images of microfibers doped with NaGdF4:Yb3+/Tm3+/Ag are also shown in Fig. S2.† We analyzed UV-Vis absorption spectra of Ag islands ranging from 370 nm to 700 nm. The results displayed a strong absorption peak at 468 nm, which is very close to blue emission bands (452 and 476 nm) of NaGdF4:Yb3+/Tm3+ thin films shown in Fig. 4a. SEM images of microfibers with a diameter of 2.8 μm with smooth surfaces are shown in Fig. 4b. These inspections show that up-conversion nanoparticles are well defined and dispersed homogeneously in a microfiber. Fig. 4c depicts a TEM image of nanocrystals indicating a uniform distribution of the Ag clusters. Furthermore, Fig. 5a shows fluorescence spectra of NaGdF4:Yb3+/Tm3+ thin films for both cases. Fig. 5b compares the luminescence of NaGdF4:Yb3+/Tm3+ thin films with and without Ag islands. The fiber laser (980 nm) irradiation was used to excite the samples. It was found that the luminescence of NaGdF4:Yb3+/Tm3+ thin films was significantly enhanced due to the presence of Ag islands.
 | ||
| Fig. 4 (a) UV-Vis absorption spectrum of Ag (b) SEM micrographs of NaGdF4:Yb3+/Tm3+ doped with Ag. (c) TEM images of NaGdF4:Yb3+/Tm3+ Ag islands. The dark spot represents Ag clusters. | ||
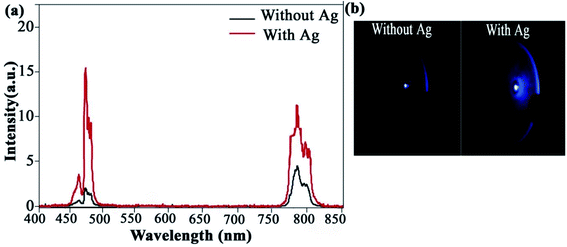 | ||
| Fig. 5 (a) Fluorescence spectra of NaGdF4:Yb3+/Tm3+ thin films centered with and without Ag at 476 nm, (b) luminescence of NaGdF4:Yb3+/Tm3+ thin films with and without Ag. | ||
The enhancement factors at 476 nm and 452 nm can reach 15.6 and 4.4, respectively. The absorption spectrum of the Ag islands was measured from 400 to 800 nm. It can be seen that there was a strong absorption peak at 468 nm, which was very close to the blue emissions (476 and 452 nm) from NaGdF4:Yb3+/Tm3+ thin films. When NaGdF4:Yb3+/Tm3+ thin films are modified with Ag islands, the emissions from the thin films are strengthened dramatically due to surface plasma resonance (SPR) of Ag islands. When the field is confined in nanometric metallic structures under the form of localized surface plasmon resonance (LSPR), it is possible to have strong electromagnetic (EM) field amplification achieved with surface plasmon resonances.18,19 Moreover, there are two ways to describe the up-conversion fluorescence enhancement of metallic nanoparticles through surface plasmon resonance (SPR). In the first approach, the resonance wavelength is matched with the absorption wavelength (∼980 nm). This method is called the absorption-matched resonance. In the second approach, the resonance wavelength is matched to the emission wavelength. This technique is known as the emission-matched resonance. These mechanisms have been recently reported in the literature.20–23 In the case of emission-matched resonances, either the emission enhancement (based on the increase in the radiative rate)24 or the emission quenching (depends on the increase in the non-radiative rate)25 may occur. Here, the resonance wavelength of the Ag islands overlaps with the blue emissions from NaGdF4:Yb3+/Tm3+ thin films, indicating that the blue emission enhancement is caused by the emission-matched resonance.
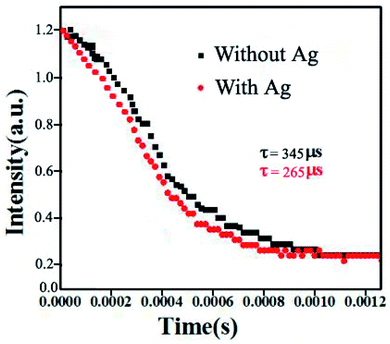
In this work, the resonance wavelength of Ag islands overlaps with the blue emissions from NaGdF4:Yb3+/Tm3+ thin films, which indicates that the blue emission enhancement belongs to emission-matched resonance. The increase in the radiative rate coincides with a decrease in the lifetime of the enhancement emission. The lifetime of blue emissions centered at 476 nm decreases from 345 to 265 μs when thin films are modified with silver nanoparticles, which can be seen in Fig. 6. It confirms that the enhancement of blue emissions is attributed to the increase in the radiative rate.26
3.2 Transmission loss of Ag and without Ag-doped microfibers
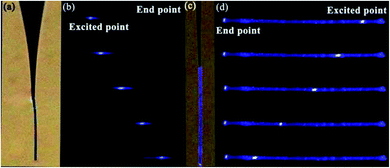
The relation between the propagation distance and the guiding loss of microfiber is essential in analyzing the waveguiding performance. Therefore, a microfiber was excited under dark and brown backgrounds to discuss the up-conversion luminescence phenomena of the nanocrystals. Fig. 6a demonstrated that the Ag-free microfiber was excited under brown background at an upper limit of 980 nm, and it appears that allows light to transmit similarly. Then, the microfiber (diameter ∼10.5 μm) consisting of PMMA and nanocrystals was exposed to a laser source in the presence of black background. Fig. 7a represents the emission of blue light with two bright endpoints, which act as an optical waveguide. This shows that the microfiber absorbs the laser light and transmits it to the end spots of microfibers. Similarly, Fig. 7b reveals that a microfiber with diameter ∼14.6 μm was excited at different positions with a 980 nm source. It demonstrates that the emission of blue light toward endpoints appears to be equal. Taking image illumination into account, the luminescent intensity of exciting points versus endpoints was calculated. It investigated the waveguiding performance of microfibers quantitatively.27 Spot images were converted from RGB to grayscale using the Adobe Photoshop software. Matlab was used to calculate the corresponding intensities based on gray values. The photoluminescence intensity of endpoints was normalized in comparison to exciting points, and as a result, decay curves of dependent propagation distance of the guided normalized intensity were attained. The transmission loss can be calculated using the following equation.28
 | (1) |
According to eqn (1), the photoluminescence intensity decreases exponentially as the distance from the exciting spot increases. Fig. 8a depicts the relationship between the photoluminescence intensity and the guiding distance of the microfiber with a diameter of 10.5 μm. The calculated loss coefficient was α = 160.8806 cm−1 with different exciting points. Similarly, Fig. 8b shows that the transmission loss coefficient of the microfiber (diameter 14.6 μm) was about 100.480 cm−1. Self-absorption and Rayleigh scattering are sources of losses attributed to the absorption of light in the microfibers. The results in the study indicate that the waveguiding performance of microfibers is quite similar to that reported previously.29,30
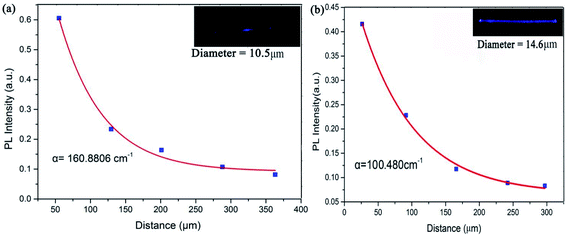 | ||
| Fig. 8 Transmission losses of NaGdF4:Yb3+/Tm3+ doped microfiber (a) diameter 10.5 μm and (b) diameter 14.6 μm. | ||
3.3 Intensity-dependent thermal sensitivity of NaGdF4:Yb3+/Tm3+ doped with and without Ag microfibers
The UC nanocrystals showed emission spectra with fiber laser excitation in microfibers with and without Ag. Fig. 9a and 10a show emission spectra ranging from 400 nm to 850 nm with and without Ag, respectively. The emission spectra were collected at 10 °C intervals within different thermal regions, i.e., 300–390 K. To avoid thermal effects, the power of 1.5 mW was employed. Interestingly, all the emitted intensities were found to decrease with increasing temperature and intensity of luminescence, revealing temperature-independent behaviour. Furthermore, the thin film was radiated conversely (390–300 K) and all luminescence reversed back to its original position. The intensity of each emission band decreases as temperature rises and vice versa. So, this decrease in intensity is attributed to multi-phonon relaxation escalation. The range in relative intensity is related to diverse multi-phonon relaxation rates, and the results are in agreement with those from the literature. Typically, irradiation generates heat energy located in spots close to the irradiated area.31 An ordinary thermal sensor was applied to observe any sudden changes in temperature at the measured points. This thermal sensor is intended to accurately calculate the temperature of the selected points. For thermal calculations, the fluorescence intensity ratio (FIR) process is a very suitable and well-known method.32 For the thin film without Ag-doping, two blue emission bands dominate the UC spectra and are located at 452 and 476 nm. The pair of levels arising from rare-earth ions (RE) is non-thermally coupled levels (NTCL), which can appear between homogeneous or inhomogeneous RE elements. The FIR technique consists of analyzing the fluorescence intensity of non-thermally coupled energy levels to determine the temperature of the material. The energy gap between 1D2 and 1G4 levels (ΔEDG ∼ 6476 cm−1) does not exist between 200–2000 cm−1 and therefore, the FIR originates from non-thermally coupled levels (1G4/3H6 (476 nm) and 1D2/3F4 (452 nm)) of Tm3+ transitions. These non-thermally coupled energy levels (NTCL) are closely separated and are in thermal equilibrium. Due to this energy gap between these levels, the atoms in the lower level can be promoted to the upper level with the increase in temperature through non-radiative mechanisms.33 Thus, the relative population of the upper and lower level changes such that the intensity of the emission band associated with the transition from the upper-level increases, while that from the lower level decreases as can be seen in Fig. 9a, where the 452 nm band corresponds to the former and the 476 nm band to the latter. In order to further analyze the temperature performances of the phosphor, the relationship between the FIR and temperature based on the NTCL (1D2 → 3F4 and 1G4 → 3H6) of Tm3+ ions was investigated. For these levels, FIR having Tm3+/Yb3+ can be expressed as follows.34,35
 | (2) |
 | (3) |
 | ||
| Fig. 9 (a) Up-converting emission spectra of thin-film without Ag under 980 nm excitation source, (b) the fitted curve is given by eqn (2) to the dependence of FIR on temperature, (c) experimental data fitted between sensitivity (K−1) and temperature (K) of Tm3+ doped material. | ||
In eqn (3), Sr is the relative sensitivity of Tm3+-doped free microfiber. The temperature sensing curve of Ag undoped fiber is plotted according to the above-mentioned relationship. Numerical values of FIR, T, ΔE and k are derived from the fitting curves, as shown in Fig. 9b. While Fig. 9c illustrates the sensitivity graph, and the maximum value of sensitivity was attained around 0.0029 K−1 at 310 K.
Moreover, an Ag-doped microfiber for sensing application was used to investigate the temperature sensing accuracy. The UC spectra were calculated at room temperature using a 1.5 mW excitation source. The Ag-doped FIR of 476 and 452 nm emission levels were assessed individually from the above-measured UC spectrum (Fig. 10b). Eqn (2) was used to fit the experimental data. While Fig. 10b shows a linear increase in FIR when temperature increases. Therefore, Ag-doped microfiber was excited by a 980 nm laser source, which is required for typical strong regular configuration. The lasing-induced thermal effect was considered and discussed for thermal sensitivity measurement by using Ag-doped microfiber. Two emission lines at 476 nm and 452 nm were located at non-thermally coupling levels due to the mismatching of the energy gap (200–2000 cm−1) between them.38 The fluorescence intensity ratio was attained from 1G4 → 3H6 and 1D2 → 3F4 of Ag-doped microfibers within non-thermally coupled levels and the temperature sensitivity curve was obtained using eqn (3).
The relative sensitivity of Ag-doped NPs (Sr) is calculated and plotted in Fig. 10c ranging from 300 K to 380 K. The maximum value of Sr is about 0.018 K−1 achieved at 310 K. We compared our derived results with another different host matrix. Table 1 shows that the maximum Sr with Ag-doped microfibers is comparatively higher than that of another Tm3+-based system. It means that Ag-doped NPs in the microfiber can be used for different potential applications to design thermal sensors. Hence, this study indicates that temperature sensing Ag-doped microfiber is relatively more sensitive than powder form of Tm3+ materials. Thus, Ag-doped microfiber has the potential to be used in the design of thermal sensing units.
| Phosphor | Maximum sensitivity (K−1) | Temperature range (K) | References |
|---|---|---|---|
| Yb3+/Er3+ (NaYF4) | 0.0008 | 293–353 | 39 |
| Yb3+/Tm3+ (PbF2 glass ceramics) | 0.0006 | 293–703 | 40 |
| Yb3+/Tm3+/Gd3+ (NaLuF4) | 0.0004 | 298–523 | 41 |
| β-NaLuF4:Yb3+/Tm3+ | 0.0012 | 303–363 | 42 |
| Tm3+ (NaYF4) | 0.00157 | 298–338 | 43 |
| Tm3+ (Ca(WO4)3) | 0.00057 | 313–573 | 44 |
| Yb3+/Tm3+:CaF2 | 0.0025 | 298–323 | 45 |
| Tm3+ (NaNbO3) | 0.00080 | 293–353 | 46 |
| NaGdF4:Yb3+/Tm3+/Ag | 0.014 | 300–390 | This work |
4. Conclusions
In this work, the up-conversion luminescence of thin-film (NaGdF4:Yb3+/Tm3+) has been significantly enhanced using Ag islands. The enhancement factor reached 4.4 and 15.6 at 452 nm and 476 nm, respectively. Moreover, a microfiber was fabricated by co-doping of nanoparticles (β-NaGdF4:Yb3+/Tm3+) with PMMA solution. The relationship between guiding loss and propagation distance of a microfiber was analyzed, indicating its active and passive waveguiding behaviour when excited with a 980 nm laser. The study of the blue emissions of up-conversion thin films was investigated, and it was determined that it can be a potential candidate for the temperature sensor. The intensity-based temperature sensitivity of the samples with Ag islands (0.018 K−1) was greater than that of the samples without Ag islands (0.0029 K−1) at 303 K. The results indicated that thin films with/without Ag, as well as a microfiber, have prospective applications as waveguides and thermal sensors. Hence, it is concluded that this work may open up new horizons of research in the field of photonics and biomedical applications.Conflicts of interest
There is no conflicts of interests.Acknowledgements
This work is supported by the grant of National Natural Science Foundation of China (61605031), Postdoctoral Science Foundation of China (2017T100226) and Henan Province Postdoctoral Research Fund (CJ3050A0670547).References
- Y. Sorek, R. Reisfeld, I. Finkelstein and S. Ruschin, Appl. Phys. Lett., 1995, 66, 1169–1171 CrossRef CAS
.
- J. Y. Choe, D. Ravichandran, S. M. Blomquist, D. C. Morton, K. W. Kirchner, M. H. Ervin and U. Lee, Appl. Phys. Lett., 2001, 78, 3800–3802 CrossRef CAS
.
- M. Quintanilla, E. Cantelar, F. Cusso, M. Villegas and A. Caballero, Appl. Phys. Express, 2011, 4, 022601 CrossRef
.
- Q. Han, H. Hao, J. Yang, Z. Sun, J. Sun, Y. Song, Y. Wang and X. Zhang, J. Alloys Compd., 2019, 786, 770–778 CrossRef CAS
.
- N. Stopikowska, M. Runowski, P. Wozny, S. Goderski and S. Lis, J. Lumin., 2020, 228, 117643 CrossRef CAS
.
- B. Dong, B. Cao, Y. He, Z. Liu, Z. Li and Z. Feng, Adv. Mater., 2012, 24, 1987–1993 CrossRef CAS PubMed
.
- X. Wang, Q. Liu, Y. Bu, C.-S. Liu, T. Liu and X. Yan, RSC Adv., 2015, 5(105), 86219–86236 RSC
.
- B. Dong, R. Hua, B. Cao, Z. Li, Y. He, Z. Zhang and O. S. Wolfbeis, Phys. Chem. Chem. Phys., 2014, 16, 20009–20012 RSC
.
- A. K. Soni, R. Dey and V. K. Rai, RSC Adv., 2015, 5(44), 34999–35009 RSC
.
- P. Kumar and B. K. Gupta, RSC Adv., 2015, 5, 24729–24736 RSC
.
- W. Xia, X. Wang, Z. Fu, S. Zhou, S. Zhang and J. H. Jeong, Mater. Res. Bull., 2012, 47, 2535–2540 CrossRef CAS
.
- Y. Zhou and B. Yan, CrystEngComm, 2013, 15, 5694–5702 RSC
.
- M. K. Shahzad, Y. Zhang, A. Raza, M. Ikram, K. Qi, M. U. Khan, M. J. Aslam and A. Alhazaa, Nanoscale Res. Lett., 2019, 14, 270 CrossRef PubMed
.
- Z. Li, L. Wang, Z. Wang, X. Liu and Y. Xiong, J. Phys. Chem. C, 2011, 115, 3291–3296 CrossRef CAS
.
- J. Cao, F. Hu, L. Chen, H. Guo, C. Duan and M. Yin, Mater. Res. Bull., 2017, 693, 326–331 CAS
.
- A. Priyam, N. M. Idris and Y. Zhang, J. Mater. Chem., 2012, 22, 960–965 RSC
.
- F. Abdul Rahim, RSC Adv., 2013, 3, 7718–7721 RSC
.
- W. Deng, L. Sudheendra, J. Zhao, J. Fu, D. Jin, I. M. Kennedy and E. M. Goldys, Nanotechnology, 2011, 22, 325604 CrossRef PubMed
.
- K. Aslan, M. J. R. Previte, Y. Zhang and C. D. Geddes, J. Phys. Chem. C, 2008, 112, 18368–18375 CrossRef CAS PubMed
.
- S. Liu, G. Chen, T. Y. Ohulchanskyy, M. T. Swihart and P. N. Prasad, Theranostics, 2013, 3, 275–281 CrossRef CAS PubMed
.
- L. Aigouy, G. Tessier, M. Mortier and B. Charlot, Appl. Phys. Lett., 2005, 87, 184105 CrossRef
.
- G. Frens, Nature, 1973, 241, 20–22 CAS
.
- F. Hu, J. Cao, X. Wei, S. Lu, X. Li, Y. Qin, H. Guo, Y. Chen, C. Duan and M. Yin, Mater. Res. Bull., 2017, 722, 669–675 CAS
.
- D. Lu, S. K. Cho, S. Ahn, L. Brun, C. J. Summers and W. Park, ACS Nano, 2014, 8, 7780–7792 CrossRef CAS PubMed
.
- M. Saboktakin, X. Ye, U. K. Chettiar, N. Engheta, C. B. Murray and C. R. Kagan, ACS Nano, 2013, 7, 7186–7192 CrossRef CAS PubMed
.
- O. A. Savchuk, P. Haro-González, J. J. Carvajal, D. Jaque, J. Massons, M. Aguilo and F. Diaz, Nanoscale, 2014, 6, 9727–9733 RSC
.
- Y. L. Wang, N. M. Estakhri, A. Johnson, H. Y. Li, L. X. Xu, Z. Zhang, A. Andrea, Q. Q. Wang and C. K. K. Shih, Sci. Rep., 2015, 5, 10196 CrossRef CAS PubMed
.
- K. M. Mayer and J. H. Hafner, Chem. Rev., 2011, 111, 3828–3857 CrossRef CAS PubMed
.
- H. Zou, X. Wang, Y. Hu, X. Zhu, Y. Sui and Z. Song, AIP Adv., 2014, 4, 127157 CrossRef
.
- K. Zheng, W. Song, G. He, Z. Yuan and W. Qin, Opt. Express, 2015, 23, 7653–7658 CrossRef CAS PubMed
.
- J. Duan, K. Park, R. I. MacCuspie, R. A. Vaia and R. Pachter, J. Phys. Chem. C, 2009, 113, 15524–15532 CrossRef CAS
.
- P. Y. Poma, T. O. Sales, K. U. Kumarb and C. Jacinto, Phys. Chem. Chem. Phys., 2020, 22, 24535–24543 RSC
.
- L. Marciniak, W. Piotrowski, M. Szalkowski, V. Kinzhybalo, M. Drozd, M. Dramicanin and A. Bednarkiewicz, Chem. Eng. J., 2022, 427, 131941 CrossRef CAS
.
- L. Li, C. Guo, S. Jiang, D. K. Agrawal and T. Li, RSC Adv., 2014, 4, 6391–6396 RSC
.
- R. Dey and V. K. Rai, Dalton Trans., 2014, 43, 111–118 RSC
.
- B. P. Singh, A. K. Parchur, R. S. Ningthoujam, P. V. Ramakrishna, S. Singh, P. Singh, S. B. Rai and R. Maalej, Phys. Chem. Chem. Phys., 2014, 16, 22665–22676 RSC
.
- M. K. Shahzad, Y. Zhang, M. U. Khan, X. Sun, L. Liu and H. Li, Opt. Mater. Express, 2018, 8(8), 2321–2329 CrossRef CAS
.
- P. Du, L. Luo and J. S. Yu, Curr. Appl. Phys., 2015, 15, 1576–1579 CrossRef
.
- A. F. Pereira, K. U. Kumar, W. F. Silva, W. Q. Santos, D. Jaque and C. Jacinto, Sens. Actuators, B, 2015, 213, 65–71 CrossRef CAS
.
- W. Xu, X. Y. Gao, L. J. Zheng, Z. G. Zhang and W. W. Cao, Sens. Actuators, B, 2012, 173, 250–253 CrossRef CAS
.
- K. Zheng, Z. Liu, C. Lv and W. Qin, J. Mater. Chem.
C, 2013, 1, 5502–5507 RSC
.
- M. K. Shahzad, Y. Zhang, M. U. Khan, H. Sattar and M. Ikram, Curr. Appl. Phys., 2019, 19, 739–744 CrossRef
.
- M. K. Shahzad, Y. Zhang, L. Cui, L. Liu, M. Khalid Butt and H. Li, RSC Adv., 2018, 8, 19362–19368 RSC
.
- W. Xu, X. Y. Gao, L. J. Zheng, Z. G. Zhang and W. W. Cao, Sens. Actuators, B, 2012, 173, 250–253 CrossRef CAS
.
- N. N. Dong, M. Pedroni, F. Piccinelli, G. Conti, A. Sbarbati, J. E. Ramırez Hernandez, L. M. Maestro, M. C. I. d. l. Cruz, F. Sanz-Rodriguez, A. Juarranz, F. Chen, F. Vetrone, J. A. Capobianco, J. G. Sole, M. Bettinelli, D. Jaque and A. Speghini, ACS Nano, 2011, 5, 8665–8671 CrossRef CAS PubMed
.
- L. Tong, X. Li, R. Hua, L. Cheng, J. Sun, J. Zhang, S. Xu, H. Zheng, Y. Zhang and B. Chen, Curr. Appl. Phys., 2017, 17, 999–1004 CrossRef
.
Footnote |
| † Electronic supplementary information (ESI) available. See DOI: 10.1039/d1ra06336g |
| This journal is © The Royal Society of Chemistry 2021 |

