
 Open Access Article
 This Open Access Article is licensed under a
 Creative Commons Attribution 3.0 Unported Licence
Synthesis of polyurethane-derived nitrogen-doped carbon dots for a high-performance fluorescence bioimaging probe†
Fang-Jun Caoa,
Lu Wanga,
Cheng-Li Fenga,
Xiao Lin*b and
Hui Feng *a
*a
aShaanxi Institute of Zoology, Xi'an, Shaanxi 710072, P. R. China. E-mail: fenghui84@126.com
bSchool of Life Science, Northwestern Polytechnical University, Xi'an, Shaanxi 710072, P. R. China. E-mail: Linxiao@nwpu.edu.cn
First published on 21st October 2021
Abstract
Carbon quantum dots, as a new type of fluorescent material, possess many advantages with adjustable fluorescence performance and low toxicity. In this work, a universal and robust strategy using polyurethane (PU) sponge as precursor was developed to synthesize highly-soluble nitrogen-doped carbon quantum dots (NCDs) via a solvothermal method. The decomposition and polymerization process of PU sponge result in the formation of NCDs-1 with oxygen and nitrogen-containing functional groups. Specifically, the as-prepared NCDs-1 showed high photostability and tunable photoluminescence properties. Most importantly, this strategy enables us to fabricate other NCDs using various polyurethane sponges. Cytotoxicity studies indicated that these highly-soluble NCDs-1 show low cytotoxicity for HeLa and MC3T3-E1 cells, and can be used as good probes for cellular imaging. This work not only develops an eco-friendly strategy to utilize polyurethane material, but also provides a simple method to fabricate fluorescence carbon dots for cellular imaging and other therapeutic applications.
Introduction
Nitrogen-doped carbon dots (NCDs), one of the most significant classes of fluorescent materials, have attracted much attention owing to their excellent photoluminescence and low toxicity for bioimaging, bio-labeling, sensing and photoelectric devices.1–4 What's more, bioimaging of the NCDs can also be used for real-time monitoring of drug distribution and delivery, metastasis cell differentiation and protein distribution in vivo. They can be used as drug carrier and fluorescence bioimaging probe for drug delivery and drug release control, which is of great significance in clinical disease diagnosis and real-time tracing. At present, various raw materials including small molecule compounds, natural products and water-soluble synthetic polymers for use in the synthesis of diversified carbon materials.5–15 For instance, Gu's group demonstrated that NCDs were synthesized using natural honey as raw material via a solvothermal method.12 This NCDs emitted blue light under ultraviolet irradiation and could be used as a fluorescence quenching/recovery probe for the detection of Au and glutathione. However, some methods always suffer from shortcomings with high temperature, complicated and time-consuming procedures.16 Therefore, in order to facilitate large-scale production and application, a facile and low-cost method to synthesize NCDs from easily available raw materials is highly desirable.Polyurethane (PU) sponge, as commonly used cushioning materials, is consisted of a chain of organic units joined by carbamate links. Owing to its characteristic three-dimensional (3-D) porous structures, PU sponge can serve as a template material to synthesize hybrid composites. In view of the fact that the nitrogen account for about 8 wt% of PU sponge, which can be used as raw materials to fabricate doped functional carbon materials. Yang developed a general method of carbon coating, depending on the process of PU sponge decomposition and polymerization in aqueous solution.17 They found that the hydrothermal process of PU sponge enables to synthetize tunable N-doped carbonaceous coating. Obviously, it was demonstrated that the properties of NCDs were closely related to their composition and structure.14 For example, nitrogen doping was the most common and effective way to improve the luminescence properties by changing the band gap spacing and charge structure of the NCDs and improving the photoluminescence performance of the NCDs.18,19 Wu's group reported that CDs were prepared using petroleum coke as raw material by solvothermal treatment.20 DMF, as a common solvent, could be used as nitrogen source to realize nitrogen doping process. Song’ group combined folate with NCDs by passivating 4,7,10-trioxy-1,13-tridecanediamine. Based on the principle that the tumor cells were related to the overexpression of folate receptor.21 The normal cells and tumor cells with folate receptor could be distinguished by fluorescence imaging. Inspired by this, it is necessary to investigate the fluorescence spectrum and luminescence performance of PU-derived N-doped carbon materials.
In this work, we present a universal and simple strategy toward luminescent NCDs derived from PU sponge using one-step solvothermal method. PU sponge will decompose into small molecular compounds under solvothermal conditions. At the same time, nitrogen can be in situ introduced into the NCDs-1. The as-prepared NCDs-1 showed exciting photoluminescence (PL) features, such as bright luminescence, high photostability and excitation wavelength dependent emission spectra. Most importantly, such a highly biocompatible NCDs-1 could easily enter cells and show low cytotoxicity and excellent cell imaging performance. This work provides a simple and general method to fabricate fluorescence carbon dots for cellular imaging and other therapeutic applications.
Experimental and characterization
Chemicals
All chemicals were purchased from Sinopharm Chemical Reagent Beijing Company and were analytical grade. Deionized water was used throughout the experiments.Solvothermal synthesis of N-CDs from PU sponges
For the fluorescent N-CDs, polyurethane sponges with 50 mg were immersed in 30 mL N,N-dimethylformamide (DMF) solution thoroughly. The mixture was then put into 50 mL polytetrafluoroethylene lined autoclave and heated at 180 °C for 6 h. After the reaction, the solution was cooled naturally and the yellow supernatant was collected through simple filtration to obtain N-CDs solution. Finally, NCDs-1 sample was collected through a simple filtration and freeze-drying treatment. The yield of sample was about 4 mg.Cell culture and MTT assay
Cytotoxic activity of the as-prepared N-CDs was determined using MTT assay. HeLa cells and MC3T3-E1 cells were cultured in DMEM (high glucose), respectively, supplemented with 10% fetal bovine serum, penicillin (100 U mL−1) and streptomycin (100 μg mL−1) at 37 °C in 5% CO2. The tested N-CDs were dissolved in deionized water and diluted freshly before each experiment to various preset concentrations in DMEM medium for HeLa cells and MC3T3-E1 cells. HeLa cells and MC3T3-E1 cells at exponential growth phase were seeded into a 96 well plate at 4.8 × 10³ cells per 200 μL per well and cultured for 24 h. After removal of the medium, the cells in each well were treated with 200 μL solution containing different concentrations of the tested N-CDs and vehicle controls which only received an equivalent amount of deionized water in quintuplicate for 48 h at 37 °C. Thirty microliters of MTT solution (5 mg mL−1 in PBS) was added to each well with 150 μL fresh medium for an additional 4 h. After removing the supernatant, 150 μL of DMSO was added to completely dissolve the formazan crystals that had formed in viable cells in the wells. Finally, the plates were shaken and the absorbance (A) was determined using microplate reader (Bio-Rad 680) at 570 nm. The wells containing the same media as other test wells but no cells were used as blank controls. All the doses were tested in quintuplicate and the experiments were repeated at least three times. The inhibition rates (IRs) were calculated according to the following formula and expressed as means ± S.D.| IRs% = (Acontrol − Aexperimental)/(Acontrol − Ablank) × 100 |
Confocal microscopy imaging
Approximately 105 cells per well were seeded on 35 mm special laser confocal culture dish in DMEM overnight. The cells were treated with 0.08 mg mL−1 of N-CDs for 2 hours at 37 °C. The cells were then washed three times with isotonic PBS (pH 7.4) to remove the remaining extracellular N-CDs. The treated cells were observed and photographed under a confocal microscope (Leica, Wetzlar, Germany).Characterization
The phase and crystal structure of as-prepared N-CDs were characterized by XRD (A Bruker D8 ADVANCE diffractometer using Cu Kα radiation). The micro morphology and crystal structure of N-CDs were observed by transmission electron microscope (TEM, G2 F20 S-TWIN), high-resolution field emission (SEM, JEOL JSM-6390A), aberration-corrected HAADF-STEM instrument (Themis Z, FEI) at 300 kV combine with a SEM (SU8220, Hitachi) at 15 kV. X-ray photoelectron spectroscopy (XPS, Thermo Fisher Escalab 250Xi) was applied to measure the surface elements and chemical states of N-CDs. Infrared spectrometer was investigated by Bruker Tencer 2. The F97 Pro fluorescence spectrophotometer was obtained to characterize the fluorescence properties of N-CDs. The N-CDs solution was mixed to the appropriate concentration and the xenon lamp was used as the excitation light source. From 370 nm to 440 nm, an excitation wavelength was selected with each 10 nm to test the fluorescence emission spectrum and the maximum emission wavelength was obtained to test the excitation spectrum.Result and discussion
Structural characterization
Fig. 1 shows the schematic illustration of NCDs by one-step solvothermal method in DMF solution. Such a solvothermal treatment of PU sponge exhibited excellent reproducibility. As shown in Fig. 1, the commercial PU sponge was firstly cleaned and then cut into small squares (Fig. S1†). Then, the small sponge cubes were immersed in 30 mL DMF solution thoroughly and put into polytetrafluoroethylene lined autoclave. After heating at 180 °C for 6 h, the mixture was cooled naturally and the sample existed in the upper yellow solution. Finally, NCDs-1 sample was collected through a simple filtration and freeze-drying treatment. | ||
| Fig. 1 Illustration of the formation of NCDs derived from PU sponge. | ||
The structure and morphology of NCDs-1 was initially investigated using X-ray diffraction and transmission electron microscopy (TEM) analyses. The X-ray diffraction (XRD) pattern of the NCDs-1 (Fig. 2a) shows two typical characteristic peaks located at about 15° and 42°, which can be indexed to the (002) and (100) planes of graphite. As shown in Fig. 2b, it was found that ultrasmall NCDs-1 were spherical-like nanoparticles with excellent dispersion. The particle size distribution of NCDs-1 was relatively uniform with an average particle size of 2 nm (Fig. S2†). The high-resolution TEM (HRTEM) image of NCDs-1 demonstrated that obvious lattice fringes (110) with a spacing of 0.203 nm can be attributed to the d-spacing of sp2 graphitic carbon,22 indicating the formation of carbon structural materials.
 | ||
| Fig. 2 Structure characterization diagrams of NCDs-1. (a) and (b) XRD pattern and TEM images of the NCDs-1; the inset in (b) is the corresponding high-resolution TEM image. | ||
Similar to previously reported CDs, the solvothermal treatment of PU sponge leads to a yellow dispersion. Fig. 3a shows an absorption band at ca. 290 nm, owing to the p–p* transition of aromatic sp2 domains. It was noted that the as-prepared NCDs-1 was nearly unchanged and remained homogeneous, even if the preservation time was over several months, indicating their excellent photostability. In addition, it was found that the intense blue fluorescence of NCDs-1 could be observed by naked eyes obviously in ultraviolet light. The NCDs-1 possessed remarkable fluorescence properties which was related to the wavelength of incident light. Similar with other CDs, the as-prepared sample showed excellent excitation-wavelength dependent emission spectrum which allowed NCDs-1 for multicolor imaging applications by simply varying excitation light wavelength.20 The PL curves of the sample were measured at different excitation wavelengths, as shown in Fig. 3b. The spectra analysis showed that the PL peak relatively shift from 460 (blue) to 520 nm (red), resulting from the excitation wavelength changed from 370 to 440 nm accompanied with the intensity decreased gradually. The strongest emission wavelength of NCDs-1 was about 480 nm with the excitation wavelength of 370 nm by ultraviolet analysis. The excitation wavelength of the NCDs-1 mainly relied on the different emissive trap sites and the size distribution of the NCDs-1, and in turn affected their fluorescence.21 The possible luminescence mechanism of NCDs-1 can be attributed to the surface state.23,24 And the main mechanism had been put forward to explain the PL of as-prepared sample. The creation of trap states in the bandgap result from doping heteroatoms and the surface functionalization.
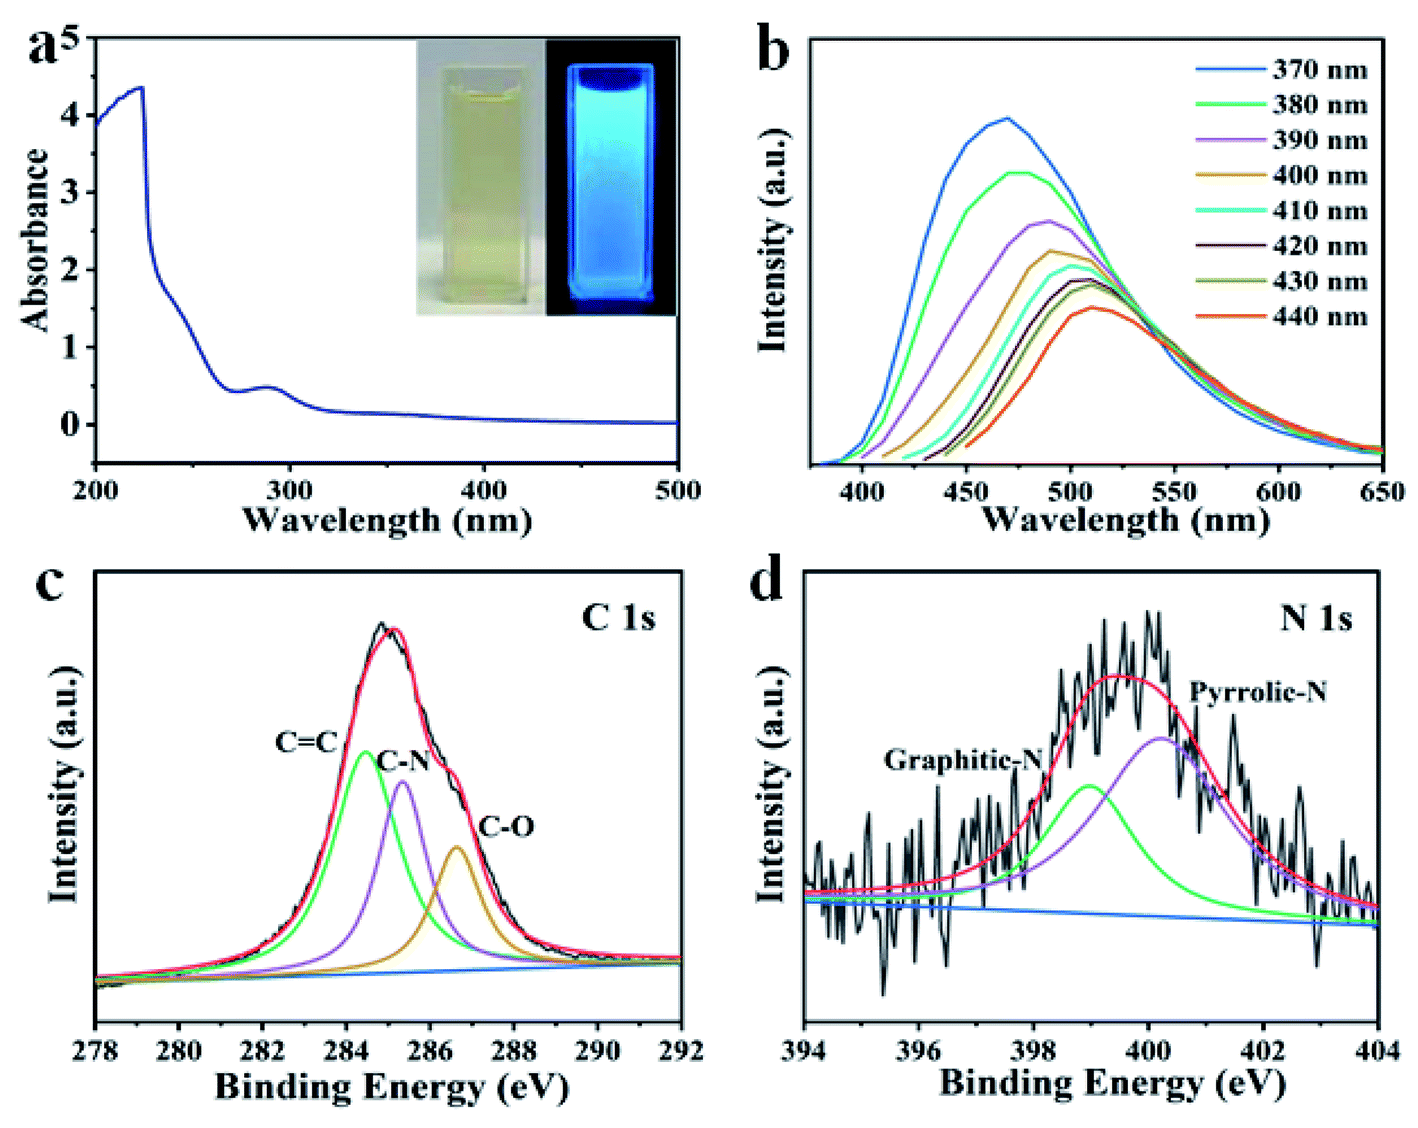 | ||
| Fig. 3 (a) UV-vis absorption of the NCDs-1; the inset in (a) represents photographs of the aqueous solution of the NCDs-1 excited by daylight and UV irradiation; (b) photoluminescence emission spectra of the NCDs-1 excited at different excitation wavelengths; (c) and (d) high-resolution spectra XPS of C 1s and N 1s of the NCDs-1. | ||
To evaluate the composition of the as-produced NCDs-1, XPS analyses were further conducted. It was showed three clear peaks of C 1s, N 1s, and O 1s of synthesized NCDs-1. Moreover, the high-resolution XPS spectra revealed that the carbon element in the NCDs-1 is present in the form of C–C (284.8 eV), C–N (286.1 eV), C–O (286.7 eV), and C![[double bond, length as m-dash]](https://www.rsc.org/images/entities/char_e001.gif) N/CO (288.7 eV) (Fig. 3c), whereas the nitrogen element exists as C–N–C (398.7 eV), and N–C3 (399.2 eV) (Fig. 3d).25 The high-resolution O 1s spectrum reveals the presence of OC–O (531.3 eV) and CO (532.6 eV) (Fig. S3†).25 Based on the discussion above, the characteristics of results identified that synthesizing production was NCDs-1. A broad peak at 3430 cm−1 was also observed obviously, and it might be assigned to O–H or N–H vibrations. These results were consistent with the XPS results that the amounts of N and O of the NCDs account for 5.68% and 21.71%, respectively. What is more, Raman spectrum indicated that AD/AG was about 1.21 (Fig. S4†), further suggesting a low graphitic level for the N-CDs. The Fourier transform infrared spectra of NCDs-1 exhibited three strong peaks at 1106 cm−1, 1384 cm−1, 1636 cm−1 was attributed to C–NH–C, N-related bonds, CO vibrations (Fig. S5†). Based on the discussion mentioned, the surface of the as-synthesized NCDs is functionalized by multiple oxygen- and nitrogen-containing groups by the reaction between polyurethane and DMF. The above results indicated that the NCDs-1 were mainly rich in oxygen and nitrogen, among of them, oxygen derived from hydroxyl, carbonyl, or carboxylic acid groups and nitrogen, and nitrogen containing functional groups originated from dehydration and polymerization of PU sponge and dimethyl fumarate solvent.
N/CO (288.7 eV) (Fig. 3c), whereas the nitrogen element exists as C–N–C (398.7 eV), and N–C3 (399.2 eV) (Fig. 3d).25 The high-resolution O 1s spectrum reveals the presence of OC–O (531.3 eV) and CO (532.6 eV) (Fig. S3†).25 Based on the discussion above, the characteristics of results identified that synthesizing production was NCDs-1. A broad peak at 3430 cm−1 was also observed obviously, and it might be assigned to O–H or N–H vibrations. These results were consistent with the XPS results that the amounts of N and O of the NCDs account for 5.68% and 21.71%, respectively. What is more, Raman spectrum indicated that AD/AG was about 1.21 (Fig. S4†), further suggesting a low graphitic level for the N-CDs. The Fourier transform infrared spectra of NCDs-1 exhibited three strong peaks at 1106 cm−1, 1384 cm−1, 1636 cm−1 was attributed to C–NH–C, N-related bonds, CO vibrations (Fig. S5†). Based on the discussion mentioned, the surface of the as-synthesized NCDs is functionalized by multiple oxygen- and nitrogen-containing groups by the reaction between polyurethane and DMF. The above results indicated that the NCDs-1 were mainly rich in oxygen and nitrogen, among of them, oxygen derived from hydroxyl, carbonyl, or carboxylic acid groups and nitrogen, and nitrogen containing functional groups originated from dehydration and polymerization of PU sponge and dimethyl fumarate solvent.
Evolution mechanism
To understand the decomposition of sponge materials, controlled experiments were made to study the decomposing of PU sponge during solvothermal treatment. As shown in Fig. 4a, the PU sponges with typical three-dimensional networks. After solvothermal treatment, such three-dimensional structure collapsed obviously at 180 °C for 0.5 h (Fig. 4b). After reacting for 1 h, the surface becomes rough and the 3-D structure of PU sponge was completely changed (Fig. 4c and d), indicating ongoing decomposition and polymerization reactions. It was proposed that PU sponge degrades into monomers through a top-down process during the solvothermal treatment. Interesting, it was found that the synthesis method was versatile and it was also suitable for other PU sponge materials. Other two types of PU sponge as carbon precursor were found that similar CDs can be obtained, as shown in Fig. 5. Based on TEM images in Fig. 5b and e, the NCDs-2 and NCDs-3 were spherical in shape with similar diameters of 2 nm. In addition, the as-obtained NCDs-2 and NCDs-3 also showed the similar fluorescence properties and PL emission spectra (Fig. S6†). Therefore, it was assumed that this is a genetic carbonization route for PU sponge via a solvothermal treatment. | ||
| Fig. 4 SEM images of the samples with different reaction time (a) 0 h; (b) 0.5 h; (c) 1 h; (d) 4 h. | ||
 | ||
| Fig. 5 (a) SEM image of polyurethane sponge (PU-2); (b) TEM image of as-obtained NCDs-2; (c) photoluminescence emission spectra of the NCDs-1 excited at different excitation wavelengths (NCDs-2); (d) SEM image of polyurethane sponge (PU-3); (e) TEM images of as-obtained NCDs-3; (f) photoluminescence emission spectra of the NCDs-1 excited at different excitation wavelengths (NCDs-3). | ||
Photoluminescence and cellular imaging
The fluorescence properties of NCDs were closely related to the selected preparation methods and raw materials. Fluorescence tunability was one of the important properties of NCDs. Different excitation and emission wavelengths could be selected for different application including biological imaging and optical labeling.26,27 Meanwhile, another attractive PL property about NCDs-1 was that they showed high photostability, resisting to photobleaching, which was very important for applications requiring long-term bioimaging.25 The fluorescence intensity of traditional organic dyes generally decayed rapidly under continuous illumination. However, the fluorescence intensity of gained NCDs-1 had no decay after several hours of UV irradiation, which had strong photobleaching resistance. At the same time, the fluorescence intensity of NCDs-1 unchanged obviously when it was placed at room temperature for several months.28,29 Therefore, it is more suitable for applicating in vivo labeling and detection.The CDs with excellent fluorescence property, as labels for biological tagging performance, have been used widely in the research of biomedicine nowadays.30,31 As a carbon-based material, the as-prepared NCDs-1 showed less toxic compared to their semiconductor-based quantum dots.32 In order to ensure the safety of the gained NCDs-1 in biomedical field, it is necessary to investigate their toxicity and biocompatibility. The cytotoxic activity of the NCDs-1 was determined by MTT assay. As shown in Fig. 6a, based on the concentration screening tests, the test concentrations of the NCDs-1 were set as 10, 20, 40, 80, 160 μg mL−1 for HeLa and MC3T3-E1 cells. The cellular survival rate of two types of cells still maintained over 80%, even the concentration of NCDs-1 was high up to 160 μg mL−1, indicating that the NCDs-1 have low toxicity. Furthermore, the other two samples NCDs-2 and NCDs-3 also exhibited low toxicity (Fig. 6b and c). Therefore, the NCDs synthesized by this method usually have very low biological toxicity. Indeed, comprehensive investigations of the cytotoxicity of the samples in vitro have shown non-toxic performance.
 | ||
| Fig. 6 (a)–(c) Anti-proliferation activities of NCDs (NCDs-1, NCDs-2, NCDs-3) on HeLa and MC3T3-E1 cells at 0–160 μg mL−1 (from left to right). (d) Bright (upper) and fluorescence (lower) images of HeLa incubated with NCDs (NCDs-1, NCDs-2, NCDs-3) obtained using laser scanning confocal microscopy (LSCM) (from left to right). Scale bars: 50 μm. | ||
Confocal microscopy imaging was further used to qualitatively analyze the effects of NCDs-1 labeled cells on their intracellular fluorescence. The results revealed that, obvious blue fluorescence was observed in cultured HeLa cells, but not in the control group under the excitation of 405 nm light (Fig. 6d). It was found that HeLa cells showed different color fluorescence at different excitation wavelengths. The as-prepared NCDs-1 could easily penetrate membranes and get into the cytoplasm of cells. Meanwhile, the fluorescence distributed on cell membrane mostly and the cell outline could be observed, suggesting that NCDs-1 was hard to enter the inner nuclei. The same phenomenon could be observed in MC3T3-E1 cells (Fig. S7†), indicating excellent cell imaging function. As shown in Fig. 6d, similar results can be seen. It was speculated that, in fixed cells and living cells, NCDs-1 enter cells through diffusion and endocytosis, respectively, and fluorescence almost exists in epicyte and cytoplasma. Compared with other CDs reported previously,33–36 the present work indicated that the as-prepared NCDs derived from PU sponge can be used as a biological imaging material with low toxicity. On the one hand, this strategy serves as an eco-friendly strategy to utilize PU sponge. On the other hand, the presence of oxygen-rich groups and amino group allow to further modification.37–41 In addition, nitrogen doping could adjust the relative position of conduction band and valence band, so as to significantly improve their optical properties. Therefore, the as-prepared NCDs can be used as an excellent candidate for the design and development of theragnostic owing to their exceptional physicochemical properties.
Conclusion
In summary, a green and facile method to fabricate NCDs derived from PU sponge was developed by a solvothermal method. Besides, the NCDs-1 with oxygen and nitrogen groups were favorable to increase their water solubility and fluorescence. As a result, the as-prepared sample had excellent PL performances such as bright luminescence, excitation wavelength dependent emission and high photostability. The samples were potentially capable of substituting for traditional quantum dots considering their exciting PL property as well as low toxicity. Moreover, the gained NCDs with high fluorescence were also applied in cell imaging as a promising multicolor fluorescent probe in biological imaging. These fluorescent NCDs are explored to be applied in nano-drug carriers for intracellular imaging, therapeutic applications, clinical disease diagnosis and real-time tracing.Conflicts of interest
There are no conflicts to declare.Acknowledgements
This work was supported by the National Natural Science Foundation of China (Grant No. 32000353) and the Science and Technology Research Project of Shaanxi Province Academy of Sciences (No. 2021k-38).References
- Q. Song, J. Li, S. Wang, J. Liu, L. Pang, H. Li and H. Liu, Small, 2019, 15, 1903395 CrossRef CAS PubMed.
- S. Pandit, P. Behera and J. Sahoo, ACS Appl. Bio Mater., 2019, 2, 3393–3403 CrossRef CAS.
- Y. Liu, X. Li, Q. Zhang, W. Li, Y. Xie, H. Liu, L. Shang, Z. Liu, Z. Chen and L. Gu, Angew. Chem., Int. Ed., 2020, 59, 1718 CrossRef CAS PubMed.
- L. L. Bu, T. Luo, H. J. Peng, L. Li, D. Y. Long, J. D. Peng and J. Huang, Microchim. Acta, 2019, 10, 1–12 Search PubMed.
- S. Huang, J. D. Yao, X. Chu, Y. Liu, Q. Xiao and Y. Zhang, J. Agric. Food Chem., 2019, 40, 11244–11255 CrossRef PubMed.
- J. M. Wang, X. L. Hu, H. Z. Ding, X. Huang, M. S. Xu, Z. Z. Li, D. Wang, X. Xu, Y. Lu, Y. J. Xu, Y. Chen, P. C. Paulo, Y. P. Tian, R. Q. Ren and H. Bi, ACS Appl. Mater. Interfaces, 2019, 20, 18203–18212 CrossRef PubMed.
- X. Wang, A. Dong, Y. Hu, J. Qian and S. Huang, Chem. Commun., 2020, 56, 10809–10823 RSC.
- Y. Q. Wu, Y. X. Chen, S. Q. Zhang, L. Z. Zhang and J. M. Gong, Anal. Chim. Acta, 2019, 68, 45–53 CrossRef PubMed.
- W. J. Ren, J. J. bai, Y. L. Zhao, Y. L. Wang, F. Liu and Z. Z. Li, Mol. Phys., 2019, 18, 2500–2510 CrossRef.
- M. Tian, Y. M. Liu, Y. T. Wang and Y. Zhang, Spectrochim. Acta, Part A, 2019, 220, 117 CrossRef PubMed.
- J. Y. Wu, Y. Dong, X. Y. Yang and C. Yao, Opt. Mater., 2019, 94, 121–129 CrossRef CAS.
- J. J. Gu, D. H. Hu, J. Huang, X. Huang, Q. H. Zhang, X. D. Jia and K. Xi, Nanoscale, 2016, 10, 5503–5514 Search PubMed.
- Y. Mei, T. T. Li, J. Qian, H. Li, M. Wu and Y. Q. Zheng, Chem. Commun., 2020, 56, 13393–13396 RSC.
- W. Liu, R. Zhang, Y. kang, X. Y. Zhang, H. J. Wang, L. H. Li, H. P. Diao and W. L. Wei, New Carbon Mater., 2019, 4, 390–402 CrossRef.
- X. Wang, A. R. Dong, L. L. Chai, J. Y. Ding, L. Zhong, T. T. Li, Y. Hu, J. J. Qian and S. M. Huang, J. Power Sources, 2020, 467, 228302 CrossRef CAS.
- D. M. Yao, A. H. liang and Z. L. Jiang, Microchim. Acta, 2019, 5, 1–9 Search PubMed.
- Y. Yang, J. C. Zhang, S. T. Wang, X. B. Xu, Z. C. Zhang, P. P. Wang, Z. L. Tang and X. Wang, Nanoscale, 2015, 7, 3254–3262 RSC.
- S. M. Song, F. Liang, M. L. Li, F. F. Du, W. J. Dong, X. J. Gong, S. M. Shao and C. Dong, Spectrochim. Acta, Part A, 2019, 215, 58–68 CrossRef CAS PubMed.
- H. Song, Y. Li, Li. Shang, Z. Zhang and S. Lu, Nano Energy, 2020, 72, 104730 CrossRef CAS.
- M. Wu, Y. Wang and W. Wu, Carbon, 2014, 78, 480–489 CrossRef CAS.
- L. Y. Fang, Q. Xu, X. Zheng, W. N. Zhang, J. T. Zheng, M. B. Wu and W. T. Wu, J. Nanopart. Res., 2016, 18, 1–13 CrossRef CAS.
- Q. H. Meng, L. Wang, J. H. Zhang, Y. B. Song, H. Jin, K. Zhang, H. C. Sun, H. Y. Wang and B. Yang, Angew. Chem., Int. Ed., 2013, 52, 3953–3957 CrossRef PubMed.
- T. Xia, T. Li, R. Q. Long, Y. Guo, L. H. Wu and S. Y. Shi, Microchim. Acta, 2020, 2, 464–474 Search PubMed.
- X. Wen, P. Yu and Y. R. Toh, Chem. Commun., 2014, 50, 4703–4706 RSC.
- W. Ai, Z. M. Luo, J. Jiang, J. H. Zhu, Z. Z. Du, Z. X. Fan, L. H. Xie, H. Zhang, W. Huang and T. Yu, Adv. Mater., 2014, 26, 6186–6192 CrossRef CAS PubMed.
- J. P. Song, X. M. Liang, Q. Ma, J. H. An and F. Feng, Spectrochim. Acta, Part A, 2019, 216, 296–302 CrossRef CAS PubMed.
- Y. Y. Liu, L. P. Jiang, B. J. Li, X. Y. Fan, W. Wang, P. P. Liu, S. H. Xu and X. L. Luo, J. Mater. Chem. B, 2019, 19, 3035–3058 Search PubMed.
- J. W. Ye, Y. J. Geng, F. H. C. Cao, D. Sun, S. P. Xu, J. J. Chang, W. Q. Xu and Q. Chen, Chem. Res. Chin. Univ., 2019, 45, 977–979 Search PubMed.
- Y. H. Zhang, Y. F. Nie, R. F. Zhu, D. Han, H. Zhao and Z. X. Li, Talanta, 2019, 204, 74–81 CrossRef CAS PubMed.
- M. Tian, Y. M. Liu, Y. T. Wang and Y. Zhang, Spectrochim. Acta, Part A, 2019, 220, 117 CrossRef PubMed.
- S. K. Bajpai, A. D. Souza and B. Suhail, Int. Nano Lett., 2019, 3, 203–212 CrossRef.
- Z. M. Zhu, X. Y. Lin, L. Wu, C. F. Zhao, S. G. Li, A. L. Liu, X. H. Li and L. Q. Lin, Microchim. Acta, 2019, 8, 1–9 Search PubMed.
- M. Zheng, S. Ruan, S. Liu, T. Sun, D. Qu, Z. Xie, H. Gao, X. Jing and Z. Sun, ACS Nano, 2015, 9, 11455–11461 CrossRef CAS PubMed.
- N. Niu, Z. Ma, F. He, S. Li, J. Li, S. Liu and P. Yang, Langmuir, 2017, 33, 5786–5795 CrossRef CAS PubMed.
- H. Y. Zeng, L. Li, Y. P. Ding and Q. Zhaung, Talanta, 2018, 178, 879–885 CrossRef CAS PubMed.
- G. M. Yuna, Y. Gizem, A. Ilknur, A. Emre and P. I. hatav, Chemmistryselect, 2021, 29, 7317–7322 Search PubMed.
- L. Fang, Q. Xu and X. Zheng, J. Nanopart. Res., 2016, 18, 1–13 CrossRef CAS.
- N. Kitchawengkul, A. Prakobkij, W. Anutrasakda, N. Yodsin, S. Jungsuttiwong, S. Chuticle, M. Amatatongchai and P. Jarujamrus, Anal. Chem., 2021, 93, 6989–6999 CrossRef CAS PubMed.
- M. Tian, Y. M. Liu, Y. T. Wang and Y. Zhang, Anal. Methods, 2019, 32, 4077–4083 RSC.
- Y. Liu, W. Duan, W. Song, J. Liu, C. Ren, J. Wu, D. Liu and H. Chen, ACS Appl. Mater. Interfaces, 2017, 9, 12663–12672 CrossRef CAS.
- L. Song, Y. Cui, C. Zhang, Z. Hu and X. Liu, RSC Adv., 2016, 6, 17704–17712 RSC.
Footnote |
| † Electronic supplementary information (ESI) available. See DOI: 10.1039/d1ra06334k |
| This journal is © The Royal Society of Chemistry 2021 |