 Open Access Article
In situ growth of Fe3O4 on montmorillonite surface and its removal of anionic pollutants
Limei Wu *a,
Jingwen Liua,
Yan Liua,
Ritong Huanga,
Ning Tanga,
Xiaolong Wangb and
Ling Huc
aSchool of Materials Science and Engineering, Shenyang Jianzhu University, Shenyang 110168, China. E-mail: lmwu@sjzu.edu.cn; Tel: +86-024-24690315
bSchool of Mechanical Engineering, Shenyang Jianzhu University, Shenyang 110168, China
cPlanning and Finance Division, Shenyang Jianzhu University, Shenyang 110168, China
First published on 12th October 2021
Abstract
An environmentally functional material for the efficient removal of anionic pollutants in water was prepared for our study. Montmorillonite (M) was modified by hydrochloric acid (HCl) and cetyltrimethylammonium bromide (CTAB). Fe3O4 was grown in situ to prepare modified Fe3O4/montmorillonite (AC Fe3O4–Mt) composites. The number of hydroxyl sites on the surface of Mt and the surface tension were increased by HCl and CTAB modification, respectively, which enabled higher Fe3O4 surface growth, promoting the multi-directional crystallisation of Fe3O4 and improving reactivity. The XRD results show that Fe3O4 grows on the surface of Mt and has good crystallinity and high purity, meaning that AC Fe3O4–Mt is more reactive than Fe3O4. When AC Fe3O4–Mt is used to remove anionic pollutants in water, the removal effect under the synergistic action of adsorption-redox is significantly improved, and the maximum removable quantities of Cr(VI) and 2-4-dichlorophenol can reach 41.57 mg g−1 and 239.33 mg g−1, respectively. AC Fe3O4–Mt is a high efficiency and environmentally functional material with green environmental protection, which can be used in the field of sewage treatment.
1. Introduction
Recent accelerated industrialisation processes have led to a substantial increase in chemical pollutant wastewater discharge. For example, industrial wastewater always contains a large number of pollutants, such as pigments, tanning, electroplating, pesticides, and medicines. Hexavalent chromium ions (Cr(VI)) and 2,4-dichlorophenol (2,4-DCP) are common anionic pollutants from these types of industry.1,2 They are highly destructive to the environment and toxic to humans. Cr(VI) is the first type of carcinogen3 which usually exists in aqueous metal–oxygen anion forms, which are strong irritants and carcinogenic if entering the human body. 2,4-DCP causes irritation to human skin and eyes and may damage DNA and induce mutation.4 Consequently, the United States Environmental Protection Agency had imposed clear regulations on the maximum permissible level of the two pollutants in drinking water. The maximum levels of Cr(VI) and 2,4-DCP in drinking water were set at 0.1 mg L−1![[thin space (1/6-em)]](https://www.rsc.org/images/entities/char_2009.gif) 5 and 0.03 mg L−1,6 respectively. Commonly used methods to remove both pollutants include chemically,7 the Fenton method,8,9 and an adsorption method.10,11 As it is operationally simple and easily adaptable, the adsorption method is the most commonly used removal method.
5 and 0.03 mg L−1,6 respectively. Commonly used methods to remove both pollutants include chemically,7 the Fenton method,8,9 and an adsorption method.10,11 As it is operationally simple and easily adaptable, the adsorption method is the most commonly used removal method.
In the traditional adsorption method, the separation process involves membrane filtration and centrifugation, which both increases cost and hinders the large-scale use of adsorption materials.12 As a type of magnetic nanomaterial, Fe3O4 has strong reducibility and recyclability, and can improve pollutant removal efficiency. Montmorillonite (Mt) is a type of clay mineral with a 2![[thin space (1/6-em)]](https://www.rsc.org/images/entities/char_2009.gif) :
:![[thin space (1/6-em)]](https://www.rsc.org/images/entities/char_2009.gif) 1 layered structure. Its structural layer is composed of upper and lower silicon–oxygen tetrahedral layers and intermediate alumina octahedral layers.13 Due to isomorphous replacement (for example, the Al3+ of the octahedral layer being replaced by Mg2+ or Fe2+, and the Si4+ of the tetrahedral layer being replaced by Al3+ or Fe3+), the number and variety of hydroxyl groups on the surface will increase. This drives stronger interactions between Mt and other materials,14 and it can therefore be used as a good carrier to improve the stability of composites.15–17 In this study, when Mt is used as a carrier to support Fe3O4, due to the large amount of hydroxyl groups on the Mt surface, the unidirectional crystallisation of Fe3O4 can be inhibited to form multi-directional crystallisation, and thus improve reactivity. For example, Iñigo Larraza et al.18 reported that magnetite-polyethyleneimine-montmorillonite was used as a magnetic adsorbent to adsorb hexavalent chromium in water. The Mt was subsequently stripped off by the amine group, then the polyethyleneimine-magnetite inserted into Mt layer structure by cation exchange strategy. Finally, the composite was used to adsorb Cr(VI), due to its unique magnetism, demonstrating excellent heavy metal removal capability.
1 layered structure. Its structural layer is composed of upper and lower silicon–oxygen tetrahedral layers and intermediate alumina octahedral layers.13 Due to isomorphous replacement (for example, the Al3+ of the octahedral layer being replaced by Mg2+ or Fe2+, and the Si4+ of the tetrahedral layer being replaced by Al3+ or Fe3+), the number and variety of hydroxyl groups on the surface will increase. This drives stronger interactions between Mt and other materials,14 and it can therefore be used as a good carrier to improve the stability of composites.15–17 In this study, when Mt is used as a carrier to support Fe3O4, due to the large amount of hydroxyl groups on the Mt surface, the unidirectional crystallisation of Fe3O4 can be inhibited to form multi-directional crystallisation, and thus improve reactivity. For example, Iñigo Larraza et al.18 reported that magnetite-polyethyleneimine-montmorillonite was used as a magnetic adsorbent to adsorb hexavalent chromium in water. The Mt was subsequently stripped off by the amine group, then the polyethyleneimine-magnetite inserted into Mt layer structure by cation exchange strategy. Finally, the composite was used to adsorb Cr(VI), due to its unique magnetism, demonstrating excellent heavy metal removal capability.
Currently, the common method for inorganic or organic pollutants in water, is to degrade them into non-toxic ions or adsorb them into material pores.19,20 In this study, based on the characteristics of rich hydroxyl groups and high Mt surface tension, nano-Fe3O4 was grown in situ, with Mt as the carrier, to obtain Fe3O4–Mt composites. The number and concentration of hydroxyl groups on the Mt surface were increased using acid modification, and the surface tension of Mt was improved by organic modification. Subsequently Fe3O4 was crystallised in multiple directions on the Mt surface and the degree of dispersion was simultaneously improved. AC Fe3O4–Mt was produced, and the removal efficiency of Cr(VI) and 2,4-DCP was improved. The prepared AC Fe3O4–Mt have potentially excellent application prospects for the removal of heavy metals and organic pollutants in water.
2. Materials and methods
2.1 Materials
Ca-based Mt was purchased from Inner Mongolia Ningcheng Tianyu Bentonite Technology Co., Ltd. CTAB was obtained from Tianjin Aopusheng Chemical Co., Ltd. Ferric sulfate (Fe2(SO4)3·nH2O, n = 6–9) was produced by National Pharmaceutical Group Chemical Reagent Co., Ltd. Ferrous sulfate heptahydrate (FeSO4·7H2O) was purchased from Tianjin Beichen Fangzheng Reagent Factory, and sodium hydroxide (NaOH) was purchased from Tianjin Aopusheng Chemical Co., Ltd. All the reagents used are analytical grade and can be used without further purification.2.2 Preparation of AC Mt
The basic steps to prepare modified Mt are as follows: firstly, 5 g Mt was put into 100 ml HCl solution of 0.5 mol L−1 and stirred for 4 hours. Acid-modified polyhydroxy-Mt was then prepared by centrifugally washing with distilled water three times. Next, CTAB with 100%CEC Ca-based Mt exchange capacity, was added to 100 ml distilled water, and acid-modified Mt was added after stirring uniformly. The cation exchange reaction was complete after stirring for 24 hours. Excess CTAB was removed by centrifugal washing until Br ions in the solution can no longer be detected using silver nitrate solution.2.3 Preparation of AC Fe3O4–Mt
Next, an appropriate amounts of ferric and ferrous sulphates were dissolved in distilled water, stirred until a clear, brownish-red solution was obtained. Then enough modified Mt was added to the solution to load 1 g Fe3O4, stirred evenly before adding 0.1 mol L−1 NaOH buffer solution to pH 12–13. After static ageing for 24 hours, centrifugally wash to neutral, and freeze-dry. Finally, the AC Fe3O4–Mt was obtained.2.4 Material characterization
2.5 Adsorption experiment
Initially to determine the effect of pollutant concentration on composite adsorption properties, adsorption experiments were carried out on Cr(VI) and 2,4-DCP, with different concentration gradients, placed in conical bottles at 20 °C. The pH of the solution was adjusted to 5–6. The NaOH and HCl 1 mol L−1 solutions were used to adjust the pH of the solution to between 2 and 14, to ascertain the effect of pH on the composite adsorption properties. Under different time intervals, adsorption experiments were carried out, and an equilibrium adsorption time was established. The removed amounts of various initial concentration pollutants were measured at 20 °C, 40 °C, and 60 °C, and the thermodynamic parameters were ascertained.In the experiment, composite dosages of 2 g L−1 and 1 g L−1 were used for Cr(VI) and 2,4-DCP respectively, and the pollutants in the solution were filtered after adsorption. The concentration of pollutants in the solution was measured by an ultraviolet spectrophotometer absorbance test. The amount of pollutant adsorbate on the composite material can be obtained using the following formula:
3. Results and discussion
3.1 Preparation and characterization of composites
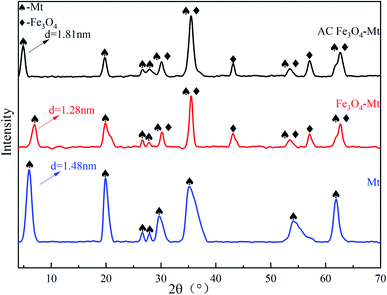
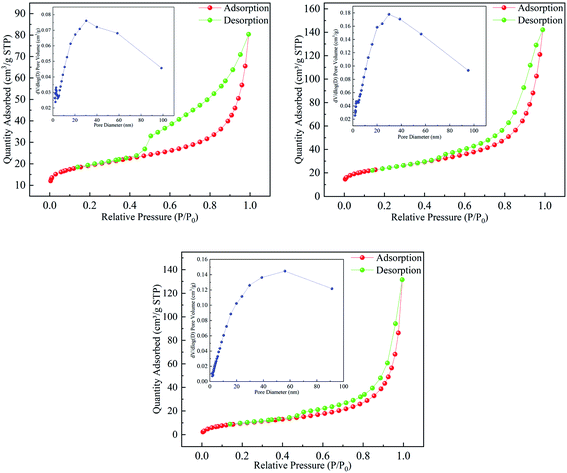
The phase compositions of Mt and Fe3O4–Mt composites were characterised using X-ray diffraction (Fig. 1). In the Fe3O4–Mt composite, the layer spacing of Mt decreased from 1.48 nm to 1.28 nm, proving that part of Fe3O4 entered the interlayer of Mt. The AC Fe3O4–Mt characteristic diffraction peak appeared at 2θ = 30.2°, 35.48°, 43.12°, 53.48°, 57.08°, 62.68°of successfully crystallised and grown Fe3O4 on AC Mt.21 The interface of Mt modified by HCl and CTAB also increased visibly, pushing more Fe3O4 to load on the Mt surface which was beneficial to the pollutant adsorption process. This verified that AC Fe3O4–Mt composites were successfully prepared.The pore structure properties of Mt, Fe3O4–Mt, and AC Fe3O4–Mt were analysed by BET specific surface area and BJH pore volume analysis (Fig. 2). The related data were listed in Table 1. The nitrogen desorption experiment produced a type IV isotherm, and the type 2 of the H3 mesoporous hysteresis ring corresponded with the characteristics of a clay mineral layered structure. With the addition of Fe3O4, the specific surface area, pore volume, and pore size of the Fe3O4–Mt increased to 83 m2 g−1, 0.21 cm3 g−1, and 13.70 nm, respectively. This was because Fe3O4 was loaded on the Mt surface and a small amount entered the interlayer, resulting in more pores, thus increasing the specific surface area and system pore volume.22 However, the specific surface area of AC Fe3O4–Mt decreased because Fe3O4 entered the interlayer and Mt micropores due to CTAB action.23 According to the pore volume diagram, the micropore structure decreased sharply below 2 nm. The mesoporous and macropores increased greatly over 40 nm, leading to the decrease in pore volume, the rapid decrease in specific surface area, and the increase in average pore size.
| Samples | Surface area (m2 g−1) | Pore volume (cm3 g−1) | Pore size (nm) |
|---|---|---|---|
| Mt | 65 | 0.11 | 12.06 |
| Fe3O4–Mt | 83 | 0.21 | 13.70 |
| AC Fe3O4–Mt | 37 | 0.20 | 22.05 |
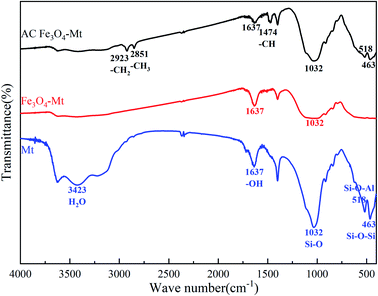
The infrared spectra of Mt, Fe3O4–Mt, and AC Fe3O4–Mt are shown in Fig. 3. 3423 cm−1 and 1637 cm−1 are Mt interlayer adsorbed water and surface hydroxyl –OH bending vibrations, respectively.14 There is Si–O tensile vibration at 1032 cm−1,11 Si–O–Al bending vibration, and Si–O–Si bending vibration at 518 cm−1 and 463 cm−1,11 respectively. The Si–O tensile vibration, Si–O–Al bending vibration, and Si–O–Si bending vibration of Fe3O4–Mt are weakened, and the Fe–O vibration peak at 568 cm−1 does not appear, indicating that there is an interaction between Si–O and Fe–O. This facilitates the stable dispersion of Fe3O4 on the Mt surface. However, due to the modification of CTAB, the AC Fe3O4–Mt exhibits –CH2 symmetrical tensile vibration at 2923 cm−1, –CH3 symmetrical tensile vibration at 2851 cm−1 and –CH deformation vibration at 1474 cm−1.24
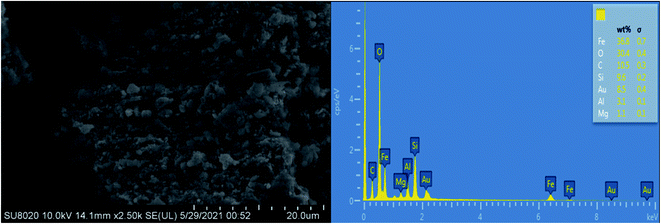
The surface morphology and element composition of AC Fe3O4–Mt were determined by SEM and EDS (Fig. 4). Overall, AC Fe3O4–Mt had a layered structure, and nano-sized Fe3O4 was uniformly dispersed on the Mt surface. The EDS test results showed that the Fe element content was high, confirming the high loading rate of Fe3O4 on Mt.
3.2 Pollutant removal effect of AC Fe3O4–Mt
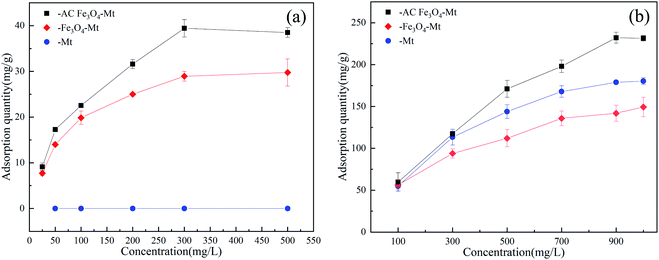
The removal process of anionic pollutants by Mt and Fe3O4–Mt composites was affected by solution concentration (Fig. 5a and b). As shown, with an increase of the initial concentration of the solution, the removed amount of Cr(VI) and 2,4-DCP by Mt, Fe3O4–Mt, AC Fe3O4–Mt increased gradually. This was because the concentration gradient force increased with the increase in initial pollutant concentration, thus augmenting the pollutant diffusion in the solution to the composite, and strengthening its reaction performance.25 The maximum removable amounts of Cr(VI) by Mt, Fe3O4–Mt, and AC Fe3O4–Mt were 0 mg g−1, 31.91 mg g−1, and 41.57 mg g−1, respectively, and the maximum removable amounts of 2,4-DCP were 184.81 mg g−1, 158.84 mg g−1, and 239.33 mg, respectively. Compared with Mt and Fe3O4–Mt, AC Fe3O4–Mt showed stronger removal ability and good stability. The removed amount of Cr(VI) by Mt was zero, in contrast to the higher removal effect of Cr(VI) by Fe3O4–Mt. The results showed that Fe3O4 in Fe3O4–Mt played an important role. The two materials have contrasting effects on the removal of 2,4-DCP with Mt having a much better removal effect. Therefore, Fe3O4 in Fe3O4–Mt removed pollutants through redox, which was effective in removing inorganic pollutants, but ineffective at degrading organic ones. Compared with other Mt composites, the AC Fe3O4–Mt prepared in this study showed better removal ability of Cr(VI) and 2,4-DCP (Table 2).| Adsorbents | Qm (mg g−1) | pH | Reference |
|---|---|---|---|
| Cr(VI) | |||
| CPC/Keggin-Al30 modified montmorillonite | 42.44 | 2 | 26 |
| Montmorillonite modified with CTAB and hydroxyaluminum | 11.97 | 4 | 27 |
| Red mud activated with CTAB | 22.20 | 2 | 28 |
| Fe–montmorillonite | 13.48 | 4 | 29 |
| Fe/Zr4:1 pillared montmorillonite | 22.34 | 3 | 30 |
| This study | 41.57 | 6 | |
![[thin space (1/6-em)]](https://www.rsc.org/images/entities/char_2009.gif) |
|||
| 2,4-Dichlorophenol | |||
| Ammonia-modified activated carbon | 285.71 | 6 | 31 |
| Biocomposites of polypyrrole, polyaniline and sodium alginate with cellulosic biomass | 24.57 | 6 | 32 |
| Cyclodextrin-ionic liquid polymer | 29.58 | 6 | 33 |
| Maize cob carbon | 17.94 | 2 | 34 |
| Pd/Fe–Fe3O4@MWCNTs nanohybrids | 24.45 | 6.5 | 35 |
| This study | 239.33 | 6.5 | |
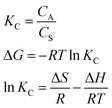
The thermodynamic parameters were obtained by using the following equation:
![[thin space (1/6-em)]](https://www.rsc.org/images/entities/char_2009.gif) KC against 1/T (Fig. 6a and b). The specific parameters were shown in Table 3. The standard Gibbs free energy, ΔG, of Cr(VI) and 2,4-DCP was negative at all test temperatures, indicating that adsorption was spontaneous. The entropy change of the two materials increased slightly, indicating that the structural properties of the composites had not significantly changed before or after adsorption. The enthalpy change of adsorption of 2,4-DCP was greater than that of Cr(VI). This was due to partial physical adsorption during the degradation of 2,4-DCP,36 indicating it was highly dependent on temperature. The degradation of Cr(VI) depended mainly on a redox reaction, so the demand for heat was lower, and the temperature effect was only slight.
KC against 1/T (Fig. 6a and b). The specific parameters were shown in Table 3. The standard Gibbs free energy, ΔG, of Cr(VI) and 2,4-DCP was negative at all test temperatures, indicating that adsorption was spontaneous. The entropy change of the two materials increased slightly, indicating that the structural properties of the composites had not significantly changed before or after adsorption. The enthalpy change of adsorption of 2,4-DCP was greater than that of Cr(VI). This was due to partial physical adsorption during the degradation of 2,4-DCP,36 indicating it was highly dependent on temperature. The degradation of Cr(VI) depended mainly on a redox reaction, so the demand for heat was lower, and the temperature effect was only slight.
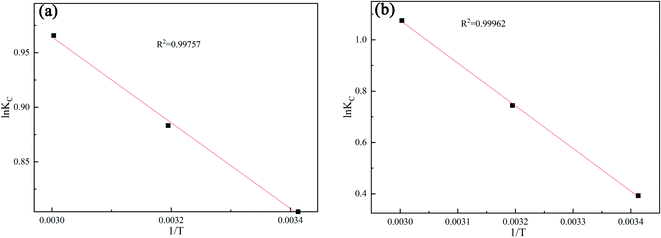 | ||
Fig. 6 Plot of ln![[thin space (1/6-em)]](https://www.rsc.org/images/entities/char_2009.gif) KC vs. 1/T for estimation of thermodynamic parameters for the adsorption of Cr(VI) (a), 2,4-DCP(b) onto AC Fe3O4–Mt. (a) (pH = 6), 2,4-DCP(b) (pH = 6). KC vs. 1/T for estimation of thermodynamic parameters for the adsorption of Cr(VI) (a), 2,4-DCP(b) onto AC Fe3O4–Mt. (a) (pH = 6), 2,4-DCP(b) (pH = 6). | ||
| Thermodynamic parameters of AC Fe3O4–Mt | ||||||
|---|---|---|---|---|---|---|
| T/K | Cr(VI) | 2,4-DCP | ||||
| ΔH° (kJ mol−1) | ΔS° (J kmol−1) | ΔG° (kJ mol−1) | ΔH° (kJ mol−1) | ΔS° (J kmol−1) | ΔG° (kJ mol−1) | |
| 293 | 3.2677 | 17.8216 | −1.9592 | 13.8279 | 50.4275 | −0.9560 |
| 313 | 3.2677 | 17.8216 | −2.2985 | 13.8279 | 50.4275 | −1.9360 |
| 333 | 3.2677 | 17.8216 | −2.6736 | 13.8279 | 50.4275 | −2.9757 |
Additionally, the effect of the solution pH value on the pollutant removal efficiency of AC Fe3O4–Mt was established (Fig. 7a and b). In this study, the effect of AC Fe3O4–Mt on the removal of Cr(VI) and 2,4-DCP was greatly affected by pH value. The optimum pH value for the removal of 2,4-DCP was 6, while the maximum removed amount of Cr(VI) appeared when the solution pH value was 4. When the pH value of the solution was between 6 to 14, the adsorption capacity of AC Fe3O4–Mt to these two pollutants decreases rapidly, and the removed amount was 0 when pH >10. This may be due to the fact that when the solution was alkaline, the large amount of OH− in the solution competed with the anionic pollutants and occupied a considerable number of adsorption sites, resulting in a decrease in the pollutant adsorption capacity.37 Because of its weak acidity, lower pH value had little effect on the degradation of 2,4-DCP, but in the degradation of Cr(VI), when the pH value of the solution was 2–6, the main forms of Cr(VI) were HCrO4− and Cr2O72− ions. When the solution pH >6, there were mainly CrO42− ions in the solution,38 the adsorption sites occupied by the same amount of pollutants increase, and more OH− in the solution would form competitive adsorption with CrO42−. However, when the pH of the solution was less than 2, the removal of Cr(VI) and 2,4-DCP by AC Fe3O4–Mt decreased, due to the strongly acidic environment, which destroyed the structure of AC Fe3O4–Mt composites then oxidised Fe3O4.
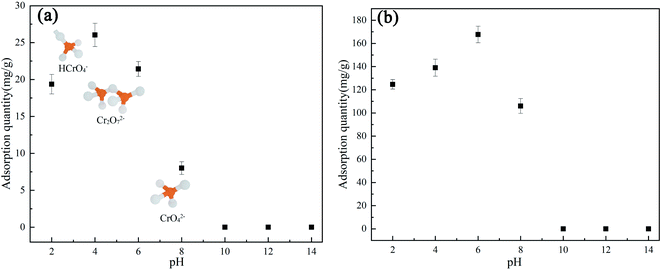 | ||
| Fig. 7 Effect of pH on AC Fe3O4–Mt adsorption of Cr(VI) (a) (20 °C, C0 = 100 mg L−1), 2,4-DCP(b) (20 °C, C0 = 500 mg L−1). | ||
Fig. 8 showed that the adsorption capacity of AC Fe3O4–Mt to Cr(VI) and 2,4-DCP increased with longer reaction times, and the removal equilibrium was reached at 25 min and 6 min, respectively. The reaction rate was evidently fast. The adsorption of Cr(VI) showed three different adsorption rate trends. In the pre-1 min, there were a large number of reaction sites on AC Fe3O4–Mt, and Cr(VI) contacted and reacted with Fe3O4 in AC Fe3O4–Mt rapidly. Removal also increased rapidly, before the reaction rate slowed down somewhere between 1–10 min. After 10 min, the reaction site was almost saturated, due to the large surface tension of Mt modified by CTAB, physical adsorption was carried out. AC Fe3O4–Mt had a faster removal rate of 2,4-DCP, accounting for 81% of the total removal within 30 seconds. Equilibrium was reached at 6 min.
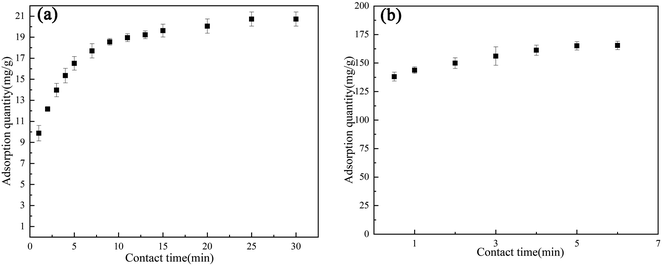 | ||
| Fig. 8 Effect of contact time on AC Fe3O4–Mt adsorption of Cr(VI) (a) (20 °C, pH = 6, C0 = 100 mg L−1), 2,4-DCP (b) (20 °C, pH = 6, C0 = 500 mg L−1). | ||
3.3 Analysis of removal mechanism
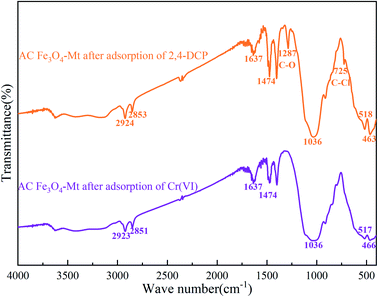
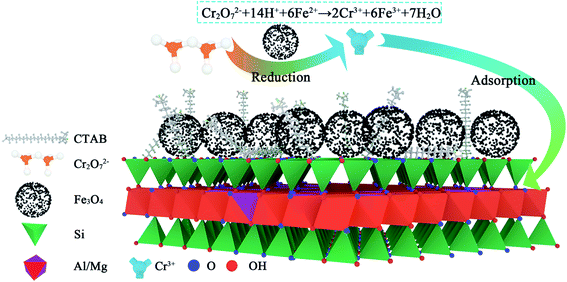
According to the infrared spectrum of Cr(VI) degraded by AC Fe3O4–Mt (Fig. 9), there was no Cr–O vibration peak after the degradation of Cr(VI). This proved that the mechanism of Cr(VI) degradation by AC Fe3O4–Mt was not simple adsorption, but that the modified Fe3O4–Mt initially reacted with Cr(VI) in solution, and then Cr(VI) ions were adsorbed on the Mt surface. The degradation of Cr(VI) mainly depends on the ability of Fe2+ to reduce Cr2O72−, and the following reactions took place;| Cr2O2−7 + 14H+ + 6Fe2+ → 2Cr3+ + 6Fe3+ + 7H2O |
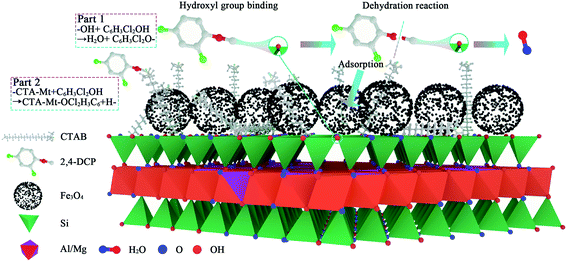
The specific reaction mechanism was shown in Fig. 10.
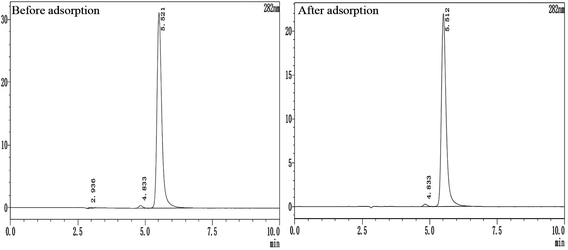
In the process of exploring the mechanism of AC Fe3O4–Mt's removal of 2,4-DCP, the 2,4-DCP solution before and after removal was determined at 282 nm by high performance liquid chromatography (Fig. 11), to determine whether phenol, 2-CP, and 4-CP were present in the solution after the reaction. Compared with the same concentration of 2,4-DCP solution, there were no phenol, 2-CP, or 4-CP chromatographic peaks before 5 min. Combined with Fig. 9, the characteristic C–O and C–Cl peaks appeared in the removed AC Fe3O4–Mt, and there was no –OH peak, suggesting that there was no de-chlorination reaction, but a dehydration reaction on the hydroxyl group occurred in the 2,4-DCP. According to Liu et al.,39 the strong bond strength of C–Cl was not easily broken. To achieve a de-chlorination reaction, it would be necessary to reduce the pH or use a catalyst.
In summary, the degradation ability of AC Fe3O4–Mt on 2,4-DCP is very weak, with the main adsorption occurring during removal. A dehydration reaction occurs between the 2,4-DCP hydroxyl group and the hydroxyl group on the surface of Mt. Subsequently the original Mt hydroxyl site is replaced and adsorption occurs on the Mt surface or interlayer. Furthermore, the combination of 2,4-DCP and Mt loaded CTAB, adsorbs to the Mt surface or interlayer. The specific reaction mechanism is shown in Fig. 12.
4. Conclusions
In this study, a new type of Fe3O4–Mt composite material for efficient removal of anionic pollutants was formed. The Mt was modified by HCl and CTAB to increase the number of hydroxyl groups on the Mt surface thus increasing surface tension. This was beneficial in the multi-directional crystallisation of Fe3O4 on the surface of Mt and in avoiding agglomeration. Fe3O4 was uniformly dispersed on the Mt surface with good crystallinity and high purity, and demonstrated a strong heavy metal and organic pollutant removal performance. The maximum removed amount of Cr(VI) by AC Fe3O4–Mt was 41.57 mg g−1, and the maximum removed amount of 2,4-DCP was 239.33 mg g−1, which was both large and reproducible. Additionally, the reaction rate was rapid, and removal equilibrium was reached in 25 min and 6 min, respectively. In addition, the removal effect was also affected by the ambient temperature and pH value of the solution. A higher temperature, and acidic conditions facilitate degradation reactions. AC Fe3O4–Mt is a type of environmentally functional material with excellent application potential due to its stable structure and effective heavy metals and organic pollutant removal from water.Conflicts of interest
There are no conflicts to declare.Acknowledgements
This research was jointly supported by Liaoning Province “Xingliao Talent Plan Project” (XLYC2007105) and Natural Science Foundation of Liaoning Province (2020-MS-202), and the Research Foundation of Key Laboratory of Deep Geodrilling Technology, Ministry of Natural Resources (No. KF201908).References
- A. Baral, R. Engelken, W. Stephens, J. Farris and R. Hannigan, Arch. Environ. Contam. Toxicol., 2006, 50, 496–502 CrossRef CAS PubMed.
- K. Bentaleb, Z. Bouberka, K. Chinoune, A. Nadim and U. Maschke, J. Taiwan Inst. Chem. Eng., 2017, 80, 578–588 CrossRef CAS.
- R. Saha, R. Nandi and B. Saha, J. Coord. Chem., 2011, 64, 1782–1806 CrossRef CAS.
- P. Van Aken, R. Van den Broeck, J. Degrève and R. Dewil, Chem. Eng. J., 2015, 280, 728–736 CrossRef CAS.
- U. Maheshwari and S. Gupta, Adsorpt. Sci. Technol., 2015, 33, 71–88 CrossRef CAS.
- L. Mohammadi, E. Bazrafshan, M. Noroozifar, A. Ansari-Moghaddam, F. Barahuie and D. Balarak, Water Sci. Technol., 2017, 76, 3054–3068 CrossRef CAS PubMed.
- M. Vinuth, M. Madhukara Naik, K. Karthik, H. S. Bhojya Naik and K. H. Hemakumar, Res. Chem. Intermed., 2019, 45, 2357–2368 CrossRef CAS.
- X. Wei, H. Wu, G. He and Y. Guan, J. Hazard. Mater., 2017, 321, 408–416 CrossRef CAS PubMed.
- L. Xu and J. Wang, Appl. Catal., B, 2012, 123–124, 117–126 CAS.
- J. Shah, M. Rasul Jan, M. Zeeshan and M. Imran, Appl. Clay Sci., 2017, 143, 227–233 CrossRef CAS.
- M. Vinuth, H. S. Bhojya Naik and J. Manjanna, Appl. Surf. Sci., 2015, 357, 1244–1250 CrossRef CAS.
- H. Ouachtak, R. El Haouti, A. El Guerdaoui, R. Haounati, E. Amaterz, A. A. Addi, F. Akbal and M. L. Taha, J. Mol. Liq., 2020, 309, 113142 CrossRef CAS.
- S. Liu, M. Chen, X. Cao, G. Li, D. Zhang, M. Li, N. Meng, J. Yin and B. Yan, Sep. Purif. Technol., 2020, 241 Search PubMed.
- W. S. Jemima, P. Magesan, P. Chiranjeevi and M. J. Umapathy, Silicon, 2018, 11, 925–933 CrossRef.
- B. S. Kadu, Y. D. Sathe, A. B. Ingle, R. C. Chikate, K. R. Patil and C. V. Rode, Appl. Catal., B, 2011, 104, 407–414 CrossRef CAS.
- W. J. Dai, P. Wu, D. Liu, J. Hu, Y. Cao, T. Z. Liu, C. P. Okoli, B. Wang and L. Li, Chemosphere, 2020, 251, 126074 CrossRef CAS PubMed.
- S. I. Rathnayake, W. N. Martens, Y. Xi, R. L. Frost and G. A. Ayoko, J. Colloid Interface Sci., 2017, 490, 163–173 CrossRef CAS PubMed.
- I. Larraza, M. Lopez-Gonzalez, T. Corrales and G. Marcelo, J. Colloid Interface Sci., 2012, 385, 24–33 CrossRef CAS PubMed.
- I. J. Buerge and S. J. Hug, Environ. Sci. Technol., 1998, 32, 2092–2099 CrossRef CAS.
- H. Jia and C. Wang, Chem. Eng. J., 2012, 191, 202–209 CrossRef CAS.
- Y. Jin, F. Liu, M. Tong and Y. Hou, J. Hazard. Mater., 2012, 227–228, 461–468 CrossRef CAS PubMed.
- P. Yuan, M. Fan, D. Yang, H. He, D. Liu, A. Yuan, J. Zhu and T. Chen, J. Hazard. Mater., 2009, 166, 821–829 CrossRef CAS PubMed.
- J. Yang, K. Yu and C. Liu, J. Hazard. Mater., 2017, 321, 73–80 CrossRef CAS PubMed.
- Y. Li, Z. Huang, Y. Xia, J. Shi and L. Gao, Indian J. Chem. Technol., 2020, 27, 116–125 CAS.
- Z. Huang, Y. Li, W. Chen, J. Shi, N. Zhang, X. Wang, Z. Li, L. Gao and Y. Zhang, Mater. Chem. Phys., 2017, 202, 266–276 CrossRef CAS.
- X.-y. Zou, F. Xiao, S.-r. Liu, X.-q. Cao, L. Li, M. Chen, L. Dong, X.-j. Lyu and Y.-j. Gai, Journal of Water Process Engineering, 2020, 37, 101348 CrossRef.
- B. Hu and H. Luo, Appl. Surf. Sci., 2010, 257, 769–775 CrossRef CAS.
- D. Li, Y. Ding, L. Li, Z. Chang, Z. Rao and L. Lu, Environ. Technol., 2015, 36, 1084–1090 CrossRef CAS PubMed.
- L. Ma, Y. Xi, H. He, G. A. Ayoko, R. Zhu and J. Zhu, Appl. Clay Sci., 2016, 120, 9–15 CrossRef CAS.
- J. Zhou, P. Wu, Z. Dang, N. Zhu, P. Li, J. Wu and X. Wang, Chem. Eng. J., 2010, 162, 1035–1044 CrossRef CAS.
- F. W. Shaarani and B. H. Hameed, Chem. Eng. J., 2011, 169, 180–185 CrossRef CAS.
- H. N. Bhatti, Z. Mahmood, A. Kausar, S. M. Yakout, O. H. Shair and M. Iqbal, Int. J. Biol. Macromol., 2020, 153, 146–157 CrossRef CAS PubMed.
- M. Raoov, S. Mohamad and M. R. Abas, J. Hazard. Mater., 2013, 263, 501–516 CrossRef CAS PubMed.
- M. Sathishkumar, A. R. Binupriya, D. Kavitha, R. Selvakumar, R. Jayabalan, J. G. Choi and S. E. Yun, Chem. Eng. J., 2009, 147, 265–271 CrossRef CAS.
- J. Xu, Z. Cao, X. Liu, H. Zhao, X. Xiao, J. Wu, X. Xu and J. L. Zhou, J. Hazard. Mater., 2016, 317, 656–666 CrossRef CAS PubMed.
- Y. Fang, A. Zhou, W. Yang, T. Araya, Y. Huang, P. Zhao, D. Johnson, J. Wang and Z. J. Ren, Sci. Rep., 2018, 8, 229 CrossRef PubMed.
- M. Mobarak, A. Q. Selim, E. A. Mohamed and M. K. Seliem, J. Mol. Liq., 2018, 259, 384–397 CrossRef CAS.
- K. Z. Setshedi, M. Bhaumik, S. Songwane, M. S. Onyango and A. Maity, Chem. Eng. J., 2013, 222, 186–197 CrossRef CAS.
- H. Liu, X. Ruan, D. Zhao, X. Fan and T. Feng, Ind. Eng. Chem. Res., 2016, 56, 191–197 CrossRef.
| This journal is © The Royal Society of Chemistry 2021 |


