 Open Access Article
Creative Commons Attribution 3.0 Unported Licence
Chitosan hydrogel for topical delivery of ebastine loaded solid lipid nanoparticles for alleviation of allergic contact dermatitis†
Tasbiha Kazim a,
Abeer Tariq
 a,
Muhammad Usman
 a,
Muhammad Faisal Ayoob
 b and
Ahmad Khan
 *a
*a
aDepartment of Pharmacy, Quaid-i-Azam University, Islamabad, Pakistan. E-mail: akhan@qau.edu.pk; Tel: +92 336158004
bNational Veterinary Laboratory, Islamabad, Pakistan
First published on 22nd November 2021
Abstract
Ebastine, is an antihistamine drug that exerts its effect upon oral administration in humans for the treatment of allergic contact dermatitis (ACD), it also has some systemic side effects like gastric distress, headache, drowsiness, and epistaxis. Moreover, topical corticosteroids are used for treatment of ACD, which causes the human skin to lose its thickness and elasticity. Hence, ebastine-loaded solid lipid nanoparticles (E-SLNs) were prepared and their topical efficacy against allergic contact dermatitis was determined. Compritol 888 ATO and tween 80 were used to prepare E-SLNs by cold dilution of the hot micro-emulsion. E-SLNs were optimized statistically by employing a central composite design using Design-Expert® version 11.0. Optimized E-SLNs showed spherical surface morphology, zeta potential of −15.6 ± 2.4 mV, PDI of 0.256 ± 0.03, and particle sizes of 155.2 ± 1.5 nm and th eentrapment efficiency of ebastine was more than 78%. Nanoparticles were characterized using FT-IR, XRD, and TEM. An E-SLNs loaded hydrogel was prepared using chitosan as a gelling agent and glutaraldehyde as a crosslinker. In vitro drug release studies performed for 24 hours on the E-SLNs dispersion and E-SLNs loaded hydrogel showed a sustained release of maximum 82.9% and 73.7% respectively. In vivo studies were conducted on BALB/c mice to evaluate the topical efficacy of the E-SLNs loaded hydrogel for allergic contact dermatitis. ACD was induced on the ear using picryl chloride solution. After induction, ears were treated daily with the E-SLNs loaded hydrogel for 15 days. Swelling behavior, mast cell count, and histopathological studies of the ear confirmed that the hydrogel alleviated the symptoms of allergic contact dermatitis.
1. Introduction
Allergic contact dermatitis (ACD) is a type-IV or delayed type hypersensitivity reaction triggered by a tiny molecule (less than 500 Daltons) that comes across a sensitive individual's skin.1 When a foreign material encounters the skin and forms an antigen complex with hapten protein, sensitization occurs.2 After first exposure to the allergen, the induction phase comprises various events and is completed when a person is sensitized and able to provide a positive ACD response.3 After elicitation, the effector phase commences and leads to clinical manifestations of ACD. It takes at least three days to many weeks to complete the process of the induction stage, whereas the effector phase reaction takes 1–2 days.4 The sensitized T cells trigger an inflammatory cascade when the epidermis is re-exposed to the antigen, resulting in skin changes correlated with allergic contact dermatitis. Allergic contact dermatitis is a frequent source of occupational skin illness, accounting for around 20% of all health problems at work.5 Poison ivy is a common cause of ACD, and it appears as linear stripes on the skin where the plant interacts.6 Nickel is another prevalent cause of ACD because nickel-containing necklaces and earrings are commonly worn. Rubber gloves are a leading cause of persistent dermatitis. Additional agents include hair colours, preservatives, fabrics, sunscreen, perfumes, and allergies.5ACD appears to be the outcome of both genetic trends and environmental factors in some of the groups at increased risk. Genealogy showed that ACD developed at higher rate, suggesting a hereditary susceptibility; however, the shared environment was a confounding factor. Women appear to be more prone to getting ACD. This disparity is due to exposures rather than sex differences; women have a greater incidence of nickel allergy, possibly due to the increased rate with which they wear jewellery.7 ACD is not uncommon in children and can cause severe clinical problems. ACD accounts for up to 20% of all childhood dermatitis. When compared to adults, ACD is uncommon in young children, and it develops more commonly as children get older and are exposed to more environmental allergens.8 Histamine is the key mediator in the production of allergic symptoms that is produced by the body and oral H1-antihistamines are one of the highly prescribed therapies for ACD. Ebastine is an oxypiperidine-based second-generation antagonist of H1-histamine receptor. Ebastine has fast absorption time and lengthy duration of action, at least partially mediated by the production of a more potent acid metabolite i.e., carebastine.9 Its antagonizing activity frequently prevents histamine activation, particularly in cases of acute hypersensitivity.10 Patients with allergic dermatitis, cold urticaria, demographic urticaria, mosquito bites, atopic asthma, and the common cold have shown positive results in some studies. Ebastine is usually administered via the oral route, however, it has its side effects.11 The most prevalent adverse events were headache 7.9%, sleepiness 3%, and mouth dryness 2.1%. Abdominal pain, epistaxis, dyspepsia, rhinitis, nausea, sinusitis, and sleeplessness were among the 1% of adverse events.12
Most medications pose a major challenge to the formulation researchers due to their poor water solubility, that is also superintend for low bioavailability.13 The encapsulation of the drug in a particulate carrier system is one way to solve the problem. Due to its unique capacity, solid lipid enhances the bioavailability of medicines with poor water solubility, it has emerged as a very appealing alternative among other carriers for drug delivery. SLNs are attractive as innovative colloidal drug carriers for topical usage because they provide a good mechanism for delivering pharmaceuticals via multiple application routes.14 The benefits of these carriers include minimal skin irritation, regulated release, and active substance protection. SLNs appear to be ideally suited for usage on injured and inflamed skin since they are constituted of non-toxic and non-irritative lipids.15 Furthermore, SLNs exhibit specific occlusive qualities due to the development of an integral film over the skin surface after drying, which reduces trans-epidermal water loss and promotes drug penetration through stratum corneum.16 Nano-sized SLNs, in addition to having a highly selective surface area, aid in the adhesion of the encapsulated medicine with the stratum corneum. Solid lipid nanoparticles can establish close contact with corneocyte cluster superficial connections and the furrows between corneocyte, which may encourage aggregation for several hours, allowing for prolonged drug release. SLNs also have a high pharmacological payload and can incorporate lipophilic and hydrophilic medicines.15
Administration of ebastine through oral route compromise its therapeutic efficacy through degradation to carebastine due to first-pass metabolism, low solubility that causes low plasma concentration, and have many systemic side effects. Oral ebastine is used with topical corticosteroids for the treatment of contact dermatitis. But topical steroid causes skin atrophy and skin loses its elasticity and thinning could result in skin striae.17 To surmount these concerns, ebastine was encapsulated into solid lipid nanoparticles, to enhance its solubility and to incorporate them into chitosan hydrogel for topical delivery. Chitosan was selected due to its anti-inflammatory property.18 These components are most appropriate because they are biodegradable, biocompatible, and non-irritant. Ebastine-loaded solid lipid nanoparticles will be delivered topically through hydrogel on the site of contact dermatitis. Ebastine will act as a mast cell stabilizer and alleviate allergic symptoms.19 Ebastine released in a sustained pattern will provide a prolonged effect after a single application of E-SLNs loaded hydrogel.
2. Material and methods
2.1. Materials
Ebastine was obtained from the Global pharmaceuticals. Compritol 888 ATO (Glyceryl Behenate) was received as a gift from Morgan Chemicals (Gattefosse, Germany), glutaraldehyde 70% (Sigma-Aldrich Chemie). Chitosan was purchased from Sigma Aldrich, M.W. = 310–375 kDa (CAS-9012-76-4). Picryl Chloride was obtained from Sigma Aldrich. Tween-80 was gifted by Horizon Pharmaceuticals. Olive oil (pharmaceutical grade) was obtained from Scotmann pharmaceuticals.2.2. Animals
Eight to ten weeks old BALB/c male mice were purchased from the National Institute of Health, Islamabad, Pakistan, for animal studies. Mice were transported to National Veterinary Laboratory, Islamabad to conduct the studies. They were held in polycarbonate cages, and for the whole study period. Standard laboratory pellets and tap water (ad libitum) were fed. The animal house was air-conditioned with 14 hours light and a dark 10 hours cycle (temperature 23 ± 2 °C and relative humidity 55 ± 5%). Procedures for conducting animal research were implemented in accordance with the NIH Policy Animal Welfare Act with the consent of the Quaid-i-Azam University BIO Ethics Committee, with assigned protocol no. BEC-FBS-QAU2021-310.2.3. Preparation of ebastine loaded solid lipid nanoparticles
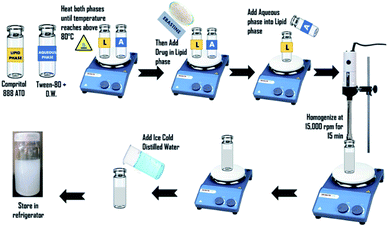
Nanoparticles were prepared by the hot homogenization method following cold dilution of micro-emulsion. To obtain ebastine-loaded solid lipid nanoparticles (E-SLNs), tween-80 was dissolved in 5 mL of distilled water using a magnetic stirrer. Compritol 888 ATO and ebastine were weighed. Compritol was heated up to 80 °C on a hot plate to melt it, referred as the lipid phase. Tween-80 with distilled water (aqueous phase) was heated to the very same temperature as the lipid phase.20 Ebastine was added into the melted lipid and then the aqueous phase was added. Homogenized at 15![[thin space (1/6-em)]](https://www.rsc.org/images/entities/char_2009.gif) 000 rpm for 15 minutes to form the initial w/o emulsion while maintaining the temperature at 75 °C.21 Obtained micro-emulsion was diluted with ice-cold distilled water which resulted in the formation of nano-emulsion and the subsequent formation of ebastine loaded solid lipid nanoparticles by lipid precipitation (Fig. 1).22
000 rpm for 15 minutes to form the initial w/o emulsion while maintaining the temperature at 75 °C.21 Obtained micro-emulsion was diluted with ice-cold distilled water which resulted in the formation of nano-emulsion and the subsequent formation of ebastine loaded solid lipid nanoparticles by lipid precipitation (Fig. 1).22
2.4. Experimental design
A two-factor four-level Central Composite Design (CCD) was employed for the optimization of Ebastine-loaded SLNs using Design-Expert® version 11.0. The influence of two independent variables i.e., solid lipid amount (X1), Drug amount (X2) on four dependant variables/responses viz. particle size (Y1), polydispersity index (Y2), zeta potential (Y3) and entrapment efficiency% (Y4) were evaluated.23 Ten experimental runs with two centre points were generated as per CCD. Formulations were made corresponding to the runs generated by the software. The results of responses were concurrently fitted into different mathematical models i.e., linear, quadratic, 2FI, and cubic models, and statistical significance was analysed. At a p-value less than 0.05, the model was regarded as significant.242.5. Preparation of E-SLNs loaded hydrogel
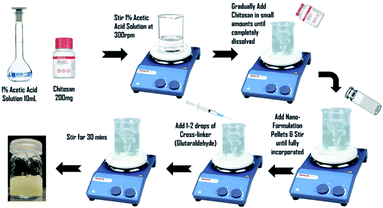
To prepare 2% w/v chitosan gel, 200 mg of chitosan powder were weighed and then dissolved in 10 mL of 1% v/v acetic acid. Stirred mechanically at room temperature. Pellets of E-SLNs formulation were added and mixed homogeneously. Then 1–2 drops of 0.1 M glutaraldehyde were added and stirred for 30 minutes to increase cross-linking reaction time. The resulting crosslinked chitosan hydrogel was poured into a closed container and stored at room temperature (Fig. 2).252.6. Characterization of E-SLNs
![[thin space (1/6-em)]](https://www.rsc.org/images/entities/char_2009.gif) :
:![[thin space (1/6-em)]](https://www.rsc.org/images/entities/char_2009.gif) 10) before analysis.
10) before analysis.![[thin space (1/6-em)]](https://www.rsc.org/images/entities/char_2009.gif) :
:![[thin space (1/6-em)]](https://www.rsc.org/images/entities/char_2009.gif) 10. R2 value and slope equation of calibration curve was used. Entrapment efficiency% and drug loading capacity% was determined by the following equations:
10. R2 value and slope equation of calibration curve was used. Entrapment efficiency% and drug loading capacity% was determined by the following equations:2.7. Characterization of E-SLNs loaded hydrogel
where W1 is the initial weight of hydrogel and W2 is the weight of gel after swelling.
2.8. In vitro release studies
The in vitro drug release of ebastine from ebastine suspension, E-SLNs, and E-SLNs loaded hydrogel was evaluated by dialysis bag method at pH 5.5 and 7.4 for 24 hours. Suspension of ebastine was prepared in release medium. After ultracentrifugation, a specific quantity of ebastine-loaded nanoparticles was redispersed in a little amount of phosphate buffers (pH 5.5 and 7.4) for nanoparticles and incorporation in hydrogel.31 Afterwards the suspension, nanoparticles, and hydrogel were transferred to a dialysis bag, tied at both ends with thread, and immersed in beakers containing buffers. The beakers were placed in a bath shaker and the temperature was kept at 37 ± 1 °C.32 At pre-defined time intervals, 2 mL of samples were withdrawn, and an equal amount of freshly prepared release medium was replaced to preserve sink conditions. Samples were analysed spectrophotometrically at 253 nm to measure drug release. Various kinetic models were applied to determine the release mechanism of ebastine from each formulation using DDSolver.332.9. Ex vivo permeation studies
2.10. Stability studies of E-SLNs loaded hydrogel
According to ICH guidelines, stability tests of the E-SLNs loaded hydrogel was carried out. A 6 month study was conducted at temperatures of 4 °C ± 2 °C and 25–35 °C with a relative humidity of 75 ± 5%, for 0, 1, 3, and 6 months. Drug content and pH were assessed. The E-SLNs loaded hydrogel was also examined physically for colour, grittiness, and phase separation.292.11. Skin irritation studies
BALB/c mice were used to evaluate the safety of E-SLNs hydrogel through a skin irritation study. Mice were divided into three groups (n = 3) and their hairs were shaved. Group I was negative control, group II was positive control (treated with 0.8% formalin), and group III was treated with E-SLNs hydrogel. After the application of formulations, mice skins were observed for edema and erythema for 24 hours. The Draize score method was used, primary dermal irritation (PDI) and primary dermal irritation index (PDII) were calculated. After 24 hours, mice were euthanized, and respective skins were removed surgically. Skins were fixed in 10% neutral buffered formalin (NBF). Haematoxylin and eosin staining was performed on the paraffin sections and observed under the microscope.362.12. In vivo allergic contact dermatitis studies
![[thin space (1/6-em)]](https://www.rsc.org/images/entities/char_2009.gif) :
:![[thin space (1/6-em)]](https://www.rsc.org/images/entities/char_2009.gif) 1 was applied to the left ear as vehicle in the same manner.
1 was applied to the left ear as vehicle in the same manner.2.13. Statistical analysis
All measurements were repeated three times. Results were presented as mean ± S.D. Statistical analysis was performed by one-way analysis of variance (ANOVA). Values of swelling percentage and mast cell count of positive control and treatment group were compared with negative/saline control group and the difference was assessed with Student's t-test (Excel Microsoft 365, USA). A p-value less than 0.05 was regarded significant.3. Results
3.1. Optimization of E-SLNs
Independent variables, solid lipid concentration (X1), and drug concentration (X2) had a significant effect on response variables including particle size (Y1), polydispersity index (Y2), zeta potential (Y3), and entrapment efficiency (Y4) as per CCD. The particle size (PS), PDI, zeta potential (ZP) and EE% values for the ten runs showed a variation from 74.5 nm to 185 nm, 0.233 to 0.586, −6.16 to −16 mV, and 35.3% to 78.8% respectively (Table 1). Best fitted model for particle size according to CCD was 2F1. Significant model for PDI was quadratic. Both zeta potential and entrapment efficiency followed linear model. Equations generated for each response are as follows:| PS (Y1) = 658.18290 − 40.89641 × X1 − 51.57331 × X2 + 3.988 × X1 × X2 |
| PDI (Y2) = 0.342882 × X1 − 0.051679 × X2 − 0.011480 × X1 × X2 − 0.011480 × X12 + 0.011760 × X22 − 1.52544 |
| ZP (Y3) = 6.38844 − 0.938793 × X1 − 0.606070 × X2 |
| EE% (Y4) = 9.04872 + 1.43990 × X1 + 4.92701 × X2 |
| Code | Factor 1 (X1) | Factor 2 (X2) | Surfactant | Response 1 (Y1) | Response 2 (Y2) | Response 3 (Y3) | Response 4 (Y4) |
|---|---|---|---|---|---|---|---|
| A: Compritol (mg) | B: Drug (mg) | Tween-80 (mg) | P.S. (nm) | PDI | Z.P. (mV) | EE (%) | |
| TKF1 | 16.0355 | 7.5 | 30 | 74.53 ± 2.4 | 0.233 ± 0.03 | −9.24 ± 0.04 | 72 ± 3 |
| TKF2 | 12.5 | 3.96447 | 30 | 135.2 ± 6.6 | 0.489 ± 0.07 | −7.74 ± 0.86 | 35.3 ± 1 |
| TKF3 | 12.5 | 7.5 | 30 | 137.1 ± 5.1 | 0.421 ± 0.05 | −8.23 ± 2 | 73 ± 5.1 |
| TKF4 | 8.96447 | 7.5 | 30 | 185 ± 8.2 | 0.258 ± 0.02 | −6.16 ± 0.5 | 50.8 ± 3.4 |
| TKF5 | 12.5 | 11.0355 | 30 | 101 ± 5 | 0.586 ± 0.04 | −9.95 ± 1 | 73.3 ± 2.5 |
| TKF6 | 10 | 10 | 30 | 137.1 ± 1.3 | 0.571 ± 0.07 | −7.76 ± 0.7 | 76.8 ± 2 |
| TKF7 | 15 | 5 | 30 | 98.4 ± 5.2 | 0.413 ± 0.01 | −16 ± 0.2 | 49 ± 0.7 |
| TKF8 | 12.5 | 7.5 | 30 | 137 ± 1.3 | 0.421 ± 0.03 | −9.485 ± 0.4 | 73 ± 2 |
| TKF9 | 10 | 5 | 30 | 180 ± 9.4 | 0.381 ± 0.06 | −7.3 ± 0.33 | 55 ± 6.3 |
| TKF10 | 15 | 10 | 30 | 155.2 ± 1.5 | 0.256 ± 0.03 | −15.6 ± 2.4 | 78.8 ± 3 |
The synergistic effect is presented by a positive sign with the independent variable, while the antagonistic effect is presented by a negative sign. The p-values for PS, PDI, ZP, and EE% were 0.0208, 0.0134, 0.0473, and 0.0283 respectively, which shows the significance of each model. Observed f-values for PS, PDI, ZP, and EE% were 7.16, 13.27, 4.87, and 6.19 respectively, which implies that all fitted models are significant.
3D response surface plot for particle size is shown in Fig. 3. The lipid and drug concentration have a positive effect on particle size, as presented in the 2F1 equation for particle size. It was noted that as the solid lipid content increased, the particle size increased as well, however, the change was non-significant. It is indeed possible that the non-significant increase in particle size is related to the lipid content's narrow range of 10 to 15 mg. Particle size was significantly affected by drug concentration. When the concentration of drug was increased from 5 to 10 mg, the particle size also increased.40
 | ||
| Fig. 3 Response surface plots of particle size, poly dispersity index, zeta potential, and entrapment efficiency%. | ||
Fig. 3 shows a 3D response surface plot for PDI. The quadratic equation shows that lipid and drug concentration have a disparate effect on PDI. Initially, PDI increased with an increase in the concentration of drug and lipid, but afterward, it decreased with further increase. In case of drug concentration, PDI decreased initially but later it increased.
The 3D response surface plot of zeta potential is shown in Fig. 3. The linear equation of ZP shows that both factors have a negative impact on zeta potential. With an increase in drug and lipid concentration, ZP decreased towards less negative values, making formulation less stable.41
While linear equation of EE% showed that lipid and drug concentration have positive impact, increase in concentration of drug and lipid increased the drug entrapment. EE% is high due to presence of long fatty chain compritol and tween-80 in high concentration. Formulation TKF 10 was chosen as optimized formulation.
3.2. Characterization of E-SLNs
 | ||
| Fig. 4 (a) Particle size distribution and PDI of optimized E-SLNs. (b) Zeta potential of optimized E-SLNs. (c) Transmission electron microscopy images of prepared optimized E-SLNs. | ||
The zeta potential of optimized formulation was −16 mV, which validates sufficient stabilization to the formulation (Fig. 4(b)). The low value of ZP is due to the presence of tween-80 which is a high molecular weight surfactant.
![[double bond, length as m-dash]](https://www.rsc.org/images/entities/char_e001.gif) O stretch of ketone group that flanked piperidine group to left, 1104 cm−1 represent C–N stretch adopting a chair conformation, 1470 cm−1 represent C
O stretch of ketone group that flanked piperidine group to left, 1104 cm−1 represent C–N stretch adopting a chair conformation, 1470 cm−1 represent C![[double bond, length as m-dash]](https://www.rsc.org/images/entities/char_e001.gif) C stretching due to vibration. Compritol showed absorption peaks at, 2917 cm−1 indicating aromatic C–H stretch, 2640 cm−1 representing alkyl C–H stretch, 1740 cm−1 shows C
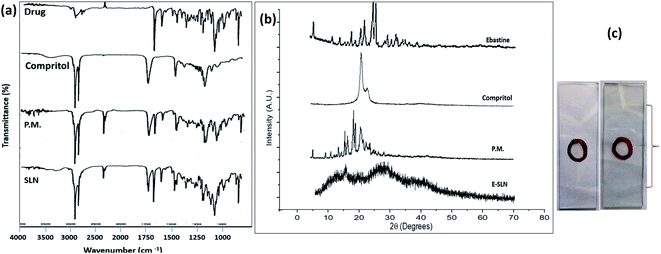
C stretching due to vibration. Compritol showed absorption peaks at, 2917 cm−1 indicating aromatic C–H stretch, 2640 cm−1 representing alkyl C–H stretch, 1740 cm−1 shows C![[double bond, length as m-dash]](https://www.rsc.org/images/entities/char_e001.gif) O stretch due to presence of ketone group, 1480 cm−1 represent O–H bend, 1240 cm−1 represents C–H bands. The FTIR spectrum of E-SLNs presented in Fig. 5(a) showed all characteristic absorption peaks, indicating the absence of any physical or chemical interaction between ebastine and compritol.
O stretch due to presence of ketone group, 1480 cm−1 represent O–H bend, 1240 cm−1 represents C–H bands. The FTIR spectrum of E-SLNs presented in Fig. 5(a) showed all characteristic absorption peaks, indicating the absence of any physical or chemical interaction between ebastine and compritol.
3.3. Characterization of E-SLNs loaded hydrogel
| Formulations | Zero order | First order | Kosmeyer–Peppas | Higuchi | Hixon Crowell | ||||||
|---|---|---|---|---|---|---|---|---|---|---|---|
| R2 | k0 | R2 | k1 | R2 | n | kP | R2 | kH | R2 | kHC | |
| E-SLN dispersion | 0.2086 | 4.590 | 0.8731 | 0.175 | 0.9691 | 0.347 | 29.615 | 0.8846 | 20.462 | 0.8115 | 0.048 |
| E-SLN loaded hydrogel | 0.4757 | 3.972 | 0.8726 | 0.105 | 0.9642 | 0.414 | 21.353 | 0.9431 | 17.290 | 0.8115 | 0.029 |
3.4. In vitro release studies
In vitro release investigation of ebastine suspension, E-SLNs, and E-SLNs loaded hydrogel was performed at pH 7.4 and pH 5.5. Ebastine suspension showed 81.9% release after the initial 6 hours, while E-SLNs showed 20% release in 6 hours and 36% release in 24 hours (Fig. 8(a)). E-SLNs loaded hydrogel showed 21% release after 24 hours at pH 7.4. At pH 5.5, Ebastine suspension showed 87% release after the initial 6 hours, while E-SLNs showed 64% release in 6 hours and 82.9% release in 24 hours. E-SLNs loaded hydrogel showed 73.7% release after 24 hours (Fig. 8(b)). Hydrogel showed more sustained release as compared to drug suspension and E-SLNs dispersion. Both E-SLNs and E-SLNs loaded hydrogel followed Korsmeyer–Peppas model. E-SLNs showed R2 equal to 0.9691 and “n” equal to 0.347. E-SLNs loaded hydrogel showed R2 equal to 0.9642 and “n” equal to 0.414 (Table 2). Value of n suggests that both formulations follow Fick's law and release drug through diffusion pattern. Initial burst release will provide fast onset of action on topical application whereas later sustained release of drug will provide a longer duration of action.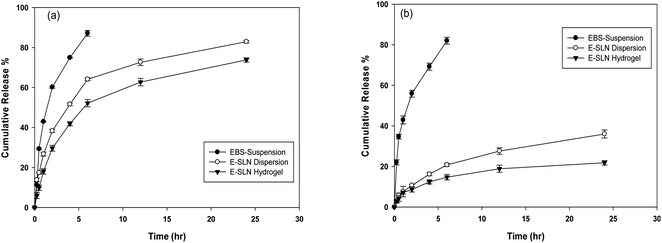 | ||
| Fig. 8 In vitro drug release profile for ebastine suspension, E-SLNs dispersion and E-SLNs loaded hydrogel (a) pH 5.5. (b) pH 7.4. (p < 0.05). | ||
3.5. Ex vivo permeation studies
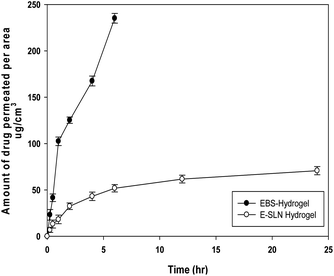
The amount of ebastine permeated per area was calculated. Ebastine gel showed maximum permeation as compared to E-SLNs loaded hydrogel. 232.15 μg cm−2 of ebastine from ebastine hydrogel permeated through mice skin in 6 hours. While negligible amount of ebastine permeated in 24 hours through E-SLNs loaded hydrogel into receiver compartment i.e., 70.76 μg cm−2. Results shown in Fig. 9 proves that the drug will provide topical effect on application.3.6. Stability studies of E-SLNs loaded hydrogel
E-SLNs loaded hydrogel stored at temperatures 4 °C and 25–35 °C showed no significant change in pH and drug content for 6 months. Colour change was observed after 6 months at room temperature (Table 3).| Physical appearance | ||||||
|---|---|---|---|---|---|---|
| Temperature | Time | Colour change | Phase separation | Grittiness | Drug content% | pH |
| 0 Day | No | No | No | 93.78 ± 2.36 | 7.61 ± 0.9 | |
| 25–35 °C | 30 Days | No | No | No | 93.04 ± 3.41 | 7.58 ± 0.21 |
| 90 Days | No | No | No | 91.56 ± 1.61 | 7.44 ± 0.13 | |
| 180 Days | Yes | No | No | 90.74 ± 4.07 | 7.38 ± 0.6 | |
| 0 Day | No | No | No | 93.78 ± 2.36 | 7.61 ± 1 | |
| 30 Days | No | No | No | 93.1 ± 0.03 | 7.61 ± 0.64 | |
| 4 °C | 90 Days | No | No | No | 92.29 ± 1.23 | 7.59 ± 0.2 |
| 180 Days | No | No | No | 91.41 ± 1.42 | 7.55 ± 0.17 | |
3.7. Skin irritation studies
Draize scoring was used to evaluate skin irritation in mice. E-SLNs loaded hydrogel showed PDII of 0.33 which represents negligible irritation, but formalin-treated mice showed PDII of 3.33. Results showed that hydrogel caused slight irritation, while formalin caused moderate irritation (Table 4). Histopathological examination was performed to confirm the findings. Histopathological images indicate that skin tissues of the positive control group are damaged by formalin, but no tissue damaged occurred in the mice group treated with E-SLNs loaded hydrogel (Fig. 10).| Groups | Erythema score | Edema score | P.D.I. | PDII | ||||||
|---|---|---|---|---|---|---|---|---|---|---|
| 1 h | 12 h | 24 h | 1 h | 12 h | 24 h | 1 h | 12 h | 24 h | ||
| Negative control | 0 | 0 | 0 | 0 | 0 | 0 | 0 | 0 | 0 | 0 |
| Positive control | 1 | 3 | 3 | 1 | 1 | 2 | 1 | 4 | 5 | 3.33 |
| E-SLN loaded hydrogel | 0 | 1 | 0 | 0 | 0 | 0 | 0 | 1 | 0 | 0.33 |
 | ||
| Fig. 10 Histopathological evaluation of skin irritation (a) negative control (b) positive control (c) E-SLNs loaded hydrogel. | ||
3.8. In vivo allergic contact dermatitis studies
4. Discussion
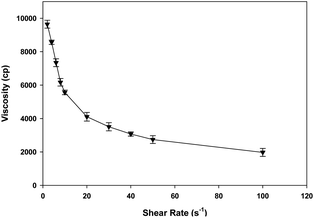
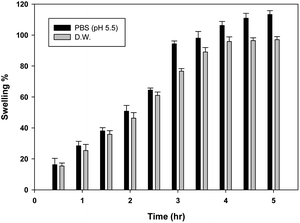
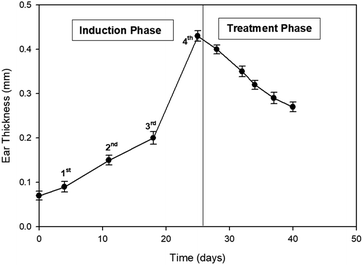
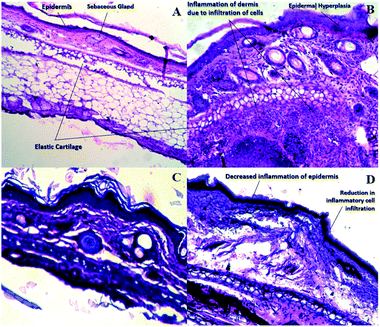
Ebastine has approximate bioavailability of 1%, which indicates that it has low solubility. For ebastine to be more effective, its bioavailability must be increased, which could be achieved by increasing its solubility. Compritol and tween-80 were chosen for the preparation of ebastine nanoparticles. Hot homogenization and cold dilution method were used for the preparation of E-SLNs. The central composite design was selected to optimize E-SLNs using design expert version 11. Ten formulations were proposed with two centre points, each run had a varying concentration of drug and lipid while keeping the concentration of surfactant constant. The effect of change in concentration of each factor was observed in terms of P.S., zeta potential, PDI, and entrapment efficiency. Formulation having minimum particle size with maximum zeta potential and EE% were selected through software. Tween 80 has long-chain fatty acid (oleic acid), which increases its hydrophobicity. Hydrophobic chains arrange more tightly in the oil phase when dispersed in cold water which reduces particle size. As the melting point of ebastine is higher than solid lipid, an increase in the ebastine concentration causes an increase in the particle size of SLNs because the viscosity of melted lipid increases at high drug concentration.42 Zeta potential between ±25 mV indicates the stability of nanoparticles. An increase in drug and solid lipid concentration increases zeta potential value when the concentration of surfactant is kept constant. This is mainly due to the presence of oxygen species on the nanoparticle surface, which provides a negative charge.43 EE% increased with an increase in the concentration of drug and lipid. Increased lipid content allows for additional area to encapsulate more drug, lowering its partition in the outer phase. This could also be attributed to an increase in medium viscosity, which results in faster solidification of nanoparticles.44 TKF 10 formulation was chosen, as it showed optimum results in every perspective. For topical application, the hydrogel was prepared using chitosan for the controlled release of the drug. The biocompatibility and biodegradability of chitosan have made it a desirable material for topical applications.45 Chitosan was selected due to its anti-inflammatory properties, which will aid in treating allergic contact dermatitis. High molecular weight chitosan has higher anti-inflammatory properties. It induces anti-inflammatory cytokine IL-10 production in animals.46 Swelling ratio is higher at pH 5.5 as compared to water because chitosan has high swelling at acidic pH. When the pH value of the medium is increased further, the swelling of chitosan hydrogels decreases. Because the concentration of H+ was high under low pH conditions, so chitosan is more likely to undergo protonation of the amine group to produce –NH3+. Amine group deprotonates when pH increases, this decreases repulsion between hydrogel polymer chains.47 On performing rheological studies, the viscosity of E-SLNs loaded hydrogel decreased on increasing the shear rate indicating that it is a non-Newtonian fluid with shear-thinning or pseudoplastic behaviour, which is a feature of high molecular weight polysaccharide solutions.48 Release of ebastine from E-SLNs and E-SLNs loaded hydrogel was evaluated at two different pH i.e., 5.5 and 7.4 for comparison. The slow release of ebastine from SLNs as compared to drug suspension indicates that the drug is entrapped and dispersed uniformly throughout the system. Tween 80 reduces interfacial tension between dissolution medium the SLNs, this decreases aggregation of drug particles and improves drug dissolution rate. The long lipophilic fatty acid chain of compritol also prolongs the release of ebastine.49 Kinetic models were applied to investigate the mechanism and pattern of release. Korsmeyer–Peppas was the best-fitted model with a value of n equal to 0.347, indicating release of drug according to Fick's law. Drug released through diffusion from homogeneous matrix system of lipid.50 Histopathological studies were performed to analyse the changes in tissue structure of the ear dermis. Ear dermis of mice after induction of contact dermatitis shows severe edema, it started to develop after picryl chloride application. Prominent fibroplasia is seen as compared to the normal ear. Inflammatory cell infiltration can be seen between the dermis and elastic cartilage. Eosinophils, neutrophils, and mononuclear cells were the common infiltrated cells present. This infiltration decreased after 5 days of treatment of E-SLNs loaded hydrogel and decreased further, after 15 days of treatment. The thickness of the epidermis is increased due to hyperplasia of keratinocytes and hyperkeratosis in positive control when compared with negative, which afterward decreased on treatment with E-SLNs loaded hydrogel.5. Conclusions
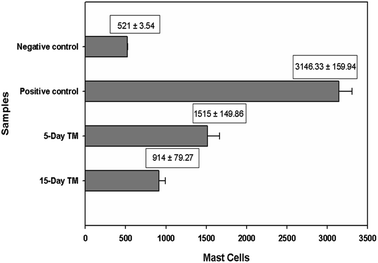
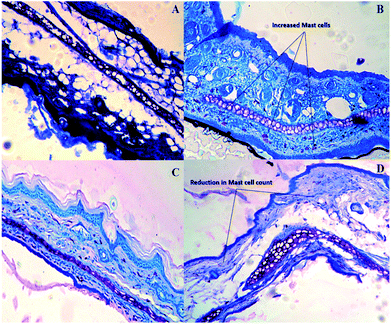
Ebastine-loaded SLNs were formulated and optimized, using central composite design and response surface methodology. The final formulation particle size was within nano-size and PDI was less than 0.5. Physically, crystalline ebastine was converted into an amorphous form when fabricated into SLNs. E-SLNs were successfully loaded into chitosan hydrogel with suitable pH, spreadability, homogeneity, and swelling behaviour. Ear swelling behaviour, histopathological studies, and mast cell count confirmed that E-SLNs loaded hydrogel alleviated the symptoms of allergic contact dermatitis in the animal model after successive applications.Author contributions
We affirm that this work was completed by the authors mentioned in this article and that the authors will bear all liabilities relating to aspects relevant to the content of the article.Conflicts of interest
There are no conflicts to declare.Acknowledgements
The authors are grateful to QAU, Islamabad for granting the fellowship during this research work. The authors are grateful to Ibn-e-sina Institute of Technology Islamabad, for providing facilities for TEM. NCP, Islamabad is also acknowledged for Powder X-ray diffractometry.References
- P. B. Murphy, J. N. Hooten, A. R. Atwater and W. Gossman, Allergic contact dermatitis, 2018 Search PubMed.
- B. J. Mark and R. G. Slavin, Allergic contact dermatitis, Med. Clin. North Am., 2006, 90(1), 169–185 CrossRef PubMed.
- I. Kimber, D. A. Basketter, G. F. Gerberick and R. J. Dearman, Allergic contact dermatitis, Int. Immunopharmacol., 2002, 2(2–3), 201–211 CrossRef CAS PubMed.
- M. D. Gober and A. A. Gaspari, Allergic contact dermatitis, Dermatologic Immunity, 2008, 10, 1–26 CAS.
- D. H. Kaplan, B. Z. Igyártó and A. A. Gaspari, Early immune events in the induction of allergic contact dermatitis, Nat. Rev. Immunol., 2012, 12(2), 114–124 CrossRef CAS PubMed.
- L. Kostner, F. Anzengruber, C. Guillod, M. Recher, P. Schmid-Grendelmeier and A. A. Navarini, Allergic contact dermatitis, Immunol. Allergy Clin. North Am., 2017, 37(1), 141–152 CrossRef PubMed.
- S. Nassau and L. Fonacier, Allergic contact dermatitis, Med. Clin., 2020, 104(1), 61–76 Search PubMed.
- C. G. Mortz and K. E. Andersen, Allergic contact dermatitis in children and adolescents, Contact Dermatitis, 1999, 41(3), 121–130 CrossRef CAS PubMed.
- D. J. Roberts, A preclinical overview of ebastine, Drugs, 1996, 52(1), 8–14 CrossRef CAS PubMed.
- R. G. Frare and A. K. Singh, A critical review of physicochemical properties and analytical methods applied to quantitative determination of ebastine, Crit. Rev. Anal. Chem., 2018, 48(2), 102–109 CrossRef CAS PubMed.
- S. Rico, R. M. Antonijoan and M. J. Barbanoj, Ebastine in the light of CONGA recommendations for the development of third-generation antihistamines, J. Asthma Allergy, 2009, 2, 73 CAS.
- J. Sastre, Ebastine in allergic rhinitis and chronic idiopathic urticaria, Allergy, 2008, 63, 1–20 CrossRef PubMed.
- N. Islam, M. Irfan, N. Abbas, H. K. Syed, M. S. Iqbal, I. ullah Khan, A. Rasul, S. Inam, A. Hussain, M. S. Arshad and M. Ali, Enhancement of solubility and dissolution rate of ebastine fast-disintegrating tablets by solid dispersion method, Trop. J. Pharm. Res., 2020, 19(9), 1797–1805 CrossRef CAS.
- R. Parhi and P. Suresh, Preparation and characterization of solid lipid nanoparticles-a review, Curr. Drug Discovery Technol., 2012, 9(1), 2–16 CrossRef CAS PubMed.
- R. M. Khalil, A. Abd El-Bary, M. A. Kassem, M. M. Ghorab and M. Basha, Influence of formulation parameters on the physicochemical properties of meloxicam-loaded solid lipid nanoparticles, Egypt. Pharm. J., 2013, 12(1), 63 Search PubMed.
- J. Pardeike, A. Hommoss and R. H. Müller, Lipid nanoparticles (SLN, NLC) in cosmetic and pharmaceutical dermal products, Int. J. Pharm., 2009, 366(1–2), 170–184 CrossRef CAS PubMed.
- A. Coondoo, M. Phiske, S. Verma and K. Lahiri, Side-effects of topical steroids: A long overdue revisit, Indian dermatology online journal, 2014,(4), 416 CrossRef PubMed.
- H. D. Jhundoo, T. Siefen, A. Liang, C. Schmidt, J. Lokhnauth, B. Moulari, A. Béduneau, Y. Pellequer, C. C. Larsen and A. Lamprecht, Anti-inflammatory effects of acacia and guar gum in 5-amino salicylic acid formulations in experimental colitis, Int. J. Pharm.: X, 2021, 3, 100080 CAS.
- H. Ben-Eli and A. Solomon, Topical antihistamines, mast cell stabilizers, and dual-action agents in ocular allergy: current trends, Curr. Opin. Allergy Clin. Immunol., 2018, 18(5), 411–416 CrossRef PubMed.
- Z. Kipriye, B. Şenel and E. Yenilmez, Preparation and evaluation of carvedilol-loaded solid lipid nanoparticles for targeted drug delivery, Trop. J. Pharm. Res., 2017, 16(9), 2057–2068 CrossRef CAS.
- D. Chirio, E. Peira, C. Dianzani, E. Muntoni, C. L. Gigliotti, B. Ferrara, S. Sapino, G. Chindamo and M. Gallarate, Development of solid lipid nanoparticles by cold dilution of microemulsions: curcumin loading, preliminary in vitro studies, and biodistribution, Nanomaterials, 2019,(2), 230 CrossRef CAS PubMed.
- V. A. Duong, T. T. Nguyen and H. J. Maeng, Preparation of solid lipid nanoparticles and nanostructured lipid carriers for drug delivery and the effects of preparation parameters of solvent injection method, Molecules, 2020,(20), 4781 CrossRef CAS PubMed.
- T. Mehmood, A. Ahmed, Z. Ahmed and M. S. Ahmad, Optimization of soya lecithin and Tween 80 based novel vitamin D nanoemulsions prepared by ultrasonication using response surface methodology, Food Chem., 2019, 289, 664–670 CrossRef CAS PubMed.
- A. Srivastava, S. Kumar, P. Kushwaha, P. Maddheshiya and M. Srivastava, Formulation and Optimization of Ketoprofen Loaded Solid Lipid Nanoparticles Using Central Composite Design, Pharm. Biosci. J., 2019, 10–19 CrossRef CAS.
- P. Domalik-pyzik and K. Pielichowska, Chitosan-Based Hydrogels: Preparation, Properties, and Applications, 2019 Search PubMed.
- R. Rajan and D. T. Vasudevan, Effect of permeation enhancers on the penetration mechanism of transfersomal gel of ketoconazole, J. Adv. Pharm. Technol. Res., 2012, 3(2), 112 CrossRef CAS PubMed.
- R. F. El-Kased, R. I. Amer, D. Attia and M. M. Elmazar, Honey-based hydrogel: in vitro and comparative in vivo evaluation for burn wound healing, Sci. Rep., 2017, 7(1), 1 CrossRef PubMed.
- A. Ahad, A. A. Al-Saleh, A. M. Al-Mohizea, F. I. Al-Jenoobi, M. Raish, A. E. Yassin and M. A. Alam, Pharmacodynamic study of eprosartan mesylate-loaded transfersomes Carbopol® gel under Dermaroller® on rats with methyl prednisolone acetate-induced hypertension, Biomed. Pharmacother., 2017, 89, 177–184 CrossRef CAS PubMed.
- M. Qindeel, N. Ahmed, F. Sabir, S. Khan and A. Ur-Rehman, Development of novel pH-sensitive nanoparticles loaded hydrogel for transdermal drug delivery, Drug Dev. Ind. Pharm., 2019, 45(4), 629–641 CrossRef CAS PubMed.
- M. M. Nitalikar and D. M. Sakarkar, Formulation and evaluation of topical gel of Meloxicam with β-Cyclodextrin complex, Res. J. Pharm. Technol., 2013, 6(7), 790–793 Search PubMed.
- P. K. Gaur, S. Mishra, M. Bajpai and A. Mishra, Enhanced oral bioavailability of efavirenz by solid lipid nanoparticles: in vitro drug release and pharmacokinetics studies, BioMed Res. Int., 2014, 2014 Search PubMed.
- H. Ansari and P. Singh, Formulation and in vivo evaluation of novel topical gel of lopinavir for targeting HIV, Curr. HIV Res., 2018, 16(4), 270–279 CrossRef CAS PubMed.
- A. Siswanto, A. Fudholi, A. K. Nugroho and S. Martono, In vitro release modeling of aspirin floating tablets using DDSolver, Indones. J. Pharm., 2015, 26(2), 94 CrossRef CAS.
- J. Q. Zhang, J. Liu, X. L. Li and B. R. Jasti, Preparation and characterization of solid lipid nanoparticles containing silibinin, Drug Delivery, 2007, 14(6), 381–387 CrossRef CAS PubMed.
- N. K. Jain and A. Ram, Development and characterization of nanostructured lipid carriers of oral hypoglycemic agent: selection of surfactants, Int. J. Pharm. Sci. Rev. Res., 2011, 7(2), 125–130 CAS.
- K. G. Phillips, P. Thuillier and S. L. Jacques, In vivo measurement of epidermal thickness changes associated with tumor promotion in murine models, J. Biomed. Opt., 2010, 15(4), 041514 CrossRef PubMed.
- M. Ikeda, K. Kuroki, H. Suzuki, H. Nakayama, J. Saegusa and K. Doi, Picryl chloride-induced allergic dermatitis in IQI/Jic female mice, Exp. Toxicol. Pathol., 2000, 52(3), 235–240 CrossRef CAS PubMed.
- K. Itoh, M. Masuda, S. Naruto, K. Murata and H. Matsuda, Antiallergic activity of unripe Citrus hassaku fruits extract and its flavanone glycosides on chemical substance-induced dermatitis in mice, J. Nat. Med., 2009, 63(4), 443–450 CrossRef CAS PubMed.
- J. Y. Jung, J. Saegusa, H. Nakayama and K. Doi, Comparative study on picryl chloride (PCL)-induced contact dermatitis in female IQI/Jic and BALB/c mice, Exp. Anim., 2004, 53(2), 89–96 CrossRef CAS PubMed.
- R. Kaur, N. Sharma, K. Tikoo and V. R. Sinha, Development of mirtazapine loaded solid lipid nanoparticles for topical delivery: optimization, characterization and cytotoxicity evaluation, Int. J. Pharm., 2020, 586, 119439 CrossRef CAS PubMed.
- S. Honary and F. Zahir, Effect of zeta potential on the properties of nano-drug delivery systems-a review (Part 2), Trop. J. Pharm. Res., 2013, 12(2), 265–273 Search PubMed.
- R. A. Sanad, N. S. AbdelMalak and A. A. Badawi, Formulation of a novel oxybenzone-loaded nanostructured lipid carriers (NLCs), AAPS PharmSciTech, 2010,(4), 1684–1694 CrossRef CAS PubMed.
- L. Shi, Z. Li, L. Yu, H. Jia and L. Zheng, Effects of surfactants and lipids on the preparation of solid lipid nanoparticles using double emulsion method, J. Dispersion Sci. Technol., 2011, 32(2), 254–259 CrossRef CAS.
- P. Ekambaram and A. A. Sathali, Formulation and evaluation of solid lipid nanoparticles of ramipril, J. Young Pharm., 2011, 3(3), 216–220 CrossRef CAS PubMed.
- R. Muzzarelli, V. Baldassarre, F. Conti, P. Ferrara, G. Biagini, G. Gazzanelli and V. Vasi, Biological activity of chitosan: ultrastructural study, Biomaterials, 1988, 9(3), 247–252 CrossRef CAS PubMed.
- M. El-Badry and G. Fetih, Preparation, characterization and anti-inflammatory activity of celecoxib chitosan gel formulations, J. Drug Delivery Sci. Technol., 2011, 21(2), 201–206 CrossRef CAS.
- E. Budianto, S. P. Muthoharoh and N. M. Nizardo, Effect of crosslinking agents, pH and temperature on swelling behavior of cross-linked chitosan hydrogel, Asian J. Appl. Sci., 2015, 3(5), 581–588 Search PubMed.
- M. Lopez-Carrizales, E. Mendoza-Mendoza, R. D. Peralta-Rodriguez, M. A. Pérez-Díaz, D. Portales-Pérez, M. Magaña-Aquino, A. Aragón-Piña, R. Infante-Martínez, E. D. Barriga-Castro, R. Sánchez-Sánchez and G. A. Martinez-Castañon, Characterization, antibiofilm and biocompatibility properties of chitosan hydrogels loaded with silver nanoparticles and ampicillin: an alternative protection to central venous catheters, Colloids Surf., B, 2020, 196, 111292 CrossRef CAS PubMed.
- R. Paliwal, S. Rai, B. Vaidya, K. Khatri, A. K. Goyal, N. Mishra, A. Mehta and S. P. Vyas, Effect of lipid core material on characteristics of solid lipid nanoparticles designed for oral lymphatic delivery, Nanomedicine, 2009, 5(2), 184–191 CrossRef CAS PubMed.
- I. Permanadewi, A. C. Kumoro, D. H. Wardhani and N. Aryanti, Modelling of controlled drug release in gastrointestinal tract simulation, J. Phys.: Conf. Ser., IOP Publishing, 2019 Sep 1, vol. 1295, no. 1, p. 012063 Search PubMed.
Footnote |
| † Electronic supplementary information (ESI) available. See DOI: 10.1039/d1ra06283b |
| This journal is © The Royal Society of Chemistry 2021 |

