 Open Access Article
Graphene oxide–chitosan hydrogel for adsorptive removal of diclofenac from aqueous solution: preparation, characterization, kinetic and thermodynamic modelling
Hossein Mahmoodi ,
Moslem Fattahi
 * and
Mohsen Motevassel
Chemical Engineering Department, Abadan Faculty of Petroleum Engineering, Petroleum University of Technology, Abadan, Iran. E-mail: h.mahmoodi2014@yahoo.com; fattahi@put.ac.ir; motavassel@put.ac.ir
First published on 11th November 2021
Abstract
This work aimed at developing a natural compound-based hydrogel adsorbent to remove diclofenac as a model pharmaceutical from water. First, graphene oxide–chitosan (GO–CTS) and amine graphene oxide–chitosan (AGO–CTS) hydrogel adsorbents were synthesized via a facile mechanical mixing method. The synthesized materials were characterized through Fourier transform infrared spectroscopy (FTIR), X-ray diffraction (XRD), Brunauer–Emmett–Teller (BET), scanning and transmission electron microscopy (SEM and TEM), Raman spectroscopy, and thermogravimetric analysis (TGA) techniques. In the second stage, adsorption experiments were conducted to determine the best GO to CTS ratio and find the optimized adsorption parameters, including the initial drug concentration, adsorbent dosage, pH, and temperature. The results showed that the optimal GO to CTS mass ratio is 2![[thin space (1/6-em)]](https://www.rsc.org/images/entities/char_2009.gif) :
:![[thin space (1/6-em)]](https://www.rsc.org/images/entities/char_2009.gif) 5 and thus the same ratio was selected as the AGO to CTS mass ratio to understand the effect of amine-functionalization on removal efficiency. The optimal adsorption parameters were determined to be pH of 5, Ci of 100 ppm and dosage of 1.5 g L−1, where 90.42% and 97.06% removal was achieved for optimal GO–CTS and AGO–CTS hydrogel adsorbents, respectively. Langmuir and Freundlich isotherms models were employed to investigate the adsorption behavior of diclofenac onto the synthesized hydrogels. The results revealed that the adsorption tends to be of the monolayer type and homogeneous, as the results were in better accordance with the Langmuir model than the Freundlich model. The thermodynamics of adsorption demonstrated that the adsorption is exothermic, exhibiting higher removal efficiency at lower temperatures. Furthermore, Gibb's free energy change of adsorption (ΔG) suggested that the adsorption is spontaneous, being more spontaneous for AGO–CTS than GO–CTS hydrogels. Finally, the regeneration ability of the hydrogel adsorbents was studied in five consecutive cycles. The adsorbent maintained its efficiency at a relatively high level for three cycles but a considerable decrease was observed between the third and the fourth cycle, indicating that the hydrogels were recoverable for three cycles.
5 and thus the same ratio was selected as the AGO to CTS mass ratio to understand the effect of amine-functionalization on removal efficiency. The optimal adsorption parameters were determined to be pH of 5, Ci of 100 ppm and dosage of 1.5 g L−1, where 90.42% and 97.06% removal was achieved for optimal GO–CTS and AGO–CTS hydrogel adsorbents, respectively. Langmuir and Freundlich isotherms models were employed to investigate the adsorption behavior of diclofenac onto the synthesized hydrogels. The results revealed that the adsorption tends to be of the monolayer type and homogeneous, as the results were in better accordance with the Langmuir model than the Freundlich model. The thermodynamics of adsorption demonstrated that the adsorption is exothermic, exhibiting higher removal efficiency at lower temperatures. Furthermore, Gibb's free energy change of adsorption (ΔG) suggested that the adsorption is spontaneous, being more spontaneous for AGO–CTS than GO–CTS hydrogels. Finally, the regeneration ability of the hydrogel adsorbents was studied in five consecutive cycles. The adsorbent maintained its efficiency at a relatively high level for three cycles but a considerable decrease was observed between the third and the fourth cycle, indicating that the hydrogels were recoverable for three cycles.
1. Introduction
Water is an indispensable part of life that is being progressively polluted by various contaminants including dye, pharmaceutical, and pesticide effluents which can pose significant threats to human health and other living beings causing long-lasting detrimental impacts on ecological environments.1–3 Pharmaceuticals have vast worldwide applications in the treatment of all kinds of living beings. However, the generation of pharmaceutical wastewater is one the most serious problems caused by their uncontrolled usage.4 Discharge of the polluted wastewater results in contamination of the ground, surface, and drinking water, endangering human health and limiting water sources.5 The complex structure, low level of biodegradability, xenobiotic nature, easy accumulation, and high level of persistency are the most distinctive properties of pharmaceuticals that explain the urgent need for their removal from wastewater.6,7 The aforementioned characteristics make the elimination of these materials quite challenging.Diclofenac is a commonly prescribed analgesic nonsteroidal anti-inflammatory drug (NSAID) used to reduce inflammation in arthritis and rheumatic disorders.8 Chronic exposure to diclofenac has detrimental impacts not only on aquatic animals but also on humans by causing hemodynamic changes and thyroid tumors. As open literature reports, diclofenac is one of the most highly detected pharmaceuticals at large concentrations even on the scale of μg L−1.9,10 Therefore, efficient removal techniques should be employed to remove the residual diclofenac from water bodies.
Recently, various methods have been explored to achieve efficient removal of pharmaceuticals from wastewater. Ozonation, biodegradation, ultrafiltration membrane, electrocoagulation, and adsorption have been extensively studied to tackle the problems associated with pharmaceuticals.11,12 Pollutants sequestration is another emerging technology that can be used for removal of a variety of pollutants but its application for pharmaceuticals is limited.13,14 Considering the simplicity of operation, removal efficiency, safety, and economic feasibility; adsorption can be regarded as the most promising choice.15 Numerous adsorbents have been utilized to treat pharmaceuticals in aqueous solutions such as multi-walled carbon nanotubes, zeolites, biochar, biopolymers, activated carbon, clay composite, silica, etc.14–18
Chitosan (CTS), the second abundant natural biopolymer, has attracted enormous attention due to its excellent properties in the past years. CTS is a linear polysaccharide that is mainly produced from crustacean shells-derived chitin by deacetylation that has a wide range of applications in a variety of fields.11 The unique behavior of CTS is due to having numerous repeating units consisting of plenty of functional groups such as highly reactive amino and hydroxyl groups.16,19 Moreover, it has other advantages such as low cost, non-toxicity, availability, biocompatibility, and above all, biodegradability which makes it a green choice as an adsorbent for water purification applications.17 However, the acceptable water solubility of CTS could be achieved only in acidic conditions and it is barely soluble in basic solutions. Therefore, amino groups can hardly be protonated in basic solutions and the removal would not be efficient anymore, which is a major barrier to large usage of CTS.21,22 This drawback has made researchers look for modifications of CTS using an additional agent.
Graphene oxide (GO), a perfect two-dimensional substance with a honeycomb lattice, which is produced from graphite has been widely utilized as an advantageous adsorbent for the removal of different pollutants from water.20,21 Two exceptional characteristics of GO account for its priority to other candidates as adsorbents: (i) large surface area (theoretically 2630 m2 g−1), which enables it to provide a satisfactory specific area for adsorption.22 (ii) Having copious oxygen-containing groups including carbonyl, carboxyl, hydroxyl, and epoxide groups, that facilitates the bonding interactions between GO (as adsorbent) and pollutant material (as adsorbate) and also facilitate GO dispersion in polar solvents.23 Despite all the remarkable properties of GO, there is a noteworthy problem that has retracted the application of GO in real engineering problems. GO has a strong tendency to aggregate during adsorption owing to π–π interactions.24 To solve this problem, composites of GO and many synthetic polymers have been studied and proven to be efficient in the adsorption of pollutants from water. However, most of these polymers suffer from a lack of environmental friendliness.25 In recent years, a huge deal of interest has been directed toward GO–CTS composites as novel bioadsorbents with enhanced adsorption properties compared to the pristine materials that are safer to use from an environmental viewpoint.26 Nevertheless, in comparison to composite adsorbents with synthetic polymers, the achievement of very high removal efficiencies is still challenging due to insufficient interactions of active groups of adsorbent and adsorbate.27 One feasible approach that can be adapted to facilitate the interaction is the modification of functional groups of GO that results in higher selectivity of the composite. Ample oxygen-containing groups of GO render the chemical structure extremely prone to modification through nitrogen-containing molecules. Therefore, amine or amine-containing materials could be of considerable potential for enhancement of the adsorbate–adsorbent interaction and consequently, boosting the adsorption efficiency.28–32
Melamine, as an organic compound, has been widely used for functionalization of various adsorbents owing to the presence of three free amine groups in its structure. Melamine-based MOFs, melamine-functionalized graphene hydrogel and poly-melamine formaldehyde resins are examples of melamine-based adsorbents used for water treatment purposes. Therefore, melamine-functionalized GO can be a promising material as an absorbent with enhanced functionalities.30
Hydrogels are three-dimensional, cross-linked structured polymers that exhibit hydrophilic behavior which provides them with the ability to swell and trap considerable amounts of water. As a result, adsorbents in the form of hydrogel have favorable adsorption characteristics.31 However, the poor mechanical strength and limited functionalities restrict their application in many files. A common approach to enhance the mechanical performance of hydrogels is the use of chemical cross-linkers which lowers the extent of biodegradability of natural hydrogels. A superior approach to address this issue can be the introduction of nanoparticle adsorbents into the hydrogel matrix that would increase the functionalities of hydrogels and improve their mechanical stability at the same time. Hydrogel composites of CTS–GO have been the focus of attention in many fields especially medical science in the past recent years due to the advantages of CTS and GO and extra benefits of hydrogel structure.32 However, to the best of the authors' knowledge, only a few reports have been given on employing hydrogel composites of CTS and GO as adsorbents for water treatment purposes.27
This study aims to investigate of adsorptive removal of diclofenac by novel biodegradable GO–CTS hydrogel adsorbents without utilizing the chemical cross-linkers, using GO nanoparticles as both adsorbent and cross-linkers of the hydrogel matrix. To reach this, the GO–CTS and AGO–CTS hydrogel adsorbents were synthesized via mechanical mixing method and characterized through different techniques.
2. Experimental procedures
2.1 Chemical reagents
Analytical grade of chitosan (medium molecular weight), acetic acid, ethanol (purity ≥99.9), deionized water, diclofenac sodium (molecular weight = 318.13 g mol−1), KMnO4 (purity ≥99), H3PO4 (purity ≥88), HCl (37%), H2O2 (30 wt% in H2O2), H2SO4 (96%), melamine powder (99%), dimethylformamide (DMF), thionyl chloride and dimethylsulfoxide (DMSO) (purity ≥99) were all purchased from Merck Company (Germany). Graphite powder was obtained from US nanomaterials, Inc. (the USA). All the reagents were used as received without any further treatment or purification.2.2 Synthesis of GO
GO was synthesized using a modified Hummers' method.36 Typically, a solution of H2SO4 and H3PO4 (9![[thin space (1/6-em)]](https://www.rsc.org/images/entities/char_2009.gif) :
:![[thin space (1/6-em)]](https://www.rsc.org/images/entities/char_2009.gif) 1) was added to a mixture of graphite flakes (2 g) and KMnO4 (15 g). The temperature of the mixture was fixed at 50 °C and stirred for 12 h. Afterward, the mixture was cooled to 0 °C followed by the addition of water (200 mL) and H2O2 (3 mL). Finally, the product was centrifuged and washed with HCl (5%) and distilled water several times.
1) was added to a mixture of graphite flakes (2 g) and KMnO4 (15 g). The temperature of the mixture was fixed at 50 °C and stirred for 12 h. Afterward, the mixture was cooled to 0 °C followed by the addition of water (200 mL) and H2O2 (3 mL). Finally, the product was centrifuged and washed with HCl (5%) and distilled water several times.
2.3 Synthesis of melamine functionalized GO (AGO)
First, GO (0.2 g) was dispersed ultrasonically for 2 h in an excess amount of thionyl chloride (SOCl2, 100 mL) followed by heating at 80 °C for 24 h to transform the carboxyl functional group of GO to acyl chloride. The product was separated via centrifugation at 7000 rpm, dried at 50 °C, washed with ethanol, and then dried again at 60 °C. Second, melamine (0.5 g) was added into 30 mL DMSO and magnetically stirred to obtain a colorless and homogeneous solution. Acyl chloride GO powder was dispersed in the melamine solution under ultra-sonication for 1 h followed by heating at 80 °C for 24 h. Finally, the melamine-functionalized GO powder was separated through centrifugation, dried at 100 °C, and washed with ethanol. The functionalized GO powder was labeled AGO which stands for amine-functionalized GO.2.4 Synthesis of GO–CTS hydrogels
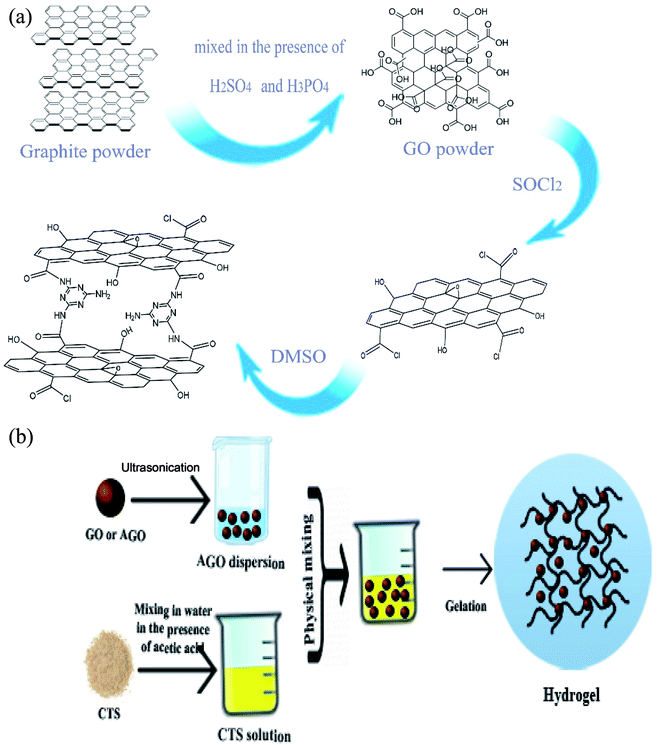
Hydrogels were synthesized using a simple and facile mechanical mixing method without any heat treatment and usage of chemical cross-linkers. In a typical procedure, graphene oxide was dispersed in deionized water followed by sonication for 1 h to obtain a uniform aqueous dispersion of GO (10 mg mL−1). A predetermined amount of GO dispersion was mixed with 10 mL of as-prepared CTS solution (50 mg mL−1) in a glass vial, instantly followed by the addition of 0.6 mL of glacial acetic acid. The mixture was mechanically mixed for 30 min to ensure that the mixture was completely homogeneous. Then, the mixture was settled down for several days at room temperature in order to allow the gelation process to complete. The dried hydrogels were obtained and kept at 0 °C for later use. The same procedure was carried out for AGO powder with the replacement of GO by AGO. The hydrogels were labeled GO1–CTS5, GO2–CTS5, GO3–CTS5, GO4–CTS5, and AGO2–CTS5 (AGO–CTS hydrogel was synthesized only at the optimum GO to CTS ratio which is determined in Section 3.3) where the numbers in front of GO and CTS represents their mass ratio in the synthesized hydrogels. The preparation scheme of the materials are demonstrated in Fig. 1.2.5 Swelling ratio measurement
Swelling–shrinking behavior of the adsorbents which is one the most important factors accounting for the adsorption capacity is probed by obtaining the equilibrium swelling ratio of the hydrogels. For this purpose, the pre-weighted dried hydrogels were immersed in deionized at for 24 h to establish equilibrium. To calculate the swelling ratio, the swollen adsorbents were separated through filtration and weighed subsequently. It is worth noting that the swelling measurements were carried out in triplicate that only the average value was calculated and has been reported in this work. Calculation of the swelling ratio was performed according to the following equation:
 | (1) |
2.6 Sorption tests
The hydrogels were immersed in deionized water before adsorption tests for 24 h with water replacement every 2 h to remove the residual acetic acid. To measure the adsorption capacity of the synthesized CTS–GO hydrogels, batch adsorption experiments were performed to remove diclofenac as a representative of pharmaceuticals from aqueous solutions. For each experiment, a desired concentration of diclofenac was obtained by diluting a prepared stock solution (200 ppm). All the experiments were temperature-controlled, conducted on a thermostat shaker (KS 3000ic). To evaluate the effect of temperature on the adsorption process, the temperature ranged from 15 °C to 45 °C in different experiments. Typically, 25 mL of the solution and the desired amount of each GO–CTS hydrogel adsorbents were added into a conical flask and shook until the concentration of diclofenac was nearly constant and the system reached equilibrium. The initial pH of the solution was adjusted by adding NaOH (1 M) and HCl (1 M). All of the experiments were done in duplicates and only the average values are reported. After adsorption, the hydrogel was separated from the solution by decantation followed by centrifugation to achieve full separation. The concentration of the residual diclofenac was determined via a UV-vis spectrophotometer (SQ2800E, Unico) at the maximum adsorption wavelength λmax = 276 nm.The adsorption capacity and removal efficiencies were calculated using the following equations, respectively:
 | (2) |
 | (3) |
2.7 Characterization
XRD patterns of the materials were acquired using a PW1730 PHILIPS X-ray diffractometer with Cu Kα radiation. The accelerating voltage, operating current, and scanning range were 40 kV, 30 mA, and 5 to 80°, respectively. Samples were prepared by freeze-drying and crushed before the tests. In order to analyze the surface functional groups of the materials, an FT-IR spectrometer (Avatar, Thermo, USA) was employed to collect the required spectra. The samples were pressed into standard KBr disks and spectra were recorded in the frequency range of 400 to 4000 cm−1.The specific surface area and the pore diameter of the adsorbents were determined via BET and BJH analyses that were carried out at 120 °C on a BET analyzer (Belsorp mini II, BEL, Japan). Raman spectra were obtained via a confocal Raman spectrometer (TakRam N1-541, Teksan, Iran) at the laser excitation wavelength of 532 nm with the laser power maintained below 1 mW. Adsorbents were washed with ethanol and dried at room temperature before performing SEM and TEM analysis. The surface morphologies of hydrogel adsorbents were investigated by FE-SEM (Mira III, Tescan, Czech Republic) as well as TEM (CM 120, Netherlands). The study of thermal stability and degradation of the adsorbents was carried out using TGA analysis via a thermogravimetric analyzer (Q600, TA, and the USA). The curves were obtained at temperatures ranging from 25 to 1000 °C at a heating rate of 10 °C min−1 under the constant circulation of N2 atmosphere.
3. Results and discussion
3.1 Characterization of materials
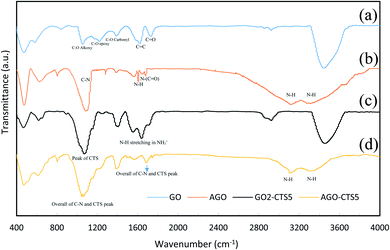
Structural changes in functionalization of GO and hydrogel formation were studied through FTIR analysis. Fig. 2 represents the FTIR spectrum of GO, AGO, GO2–CTS5, and AGO2–CTS5. For GO, the characteristic peaks appeared at 1732, 1392, 1224, 1060, 1624, and 3446 cm−1 which are attributed to the C![[double bond, length as m-dash]](https://www.rsc.org/images/entities/char_e001.gif) O stretching vibration in the carboxyl group, C–O vibration in carboxyl group, C–O vibration in epoxy, C–O vibration in alkoxy, C
O stretching vibration in the carboxyl group, C–O vibration in carboxyl group, C–O vibration in epoxy, C–O vibration in alkoxy, C![[double bond, length as m-dash]](https://www.rsc.org/images/entities/char_e001.gif) C benzenoid vibration and OH vibration, respectively.33 FTIR spectrum of AGO shows two broad peaks at 3130 and 3310 cm−1 corresponding to NH stretching band of N–H (NH2) and one peak at 1612 cm−1 representing N–H bending vibration. The peaks at 1080, 1684, and 1560 cm−1 represent C–N stretching, N–(C
C benzenoid vibration and OH vibration, respectively.33 FTIR spectrum of AGO shows two broad peaks at 3130 and 3310 cm−1 corresponding to NH stretching band of N–H (NH2) and one peak at 1612 cm−1 representing N–H bending vibration. The peaks at 1080, 1684, and 1560 cm−1 represent C–N stretching, N–(C![[double bond, length as m-dash]](https://www.rsc.org/images/entities/char_e001.gif) O) stretching and C–N ring stretching vibrations, respectively which proves the successful melamine-functionalization of GO via covalent linking.
O) stretching and C–N ring stretching vibrations, respectively which proves the successful melamine-functionalization of GO via covalent linking.
The changes in the structure of the material when forming hydrogel can be understood from the FTIR spectrum of GO2–CTS5. It is evident that a new peak emerged at 1640 cm−1 in the GO2–CTS5 spectrum compared to GO which is related to the N–H stretching vibration of NH3+ due to the transformation of amine groups under extremely acidic synthesis conditions.34 The characteristic peak of the carboxylic group of GO is flattened and shifted from 1732 to 1710 cm−1 in the GO2–CTS5 spectrum suggesting the possible interaction of this group with NH3+ of CTS. Furthermore; a strong peak emerged at 1080 cm−1 which is a characteristic peak of CTS that overlapped with the peak of the epoxy group of GO at 1224 cm−1. This proves the presence of CTS in the synthesized hydrogels.
The FTIR spectrum of AGO2–CTS5 exhibits two broad peaks corresponding to the N–H vibration of amine groups. The peak at 1064 is the overall peak of the C–N stretching band observed in the AGO peak and the peak at 1080 in the GO2–CTS5 spectrum. A new peak also emerged at 1681 cm−1 in the AGO2–CTS5 spectrum compared to the AGO and GO2–CTS5 spectrum which can be due to the partial overlap of the N–H vibration peak of NH3+ in GO2–CTS5 with N–(C![[double bond, length as m-dash]](https://www.rsc.org/images/entities/char_e001.gif) O) stretching vibration peak in AGO.35
O) stretching vibration peak in AGO.35
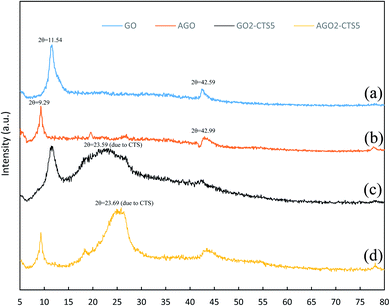
Fig. 3 presents the XRD patterns of GO, AGO, GO2–CTS5, and AGO2–CTS5 hydrogels in order to characterize the nanostructure of the hydrogels. The XRD pattern of GO exhibits two major peaks at 2θ = 11.54 and 42.59 corresponding to the interlayer spacing of 0.85 and 0.234 nm between GO sheets, respectively. Generally, the interlayer spacing of graphite sheets is 0.34 nm. The wider distance between the layers of GO is due to the presence of functional groups such as carboxyl, epoxy, etc.36,37 The XRD pattern of AGO reveals that after functionalization of GO with melamine the strong peak of GO is weakened and shifted to 2θ = 9.29° indicating that interlaying spacing of GO sheets increased to 1.05 nm. Such a change can be attributed to the insertion of melamine between the GO layers that partially destroys the organized stacking of GO sheets. The XRD patterns of GO2–CTS5 and AGO2–CTS5 exhibit peaks at 2θ = 23.59° and 2θ = 23.69°, respectively which are the characteristic peaks of CTS. The intensity of this peak is lower for GO2–CTS5 compared to AGO2–CTS5 which suggests that the formation of hydrogel decreases the crystalline structure of CTS to a greater extent in the presence of GO than AGO. Moreover, the broader peak of CTS in AGO2–CTS5 shows that the structure of CTS is enriched more in the presence of AGO than GO.
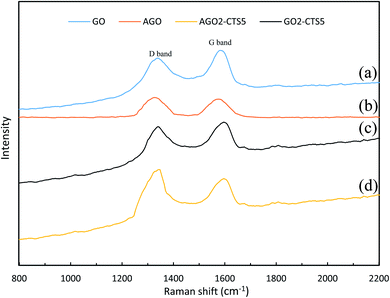
Raman spectra of GO, AGO, GO2–CTS5, and AGO2–CTS5 hydrogels are shown in Fig. 4 to further investigate the structure of the materials. Two noticeable peaks can be clearly observed in the spectrum of all the materials representing D and G bands, respectively. Generally, the G band is attributed to the stretching vibration of sp2 carbon atoms in the graphitic 2D hexagonal lattice. Whereas the D band appears due to the disorders and defects in the carbon material which leads to the stretching vibration of sp3 carbon atoms. Therefore, the ratio of the intensity of the D band (ID) to the intensity of the G band (IG) is the criterion based on which the extent of disorders and defects in carbon materials is evaluated.38 An obvious increase in the above-mentioned ratio, compared with pure GO (0.913), can be observed in the spectra of AGO (1.075). This improved ID/IG ratio suggests the increased defects of AGO as a result of the amine-grafting process.
In the case of GO2–CTS5, a shift of D and G bands to higher wavenumbers was observed and the ID/IG ratio increased slightly (0.945) compared to GO, which is due to the disorders that are brought about by the introduction of CTS onto GO. AGO2–CTS5 exhibited the highest ID/IG ratio (1.113) as a result of both amine-grafting of GO and the addition of CTS.
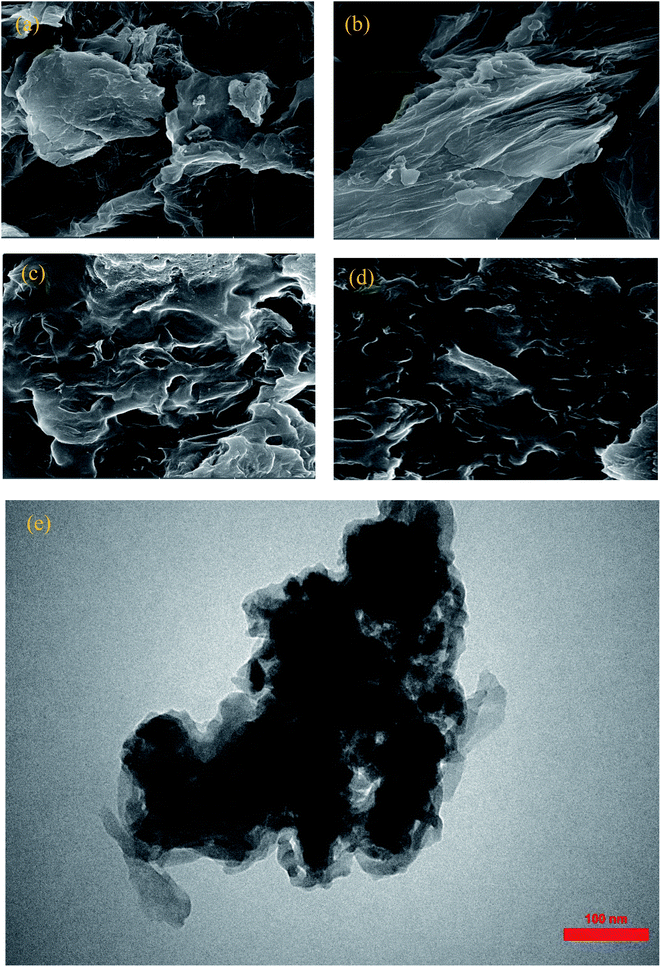
SEM and TEM micrographs of GO, AGO, GO2–CTS5, and AGO2–CTS5 are represented in Fig. 5. GO micrograph exhibited a wrinkled structure with ultra-large sheets in the lateral size of the order of μm. AGO showed a considerably more wrinkled structure with obvious disorders in the layers stacking as a result of the introduction of melamine groups between GO layers. Fig. 5c and d show that both GO2–CTS5 and AGO2–CTS5 hydrogels have interconnected 3-D cross-linked structures with variable pore sizes. SEM analysis shows that the hydrogel matrix is more random and disordered in the case of AGO2–CTS5 compared to GO2–CTS5. Furthermore, at higher magnification, a clear aggregation of AGO nanoparticles in the hydrogel matrix is observed which is possibly due to increased hydrophobicity as a result of the substitution of the carboxylic group of GO with melamine. Moreover, no clear CTS particles can be seen in the hydrogels, suggesting the uniform distribution of CTS polymeric chains. TEM micrograph of AGO2–CTS5 hydrogel also shows a wrinkled sheet-like polymeric structure with a random distribution of AGO nanoparticles in the hydrogel.
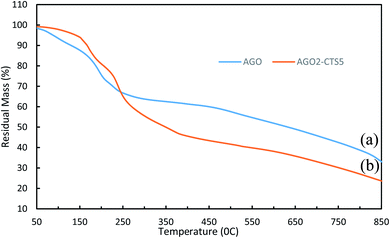
The thermal stability of AGO and AGO2–CTS5 hydrogel was studied using the TGA curves of Fig. 6. A slight mass loss occurs for GO even below 100 °C which can be attributed to evaporation of the adsorbed water in the π-stacking of GO. A second abrupt mass loss stage is observed between the approximate temperatures of 150 °C and 250 °C, which is primarily because of the pyrolysis and decomposition of oxygen-containing functional groups of GO. A third mass loss stage was also observed which was gradual and owing to the thermal decomposition of side groups and melamine functionalities. CTS has been shown to be thermally stable over high-temperature ranges especially up to almost 200 °C owing to its grafted polymer chains. This enables CTS to improve the thermal stability of the materials with which it is coupled.35,43 AGO2–CTS5 shows great thermal stability especially up to 200 °C where it experiences less mass loss than pure AGO, indicating that AGO2–CTS5 is more stable than AGO at temperatures lower than 200 °C. This significant improvement suggests the existence of strong interactions between polymeric matrixes of CTS with AGO nanoparticles. Moreover, GO nanoparticles can act as a thermal barrier that inhibits heat transfer into the hydrogel matrix. However, at higher temperatures, AGO2–CTS5 experiences a rather rapid degradation rate due to simultaneous decomposition of side chains of CTS and functional groups of GO.
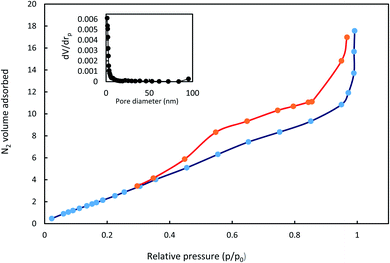
The isotherms of N2 adsorption–desorption AGO2–CTS5 hydrogel and its pore distribution are shown in Fig. 7. A typical type-IV curve was observed with a hysteresis loop between the relative pressure (p/p0) of 0.4 and 1.0, which suggests that AGO2–CTS5 hydrogel has a mesoporous structure. The specific surface area of non-swollen AGO2–CTS5 was calculated to be 7.07 m2 g−1 based on the Brunauer–Emmett–Teller (BET) method. Furthermore, the BJH analysis of the pore size distribution showed that the pore size for the AGO2–CTS5 hydrogel was centralized at approximately 1.21 nm, indicating the existence of mesoporous in AGO2–CTS5, which is in accordance with the results obtained from N2 adsorption–desorption analysis. The aforementioned results and analysis demonstrated the porous structure of the synthesized AGO2–CTS5 hydrogel, which has a great effect on the adsorption capacity of the AGO2–CTS5 adsorbent.
3.2 Swelling behavior of hydrogels
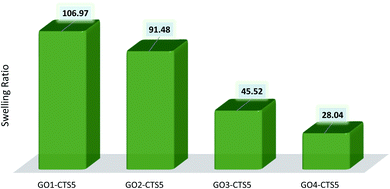
The equilibrium swelling ratio of the prepared GO–CTS hydrogels in distilled water was calculated through eqn (1) and was presented in Table 1 and Fig. 8. As shown in Table 1, the swelling ratio of the hydrogels decreases with the introduction of more GO into the hydrogel matrix. Such a decrease in swelling ratio is due to the crosslinking role of GO which increases the adherence of the hydrogel structure resulting in decreased water holding capacity. Such increased network stability can also be due to the possible interaction of GO functionalities with that of CTS, resulting in H-bonding or electrostatic attraction.| Sample | Initial weight | Swollen weight | Swelling ratio |
|---|---|---|---|
| GO1–CTS5 | 150 mg | 16![[thin space (1/6-em)]](https://www.rsc.org/images/entities/char_2009.gif) 196 mg 196 mg |
106.97 |
| GO2–CTS5 | 150 mg | 13![[thin space (1/6-em)]](https://www.rsc.org/images/entities/char_2009.gif) 872 mg 872 mg |
91.48 |
| GO3–CTS5 | 150 mg | 6829 mg | 45.52 |
| GO4–CTS5 | 150 mg | 4357 mg | 28.04 |
3.3 Determination of optimized GO content and concentration
The optimized ratio of GO to CTS in the hydrogel was determined through experiments at various drug concentrations and adsorbent dosages. As can be seen in Fig. 9, the removal efficiency of GO2–CTS5 is higher than that of GO1–CTS5 at any given concentration because of increasing in the GO content that leads to larger available adsorption surface area and amplified adsorbate–adsorbent interactions. However, the removal efficiency decreases slightly when the GO content increases making GO3–CTS5 less efficient than GO2–CTS5 by a close margin. This phenomenon is the overall result of decreased swelling ratio and increased present active sites. As a general rule, the adsorption process is facilitated when more active sites are available. However, in the case of GO3–CTS5, the diffusion of drug molecules from liquid to the adsorption sites becomes significantly important due to the more compact structure of the hydrogel compared to GO2–CTS5. The GO4–CTS5 shows the lowest removal efficiencies due to the extreme dominance of adverse effect of the swelling ratio over increased active sites.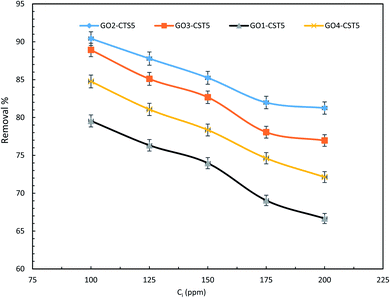 | ||
| Fig. 9 Effect of initial drug concentration of removal efficiency of the GO–CTS hydrogels (adsorbent dosage = 1.5 g L−1, pH = 5, optimal pH, contact time = 110 min, temperature = 298 K). | ||
As is represented in Fig. 9, at relatively lower concentrations the removal efficiency was higher owing to the presence of fewer adsorbate molecules. However, the removal efficiency decreases at higher initial concentrations because of the partial saturation of the adsorption sites. The figures represent a slight change in slope where the relatively sharp slop of the curve diminishes after which the removal efficiency remains almost the same with an increase in initial diclofenac adsorption. Such a trend can be justified by the large number of diclofenac molecules competing over the limited adsorption sites of GO–CTS hydrogels. Therefore, regardless of how many molecules remain, only a few can be adsorbed on the surface of the almost saturated adsorbent. The results reveal that the removal efficiency decreases from 90.42% to 81.25% over the concentration range of 100 to 200 ppm. The removal efficiency is 81.98% and 81.25% at 175 and 200 ppm, respectively, which are approximately the same showing that at concentrations higher than 175 ppm removal efficiency remains nearly the same. Therefore, for the rest of the experiments, the GO to CTS ratio of 2 to 5 which resulted in the highest efficiency was selected.
Also, the initial concentration of 100 ppm was chosen for the following experiments as the highest removal efficiency was obtained at this concentration over the range of 100 to 200 ppm.
3.4 Determination of optimum adsorbent dosage
The dosage of adsorbent is one of the most significant factors in the adsorptive removal of pollutants not only in terms of efficiency of the adsorption process but also in regard to economic concerns and the operating cost of the process.44 To determine and verify the impact of adsorbent dosage, sets of experiments were done at different concentrations with varying dosages. Fig. 10, presents the effect of adsorbent dosage on removal efficiency and adsorption capacity. It can be seen that the removal efficiency of diclofenac onto GO2–CTS hydrogel escalates for all concentrations as the adsorbent dosage rises from 0.5 to 1.5 g L−1, which can be credited to the overall increase in the adsorption surface area. However, the adsorption capacity declines with an increase in dosage. This antagonist impact occurs due to the expanded diffusional pathway of pollutant molecules caused by the aggregation of the hydrogel at high dosages. In other words, the number of active sites is bigger at higher dosages but a large portion of them become unavailable due to the enlarged diffusional pathway. This phenomenon leaves the additional active sites unoccupied and causes the adsorption capacity to reduce. The highest attained removal efficiency is 90.42% at 100 ppm and the dosage of 1.5 g L−1. At higher dosages than 1.5 g L−1, the removal efficiency stays almost the same and the achievement of higher efficiencies with GO2–CTS5 hydrogel would be practically impossible. This dictates that a different approach should be adopted to tackle this issue and attain higher efficiencies and fulfill the aim of this study. Fig. 10 demonstrates that the removal efficiency is 97.06% for AGO2–CTS5 at 100 ppm and the dosage of 1.5 g L−1 which is nearly 7% higher than that of GO2–CTS5. Furthermore, AGO2–CTS5 hydrogel exhibits superior adsorption capacities than GO2–CTS5 owing to the enhanced removal efficiencies. Based on the above analysis, the optimum dosage and concentration of 1.5 g L−1 and 100 ppm at which the highest removal efficiency was achieved were chosen for the subsequent tests.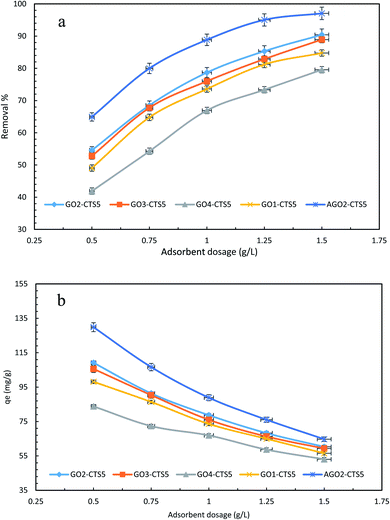 | ||
| Fig. 10 Effect of adsorbent dosage on (a) removal efficiency and (b) adsorption capacity (initial concentration = 100 ppm, pH = 5, contact time = 110 min, temperature = 298 K). | ||
3.5 Adsorption kinetics
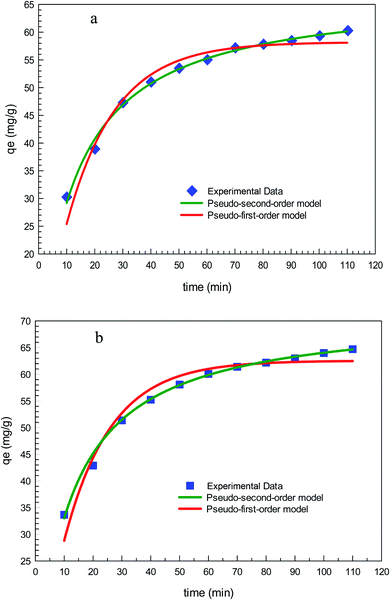
Fig. 11 depicts the time-dependent adsorption capacity of diclofenac into GO2–CTS5 and AGO2–CTS5 hydrogels. For both adsorbents, the uptake of diclofenac through adsorption exhibited a rapid removal in the first 40 min followed by a gradual removal until the system reached equilibrium after 110 min. It can be easily noticed that the adsorption of diclofenac was enhanced remarkably by AGO2–CTS5 hydrogels compared to GO2–CTS5. The aforementioned reduction in the adsorption rate over time is due to the occupation of vacant sites of adsorbent by diclofenac. To better understanding the mechanism of diclofenac adsorption into GO–CTS hydrogels and interpret the time-dependent variations in adsorption, different kinetic models were employed to analyze the data represented in Fig. 11.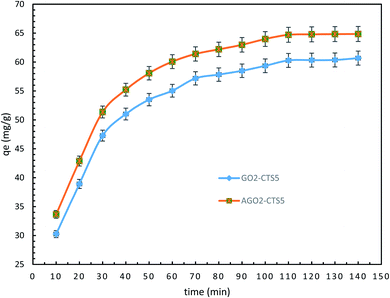 | ||
| Fig. 11 Time-dependent removal by GO2–CTS5 and AGO2–CTS5 (adsorbent dosage = 1.5 g L−1, initial concentration = 100 ppm, pH = 5, temperature = 298 K). | ||
The principle of the pseudo-first-order kinetic model is that adsorption is governed by the diffusion step, meaning that physical adsorption is the dominant process.39 However, the pseudo-second-order kinetic model is based on the assumption that the dominant process is chemical adsorption. The latter takes into account the interaction between adsorbent and adsorbate such as ion transferring and sharing which determines the adsorption rate.40 The non-linear equation for the pseudo-first-order model is as follows:
| qt = qe,1(1 − e−k1t) | (4) |
 | (5) |
The results of fitting the experimental data in pseudo-first-order and pseudo-second-order kinetic models are demonstrated in Fig. 12 and the calculated kinetic parameters of each model are given in Table 2. Clearly, the experimental data is in a better agreement with the results of the pseudo-second-order model than the pseudo-first-order model for both GO2–CTS5 and AGO2–CTS5 considering the determination coefficient (R2) which is higher for the second-order model than the first-order model. Therefore, the pseudo-second-order model is more suitable to describe the adsorption of diclofenac which indicates that chemical adsorption is the dominant mechanism. This means that chemical interactions including electron sharing and exchange are the rate-determining schemes in the adsorption of diclofenac onto the hydrogels.
| Hydrogel | Pseudo-first-order model | Pseudo-second-order model | ||||
|---|---|---|---|---|---|---|
| k1 (min−1) | qe,1 (mg g−1) | R2 | k2 (g mg−1 min−1) | qe,2 (mg g−1) | R2 | |
| GO2–CTS5 | 0.057 | 58.21 | 96.64 | 1.1 × 10⁻³ | 67.23 | 99.45 |
| AGO2–CTS5 | 0.061 | 62.55 | 95.55 | 1.1 × 10⁻³ | 72.31 | 99.47 |
Additionally, the intra-particle diffusion model was employed to further study the mechanism of adsorption and discover the actual rate-controlling step because pseudo-first-order and pseudo-second-order models are unable to provide diffusion-related information. The intra-particle diffusion can be mathematically expressed as follows:
| qt = kpit0.5 + Ci | (6) |
The plots and regressions of qt versus t1/2 are presented in Fig. 13 for both AGO2–CTS5 and GO2–CTS5. In both cases, the adsorption process consists of two sections. The first step with the highest rate can be attributed to film diffusion due to the transfer of diclofenac molecules from the liquid to the external surface of the AGO2–CTS5 and GO2–CTS5 adsorbents. The second stage that showed a gradual adsorption process at a slower rate is attributed to the diffusion of adsorbate molecules from the external surface into the pores of the hydrogels, indicating that the adsorption of diclofenac onto AGO2–CTS5 and GO2–CTS5 is controlled by intra-particle diffusion.41 Therefore, both intra-particle diffusion and film diffusion have a significant impact on the rate of the adsorption process (Table 3).
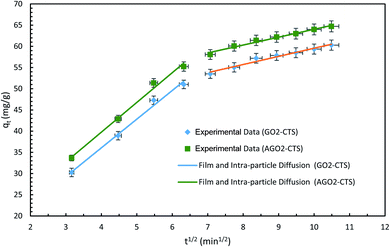 | ||
| Fig. 13 Intra-particle diffusion models of diclofenac adsorption onto GO2–CTS5 and AGO2–CTS5 (adsorbent dosage = 1.5 g L−1, initial concentration = 100 ppm, pH = 5, temperature = 298 K). | ||
| Hydrogel | kp1 | kp2 | C1 | C2 | Radj2 | R2 |
|---|---|---|---|---|---|---|
| GO2–CTS | 6.76 | 1.91 | 9.01 | 40.35 | 99.13 | 97.11 |
| AGO2–CTS | 7.01 | 1.85 | 11.70 | 45.43 | 99.16 | 98.23 |
3.6 Adsorption isotherms
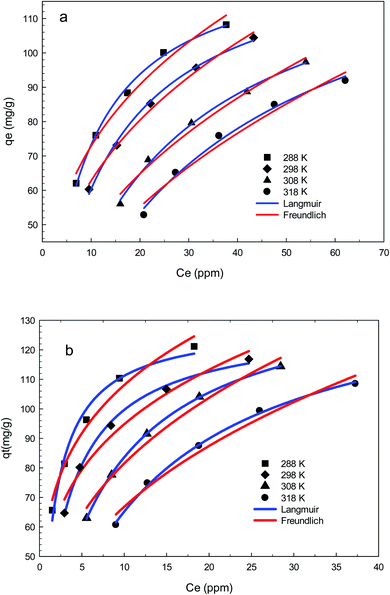
The mechanism and characteristics of adsorption of diclofenac onto GO2–CTS5 and AGO2–CTS5 hydrogels were further studied by obtaining adsorption isotherms at different temperatures. The isotherms of each hydrogel are represented in Fig. 14 for the temperatures ranging from 288 K (15 °C) to 318 K (45 °C). It is clearly noticeable that the adsorption capacity of AGO2–CTS5 and GO2–CTS5 adsorbents decreased with an increase in temperature, indicating that the adsorption of diclofenac onto these hydrogels is exothermic. The adsorption capacity of AGO2–CTS5 is higher than GO2–CTS5 at any equilibrium concentration which proves that amine-functionalization effectively boosts the adsorption.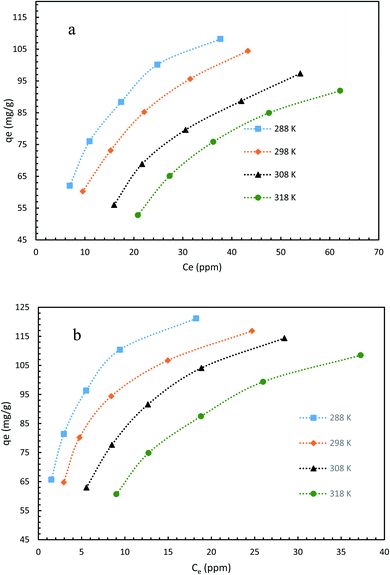 | ||
| Fig. 14 Adsorption isotherms of (a) GO2–CTS5 and (b) AGO2–CTS5 (adsorbent dosage = 1.5 g L−1, initial concentration = 100 ppm, pH = 5, contact time = 110 min). | ||
Moreover; two commonly used mathematical isotherm models were employed to describe the adsorbent–adsorbate interactions based on the experimental data. Langmuir model assumes that monolayer adsorption occurs on the energetically equal active sites of the adsorbent, resulting in a homogenous coverage of adsorbate.42 Freundlich model takes into account the heterogeneity of the active sites of the adsorbent and contrary to the Langmuir model assumes that the adsorption is multi-layered.43 The Langmuir model eqn (7) and Freundlich model eqn (8) can be expressed as follows50
 | (7) |
| qe = KFC1/2 | (8) |
The Freundlich and Langmuir isotherms and the parameters of isothermal adsorption of the two models, which are calculated through fitting the data, are provided in Fig. 15 and Table 4, respectively. It can be concluded from the correlation coefficient (R2) that the experimental data is in accordance with the Langmuir model better than the Freundlich model for both AGO2–CTS5 and GO2–CTS5 adsorbents. This proves that diclofenac adsorption onto GO–CTS hydrogels tends to be monolayer meaning that adsorbate is almost homogeneously distributed on the surface of the adsorbent. The small value of n suggests that the adsorption is to some extent heterogeneous and is not fully homogenous. Besides, the KL value and the maximum adsorption capacity (qmax) in the Langmuir model are X and Y (mg g−1), respectively. In general, an overall improvement in adsorption efficiency is observed for AGO2–CTS5 compared with GO2–CTS5 as the KF value of AGO2–CTS5 (43.58) is higher than that of GO2–CTS5 (24.40).
| Adsorbent | T (K) | Langmuir | Freundlich | ||||
|---|---|---|---|---|---|---|---|
| KL | qmax (mg g−1) | R2 | KF | 1/n | R2 | ||
| GO2–CTS | 288 | 0.128 | 130.54 | 99.68 | 35.15 | 0.316 | 98.01 |
| 298 | 0.084 | 132.11 | 99.65 | 27.55 | 0.357 | 99.26 | |
| 308 | 0.044 | 139.22 | 99.62 | 18.25 | 0.422 | 98.32 | |
| 318 | 0.029 | 146.31 | 99.06 | 13.32 | 0.474 | 96.92 | |
| AGO2–CTS | 288 | 0.616 | 129.26 | 98.22 | 62.76 | 0.236 | 97.79 |
| 298 | 0.336 | 129.42 | 99.68 | 52.54 | 0.256 | 97.29 | |
| 308 | 0.140 | 143.79 | 99.99 | 36.615 | 0.347 | 97.83 | |
| 318 | 0.082 | 144.63 | 99.81 | 27.421 | 0.387 | 97.70 | |
To compare the results of the present work with similar studies aimed at the removal of diclofenac from water, a list of non-hydrogel and hydrogel adsorbents is provided in Table 5.
| Entry | Adsorbents | Qmax (mg g−1) | Reference |
|---|---|---|---|
| Non-hydrogel adsorbents | |||
| 1 | CNT/HNO3 | 24 | 44 |
| 2 | CNT/Al2O3 | 27 | 45 |
| 3 | AC from agricultural by-products | 56 | 46 |
| 4 | Grape bagasse | 77 | 47 |
| 5 | AC from cocoa shell | 63 | 48 |
| 6 | AC from Terminalia catappa | 91 | 49 |
| 7 | AC from olive stones | 11 | 50 |
| 8 | rGO | 59.67 | 51 |
| 9 | Mercapto-functionalized hexagonal mesoporous silicate | 80 | 52 |
| 10 | Commercial AC | 76 | 53 |
| 11 | CTAB-ZIF-67 | 54.31 | 54 |
![[thin space (1/6-em)]](https://www.rsc.org/images/entities/char_2009.gif) |
|||
| Hydrogel adsorbents | |||
| 1 | GO–CTS | 1.96 | 55 |
| 2 | Tunable CTS (with GO) | 1.94 | 56 |
| 3 | Reduced graphene oxide | 96 | 57 |
| 4 | Poly(methyl acrylic acid)/montmorillonite | 63 | 58 |
| 5 | Present work | 146.31 | — |
3.7 Thermodynamics of adsorption
It was stated above that the adsorption of diclofenac on AGO2–CTS5 and GO2–CTS5 is more favorable at lower temperatures. The effect of temperature was studied quantitatively through calculating the major thermodynamic parameters namely, Gibbs free energy change (ΔG), enthalpy change (ΔH), and entropy change (ΔS). The following equations were used to obtain the thermodynamic parameters from the experimental data:59
ΔG = −RT![[thin space (1/6-em)]](https://www.rsc.org/images/entities/char_2009.gif) ln ln![[thin space (1/6-em)]](https://www.rsc.org/images/entities/char_2009.gif) K K
| (9) |
 | (10) |
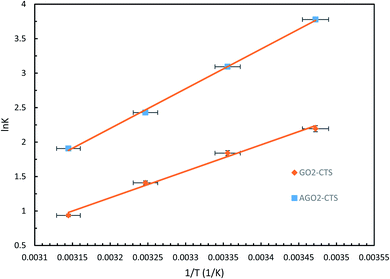 | ||
| Fig. 16 van't Hoff plots of GO2–CTS5 and AGO2–CTS5 hydrogels (adsorbent dosage = 1.5 g L−1, initial concentration = 100 ppm, pH = 5, contact time = 110 min). | ||
| Adsorbent | ΔH (kJ mol−1) | ΔS (J mol−1) | ΔG (kJ mol−1) | |||
|---|---|---|---|---|---|---|
| 288 K | 298 K | 308 K | 318 K | |||
| GO2–CTS | −31.924 | −92.252 | −5.370 | −4.448 | −3.526 | −2.604 |
| AGO2–CTS | −47.857 | −134.86 | −9.265 | −7.925 | −6.585 | −5.245 |
The results reveal that ΔG values are negative at all of the investigated temperatures indicating the spontaneity and feasibility of the adsorption process. Moreover, the ΔG value increased with an increase in temperature which means that the spontaneity of the process decreased at higher temperatures and thus, the adsorption is more favorable at lower temperatures. The value of ΔG also reveals that adsorption of diclofenac is more spontaneous on AGO2–CTS5 than GO2–CTS5 as the ΔG value of AGO2–CTS5 is lower at any temperatures, showing that functionalization affects the thermodynamics of adsorption as well. Besides, the negative value of ΔH demonstrates that the adsorption of diclofenac onto these hydrogels has an exothermic nature. Finally, the positive value of ΔS at all temperatures suggests that the adsorption process leads to decreased disorder and randomness at the adsorbate–adsorbent interface.
3.8 Effect of pH and a plausible adsorption mechanism
The solution pH is considered as the most significant parameter affecting the adsorption process because the variation in pH can regulate the surface charges of adsorbate and adsorbent which can lead to enhanced adsorption due to better interactions.60 Ionizable micro-pollutants can have efficient interactions with adsorbents through electrostatic repulsion and attraction based on their pKa value. Diclofenac is categorized as a weak acid as its pKa value is 4.15. Therefore; the adsorption of hydrophobic compounds such as diclofenac can be highly dependent on pH variations.61 Diclofenac has been shown to be unstable at pH < pKa in terms of solubility and reactivity. Therefore, at lower pH values than pKa, the adsorption efficiencies would not be accurate as the removal is not associated only with adsorption.62 Thus, the adsorption of diclofenac at pH < 5 has not been investigated in this study.In addition to electrostatic interactions, other plausible mechanisms such as electron donor–acceptor (EDA), π–π interactions, electron–π bonding interaction, hydrophilic interactions, and H-bonding between the hydrophilic moieties of the hydrogel adsorbent and the drug molecules are possible to occur.63
To have a better understanding of surface chemistry and the variation of removal efficiency as a function of pH, point of zero charge (pHpzc) of the hydrogel was determined.64 In general, pHpzc specifies whether the surface of an adsorbent has a negative or positive charge at a given pH, being negative if pH > pHpzc, positive if pH < pHpzc, and neutral if pH = pHpzc. Diclofenac, as an acidic pharmaceutical, experiences electrostatic repulsion if pH is higher than pHpzc of the hydrogel adsorbent (6.46) and thus low efficiencies are expected at basic conditions as a result of a progressively negatively charged hydrogel. The dependency of the removal efficiency of diclofenac on the solution pH is demonstrated in Fig. 17.
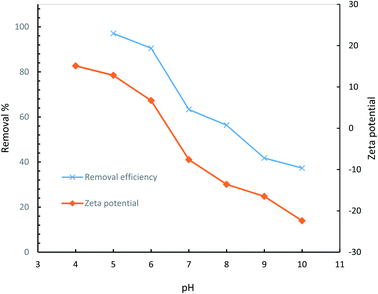 | ||
| Fig. 17 Effect of solution pH on removal efficiency of AGO2–CTS5 hydrogel adsorbent (adsorbent dosage = 1.5 g L−1, initial concentration = 100 ppm, contact time = 110 min, temperature = 298 K). | ||
The highest efficiency was attained at pH = 5 where the surface charge of the AGO2–CTS5 is negative. However, the predominant portion of the diclofenac molecule is non-ionized at this pH which indicates that electrostatic attraction is not the sole mechanism accounting for the high efficiency. Hydrophobic attractions between diclofenac and GO molecules, H-bonding, and π–π interactions are possible under such conditions. Diclofenac molecules are likely to produce three H-donor and two H-acceptor in the mentioned condition which can create H-bonding interactions.65 For instance, the interaction between carboxylic and hydroxyl groups of GO and secondary amine of diclofenac molecule is a plausible H-bonding pathway. Primary and secondary amine groups of AGO can also interact with the carboxylic group of diclofenac raising the adsorptive interactions in the case of AGO2–CTS5 compared to GO2–CTS5 which is the reason for adsorption efficiency escalation for the functionalized adsorbent. π–π EDA interaction between the two benzene rings of diclofenac molecule and graphitic rings of GO is also a major adsorption mechanism at the optimum pH point. Furthermore, CTS also contributes to the adsorption of diclofenac at pH = 4.5 through the following proposed mechanism. At pH = 5 the primary amine functional group of CTS5 is slightly protonated while the carboxylic group of diclofenac is almost neutral (pKa = 4.7) which can promote EDA interactions leading to H-bond formation.66
The removal efficiency experiences a sharp fall as pH increases up to 10 at which it reaches 37.32%. Deprotonation of diclofenac molecule at pH > pKa is the core reason for the low removal efficiency at basic conditions. As a result, electrostatic repulsion between the dissociated diclofenac and negatively charged functional groups of GO inhibits the adsorption process. Moreover, in general, polar functional groups like amine and carboxyl show electron-withdrawing properties at basic conditions which leads to the repulsion of aromatic rings of GO as π electron-acceptor.10 Consequently, due to the inhibition of π–π EDA interactions, the removal efficiency is considerably lower at basic conditions.
3.9 Recyclability
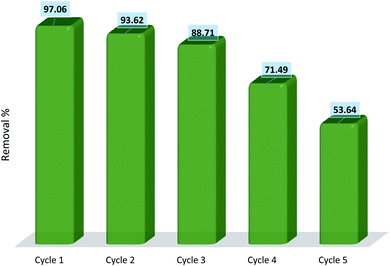
Regardless of how efficiently an adsorbent can remove pollutants from water, the reusability and regeneration of the adsorbents are of great essence in terms of the economic and industrial practicality of the adsorption process. The regeneration of hydrogel adsorbents was performed by placing the adsorbents into distilled water for 24 h with water replacement every 2 h. Finally, the hydrogels were separated, dried, and utilized for the next cycles of diclofenac removal. Recycling experiments were run for five consecutive cycles of adsorption–desorption and the results are represented in Fig. 18. The results show that the removal efficiency of the fourth cycle is 71.49% which is relatively low exhibiting a 25.57% drop compared to the capacity of the adsorbent in the first cycle. This reduction is due to the loss of active sites during the desorption process which directly affects the efficiency of adsorption. Moreover, the gel structure of the hydrogel was partially destroyed after the third cycle which can influence the removal efficiency. The results indicate that AGO2–CTS5 hydrogels are of remarkable potential for application in adsorptive removal of diclofenac with respect to both economic regards and removal effectiveness.4. Conclusions
In conclusion, hydrogel adsorbents of GO–CTS were synthesized via a facile mechanical mixing method and characterized at four GO to CTS mass ratios of 1![[thin space (1/6-em)]](https://www.rsc.org/images/entities/char_2009.gif) :
:![[thin space (1/6-em)]](https://www.rsc.org/images/entities/char_2009.gif) 5, 2
5, 2![[thin space (1/6-em)]](https://www.rsc.org/images/entities/char_2009.gif) :
:![[thin space (1/6-em)]](https://www.rsc.org/images/entities/char_2009.gif) 5; 3
5; 3![[thin space (1/6-em)]](https://www.rsc.org/images/entities/char_2009.gif) :
:![[thin space (1/6-em)]](https://www.rsc.org/images/entities/char_2009.gif) 5; 4
5; 4![[thin space (1/6-em)]](https://www.rsc.org/images/entities/char_2009.gif) :
:![[thin space (1/6-em)]](https://www.rsc.org/images/entities/char_2009.gif) 5. The results of characterization revealed that GO was successfully introduced into the hydrogel matrix, causing destruction of the crystalline structure of CTS and transformation of its phase to the amorphous phase. Various operational parameters including pH, initial concentration, adsorbent dosage, temperature were analyzed to determine which adsorbent yielded the highest efficiency in removal of diclofenac from water. GO2–CTS5 adsorbent exhibited the highest adsorption ability at any given condition. Furthermore, to facilitate the adsorption process and enhance the adsorbent–adsorbate interactions, AGO was synthesized, characterized, and used in AGO2–CTS5 hydrogel. It was shown that melamine was grafted between GO layers which led to an increase in GO interlayer spacing from 0.85 nm to 1.05 nm. Moreover, the existent of amine groups in AGO was confirmed by the emerged characteristic peaks in FTIR analysis.
5. The results of characterization revealed that GO was successfully introduced into the hydrogel matrix, causing destruction of the crystalline structure of CTS and transformation of its phase to the amorphous phase. Various operational parameters including pH, initial concentration, adsorbent dosage, temperature were analyzed to determine which adsorbent yielded the highest efficiency in removal of diclofenac from water. GO2–CTS5 adsorbent exhibited the highest adsorption ability at any given condition. Furthermore, to facilitate the adsorption process and enhance the adsorbent–adsorbate interactions, AGO was synthesized, characterized, and used in AGO2–CTS5 hydrogel. It was shown that melamine was grafted between GO layers which led to an increase in GO interlayer spacing from 0.85 nm to 1.05 nm. Moreover, the existent of amine groups in AGO was confirmed by the emerged characteristic peaks in FTIR analysis.
AGO2–CTS5 hydrogel exhibited improved adsorption behavior compared to GO2–CTS5 owing to the presence of amine functional groups. AGO2–CTS5 provided a removal efficiency of 97.06% which was 6.64% higher than that of GO2–CTS5. The pH and zeta potential study showed that the dominant adsorption mechanisms are hydrophobic attractions and EDA interactions. H-bonding was shown to have a significant contribution to the removal of diclofenac onto the studied adsorbent. To have a better perspective of the adsorption process, Langmuir and Freundlich isotherm models were employed to analyze the adsorption scheme. All the isotherms of GO2–CTS5 and AGO2–CTS accorded with the Langmuir model better than the Freundlich model, indicating that the adsorption is more likely to happen in monolayer form. The maximum adsorption capacity was calculated to be 132.11 and 129.26 mg g−1 for GO2–CTS5 and AGO2–CTS5, respectively. Furthermore, the thermodynamics of adsorption revealed that the adsorption was spontaneous at all the investigated temperatures, being more spontaneous for AGO2–CTS5 compared to GO2–CTS5. The negative value of ΔH suggested that the adsorption is exothermic and more favorable at lower temperatures. Finally, the adsorbents presented great regeneration potential, being highly recoverable for three consecutive cycles.
Conflicts of interest
There are no conflicts to declare.References
- I. Ali, O. M. L. Alharbi, Z. A. ALOthman, A. M. Al-Mohaimeed and A. Alwarthan, Modeling of fenuron pesticide adsorption on CNTs for mechanistic insight and removal in water, Environ. Res., 2019, 170, 389–397 CrossRef CAS PubMed.
- I. Ali, O. M. L. Alharbi, Z. A. ALOthman, A. Alwarthan and A. M. Al-Mohaimeed, Preparation of a carboxymethylcellulose-iron composite for uptake of atorvastatin in water, Int. J. Biol. Macromol., 2019, 132, 244–253 CrossRef CAS PubMed.
- Z. A. ALOthman, A. Y. Badjah and I. Ali, Facile synthesis and characterization of multi walled carbon nanotubes for fast and effective removal of 4-tert-octylphenol endocrine disruptor in water, J. Mol. Liq., 2019, 275, 41–48 CrossRef CAS.
- T. Kaeseberg, J. Zhang, S. Schubert, R. Oertel, H. Siedel and P. Krebs, Sewer sediment-bound antibiotics as a potential environmental risk: adsorption and desorption affinity of 14 antibiotics and one metabolite, Environ. Pollut., 2018, 239, 638–647 CrossRef CAS PubMed.
- T. Aus der Beek, et al., Pharmaceuticals in the environment-Global occurrences and perspectives, Environ. Toxicol. Chem., 2016, 35(4), 823–835 CrossRef CAS PubMed.
- S. Nachiappan and K. P. Gopinath, Treatment of pharmaceutical effluent using novel heterogeneous fly ash activated persulfate system, J. Environ. Chem. Eng., 2015, 3(3), 2229–2235 CrossRef CAS.
- A. Carucci, G. Cappai and M. Piredda, Biodegradability and toxicity of pharmaceuticals in biological wastewater treatment plants, J. Environ. Sci. Health, Part A: Toxic/Hazard. Subst. Environ. Eng., 2006, 41(9), 1831–1842 CrossRef CAS PubMed.
- F. J. Beltrán, P. Pocostales, P. Alvarez and A. Oropesa, Diclofenac removal from water with ozone and activated carbon, J. Hazard. Mater., 2009, 163(2–3), 768–776 CrossRef PubMed.
- B. N. Bhadra, P. W. Seo and S. H. Jhung, Adsorption of diclofenac sodium from water using oxidized activated carbon, Chem. Eng. J., 2016, 301, 27–34 CrossRef CAS.
- B. Y. Z. Hiew, et al., Adsorptive removal of diclofenac by graphene oxide: optimization, equilibrium, kinetic and thermodynamic studies, J. Taiwan Inst. Chem. Eng., 2019, 98, 150–162 CrossRef CAS.
- H. Zhao, et al., Adsorption behavior and mechanism of chloramphenicols, sulfonamides, and non-antibiotic pharmaceuticals on multi-walled carbon nanotubes, J. Hazard. Mater., 2016, 310, 235–245 CrossRef CAS PubMed.
- T. G. Kebede, S. Dube and M. M. Nindi, Biopolymer electrospun nanofibres for the adsorption of pharmaceuticals from water systems, J. Environ. Chem. Eng., 2019, 7(5), 103330 CrossRef CAS.
- E. R. Kenawy, et al., Cetyltrimethylammonium bromide intercalated and branched polyhydroxystyrene functionalized montmorillonite clay to sequester cationic dyes, J. Environ. Manage., 2018, 219, 285–293 CrossRef CAS PubMed.
- A. A. Alqadami, M. A. Khan, M. R. Siddiqui and Z. A. Alothman, Development of citric anhydride anchored mesoporous MOF through post synthesis modification to sequester potentially toxic lead (II) from water, Microporous Mesoporous Mater., 2018, 261, 198–206 CrossRef.
- Z. Yu, et al., Enhancing phosphate adsorption capacity of SDS-based magnetite by surface modification of citric acid, Appl. Surf. Sci., 2017, 403, 413–425 CrossRef CAS.
- E. Praveen, S. Murugan and K. Jayakumar, Investigations on the existence of piezoelectric property of a bio-polymer – chitosan and its application in vibration sensors, RSC Adv., 2017, 7, 35490–35495 RSC.
- Ã. Crini and P. Badot, Application of chitosan, a natural aminopolysaccharide, for dye removal from aqueous solutions by adsorption processes using batch studies: a review of recent literature, Prog. Polym. Sci., 2008, 33, 399–447 CrossRef.
- V. Patrulea, A. Negrulescu, M. M. Mincea, L. D. Pitulice, O. B. Spiridon and V. Ostafe, Optimization of the Removal of Copper(II) Ions from Aqueous Solution on Chitosan and Cross-Linked Chitosan Beads, BioResources, 2013, 8(1), 1147–1165 CrossRef.
- S. H. Chang, H. T. V. Lin, G. J. Wu and G. J. Tsai, pH Effects on solubility, zeta potential, and correlation between antibacterial activity and molecular weight of chitosan, Carbohydr. Polym., 2015, 134, 74–81 CrossRef CAS PubMed.
- W. Wu, et al., Highly efficient removal of Cu(II) from aqueous solution by using graphene oxide, Water, Air, Soil Pollut., 2013, 224, 1372 CrossRef.
- D. Konios, M. M. Stylianakis, E. Stratakis and E. Kymakis, Dispersion behaviour of graphene oxide and reduced graphene oxide, J. Colloid Interface Sci., 2014, 430, 108–112 CrossRef CAS PubMed.
- S. Yang, J. Hu, C. Chen, D. Shao and X. Wang, Mutual Effects of Pb (II) and Humic Acid Adsorption on Multiwalled Carbon Nanotubes/Polyacrylamide Composites from Aqueous Solutions, Environ. Sci. Technol., 2011, 45, 3621–3627 CrossRef CAS PubMed.
- Y. Chen, Y. Qi, Z. Tai, X. Yan, F. Zhu and Q. Xue, Preparation, mechanical properties and biocompatibility of graphene oxide/ultrahigh molecular weight polyethylene composites, Eur. Polym. J., 2012, 48, 1026–1033 CrossRef CAS.
- B. Y. Z. Hiew, et al., Review on synthesis of 3D graphene-based configurations and their adsorption performance for hazardous water pollutants, Process Saf. Environ. Prot., 2018, 116, 262–286 CrossRef CAS.
- C. Cheng, Z. Liu, X. Li, B. Su, T. Zhou and C. Zhao, Graphene oxide interpenetrated polymeric composite hydrogels as highly effective adsorbents for water treatment, RSC Adv., 2014, 4(80), 42346–42357 RSC.
- N. Zhang, H. Qiu, Y. Si, W. Wang and J. Gao, Fabrication of highly porous biodegradable monoliths strengthened by graphene oxide and their adsorption of metal ions, Carbon, 2011, 49(3), 827–837 CrossRef CAS.
- H. Zhao, et al., Preparation and adsorption capacity evaluation of graphene oxide-chitosan composite hydrogels, Sci. China Mater., 2015, 58(10), 811–818 CrossRef CAS.
- Y. Liu, B. Sajjadi, W. Y. Chen and R. Chatterjee, Ultrasound-assisted amine functionalized graphene oxide for enhanced CO2 adsorption, Fuel, 2019, 247, 10–18 CrossRef CAS.
- S. Liu, S. Li, H. Zhang, L. Wu, L. Sun and J. Ma, Removal of uranium(VI) from aqueous solution using graphene oxide and its amine-functionalized composite, J. Radioanal. Nucl. Chem., 2016, 309(2), 607–614 CAS.
- A. M. Bakry, F. S. Awad, J. A. Bobb, A. A. Ibrahim and M. S. El-Shall, Melamine-based functionalized graphene oxide and zirconium phosphate for high performance removal of mercury and lead ions from water, RSC Adv., 2020, 10(62), 37883–37897 RSC.
- E. M. Ahmed, Hydrogel: preparation, characterization, and applications: a review, J. Adv. Res., 2015, 6(2), 105–121 CrossRef CAS PubMed.
- H. Bao, et al., Chitosan-functionalized graphene oxide as a nanocarrier for drug and gene delivery, Small, 2011, 7(11), 1569–1578 CrossRef CAS PubMed.
- Y. Liu, S. Huang, X. Zhao and Y. Zhang, Fabrication of three-dimensional porous β-cyclodextrin/chitosan functionalized graphene oxide hydrogel for methylene blue removal from aqueous solution, Colloids Surf., A, 2018, 539, 1–10 CrossRef CAS.
- U. J. Kim, Y. R. Lee, T. H. Kang, J. W. Choi, S. Kimura and M. Wada, Protein adsorption of dialdehyde cellulose-crosslinked chitosan with high amino group contents, Elsevier Ltd, 2017, vol. 163 Search PubMed.
- T. T. N. Le, et al., Preparation of magnetic graphene oxide/chitosan composite beads for effective removal of heavy metals and dyes from aqueous solutions, Chem. Eng. Commun., 2019, 206(10), 1337–1352 CrossRef CAS.
- T. A. Pham, B. C. Choi, K. T. Lim and Y. T. Jeong, A simple approach for immobilization of gold nanoparticles on graphene oxide sheets by covalent bonding, Appl. Surf. Sci., 2011, 257(8), 3350–3357 CrossRef CAS.
- T. Zhou, et al., A simple and efficient method to prepare graphene by reduction of graphite oxide with sodium hydrosulfite, Nanotechnology, 2011, 22(4), 045704 CrossRef PubMed.
- A. P. Cohn, K. Share, R. Carter, L. Oakes and C. L. Pint, Ultrafast Solvent-Assisted Sodium Ion Intercalation into Highly Crystalline Few-Layered Graphene, Nano Lett., 2016, 16(1), 543–548 CrossRef CAS PubMed.
- L. Cui, et al., EDTA functionalized magnetic graphene oxide for removal of Pb(II), Hg(II) and Cu(II) in water treatment: adsorption mechanism and separation property, Chem. Eng. J., 2015, 281, 1–10 CrossRef CAS.
- P. Tan, et al., Adsorption of Cu2+, Cd2+ and Ni2+ from aqueous single metal solutions on graphene oxide membranes, J. Hazard. Mater., 2015, 297, 251–260 CrossRef CAS PubMed.
- M. O. Ansari, et al., Anion selective pTSA doped polyaniline@graphene oxide-multiwalled carbon nanotube composite for Cr(VI) and Congo red adsorption, J. Colloid Interface Sci., 2017, 496(VI), 407–415 CrossRef CAS PubMed.
- D. Zhao, X. Gao, C. Wu, R. Xie, S. Feng and C. Chen, Facile preparation of amino functionalized graphene oxide decorated with Fe3O4 nanoparticles for the adsorption of Cr(VI), Appl. Surf. Sci., 2016, 384, 1–9 CrossRef CAS.
- Z. A. Alothman, et al., Low cost biosorbents from fungi for heavy metals removal from wastewater, Sep. Sci. Technol., 2020, 55, 1766–1775 CrossRef CAS.
- V. J. I. S. G. Poulopoulos, Adsorption, Ion Exchange and Catalysis: Design of Operations and Environmental Application, Elsevier Science, 2006 Search PubMed.
- H. Wei, et al., Regenerable granular carbon nanotubes/alumina hybrid adsorbents for diclofenac sodium and carbamazepine removal from aqueous solution, Water Res., 2013, 47(12), 4139–4147 CrossRef CAS PubMed.
- B. N. Bhadra, P. W. Seo and S. H. Jhung, Adsorption of diclofenac sodium from water using oxidized activated carbon, Chem. Eng. J., 2016, 301, 27–34 CrossRef CAS.
- M. Antunes, V. I. Esteves, R. Guégan, J. S. Crespo, A. N. Fernandes and M. Giovanela, Removal of diclofenac sodium from aqueous solution by Isabel grape bagasse, Chem. Eng. J., 2012, 192, 114–121 CrossRef CAS.
- C. Saucier, et al., Microwave-assisted activated carbon from cocoa shell as adsorbent for removal of sodium diclofenac and nimesulide from aqueous effluents, J. Hazard. Mater., 2015, 289, 18–27 CrossRef CAS PubMed.
- P. Sathishkumar, et al., Modified phyto-waste Terminalia catappa fruit shells: a reusable adsorbent for the removal of micropollutant diclofenac, RSC Adv., 2015, 5(39), 30950–30962 RSC.
- S. Larous and A. H. Meniai, Adsorption of Diclofenac from aqueous solution using activated carbon prepared from olive stones, Int. J. Hydrogen Energy, 2016, 41(24), 10380–10390 CrossRef CAS.
- I. M. Jauris, et al., Adsorption of sodium diclofenac on graphene: a combined experimental and theoretical study, Phys. Chem. Chem. Phys., 2016, 18(3), 1526–1536 RSC.
- D. Krajišnik, et al., Properties of diclofenac sodium sorption onto natural zeolite modified with cetylpyridinium chloride, Colloids Surf., B, 2011, 83(1), 165–172 CrossRef PubMed.
- Z. Hasan, N. A. Khan and S. H. Jhung, Adsorptive removal of diclofenac sodium from water with Zr-based metal–organic frameworks, Chem. Eng. J., 2016, 284, 1406–1413 CrossRef CAS.
- S. W. Nam, D. J. Choi, S. K. Kim, N. Her and K. D. Zoh, Adsorption characteristics of selected hydrophilic and hydrophobic micropollutants in water using activated carbon, J. Hazard. Mater., 2014, 270, 144–152 CrossRef CAS PubMed.
- Z. Feng, A. Simeone, K. Odelius and M. Hakkarainen, Biobased Nanographene Oxide Creates Stronger Chitosan Hydrogels with Improved Adsorption Capacity for Trace Pharmaceuticals, ACS Sustainable Chem. Eng., 2017, 5(12), 11525–11535 CrossRef CAS.
- Z. Feng, K. Odelius and M. Hakkarainen, Tunable chitosan hydrogels for adsorption: property control by biobased modifiers, Carbohydr. Polym., 2018, 196, 135–145 CrossRef CAS PubMed.
- N. Umbreen, S. Sohni, I. Ahmad, N. U. Khattak and K. Gul, Self-assembled three-dimensional reduced graphene oxide-based hydrogel for highly efficient and facile removal of pharmaceutical compounds from aqueous solution, J. Colloid Interface Sci., 2018, 527, 356–367 CrossRef CAS PubMed.
- S. A. Khan, M. F. Siddiqui and T. A. Khan, Synthesis of Poly(methacrylic acid)/Montmorillonite Hydrogel Nanocomposite for Efficient Adsorption of Amoxicillin and Diclofenac from Aqueous Environment: Kinetic, Isotherm, Reusability, and Thermodynamic Investigations, ACS Omega, 2020, 5, 2843–2855 CrossRef CAS PubMed.
- K. Gupta and O. P. Khatri, Reduced graphene oxide as an effective adsorbent for removal of malachite green dye: plausible adsorption pathways, J. Colloid Interface Sci., 2017, 501, 11–21 CrossRef CAS PubMed.
- M. Huerta-Fontela, M. T. Galceran and F. Ventura, Occurrence and removal of pharmaceuticals and hormones through drinking water treatment, Water Res., 2011, 45(3), 1432–1442 CrossRef CAS PubMed.
- E. Brillas, S. Garcia-Segura, M. Skoumal and C. Arias, Electrochemical incineration of diclofenac in neutral aqueous medium by anodic oxidation using Pt and boron-doped diamond anodes, Chemosphere, 2010, 79(6), 605–612 CrossRef CAS PubMed.
- O. Şanli, N. Ay and N. Işiklan, Release characteristics of diclofenac sodium from poly(vinyl alcohol)/sodium alginate and poly(vinyl alcohol)-grafted-poly(acrylamide)/sodium alginate blend beads, Eur. J. Pharm. Biopharm., 2007, 65(2), 204–214 CrossRef PubMed.
- J. Ma, et al., Comparative Study of Graphene Hydrogels and Aerogels Reveals the Important Role of Buried Water in Pollutant Adsorption, Environ. Sci. Technol., 2017, 51(21), 12283–12292 CrossRef CAS PubMed.
- M. A. Khan, S. M. Wabaidur, M. R. Siddiqui, A. A. Alqadami and A. H. Khan, Silico-manganese fumes waste encapsulated cryogenic alginate beads for aqueous environment de-colorization, J. Cleaner Prod., 2019, 118867 Search PubMed.
- T. Van Tran, D. T. C. Nguyen, H. T. N. Le, D. V. N. Vo, S. Nanda and T. D. Nguyen, Optimization, equilibrium, adsorption behavior and role of surface functional groups on graphene oxide-based nanocomposite towards diclofenac drug, J. Environ. Sci., 2020, 93, 137–150 CrossRef PubMed.
- W. Phasuphan, N. Praphairaksit and A. Imyim, Removal of ibuprofen, diclofenac, and naproxen from water using chitosan-modified waste tire crumb rubber, J. Mol. Liq., 2019, 294, 111554 CrossRef CAS.
| This journal is © The Royal Society of Chemistry 2021 |

