DOI:
10.1039/D1RA06056B
(Paper)
RSC Adv., 2021,
11, 37268-37275
Investigation on the effects of water loss on the solar spectrum reflectance and transmittance of Osmanthus fragrans leaves based on optical experiment and PROSPECT model
Received
10th August 2021
, Accepted 11th November 2021
First published on 18th November 2021
Abstract
Water is the main determinant of the leaf spectral characteristics in the shortwave infrared region, whereas only changing the water content in the PROSPECT model cannot accurately describe the solar spectrum reflectance and transmittance of the dehydrated leaf. To elucidate the effects of water loss, the solar spectrum reflectances and transmittances of the Osmanthus fragrans leaves in the fresh state, natural air-dry state and oven-dry state were measured, and the leaf parameters were predicted by the PROSPECT model inversion. The results revealed that the first effect was to increase the brown pigment content, which led to an increase in leaf absorption and change of the leaf absorption characteristics, and correspondingly, in the visible region, both the reflected and transmitted radiations were decreased and the reflection peak shifted towards a long wavelength. The other two effects were to increase the leaf structure index and refractive index, which resulted in an enhancement of the reflected radiation and an attenuation of the transmitted radiation over the range from 400 to 2500 nm. These findings suggest that if people consider the changes of leaf pigment content, structure and refractive index when water is lost from an actual leaf, it will be expected to improve the monitoring accuracy of the leaf water content based on leaf spectral remote sensing technology.
1 Introduction
The solar spectrum reflectance and transmittance characteristics of leaves are related to the absorption of pigments, water and dry matter, and the internal structure of the leaves.1–3 Fig. 1 shows the reflection and transmission spectra of a leaf.4 It can be seen that the absorption of the leaf is very strong both in the visible light region and the region of 1300–2500 nm, but is almost zero in the region of 780–1300 nm. A small reflection peak called the “green peak” appears around 550 nm, which is attributed to the characteristic absorptions of chlorophyll and accessory pigments.5,6 In the region of 780–1300 nm, both the reflectance and transmittance are approximately 50% due to the scattering of small particles or multiple reflections of porous structure within the leaf.7 Water is the main determinant in the shortwave infrared region, and its characteristic absorption leads to two weak and two significant water absorbing bands appearing at 970, 1250, 1460 and 1940 nm, respectively.8,9
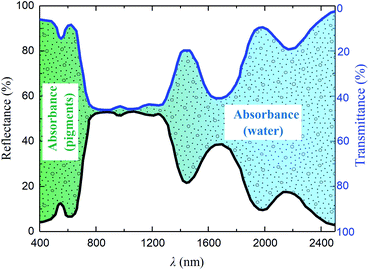 |
| | Fig. 1 Reflection and transmission spectra of a leaf.4 | |
Many physical models have been proposed to simulate the spectral reflectance and spectral transmittance of the leaf, such as “plate model”, “stochastic model”, “N-flux model” and “radiation transfer model”.10–13 Among these models, the “plate model” needs the fewest parameters and can be inverted to obtain the chemical constituent information of leaves. Jacquemoud et al.14 developed the “plate model” and published the “PROSPECT model”, which has been developed in several versions.15–17 The version of PROSPECT-5 model containing five chemical composition variables including concentrations of chlorophyll a and b, carotenoids, brown pigment, dry matter and leaf water has been successful and widespread used,15 and the latest version of PROSPECT-D model contains one more chemical composition, i.e., anthocyanin.17 Based on the PROSPECT model, the reflectances of the leaves containing different water contents could be predicted and the results indicated that the reflectance of the leaf tended to increase only in the wavelength region of 1300 to 2500 nm with the decreased water content.18 Whereas, when water is lost from an actual leaf, in the reflectance spectrum of the dry leaf, great differences also could be found in the wavelength range of 400 to 1300 nm compared with that of the fresh leaf.19,20 Peñuelas et al. found that the reflectances of the peanut and barley leaves increased over the wavelength range of 400 to 2400 nm and two water absorption bands at 1460 and 1940 nm in the reflectance spectrum tended to disappear with the decrease of water content.20 Peñuelas firstproposed the concept of water index described as the ratio of the leaf reflectance at 900 nm to that at 970 nm.20 Many scholars have done a lot of researches on the relationship between the water index and the relative leaf water content and established the empirical relationship between them according to the experimental data.21,22 However, the empirical algorithm cannot estimate the leaf water content quite accurately due to the changed leaf reflectance with leaf water content over the whole wavelength range from 400 to 2500 nm. To clarify the variation law of the leaf reflectance with water content, Aldakheel et al. studied the spinach leaf spectral response resulting from changes in water content based on the reflectance measurements and evaluated the use of the PROSPECT model for predicting the spectral reflectance of the leaf.23 The result showed that the difference between the measured reflectance and modeled one increased with the increase of leaf water loss and it was hypothesized that this may be because of a change in leaf structure that was unaccounted for by the model. Carter measured the reflectances of leaves in six species and inferred that leaf water loss could not only change the water content, but also affect the leaf pigment absorption and leaf structure, and then affect the reflectances of the leaves.24 Whereas, the effects of water loss on both the leaf pigment and the leaf structure have not been quantitatively described in the reported investigations. In addition, in the field of remote sensing, the transmittance of the leaf is also very important.25 Therefore, to quite accurately monitor the water content during leaf growth, further researches on the effects of leaf water loss on the leaf components and structure are necessary.
The purpose of this study was to determine the effects of leaf water loss on spectral reflectance and spectral transmittance in an Osmanthus fragrans leaf which is one of the most common evergreen tree species in southern China belonged to family Oleaceae. The objectives were to: (1) identify the spectral regions in which leaf reflectance and leaf transmittance were affected by leaf water loss; (2) based on the PROSPECT model, reveal the changing trends of the leaf parameters with the decrease of leaf water content and clarify the reason for the changing trends of leaf spectral reflectance and leaf spectral transmittance with the decreased leaf water content.
2 Model and experiment
2.1 Method of parameter inversion by PROSPECT model
PROSPECT is a general transfer model to simulate the leaf directional–hemispherical reflectance and transmittance from 400 to 2500 nm. The version of PROSPECT model used in this work is a function of leaf internal structure index, N, and five chemical composition variables including chlorophyll a and b concentration, Ĉab, carotenoids concentration, Ĉcar, brown pigment concentration, Ĉb, dry matter concentration, Ĉm, and leaf water concentration, Ĉw.15 The PROSPECT model is inverted on the measured reflectances and transmittances of the leaf samples using an iterative method for optimization. It consists of finding the best combination of leaf chemical composition and structure index that minimizes the merit function:| |
 | (1) |
where nλ is the number of spectral bands of measurement, m is the number of leaf chemical constituents, Ĉi is the mass content per unit leaf area, Rmes,λ and Tmes,λ are the measured spectral reflectance and measured spectral transmittance of the leaf sample, Rmod,λ and Tmod,λ are the fitted spectral reflectance and fitted spectral transmittance of the leaf sample, respectively. Based on the measured reflectances and transmittances, and the known absorption coefficients of the above five chemical compositions and leaf refractive index, the above six parameters including Ĉab, Ĉcar, Ĉb, Ĉm, Ĉw and N can be derived from the PROSPECT model. The absorption coefficients of the above five chemical compositions, Kab, Kcar, Kb, Km, Kw, can be derived from the literature as shown in Fig. 2(a).15,26 It is noteworthy that the leaf refractive index, n, is not static but should be dynamically determined with the respect of leaf mass compositions and can be determined by the following formula:27where ni is the refractive index of component absorber i. The leaf refractive index mainly depends on the leaf dry matter and leaf water because the mass contents of pigments are much smaller than those of the leaf dry matter and leaf water. The refractive indexes of leaf dry matter and water can be derived from the literature as shown in Fig. 2(b).27,28
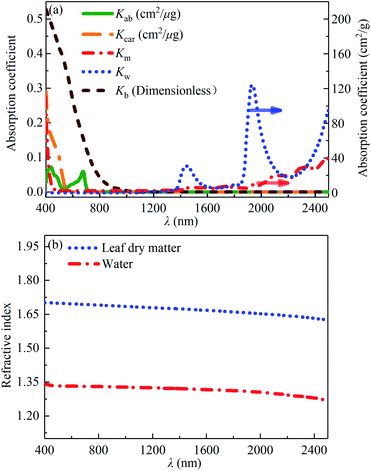 |
| | Fig. 2 Input parameters of the PROSPECT model: (a) absorption coefficients of the chlorophyll a and b, carotenoids, brown pigment, dry matter and water;15,26 (b) refractive indexes of water28 and leaf dry matter.27 | |
2.2 Characterization
Five mature Osmanthus fragrans leaves named as 1#, 2#, 3#, 4# and 5# were collected on the campus of the University of Science and Technology of China during the early morning to ensure an initially high-water content. To minimize water loss, the leaves were placed immediately in a sealable bag and taken back to the laboratory. Then a certain area with 1.5 cm × 3.0 cm in size of leaf sample was cut from a single fresh leaf as a test sample as shown in Fig. 3. The fresh leaf sample was named as S1 and performed for reflectance and transmittance measurements. After that, the fresh leaf sample was immediately placed in a culture dish at room temperature for a day to remove part of leaf water and obtain the natural air-dry leaf named as S2. The reflectance and transmittance measurements of the natural air-dry leaf were also performed. Subsequently, the natural air-dry leaf was placed in an electric heating oven at 80 °C for 48 hours to remove all of the leaf water and obtained the oven-dry leaf named as S3. The reflectance and transmittance measurements of the oven-dry leaf were performed again.
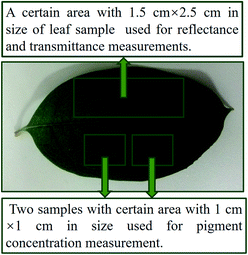 |
| | Fig. 3 Photo of the leaf samples. | |
The directional–hemispherical transmittance and directional–hemispherical reflectance measurements were performed with an integrating sphere with a diameter of 60 mm coated with BaSO4 attached to a Shimadzu DUV-3700 spectrophotometer. A reference plate with a diameter of 2.8 cm was made of BaSO4 powder purchased from Nacalai Tesque, Inc. As shown in Fig. 4, there are four ports with 2.2 cm × 1.1 cm in size of the integrating sphere, i.e., 0° and 8° light entrance ports and the corresponding light exit ports. As shown in Fig. 4(a), the incident angle was set to 0° to determine the normal incidence-hemispherical transmittance. A baseline calibration was first conducted, i.e., the air was used as a reference. After that, the sample was placed at an entrance of the measurement light with an incidence angle of 0°. The transmittance of the sample, Tmes, could be calculated by
where
Tr,mes is the relative transmittance of the sample,
Tair is the transmittance of air and its value can be regarded as 1. We also wish to be able to obtain the normal incidence-hemispherical reflectance, while, the collimated reflected radiation flux escapes from the light entrance when an incident at 0° for measuring reflectance. Consequently, the incident angle was deflected to 8° in our work to obtain the total reflectance which is composed of the diffuse reflectance and collimated reflectance, as shown in
Fig. 4(b), a baseline calibration also was first conducted. After that, the sample was placed at an exit corresponding to light with an incident angle of 8°. The reflectance of the sample,
Rmes, can be calculated by:
| | |
Rmes = Rr,mes × RBaSO4
| (4) |
where
Rr,mes is the relative reflectance of the sample,
RBaSO4 is the reflectance of the BaSO
4 reference plate which has been corrected by a standard white plate made of polytetrafluoroethylene named as STD-WS and the corrected result has been shown in our previous work.
29 According to the calibration results, the uncertainties of the transmittance and reflectance of the spectrophotometer are 0.4% and 1%, respectively.
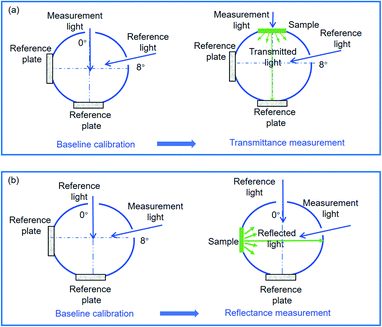 |
| | Fig. 4 Measurements of (a) directional–hemispherical transmittance and (b) directional–hemispherical reflectance. | |
The contents of water, dry matter, chlorophyll a, chlorophyll b and carotenoids in the leaf sample could be measured, while the content of leaf brown pigment and the leaf structure index only could be obtained by the PROSPECT model inversion. To determine the contents of water and dry matter, the mass of the above samples, W, was measured. The content of water per unit leaf area, Cw, and the content of dry matter per unit leaf area, Cm, can be determined by
| | |
Cw (g cm−2) = (W − Wd)/S
| (5) |
and
respectively, where
Wd is the mass of the oven-dry leaf sample,
S is the area of the leaf sample. To measure the contents per unit leaf area of chlorophyll a, chlorophyll b and carotenoids, two samples with a certain area with 1 cm × 1 cm in size were also cut from the same single fresh mature
Osmanthus fragrans leaf as shown in
Fig. 3. One of the samples is named as S
1 representing the fresh leaf and immediately placed in a mortar. Then small amounts of quartz sand and calcium carbonate, and 2–3 mL of 95% (v/v) ethanol aqueous solution were added into the mortar to grind the leaf sample. The quartz sand and the calcium carbonate were used for destroying the cell structure and neutralizing the acidic substances in the cell solution to prevent the destruction of pigments, respectively. Ground until the leaf tissue was whitish, then transferred the grinding solution and the leaf tissue to a volumetric flask and diluted with 95% (v/v) ethanol solution. Finally, the supernatant solution was extracted after the grinding solution was placed at room temperature for 24 hours and put into a cuvette for absorbance measurement by the spectrophotometer DUV-3700. The above experiment was repeated for the other leaf sample which was placed in an electric heating oven at 80 °C for 48 hours and named as S
3.
According to Lambert–Beer's law, the absorption of light by a solution is proportional to the depth of the solution layer and the concentration of the solution:30
| | |
log(I0/It) = kslc = A
| (7) |
where
I0 and
It are the incident radiation and transmitted radiation,
ks is the absorption coefficient,
l,
c and
A are the depth, concentration and absorbance of the supernatant solution, respectively. The concentrations of chlorophyll a,
ca, chlorophyll b,
cb, and carotenoids,
ccar, in the supernatant solution can be determined
via ref.
31| | |
ca (μg mL−1) = 13.36A664.2 − 5.19A648.6
| (8) |
| | |
cb (μg mL−1) = 27.43A648.6 − 8.12A664.2
| (9) |
| | |
ccar (μg mL−1) = (1000A470 − 2.13ca − 97.64cb)/209
| (10) |
respectively, where
A470,
A648.6 and
A664.2 are the absorbances of the supernatant solution at 470, 648.6 and 664.2 nm, respectively. Finally, the contents per unit leaf area of chlorophyll a, chlorophyll b and carotenoids can be calculated as
| | |
Ci (μg cm−2) = ci × V/S
| (11) |
where
Ci is the content per unit leaf area of component absorber
i,
ci is the concentration of component absorber
i in supernatant solution,
V is the volume of the diluted pigment solution,
S is the area of the leaf.
3 Results and discussion
3.1 Effects of leaf water loss on reflectance and transmittance
The reflection and transmission spectra of the leaf samples with Cm equal to 0.0147 g cm−2 and with Cw equal to 0.0127 g cm−2 (1#-S1), 0.0014 g cm−2 (1#-S2) and 0 g cm−2 (1#-S3) are shown in Fig. 5. The reflectance of the leaf increases over the wavelength range of 400 to 2500 nm with the decreased water content as shown in Fig. 5(a). From Fig. 5(b), it is found that as the degree of leaf water loss increased, the transmittance of the leaf maintains at a low level of approximately zero in the visible light region, while the decreasing and increasing trends can be observed in the wavelength range of 780 to 1300 nm and near the water absorption bands, respectively.
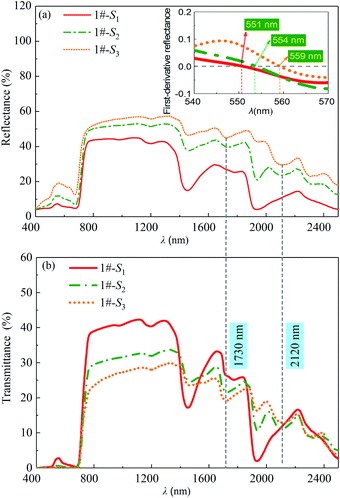 |
| | Fig. 5 (a) Reflectances and (b) transmittances of the leaf samples (Cm = 0.0147 g cm−2, Cw = 0.0127 g cm−2 (1#-S1), 0.0014 g cm−2 (1#-S2) and 0 g cm−2 (1#-S3), respectively). | |
In the visible light region, it can be found that all the leaf samples exhibit a small reflection peak. To determine the wavelengths of the peak, the first-order derivatives of the reflection spectra were analyzed and shown in the inset of Fig. 5(a). The positions of the peaks in the reflection spectra of 1#-S2 and 1#-S3 shift towards the longer wavelengths compared with that of 1#-S1 by about 3 and 8 nm, respectively. In the visible light region, leaf pigment components dominate leaf absorption and therefore the above phenomena theoretically should be attributed to the change in the proportion of pigment components. The measured contents of chlorophyll a, chlorophyll b and carotenoids of 1#-S3 are slightly lower than those of 1#-S1, whereas, the value of Cab/Ccar of 1#-S3 is approximately identical to that of 1#-S1 as shown in Fig. 6. As a consequence, it can be deduced that the brown pigment which has been described as polyphenols appears during the leaf drying process32,33 and its content may change significantly.
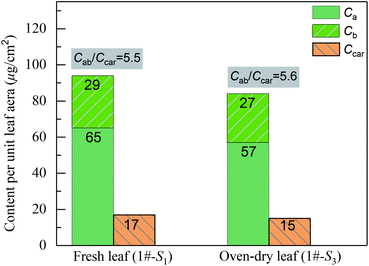 |
| | Fig. 6 Measured contents of chlorophyll a, chlorophyll b and carotenoids per unit leaf area of the fresh leaf (1#-S1) and oven-dry leaf (1#-S3). | |
In the wavelength range of 950 to 1300 nm, the water absorption features at 970 and 1250 nm are disappeared and further weakened due to dehydration, respectively. The reflectances (or transmittances) of all of the leaf samples theoretically should be nearly identical because the leaf generally does not contain other substances that absorb strongly in the corresponding wavelength range. However, the above theoretical inference is inconsistent with the phenomenon described in Fig. 5. It can be inferred that leaf water loss may also change the internal structure of the leaf.
In the wavelength range of 1300 to 2500 nm, the water absorption characteristic bands at 1460 and 1940 nm are significantly weakened with the decreased water content. Moreover, two absorption bands appear at 1730 and 2120 nm in the reflection and transmission spectra of 1#-S2 and 1#-S3, which correspond to the first-order frequency doubling absorption of –CH2 and the combined frequency absorption of ![[double bond, length as m-dash]](https://www.rsc.org/images/entities/char_e001.gif) CH2 in dry matter, respectively. These two absorption bands seriously affect the characteristics of the reflection and transmission spectra of the leaf, whereas, they can be weakened or even masked by the strong absorption of a large amount of leaf water in the wavelength range of 1300 to 2500 nm.
CH2 in dry matter, respectively. These two absorption bands seriously affect the characteristics of the reflection and transmission spectra of the leaf, whereas, they can be weakened or even masked by the strong absorption of a large amount of leaf water in the wavelength range of 1300 to 2500 nm.
3.2 Effects of leaf water loss on leaf parameters
The fitted and the measured reflectances and transmittances of the leaf samples are shown in Fig. 7. In addition, the correlation coefficient of the fitted reflectance and the measured reflectance, rm,R, and that of the fitted transmittance and the measured transmittance, rm,T, were calculated and also shown in Fig. 7. It can be seen that the values of rm,R and rm,T are above 0.996 and 0.987, respectively, indicating that the fitted results are close to the measured ones, especially the reflectance.
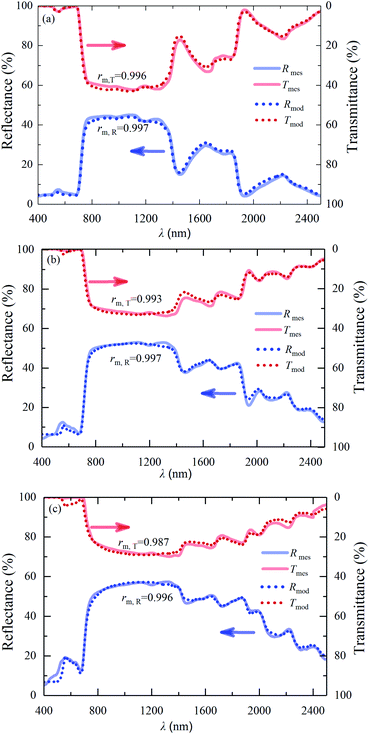 |
| | Fig. 7 Measured and fitted reflectances and transmittances of the leaf samples: (a) 1#-S1, (b) 1#-S2, (c) 1#-S3. | |
The model predicted contents of the brown pigment of the leaf samples are shown in Fig. 8(a). It can be seen that the content of the brown pigment increases with the decreased water content during the process of leaf water loss. The significantly increased content of the brown pigment is accompanied by the slight degradations of chlorophylls and carotenoids, leading to the increased absorption of the leaf in the visible light region. Furthermore, the absorption coefficient of the brown pigment noticeably decreases with the increase of wavelength in the range of 400 to 800 nm as shown in Fig. 2(a). Consequently, the significantly increased content of the brown pigment causes the leaf reflection peaks corresponding to the leaf absorption valleys in the visible light region of 1#-S2 and 1#-S3 to shift to a longer wavelength compared with that of 1#-S1.
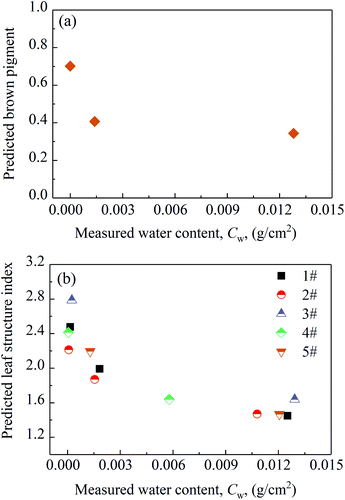 |
| | Fig. 8 Contents of (a) brown pigment of the leaf samples (1#-S1, 1#-S2, 1#-S3) and (b) leaf structure indexes of the leaf samples (1# to 5#) with different water contents. | |
The predicted leaf structure indexes of the samples (1#-S1, 1#-S2 and 1#-S3) are shown in Fig. 8(b). It is noteworthy that the structure indexes of the other four leaves (2#, 3#, 4# and 5#) containing different water contents are also shown in Fig. 8(b), and it can be found that all of the values of the leaf structure indexes of the leaf samples are between the minimum and maximum values of leaf structure index determined based on the values collected in the LOPEX database, i.e., in the range of the value of 1 to 3.34 Furthermore, the predicted leaf structure index of the leaf sample increases with the decreased water content during the process of leaf water loss, which verifies our inference in Sec. 3.1. The number of interfaces may increase as adjacent cells split apart and as living cell contents shrank away from interior cell walls and thus account for the increase in leaf structure index.35 As the value of the leaf structure index increasing from 1 to 3, the reflectance and transmittance of the leaf with the parameters consistent with those of the fresh leaf sample (1#-S1) were calculated via the PROSPECT model and the results are shown in Fig. 9. It can be seen that the predicted reflectance and transmittance of the leaf increases and decreases over the wavelength range of 400 to 2500 nm, respectively. In the case of unchanged leaf chemical composition content and refractive index, the increased leaf structure index causes more light to be backscattered to the incident plane during the propagation along the incident direction, leading to the enhancement of reflection radiation and the attenuation of transmission radiation.
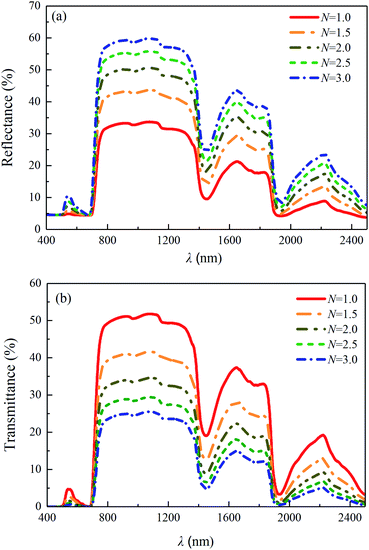 |
| | Fig. 9 (a) Predicted reflectances and (b) transmittances of the leaves with different leaf structure indexes: N = 1.0, 1.5, 2.0, 2.5, 3.0, via the PROSPECT model with the other input parameters of the fresh leaf sample (1#-S1). | |
It should be noted that the refractive index of the leaf during the process of leaf water loss is no longer a static parameter, but increases with the decrease of leaf water content. Based on the contents of water and dry matter per unit leaf area and the known refractive indexes of the water and dry matter, the refractive indexes of the fresh and oven-dry leaf samples were calculated via eqn (2) and the results are shown in Fig. 10(a). It can be seen that the refractive index of the oven-dry leaf is higher than that of the fresh one. To determine the effects of the leaf refractive index on the leaf spectral reflectance and leaf spectral transmittance, the reflectance and transmittance of the fresh leaf with the higher refractive index were calculated via the PROSPECT model by using the calculated refractive index of the oven-dry leaf sample as the input parameter, and the results are compared with those of the fresh leaf as shown in Fig. 10(b) and (c). We can see that in the reflection and transmission spectra of the leaf with a high refractive index, the reflectance increases slightly, while the transmittance decreases significantly, respectively, compared with those of the leaf with a low refractive index. Therefore, it can be concluded that over the wavelength range of 400 to 2500 nm, the reflectance increases with the increases of leaf structure index and leaf refractive index. However, both the increased leaf structure index and the increased refractive index lead to a significant decrease in transmittance.
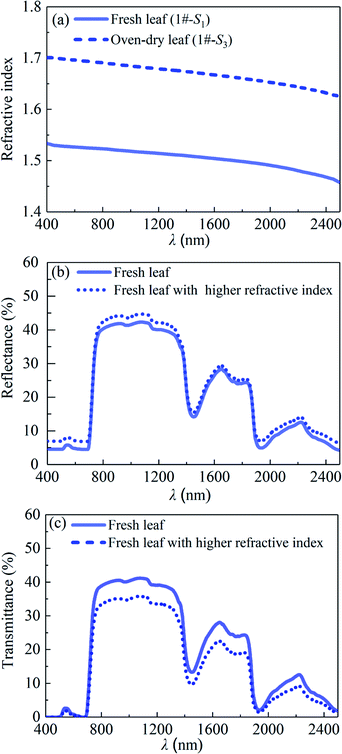 |
| | Fig. 10 (a) Refractive indexes of the fresh leaf (1#-S1) and the oven-dry leaf (1#-S3), (b) predicted reflectances and (c) transmittances of the fresh leaf and fresh leaf with the higher refractive index. | |
Based on the known content of each component, leaf structure index and leaf refractive index, the variation trends of the leaf reflectance and leaf transmittance with leaf water content as shown in Fig. 5(a) and (b) can be explained, and the effects of leaf water loss on the leaf reflectance and leaf transmittance can be clarified. In the visible light region, the leaf absorption increases with the increased degree of leaf water loss due to the significantly increased content of the brown pigment, resulting in the decreases of both the reflection radiation and transmission radiation. In addition, both the increased leaf structure index and the increased refractive index lead to an increase in the reflection radiation, which may be larger than the attenuation of reflection radiation due to the enhanced leaf absorption. Consequently, the reflectance of the leaf increases in the visible light region with an increased degree of leaf water loss. In the term of transmittance, both the increased leaf structure index and the increased refractive index further reduce the transmittance of the dehydrated leaf to a low level of approximately zero. Within the wavelength range of 950 to 1300 nm, as the increased degree of leaf water loss, the nearly unchanged leaf absorption, and both the increased leaf structure index and the increased refractive index contribute to the increased reflectance and the decreased transmittance. In the region of water absorption bands, as the increased degree of leaf water loss, the decreased leaf absorption caused by the decreased water content enhances both the reflection and transmission radiations of the leaf. In the term of reflectance, it is further enhanced due to the increased leaf structure index and refractive index. In the term of transmittance, the increment of the leaf transmitted radiation due to the significantly weakened water absorption may be much larger than the attenuation of that caused by the increased leaf structure index and leaf refractive index, increasing the transmittance.
4 Conclusion
In summary, the studies of the changes of the pigment content, structure index and refractive index of the Osmanthus fragrans leaf with the water content revealed the influence mechanism of water loss on the leaf reflectance and leaf transmittance in the wavelength range of 400 to 2500 nm. The results indicated that in addition to reducing water content, water loss also exerted three effects on the leaf reflectance and leaf transmittance. In the term of the pigment, the contents of the chlorophyll and carotenoids maintained nearly unchanged with the increase of water loss, whereas, the brown pigment content was increased significantly, which led to the increased absorption and changed absorption characteristic of the leaf; correspondingly, in the visible region, both the reflected and transmitted radiations were decreased and the reflection peak shifted towards a long wavelength. In terms of structure index and refractive index, they were increased with the increase of water loss, which led to an enhancement of reflected radiation and an attenuation of transmitted radiation over the wavelength range from 400 to 2500 nm. The results elucidated that leaf water loss could not only change the water content but also change the pigment content, structure and refractive index of the leaf. Therefore, it is expected to construct a radiative transfer model of dehydrated leaves and improve the monitoring accuracy of leaf water content if people consider the influences of the changes of leaf pigment content, structure and refractive index with water loss on the spectral characteristics of the leaves in the range of 400 to 2500 nm.
Conflicts of interest
There are no conflicts to declare.
Acknowledgements
This work was supported by the Natural Science Foundation of Jiangsu Province [grant number BK20180957], Changzhou University Fund [grant number ZMF18020059] and National Natural Science Foundation of China [grant number 51576188].
References
- D. A. Sims and J. A. Gamon, Remote Sens. Environ., 2002, 81(2–3), 337–354 CrossRef.
- P. Lukeš, E. Neuwirthová, Z. Lhotáková, R. Janoutová and J. Albrechtová, Remote Sens. Environ., 2020, 246, 111862 CrossRef.
- R. Houborg and M. C. Anderson, J. Appl. Remote Sens., 2009, 3(1), 033529 CrossRef.
- Y. Gao and H. Ye, Int. J. Heat Mass Transfer, 2017, 114, 115–124 CrossRef CAS.
- J. C. Marín-Ortiz, N. Gutierrez-Toro, V. Botero-Fernández and L. M. Hoyos-Carvajal, Saudi J. Biol. Sci., 2020, 27(1), 88–99 CrossRef PubMed.
- B. Demmig-Adams and W. W. Adams Iii, Annu. Rev. Plant Biol., 1992, 43(1), 599–626 CrossRef CAS.
- Q. Ma, A. Ishimaru, P. Phu and Y. Kuga, IEEE Trans. Geosci. Remote Sens., 1990, 28(5), 865–872 Search PubMed.
- S. L. Ustin, D. Riaño and E. R. Hunt, Isr. J. Plant Sci., 2012, 60(1–2), 9–23 Search PubMed.
- E. R. Hunt Jr and B. N. Rock, Remote Sens. Environ., 1989, 30(1), 43–54 CrossRef.
- Y. M. Govaerts, S. Jacquemoud, M. M. Verstraete and S. L. Ustin, Appl. Opt., 1996, 35(33), 6585–6598 CrossRef CAS PubMed.
- S. W. Maier, W. Lüdeker and K. P. Günther, Remote Sens. Environ., 1999, 68(3), 273–280 CrossRef.
- R. Kumar and L. Silva, Appl. Opt., 1973, 12(12), 2950–2954 CrossRef CAS PubMed.
- W. A. Allen, H. W. Gausman, A. J. Richardson and J. R. Thomas, J. Opt. Soc. Am., 1969, 59(10), 1376–1379 CrossRef CAS.
- S. Jacquemoud and F. Baret, Remote Sens. Environ., 1990, 34(2), 75–91 CrossRef.
- J.-B. Feret, C. François, G. P. Asner, A. A. Gitelson, R. E. Martin, L. P. R. Bidel, S. L. Ustin, G. le Maire and S. Jacquemoud, Remote Sens. Environ., 2008, 112(6), 3030–3043 CrossRef.
- G. Yang, C. Zhao, R. Pu, H. Feng, Z. Li, H. Li and C. Sun, J. Appl. Remote Sens., 2015, 9(1), 095976 CrossRef.
- J.-B. Féret, A. A. Gitelson, S. D. Noble and S. Jacquemoud, Remote Sens. Environ., 2017, 193, 204–215 CrossRef.
- S. Jacquemoud, C. Bacour, H. Poilve and J.-P. Frangi, Remote Sens. Environ., 2000, 74(3), 471–481 CrossRef.
- E. R. Hunt Jr, C. S. T. Daughtry and L. Li, Int. J. Remote Sens., 2016, 37(2), 388–402 CrossRef.
- J. Peñuelas and Y. Inoue, Photosynthetica, 1999, 36(3), 355–360 CrossRef.
- X. Li, Z. Sun, S. Lu and K. Omasa, Remote Sens. Environ., 2021, 253, 112230 CrossRef.
- M. Kovar, M. Brestic, O. Sytar, V. Barek, P. Hauptvogel and M. Zivcak, Water, 2019, 11(3), 443 CrossRef CAS.
- Y. Y. Aldakheel and F. M. Danson, Int. J. Remote Sens., 2010, 18(17), 3683–3690 CrossRef.
- G. A. Carter, Am. J. Bot., 1991, 78(7), 916–924 CrossRef.
- J. Otterman, T. Brakke and J. Smith, Remote Sens. Environ., 1995, 54(1), 49–60 CrossRef.
- M. Weiss, D. Troufleau, F. Baret, H. Chauki and N. Brisson, Agricultural and Forest Meteorology, 2001, 108(2), 113–128 CrossRef.
- M. Chen and F. Weng, J. Geophys. Res.: Atmos., 2012, 117, D18 Search PubMed.
- K. F. Palmer and D. Williams, J. Opt. Soc. Am., 1974, 64(8), 1107–1110 CrossRef CAS.
- Y. Gao, B. Tang, G. J. Ji, K. Chen, Z. W. Wang and H. Ye, Mater. Res. Express, 2021, 8(6), 066404 CrossRef CAS.
- J. Gordon and S. Harman, J. Chem. Educ., 2002, 79(5), 611–612 CrossRef CAS.
- H. K. Lichtenthaler, Methods Enzymol., 1987, 148(1), 350–382 CAS.
- F. Baret and T. Fourty, Agronomie, 1997, 17(9–10), 455–464 CrossRef.
- C. Proctor, B. Lu and Y. He, Remote Sens. Environ., 2017, 199, 137–153 CrossRef.
- B. Hosgood, S. Jacquemoud, G. Andreoli, J. Verdebout, G. Pedrini and G. Schmuck, Report EUR 16095 EN: European Commission, Joint Research Centre, Institute for Remote Sensing Applications Italy, 1995 Search PubMed.
- E. B. Knipling, Remote Sens. Environ., 1970, 1(3), 155–159 CrossRef.
|
| This journal is © The Royal Society of Chemistry 2021 |
Click here to see how this site uses Cookies. View our privacy policy here.  Open Access Article
 *a,
Bo Tang
 a,
Beibei Lua,
Guojian Jia and
Hong Ye*b


![[double bond, length as m-dash]](https://www.rsc.org/images/entities/char_e001.gif) CH2 in dry matter, respectively. These two absorption bands seriously affect the characteristics of the reflection and transmission spectra of the leaf, whereas, they can be weakened or even masked by the strong absorption of a large amount of leaf water in the wavelength range of 1300 to 2500 nm.
CH2 in dry matter, respectively. These two absorption bands seriously affect the characteristics of the reflection and transmission spectra of the leaf, whereas, they can be weakened or even masked by the strong absorption of a large amount of leaf water in the wavelength range of 1300 to 2500 nm.


