
 Open Access Article
 This Open Access Article is licensed under a Creative Commons Attribution-Non Commercial 3.0 Unported Licence
Simultaneous determination of hydroquinone and catechol by a reduced graphene oxide–polydopamine–carboxylated multi-walled carbon nanotube nanocomposite†
Fengxia Chang *,
Hongyue Wang,
Shuai He,
Yu Gu,
Wenjie Zhu,
Tanwei Li and
Runhui Ma
*,
Hongyue Wang,
Shuai He,
Yu Gu,
Wenjie Zhu,
Tanwei Li and
Runhui Ma
School of Chemistry and Environment, Southwest Minzu University, Chengdu 610041, P. R. China. E-mail: changfengxia@swun.edu.cn
First published on 28th September 2021
Abstract
A reduced graphene oxide–polydopamine–carboxylated multi-walled carbon nanotube (RGO–PDA–cMWCNT) nanocomposite was fabricated via a facile, one-pot procedure and was characterized by a variety of techniques. A novel electrochemical sensor based on RGO–PDA–cMWCNT was constructed to determine hydroquinone (HQ) and catechol (CT) simultaneously. This newly prepared nanocomposite shows excellent electrocatalytic efficacy in the electrode reaction of the two isomers. Specifically, the peak-to-peak potential difference between the two dihydroxybenzenes is 115 mV for oxidation, which is obviously larger than similar electrochemical sensors. The established method displays a wide linear range from 0.5 to 5000 μM with a detection limit (S/N = 3) of 0.066 μM for HQ and 0.073 μM for CT. In addition, this electrochemical approach has been tested to measure the two dihydroxybenzenes in real samples and satisfactory results were recorded.
1. Introduction
As two momentous dihydroxybenzene isomers, hydroquinone (HQ) and catechol (CT) are extensively applied in synthetic chemical manufacturing industries and usually coexist in environmental samples.1–5 However, both HQ and CT may cause a variety of physical discomfort and diseases to humans.6–8 Besides their high toxicity, they also have low degradability in the natural environment.9 Therefore, the two isomers have been certified as pollutants by environmental protection agencies.10,11 Obviously, it has important implications to construct a selective and simple approach to detect HQ and CT simultaneously. For this purpose, diverse analytical methods have been reported,12–18 and the electrochemical methods among them have the intrinsic advantages of low-cost instrument, uncomplicated operation, fast response, high selectivity and sensitivity.19–21 To detect HQ and CT simultaneously via electrochemical methods, it is a key point to distinguish the overlapped redox signals of the two isomers caused by their similar chemical structures. Various nanomaterials have been used in an attempt to heighten the selectivity and sensitivity of the dihydroxybenzene sensors, such as carbon nanotubes,22 metal/metallic oxide nanoparticles,18,23 quantum dots,24 metal sulphides,25 and mesoporous platinum or carbon.26,27 However, the preparation of the above-mentioned materials needs to be simplified and the sensitivity can be improved further. Nevertheless, it is still worth exploring more materials for the simultaneous determination of HQ and CT to achieve a simpler process, higher sensitivity, and wider linear range.Reduced graphene oxide (RGO) has been widely applied in electrochemical studies due to its excellent properties such as large surface, excellent conductivity and electrocatalytic activity.28–30 However, its application is limited by the trend to aggregate, or even to restack into graphite with no surfactant or polymer dispersant.31 Hence, it is vital to develop an effective procedure for reducing graphene oxide (GO) to improve dispersibility and stability. Dopamine has been successfully used as a reductant for GO.32 In addition, the dopamine self-polymerizes spontaneously in the reduction process, and the formed polydopamine (PDA) possesses strong adhesive property which can be prepared on the surface of many kinds of inorganic and organic materials.33,34 Hence, PDA can act as a protecting agent for stabilizing the as-formed RGO and meanwhile provide a new platform for further modification. In addition, multi-walled carbon nanotubes (MWCNTs) have well-known excellent properties and play a momentous role in the field of electrochemical research, and carboxylated MWCNTs (cMWCNTs) have more reaction diversity due to the carboxyl groups.35–37
In this study, a PDA–RGO nanocomposite was fabricated through a convenient and mild method, which was combined with cMWCNTs to construct a novel nanocomposite. The proposed RGO–PDA–cMWCNT nanocomposite was characterized and applied as an electrode modifier aiming at improving the detection of HQ and CT. The electrochemical tests show that RGO–PDA–cMWCNT modified electrode has better selectivity and enhanced sensitivity towards the measurement of these two isomers.
2. Experimental
2.1. Chemicals
Graphene oxide (GO, purity >99%) and carboxylated multi-walled carbon nanotubes (cMWCNTs, purity >95%, length 10–20 μm, inner diameter 5–15 nm, outer diameter >50 nm) were obtained from Aladdin (China). Hydroquinone (HQ), catechol (CT), dopamine and other reagents were obtained from Chengdu Kelong (China) and were of analytical grade. The phosphate buffer solutions (PBS) contain 0.1 M KCl were prepared by adjusting the pH of H3PO4 with KOH. No further treatment was conducted before using the above reagents.2.2 Apparatus
Electrochemical measurements including impedance spectroscopy (EIS) were performed on a CHI760E electrochemical workstation (China). The three-electrode system consists of a platinum counter electrode, an Ag/AgCl (3.0 M KCl) reference electrode, and a glassy carbon working electrode (GCE, 3.0 mm diameter). Morphology images were obtained on a JEOL-JSM-7500 scanning electron microscope (SEM) (Japan). The optical characterization was conducted using a Mapada 1800 PC UV-Vis spectroscope (China) from 200–800 nm and ultra-pure water was used as the reference. Fourier transform infrared spectroscopy (FTIR) characterization was performed on a Nicolet MX-1E spectroscope (USA). X-ray diffraction (XRD) was conducted using a Rigaku Dmax2200 diffractometer (Japan). Thermal gravimetric analysis (TGA) was performed using a NETZSCH 299-F1 analyzer (Germany).2.3 Preparation of the RGO–PDA–cMWCNT nanocomposite
First, RGO–PDA was fabricated by ultrasonically dispersing 10 mg of GO in 20 mL of PBS (pH = 8.0) placed in an ice water bath and 5 mg dopamine hydrochloride was added with high-purity nitrogen injected into the solution continuously, and immediately ultrasonication was carried out for 10 min. Then, the above suspension was stirred for 24 h with temperature set at 70 °C. This one-pot product was centrifuged (8000 rpm × 10 min) followed by discarding the supernatant and adding water. Moreover, after repeating the above process three times, 5 mL water was added to obtain the RGO–PDA suspension.RGO–PDA–cMWCNT were prepared by mixing 10 mg cMWCNTs and 5 mL of RGO–PDA suspension under sonication for 20 min. Scheme 1 is the graphical illustration for the nanocomposite fabrication.
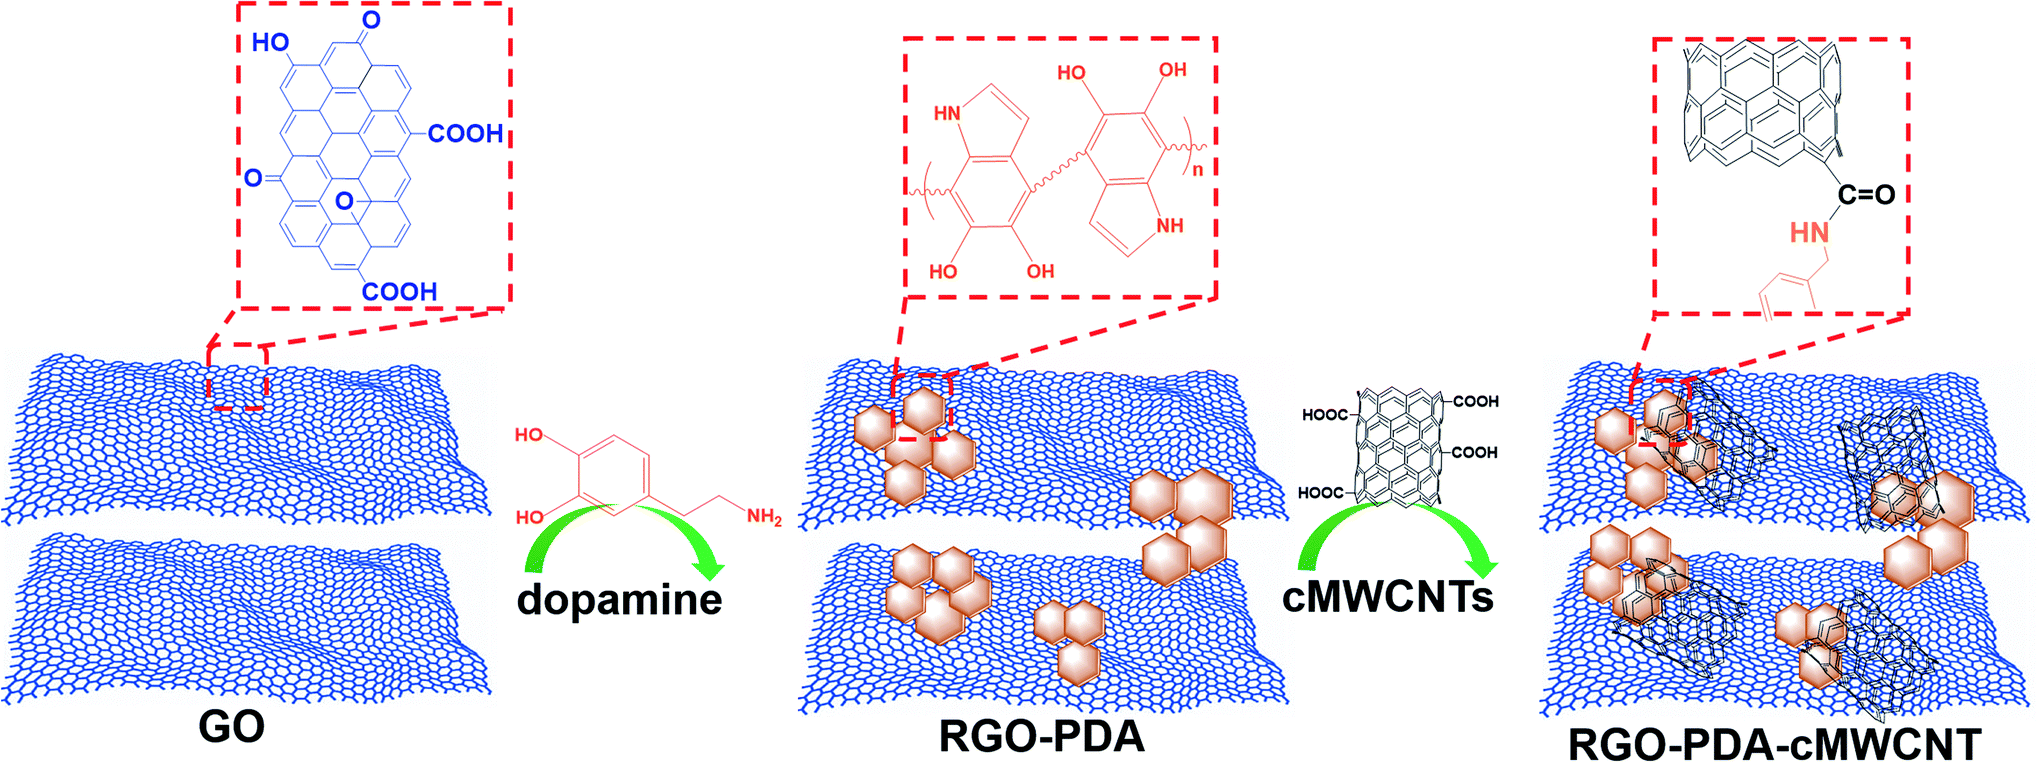 | ||
| Scheme 1 Diagram of preparation of the RGO–PDA–cMWCNT nanocomposite. | ||
2.4 Electrode preparation
The GCE was polished with 0.05 mm alumina polishing powder first, followed by washing ultrasonically in ethanol and water in turn. This GCE was then rinsed with water thoroughly and dried at ambient temperature. After that, the RGO–PDA–cMWCNT nanocomposite (4 μL) solution was placed onto the disk carbon area and dried with an infrared lamp to obtain RGO–PDA–cMWCNT/GCE.2.5 Electrochemical scans
Before electrochemical scans, all the solutions were saturated with ultra-pure nitrogen. EIS study was conducted in a 5.0 mM K3Fe(CN)6/K4Fe(CN)6 solution containing 0.1 M KCl. The potential applied in EIS was 0.0 V and the frequency region was 0.1 Hz to 100 kHz. For cyclic voltammetry (CV) scans, the supporting electrolyte used was 0.1 M PBS, and the potential range was −0.1–0.6 V at the scan rate set as 50 mV s−1 except the scan rate study section. In the differential pulse voltammetry (DPV) scans, the supporting electrolyte was 0.1 M PBS, the potential range was −0.1–0.6 V, the potential increment was 0.004 V, the amplitude was 0.02 V and the pulse width was 0.02 V.3. Results and discussion
3.1 Characterization
The morphology of GO, RGO–PDA and RGO–PDA–cMWCNT composite was explored by SEM. Fig. 1A and D exhibits the typical images of GO with many folds. Also, the noticeable changes can be observed after dopamine reduction (Fig. 1B and E), showing fewer folds and PDA particles well deposited, which provides evidence for the successful synthesis of RGO–PDA. As for RGO–PDA–cMWCNT, besides the similar wrinkles with RGO–PDA under low magnification, it is worth noting in the high magnification that a translucent thin PDA layer was spread over cMWCNTs uniformly while the PDA particles have not been observed (Fig. 1C and F). This phenomenon may indicate that an amidation reaction occurred between the carboxyl group of cMWCNTs and the amino group of dopamine or PDA in ultrasonic and drying processes. Also, the thin layer increases the surface area of PDA compared to particles, which could be beneficial for the stability of the nanocomposite.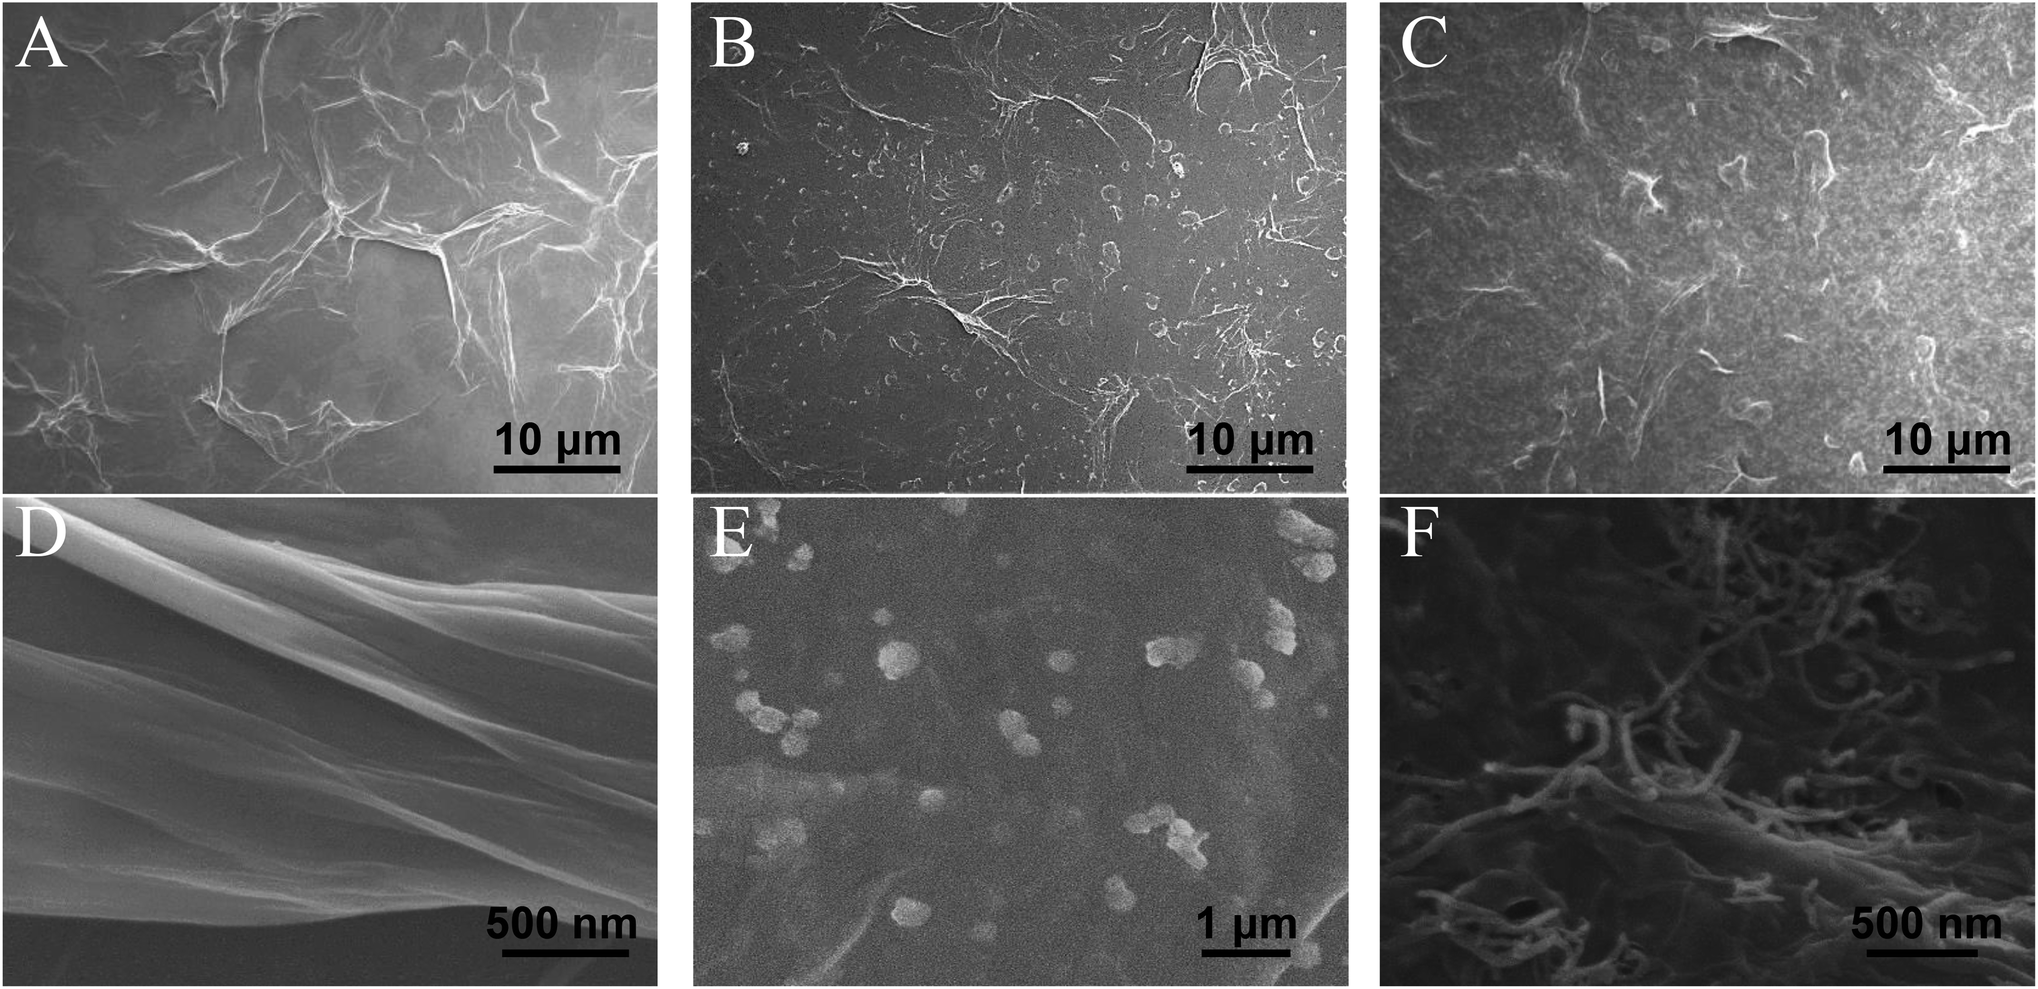 | ||
| Fig. 1 SEM images of GO (A–D), RGO–PDA (B–E) and RGO–PDA–cMWCNT (C–F). | ||
The UV-Vis characterization results of GO, RGO–PDA and RGO–PDA–cMWCNT are displayed in Fig. 2A. For GO, the absorbance peak at 232 nm originates from the π–π* transition of C![[double bond, length as m-dash]](https://www.rsc.org/images/entities/char_e001.gif) C bonds, while the shoulder peak at about 300 nm comes from the R-band absorption of CO bonds. After treatment of the functional groups with dopamine, the absorbance peak at 232 nm moved to 268 nm that is typical band of RGO. The red shift of the bands is caused by an increase in the electronic conjugation after reduction and this phenomenon also proves that GO has been reduced to RGO.38 The spectrum of RGO–PDA–cMWCNT exhibits a peak around 270 assigned to RGO–PDA, and a strong absorption at 224 nm that is a typical peak of carbon nanotubes, confirming the effective fabrication of the nanocomposite.
C bonds, while the shoulder peak at about 300 nm comes from the R-band absorption of CO bonds. After treatment of the functional groups with dopamine, the absorbance peak at 232 nm moved to 268 nm that is typical band of RGO. The red shift of the bands is caused by an increase in the electronic conjugation after reduction and this phenomenon also proves that GO has been reduced to RGO.38 The spectrum of RGO–PDA–cMWCNT exhibits a peak around 270 assigned to RGO–PDA, and a strong absorption at 224 nm that is a typical peak of carbon nanotubes, confirming the effective fabrication of the nanocomposite.
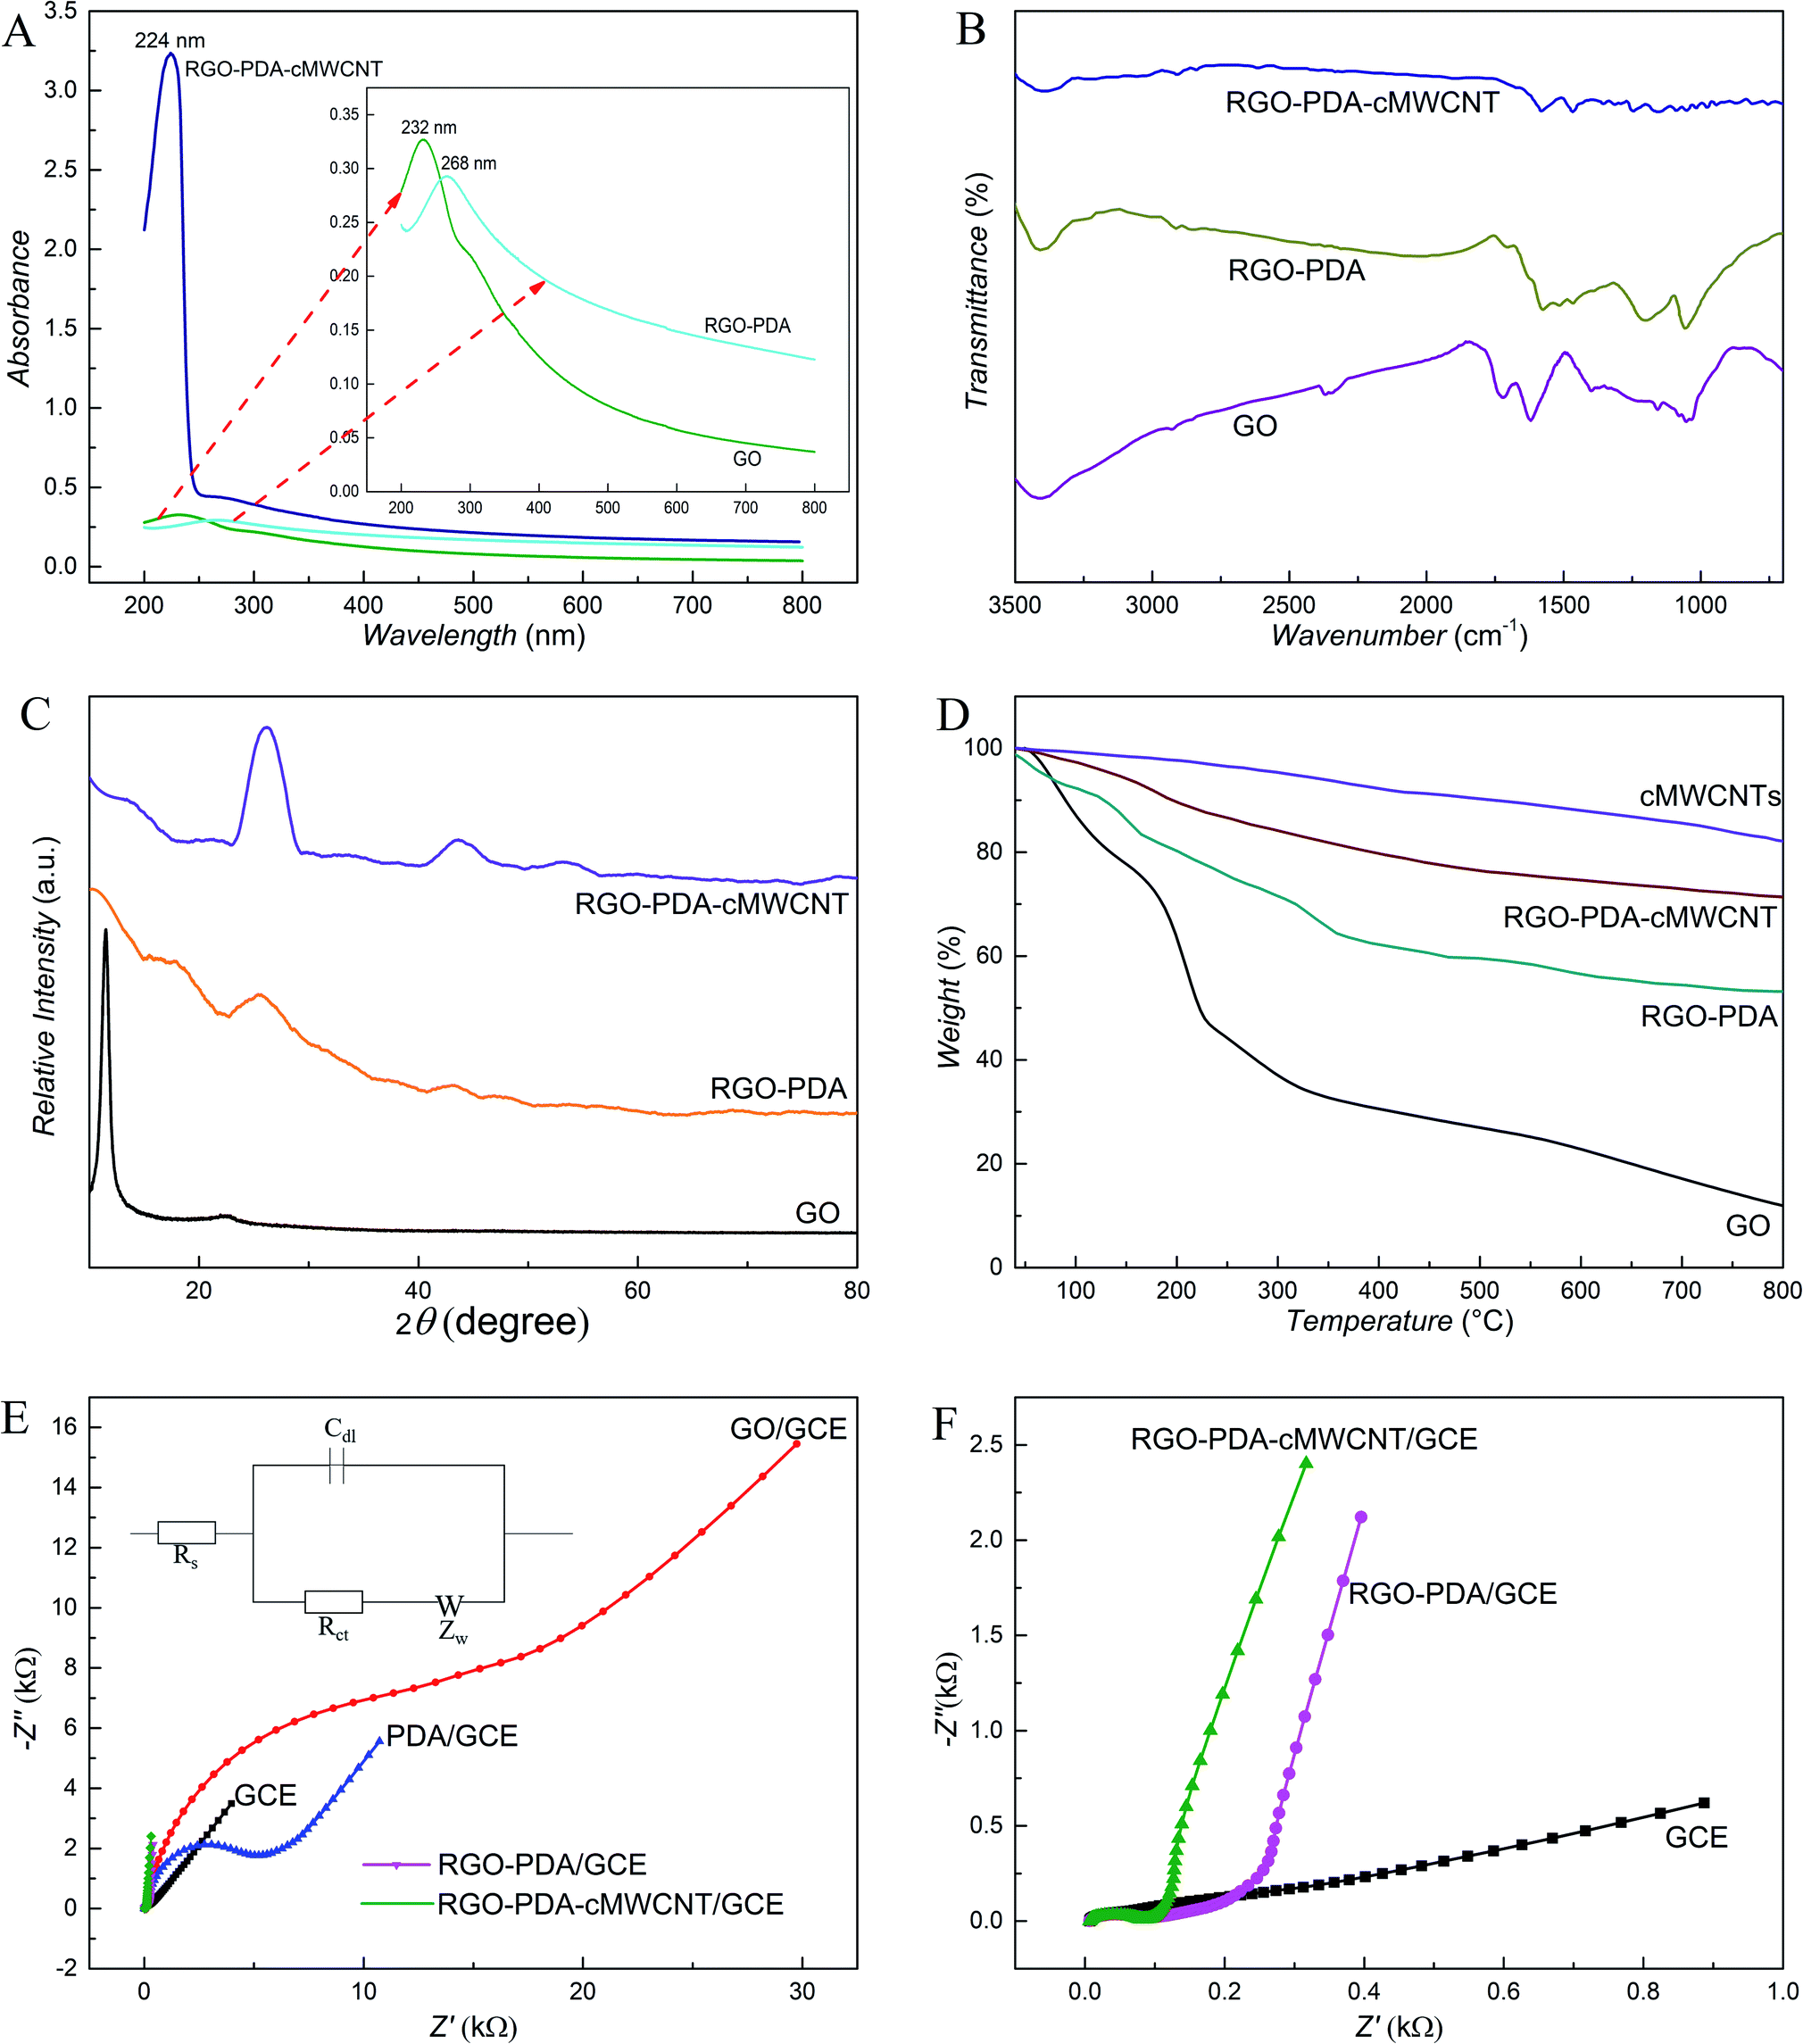 | ||
| Fig. 2 (A) UV-Vis (B) FTIR (C) XRD results of GO, RGO–PDA and RGO–PDA–cMWCNT. (D) TGA curves of GO, RGO–PDA, cMWCNTs and RGO–PDA–cMWCNT. (E and F) Nyquist plots (0.1 Hz to 100 kHz) of different electrodes in the K3Fe(CN)6/K4Fe(CN)6 solution (5.0 mM) that contains 0.1 M KCl. | ||
The FTIR results (Fig. 2B) also verified the synthesis of RGO–PDA–cMWCNT. The FTIR spectra of GO exhibits two characteristic bands at around 1718 cm−1 and 1620 cm−1 originating from CO bonds of carboxyl group, and aromatic CC bonds, respectively.39 The RGO–PDA composite shows two peaks at 1574 cm−1 and 1185 cm−1 for the N–H bending and C–O stretching vibrations of PDA, proving the presence of PDA in this composite. In addition, the intensity of the CO characteristic band at 1718 cm−1 decreases, demonstrating the reduction of GO. In the case of RGO–PDA–cMWCNT, the two peaks at around 1600 cm−1 can be assigned to the CO bonds of the carboxyl group on cMWCNTs and the amide bond between cMWCNTs and PDA, illustrating the formation of the nanocomposite.
The as-synthesized nanocomposite was examined by the XRD technique (Fig. 2C). The GO was tested and a unique peak was observed at 2θ = 11.51°. This characteristic peak decreases significantly after the reaction with dopamine and the wide diffraction peak at 25° due to PDA demonstrates the synthesis of RGO–PDA.40 The reflection peaks of RGO–PDA–cMWCNT at around 25° and 44° increased compared with those of RGO–PDA, which along with the new peaks at 52° demonstrates the formation of the composite. The as-prepared nanocomposite was also investigated via TGA (Fig. 2D). The mass loss occurred up to 70% in GO between 100 °C and 300 °C. For RGO–PDA, only 25% mass loss happened at 300 °C, indicating that GO are reduced and the thermal stability are increased. Compared with RGO–PDA, the mass loss of RGO–PDA–cMWCNT slowed down as the temperature increases and lower mass loss (around 30%) happened at 800 °C. So, it can be concluded from the curves that the thermal stability of RGO–PDA–cMWCNT was further increased due to the thermal property of cMWCNTs. Also, the composite possibly consists of 34% of RGO, 19% of PDA and 47% of cMWCNTs by calculation.
The conductivity property of materials was investigated by EIS (Fig. 2E and F). According to the fit and simulation results, the charge-transfer resistance (Rct) of RGO–PDA/GCE is 220 Ω, which is significantly smaller than that of PDA/GCE (3500 Ω) and GO/GCE (5300 Ω), demonstrating that GO has been reduced in the facile process successfully and the conductivity of RGO–PDA improved obviously. The Nyquist plot of RGO–PDA–cMWCNT/GCE exhibits that its Rct is 196 Ω and the addition of cMWCNTs can improve the composite conductivity although to a small extent compared with RGO–PDA, which could be advantageous to the sensing effect.
3.2 Electrochemical behaviors
The study on the electrochemical response of HQ and CT at RGO–PDA–cMWCNT/GCE was performed using cyclic voltammetry (CV), and the results were compared with that at GCE, GO/GCE, RGO–PDA/GCE and cMWCNTs/GCE. Fig. 3 displays the CVs with the above electrodes in a mixed solution of HQ and CT. It can be seen that the oxidation signals of these isomers overlapped with a low and broad oxidation signal observed using the unmodified GCE, with which the purpose of simultaneous detection could not be achieved. However, two pairs of redox peaks can be recognized at GO/GCE, and the oxidation peak potential difference (ΔEpa) between HQ and CT is 0.105 V. Also, the oxidation peak potential is lower and the reduction peak potential higher compared with the unmodified GCE, indicating that GO has certain electrocatalytic properties and improves the reversibility of the redox process of the two dihydroxybenzenes. However, the peak currents did not improve, illustrating the necessity of the reduction treatment of GO. It can be seen from the CV curves obtained with RGO–PDA/GCE that besides two well-defined oxidation peaks with ΔEpa being 0.105 V, the peak currents greatly increased after GO was reduced by dopamine.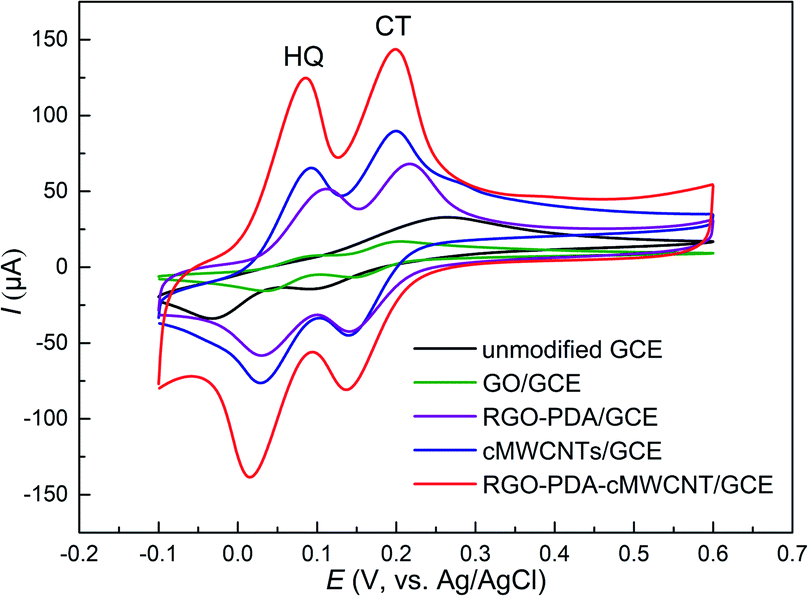 | ||
| Fig. 3 CV results of HQ and CT (each of 0.500 mM) dissolved in 0.1 M PBS (pH 7.0). Scan rate: 50 mV s−1. | ||
Moreover, at the cMWCNTs modified GCE, HQ and CT also showed well-defined redox peaks with ΔEpa being 0.107 V, while lower oxidation peak potentials and higher peak currents were observed compared with RGO–PDA/GCE. However, at the RGO–PDA–cMWCNT nanocompositemodified GCE, CT was oxidized at the same potential and HQ at a lower potential compared with cMWCNTs/GCE. In particular, the redox peaks are respectively at 0.084/0.017 V for HQ and 0.199/0.137 V for CT. The oxidation peak potential difference (ΔEpa) between the two compounds was calculated to be 0.115 V and the reduction peak potential difference (ΔEpc) was 0.120 V. This degree of difference can be distinguished easily by CV measurements and the ΔEpa is obviously larger than the same kind electrochemical sensors based on carbon nanotubes or graphene, as shown in Table 1, showing better selectivity.
| Modifier | ΔEpa (mV) | Linear range (μM) | LOD (μM) | Ref | ||
|---|---|---|---|---|---|---|
| HQ | CT | HQ | CT | |||
| PDA–RGO | 103 | 1–230 | 1–250 | 0.62 | 0.74 | 41 |
| Graphene-chitosan | 96 | 1–300 | 1–400 | 0.75 | 0.75 | 42 |
| RGO/Cu-NPs | 100 | 3–350 | 3–350 | 0.032 | 0.025 | 43 |
| Porous graphene | 94 | 5–90 | 5–120 | 0.08 | 0.18 | 44 |
| Electroreduced GO | 110 | 6–200 | 1–200 | 0.2 | 0.1 | 45 |
| RGO-MWCNT | 100 | 8–391 | 5.5–540 | 2.6 | 1.8 | 46 |
| MWCNTs/PDA/AuNPs | 105 | 0.1–10 | 0.1–10 | 0.035 | 0.047 | 18 |
| MWCNTs | 104 | 2–100 | 2–100 | 0.6 | 0.6 | 47 |
| Cu-MOF-199/SWCNTs | 105 | 0.1–1453 | 0.1–1150 | 0.08 | 0.1 | 48 |
| RGO–PDA–cMWCNT | 115 | 0.5–5000 | 0.5–5000 | 0.066 | 0.073 | This sensor |
Furthermore, at RGO–PDA–cMWCNT/GCE, the peak currents of HQ and CT were further enhanced to almost 2 times of that at cMWCNTs or RGO–PDA modified GCE (Table S1†). The significant improvement of signals may be due to the synergistic interactions of RGO–PDA and cMWCNTs, namely RGO–PDA improves the dispersion of cMWCNTs and cMWCNTs improves the composite conductivity during electrochemical measurements. In addition, PDA can promote the electrochemical stability of the composite as well as the modified electrode in aqueous media. Also, due to its excellent adhesiveness, the studied molecule can be easily adsorbed onto the electrode material, thus improving the local concentration and electrochemical signal. Overall, the RGO–PDA–cMWCNT-based sensor presents remarkable selectivity and improved sensitivity for the measurement of the two dihydroxybenzenes.
3.3 Scan rate study
The CV results of HQ and CT at different scan rates at RGO–PDA–cMWCNT/GCE were studied. As shown in Fig. 4A, as the scan rate increases, the oxidation peak shifts forward and the reduction peak shifts backward, which demonstrates a quasi-reversible reaction during the CV scans. Besides, the redox peak currents (Ipa, Ipc) of these two isomers enhanced gradually as the scan rate increases, showing good linear relations with the square root of the scan rate (Fig. 4B). The fitted formulas are as follows: Ipa (μA) = 11.5ν1/2 − 2.96 (R = 0.999) and Ipc (μA) = −10.8ν1/2 + 14.4 (R = 0.999) for HQ, and Ipa (μA) = 23.0ν1/2 − 47.0 (R = 0.998) and Ipc (μA) = −16.9ν1/2 + 27.5 (R = 0.999) for CT. The diffusion-controlled reaction process of the two dihydroxybenzenes at the as-prepared electrode can be stated by the above analysis.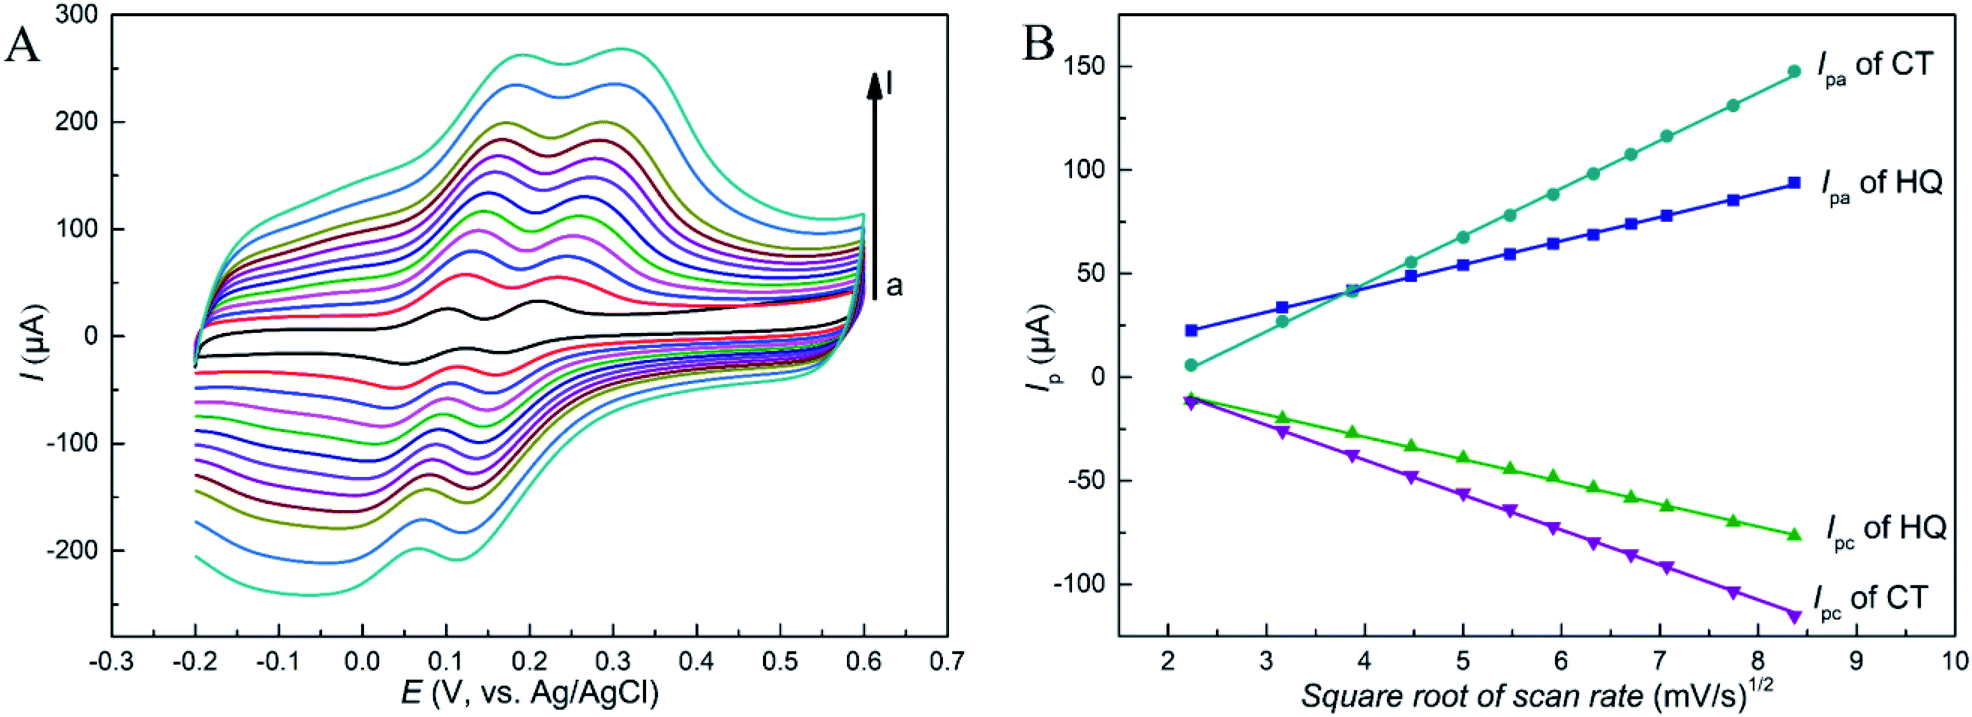 | ||
| Fig. 4 (A) CV results of HQ and CT (0.5 mM) in 0.1 M PBS (pH 7.0) with RGO–PDA–cMWCNT/GCE at different scan rates (5–80 mV s−1). (B) Dependence relationships of peak current with square root of scan rate. | ||
3.4 Optimization of measurement conditions
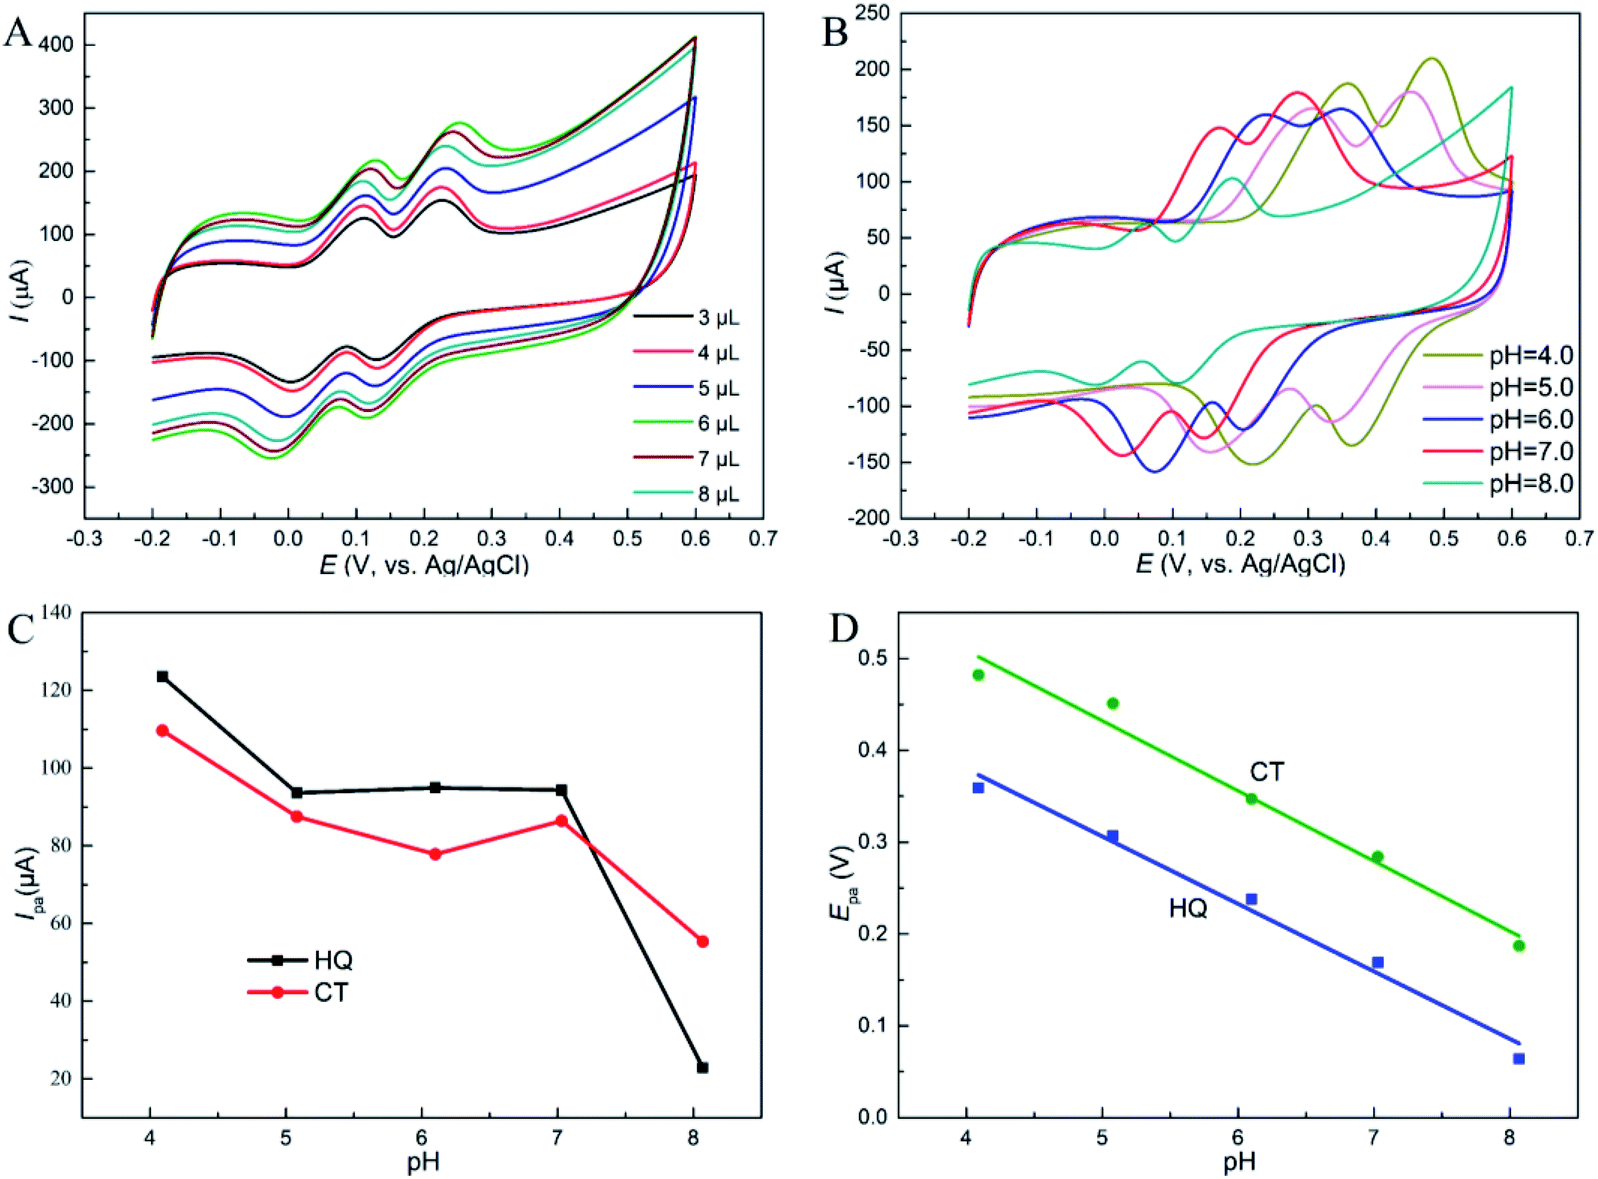 | ||
| Fig. 5 CV results of HQ and CT (0.5 mM) (A) dissolved in 0.1 M PBS (pH 7.0) at electrodes modified with different volumes of the RGO–PDA–cMWCNT nanocomposite, (B) at RGO–PDA–cMWCNT/GCE in the PBS with different pH. Scan rate: 50 mV s−1. (C) Oxidation peak currents in different pH. (D) Linear relationship curves of oxidation peak potential with pH. | ||
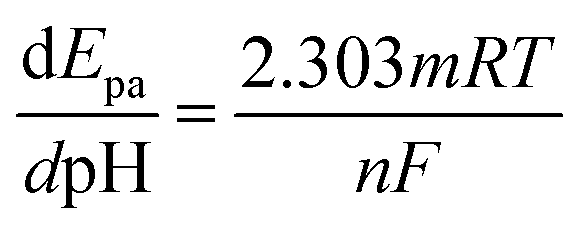
Furthermore, the oxidation peak potentials (Epa) of the two dihydroxybenzenes at different pH are displayed in Fig. 5D. The Epa of the two isomers shifted negatively as pH increases, and showed linear relationship with pH. The fitted equations are respectively listed as: Epa (V) = −0.0734pH + 0.674 (R = 0.992) for HQ, and Epa (V) = −0.0764pH + 0.814 (R = 0.990) for CT. This phenomenon states that protons take part in the reactions directly, and according to the Nernst equation:
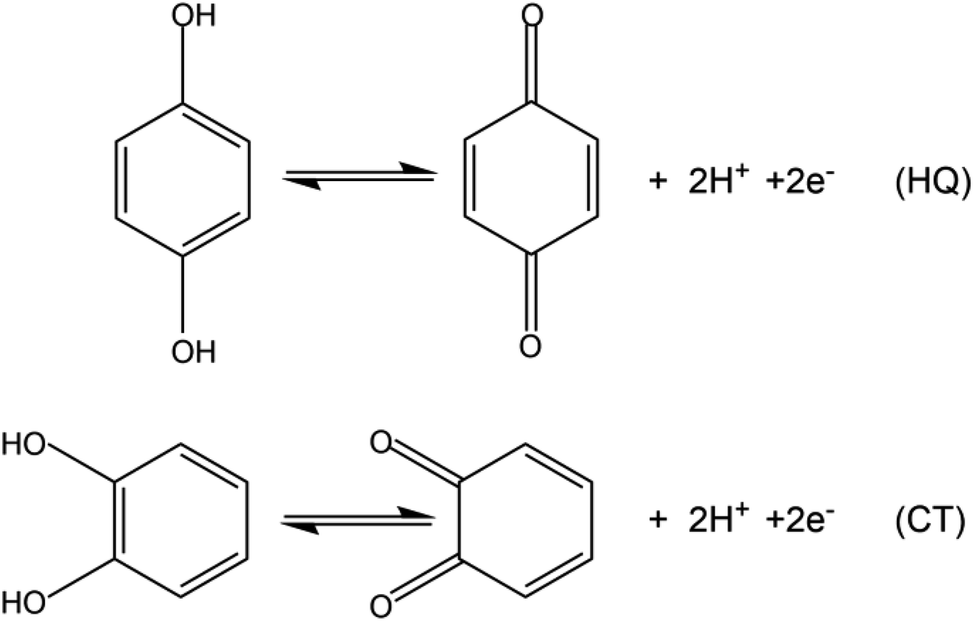 | ||
| Scheme 2 Mechanism of electrochemical reactions of HQ and CT at the RGO–PDA–cMWCNTmodified electrode. | ||
3.5 Quantitative measurement of HQ and CT
For more sensitive measurement of HQ and CT with RGO–PDA–cMWCNT/GCE, differential pulse voltammetry (DPV) has been applied. The scan curves at different concentrations were recorded under optimal conditions and are displayed in Fig. 6A. The fitted equations are displayed in Fig. 6B. The linear fitted results with only low concentrations are also displayed in Fig. 6B as inset and the fitting equations are described as Ip (μA) = 0.124C (μM) + 36.2 for HQ and Ip (μA) = 0.120C (μM) + 59.1 for CT. It can be seen that the slope and intercept are really close to the fitted results with all concentrations involved. Therefore, the linear range can be concluded as 0.5 μM to 5000 μM. Moreover, the limits of detection (S/N = 3) are 0.066 μM for HQ and 0.073 μM for CT, respectively. The results demonstrate lower limit of detection as well as wider linear range compared with similar sensors based on graphene or carbon nanotubes (Table 1), which suggest that the electrochemical sensor based on the RGO–PDA–cMWCNT composite can achieve selective and sensitive measurement for HQ and CT. | ||
| Fig. 6 (A) DPV results using RGO–PDA–cMWCNT/GCE in HQ and CT dissolved in 0.1 M PBS (pH 7.0) solutions with the concentration as (a) 0 μM, (b) 0.500 μM, (c) 0.800 μM, (d) 30.0 μM, (e) 80.0 μM, (f) 5.00 × 10² μM, (g) 7.50 × 10² μM, (h) 1.00 × 10³ μM, (i) 3.00 × 10³ μM, (j) 5.00 × 10³ μM. Scan rate: 50 mV s−1. (B) Linear relationship curves of peak current with concentration of HQ or CT, the inset is the linear fitted curves with concentration ranging from 0.500 μM to 80.0 μM. | ||
3.6 Reproducibility and stability
DPV was performed to explore the repeatability of the detection using RGO–PDA–cMWCNT/GCE. The peak currents in HQ and CT solutions were recorded with 6 modified electrodes prepared in parallel (Fig. S1A†). The relative standard deviations (RSDs) are respectively 1.96% for HQ and 2.35% for CT. The stability of RGO–PDA–cMWCNT/GCE was assessed via keeping it in air at room temperature for two weeks, and it was found that the sensor retains respectively about 95.9% and 96.4% of the initial peak current for the two compounds (Fig. S1B†). The results declare that this established method has reasonably good reproducibility and stability.3.7 Interference investigation
The selectivity of the RGO–PDA–cMWCNT-based sensor was investigated by adding various interferences in the DPV measurement of HQ and CT. It was revealed that 20-fold ions such as Na+, Mg2+, Ca2+, Cu2+, Zn2+, SO42− and NO3− showed no effect on the analysis of HQ and CT (Fig. S2†). In addition, 10-fold phenol and resorcinol do not bring about noticeable change with the measurement of HQ and CT. All results indicate an excellent selectivity of RGO–PDA–cMWCNT/GCE.3.8 Application
To examine the performance of RGO–PDA–cMWCNT/GCE in practical use, the tap water and lake water samples were tested and spiked with HQ and CT (Fig. S3†). The recoveries are 97.5–102% for HQ and 98.3–101% for CT, respectively (Table 2), indicating that the proposed method has excellent reliability and feasibility for real samples.| Sample | Original (μM) | Added (μM) | Found (μM) | Recovery (%) | RSD (%) (n = 3) | ||||
|---|---|---|---|---|---|---|---|---|---|
| HQ | CT | HQ | CT | HQ | CT | HQ | CT | ||
| Tap water | — | 20.0 | 20.0 | 19.6 | 20.7 | 98.0 | 101 | 2.1 | 1.9 |
| 100 | 100 | 97.6 | 98.3 | 97.6 | 98.3 | 1.8 | 1.6 | ||
| 500 | 500 | 503 | 495 | 101 | 99.0 | 0.63 | 0.86 | ||
| Lake water | — | 20.0 | 20.0 | 19.5 | 19.7 | 97.5 | 98.5 | 2.2 | 2.0 |
| 100 | 100 | 102 | 97.8 | 102 | 97.8 | 1.7 | 1.6 | ||
| 500 | 500 | 497 | 496 | 99.4 | 99.2 | 0.73 | 0.82 | ||
4. Conclusions
A selective, sensitive and reliable electrochemical sensor based on the RGO–PDA–cMWCNT nanocomposite was structured for the determination of HQ and CT. The nanocomposite was prepared via a facile and simple method with the reduction of GO with dopamine and subsequent addition of cMWCNTs by ultrasonication. For the determination of HQ and CT, well-defined peaks, large peak potential difference and significantly increased peak currents were observed at RGO–PDA–cMWCNT/GCE, which clearly demonstrated that the RGO–PDA–cMWCNT nanocomposite acts as a valid promoter to accelerate the kinetics of the reaction of the two isomers. Moreover, RGO–PDA–cMWCNT/GCE showed excellent reproducibility and stability, and reasonable results were received in the standard recovery test for real water samples. All the results indicate that the RGO–PDA–cMWCNT nanocomposite should have a potential prospect for the electrochemical sensing.Author contributions
Conceptualization: all; methodology: Fengxia Chang; validation: Hongyue Wang and Yu Gu; formal analysis: Wenjie Zhu; investigation: Hongyue Wang, Yu Gu and Runhui Ma; resources: Tanwei Li; data curation: Shuai He; writing—original draft: Fengxia Chang; writing—review and editing: Fengxia Chang and Shuai He; visualization: Shuai He; supervision: Fengxia Chang; project administration: Fengxia Chang; funding acquisition: Fengxia Chang. All authors have read and agreed to the published version of the manuscript.Conflicts of interest
There are no conflicts to declare.Acknowledgements
We acknowledge financial support of the Fundamental Research Funds for the Central Universities (Southwest Minzu University, 2020NQN07).References
- A. T. E. Vilian, S. M. Chen, L. H. Huang, M. A. Ali and F. M. A. Al-Hemaid, Electrochim. Acta, 2014, 125, 503–509 CrossRef CAS.
- T. Lai, W. H. Cai, W. L. Dai and J. S. Ye, Electrochim. Acta, 2014, 138, 48–55 CrossRef CAS.
- M. Arago, C. Arino, A. Dago, J. M. Diaz-Cruz and M. Esteban, Talanta, 2016, 160, 138–143 CrossRef CAS PubMed.
- J. Tashkhourian, M. Daneshi, F. Nami-Ana, M. Behbahani and A. Bagheri, J. Hazard. Mater., 2016, 318, 117–124 CrossRef CAS PubMed.
- P. Ambigaipalan, A. C. de Camargo and F. Shahidi, J. Agric. Food Chem., 2016, 64, 6584–6604 CrossRef CAS PubMed.
- G. C. Jagetia and R. Aruna, Toxicol. Lett., 1997, 93, 205–213 CrossRef CAS PubMed.
- L. Taysse, D. Troutaud, N. A. Khan and P. Deschaux, Toxicology, 1995, 98, 207–214 CrossRef CAS PubMed.
- H. S. Han, J. M. You, H. Seol, H. Jeong and S. Jeon, Sens. Actuators, B, 2014, 194, 460–469 CrossRef CAS.
- H. S. Yin, Q. M. Zhang, Y. L. Zhou, Q. A. Ma, T. Liu, L. S. Zhu and S. Y. Ai, Electrochim. Acta, 2011, 56, 2748–2753 CrossRef CAS.
- W. M. Si, W. Lei, Z. Han, Q. L. Hao, Y. H. Zhang and M. Z. Xia, Sens. Actuators, B, 2014, 199, 154–160 CrossRef CAS.
- S. Q. Feng, Y. Y. Zhang, Y. M. Zhong, Y. C. Li and S. X. Li, J. Electroanal. Chem., 2014, 733, 1–5 CrossRef CAS.
- P. Ramakrishnan and K. Rangiah, Anal. Methods, 2016, 8, 8033–8041 RSC.
- S. C. Moldoveanu and M. Kiser, J. Chromatogr. A, 2007, 1141, 90–97 CrossRef CAS PubMed.
- Y. P. Dong, Y. Zhou, J. Wang, Y. Q. Dong and C. M. Wang, Talanta, 2016, 146, 266–271 CrossRef CAS PubMed.
- D. H. Yuan, S. H. Chen, R. Yuan, J. J. Zhang and W. Zhang, Analyst, 2013, 138, 6001–6006 RSC.
- S. Fragoso, L. Acena, J. Guasch, M. Mestres and O. Busto, J. Agric. Food Chem., 2011, 59, 10795–10802 CrossRef CAS PubMed.
- M. López, F. Martinez, C. D. Valle, M. Ferrit and R. Luque, Talanta, 2003, 60, 609–616 CrossRef.
- Y. Wang, Y. Xiong, J. Qu, J. Qu and S. Li, Sens. Actuators, B, 2016, 223, 501–508 CrossRef CAS.
- M. Deng, S. Lin, X. Bo and L. Guo, Talanta, 2017, 174, 527–538 CrossRef CAS PubMed.
- K. Chetankumar, B. E. Kumara Swamy and S. C. Sharma, Microchem. J., 2020, 156, 104979 CrossRef CAS.
- X. Y. Lu, S. F. Zhang, F. Y. Kong, Z. X. Wang, H. Y. Li, H. L. Fang and W. Wang, Microchem. J., 2021, 166, 106246 CrossRef CAS.
- Z. Wang, S. Li and Q. Lv, Sens. Actuators, B, 2007, 127, 420–425 CrossRef CAS.
- N. Lavanya and S. Chinnathambi, RSC Adv., 2016, 6, 68211–68219 RSC.
- W. Zhang, J. Zheng, Z. Lin, L. Zhong, J. Shi, C. Wei, H. Zhang, A. Hao and S. Hu, Anal. methods, 2015, 7, 6089–6094 RSC.
- S. Hu, W. Zhang, J. Zheng, J. Shi, Z. Lin, L. Zhong, G. Cai, C. Wei, H. Zhang and A. Hao, RSC Adv., 2015, 5, 18615–18621 RSC.
- M. A. Ghanem, Electrochem. Commun., 2007, 9, 2501–2506 CrossRef CAS.
- J. Yu, W. Du, F. Zhao and B. Zeng, Electrochim. Acta, 2009, 54, 984–988 CrossRef CAS.
- D. Chen, L. Tang and J. Li, Chem. Soc. Rev., 2010, 39, 3157–3180 RSC.
- J. B. Li, Z. B. Ding, J. L. Li, C. Y. Wang, L. K. Pan and G. X. Wang, Chem. Eng. J., 2021, 407, 127199 CrossRef CAS.
- R. Baronia, J. Goel and S. K. Singhal, J. Nanosci. Nanotechnol., 2021, 21, 1721–1727 CrossRef CAS PubMed.
- L. J. Cote, F. Kim and J. Huang, J. Am. Chem. Soc., 2009, 131, 1043–1049 CrossRef CAS PubMed.
- L. Q. Xu, W. J. Yang, K. G. Neoh, E. T. Kang and G. D. Fu, Macromolecules, 2010, 43, 8336–8339 CrossRef CAS.
- H. Lee, S. M. Dellatore, W. M. Miller and P. B. Messersmith, Science, 2007, 318, 426–430 CrossRef CAS PubMed.
- W. B. Sheng, B. Li, X. L. Wang, B. Dai, B. Yu, X. Jia and F. Zhou, Chem. Sci., 2015, 6, 2068–2073 RSC.
- M. Trojanowicz, Trends Anal. Chem., 2006, 25, 480–489 CrossRef CAS.
- R. Gupta and B. Singh, Adv. Mater. Sci. Eng., 2020, 262, 114730 CrossRef CAS.
- F. Gao, J. Zou, W. Zhong, X. L. Tu, X. G. Huang, Y. F. Yu, X. Q. Wang, L. M. Lu and L. Bai, Nanotechnol, 2021, 32, 085501 CrossRef CAS PubMed.
- D. Li, M. B. Muller, S. Gilje, R. B. Kaner and G. G. Wallace, Nat. Nanotechnol., 2008, 3, 101–105 CrossRef CAS PubMed.
- P. L. Ríos, P. Povea, C. Cerda-Cavieres, J. L. Arroyo, C. Morales-Verdejo, G. Abarca and M. B. Camarada, RSC Adv., 2019, 9, 8480–8489 RSC.
- K. Karami, A. R. Allafchian, R. Amiri, F. Shirani, P. Bayat and B. Rezaei, Appl. Organomet. Chem., 2019, 33, e4834 CrossRef.
- L. Zheng, L. Xiong, Y. Li, J. Xu, X. Kang, Z. Zou, S. Yang and J. Xia, Sens. Actuators, B, 2013, 177, 344–349 CrossRef CAS.
- H. Yin, Q. Zhang, Y. Zhou, Q. Ma, T. Liu, L. Zhu and S. Ai, Electrochim. Acta, 2011, 56, 2748–2753 CrossRef CAS.
- S. Palanisamy, C. Karuppiah, S. M. Chen, C. Y. Yang and P. Periakaruppan, Anal. Methods, 2014, 6, 4271–4278 RSC.
- H. Zhang, X. Bo and L. Guo, Sens. Actuators, B, 2015, 220, 919–926 CrossRef CAS.
- L. Chen, Y. Tang, K. Wang, C. Liu and S. Luo, Electrochem. Commun., 2011, 13, 133–137 CrossRef CAS.
- F. Hu, S. Chen, C. Wang, R. Yuan, D. Yuan and C. Wang, Anal. Chim. Acta, 2012, 724, 40–46 CrossRef CAS PubMed.
- Y. P. Ding, W. L. Liu, Q. S. Wu and X. G. Wang, J. Electroanal. Chem., 2005, 575, 275–280 CrossRef CAS.
- J. Zhou, X. Li, L. Yang, S. Yan and C. Zhang, Anal. Chim. Acta, 2015, 899, 57–65 CrossRef CAS PubMed.
Footnote |
| † Electronic supplementary information (ESI) available. See DOI: 10.1039/d1ra06032e |
| This journal is © The Royal Society of Chemistry 2021 |