DOI:
10.1039/D1RA06025B
(Paper)
RSC Adv., 2021,
11, 33798-33808
Synthesized akhtenskites remove ammonium and manganese from aqueous solution: removal mechanism and the effect of structural cations†
Received
9th August 2021
, Accepted 27th September 2021
First published on 15th October 2021
Abstract
Ammonium and manganese removal by tunnel-structured manganese oxide is still enigmatic. Herein, tunnel-structured akhtenskites with different structural cations (Na–MnOx, Mg–MnOx Ca–MnOx, Fe–MnOx) were synthesized by the KMnO4 and Mn2+ reaction in the presence of different metal cations, and were used to remove ammonium and manganese from aqueous solution. The results of the batch adsorption experiments indicated that akhtenskites effectively removed NH4+ and Mn2+, and the removal process fitted the pseudo-second-order model. By measuring the concentration of nitrate and nitrite, discriminating the adsorbed and oxidized Mn2+, and testing the zeta potential of the oxides, it can be concluded that NH4+ was merely removed by electrostatic adsorption via ![[triple bond, length as m-dash]](https://www.rsc.org/images/entities/char_e002.gif) Mn–O−; Mn2+ could also be adsorbed by ion exchange with Mn–OH, and the adsorbed Mn2+ could be partly oxidized. The structural properties of the akhtenskites were characterized by X-ray diffraction (XRD), scanning electron microscopy (SEM), Brunauer–Emmett–Teller (BET) specific area, and X-ray photoelectron spectroscopy (XPS). The experimental results showed that ions with higher valence can result in a higher percentage of Mn(III) in akhtenskite. Mg2+ can result in a lower proportion of lattice oxygen in the oxide, and Fe3+ can increase the pH of the point of zero charge. Both of them were unfavored for the oxidation of Mn2+. Moreover, it was found that Ca–MnOx had optimal removal performance in the catalytic oxidation of Mn2+ owing to appropriate percentages of Olatt and Mn(III) and lower zeta potential. This study provides new insights into the synthesis and application of manganese oxides.
Mn–O−; Mn2+ could also be adsorbed by ion exchange with Mn–OH, and the adsorbed Mn2+ could be partly oxidized. The structural properties of the akhtenskites were characterized by X-ray diffraction (XRD), scanning electron microscopy (SEM), Brunauer–Emmett–Teller (BET) specific area, and X-ray photoelectron spectroscopy (XPS). The experimental results showed that ions with higher valence can result in a higher percentage of Mn(III) in akhtenskite. Mg2+ can result in a lower proportion of lattice oxygen in the oxide, and Fe3+ can increase the pH of the point of zero charge. Both of them were unfavored for the oxidation of Mn2+. Moreover, it was found that Ca–MnOx had optimal removal performance in the catalytic oxidation of Mn2+ owing to appropriate percentages of Olatt and Mn(III) and lower zeta potential. This study provides new insights into the synthesis and application of manganese oxides.
1 Introduction
Ammonium and manganese are two important pollutants in water sources in China.1 Excessive manganese contaminates fabrics, causes esthetic discomfort, and induces central nervous system damage.2 Ammonium in water sources can consume dissolved oxygen, increase the amount of disinfectant, and promote the formation of chlorine disinfection byproducts.3,4 In addition, both of them often exist simultaneously, making the removal process more complicated.5
Several methods have been developed to remove ammonium and manganese from water, such as the addition of oxidants, biological filtration, chemical catalytic oxidation, etc.6–10 Among these processes, adsorption is one of the most promising strategies due to its high removal efficiency, cost-effectiveness, and easy implementation.11–13 The development of new adsorbents with excellent removal performance is a critical problem to be solved.
Manganese oxide is an important absorbent for removing ammonium and manganese from water because of its low cost, high adsorption capacity, and potential catalytic activity.14,15 At present, more than 30 different natural and synthetic manganese oxide minerals are known to exist.16 Most of them consist of a layer or a tunnel structure with different MnO6 octahedra arrangements, forming basic building blocks.16,17 Manganese oxides are often coated on zeolite, sand, or activated carbon as a filter material.12,18 Even in a biofilter, they exhibit a high sorption capacity, which is less dependent on microbial activity.19,20
The removal capability of manganese oxide depends on its structure to some extent.21–23 Most studies have focused on layer-structured manganese oxides, such as birnessite.10,12,15,23 To the best of our knowledge, there is limited research on tunnel-structured manganese oxide even though it is an important type of manganese oxide.16 Therefore, more research on the tunnel-structured manganese oxide is necessary. In addition, the fine structure of manganese oxides is vulnerable to factors in the formation environment, such as pH, temperature, aging time, and especially metal ions.24 Metal ions in solution could influence the manganese oxide structure by inserting into the interlayer or tunnels in oxides or replacing Mn4+ in the MnO6 octahedral units.25 Unfortunately, few studies have focused on its effects on ammonium and manganese removal.
Compared to other tunnel-structured manganese oxides, akhtenskite (ε-MnO2) has important applications in the field of environment, although it was discovered relatively late and the structural features are unclear.26–28 Therefore, it was selected as a representative and synthesized by a redox reaction between KMnO4 and MnCl2, in the presence of different metal cations (Na+, Mg2+, Ca2+, and Fe3+),26 in this study. The aim of this paper is to investigate ammonium and manganese removal capabilities and mechanisms of tunnel-structured manganese oxides and explores the effects of metal ions on the fine structure of the oxide and the removal process.
2 Material and methods
2.1 Manganese oxide preparation
KMnO4 and Me(NO3)n (Me represents Na, Mg, Ca, or Fe) were dissolved in 430 mL of deionized water to prepare a 0.1 mol L−1 KMnO4 aqueous solution with 0.37 mol L−1 Na+ or 0.19 mol L−1 Ca2+, Mg2+, and Fe3+. Then, the KMnO4 aqueous solution was added dropwise to 345 mL of 0.2 mol L−1 MnCl2·4H2O under continuous magnetic stirring. The manganese oxide formed was filtered off and washed with deionized water several times until the pH of the cleaning solution was approximately 7.0. Finally, the oxide was dried in an oven for 24 h at 35–40 °C and kept in a sealed container before use.
2.2 Characterization methods
Powder X-ray diffraction (XRD) analysis was performed using a Smartlab9K X-ray diffractometer (Rigaku, Japan) equipped with Cu Kα radiation (λ = 0.1542 nm), operated at 40 kV and 40 mA. Continuous scans were taken in a 2θ range of 5–80° with a scan rate of 5° min−1 and a stepwise of 0.02°. SEM images were obtained using a Quanta 600F field-emission scanning electron microscope (FEI incorporation, USA). The binding energies were measured using X-ray photoelectron spectroscopy (XPS) (Thermo Scientific K-Alpha). A conventional Al-Kα anode radiation source was used as the excitation source. The binding energies were calibrated using the C1s binding energy at 284.6 eV. Zeta potential was detected using a Powereach JS94K (Shanghai Zhongchen Digital Technology Equipment Co., Ltd, China). The surface and pore properties of the adsorbent were studied using nitrogen adsorption experiments with an ASAS2020 plus (Micromeritics, USA). The specific surface area of the adsorbent was calculated using the Brunauer–Emmett–Teller (BET) method.
2.3 Removal capability and mechanism evaluation
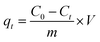
2.3.1 Adsorption isotherms and kinetics. Kinetics and isotherm experiments were performed in Erlenmeyer flasks in a water bath shaker with a shaking speed of 110 rpm at 25 °C. In both experiments, the concentration of Me–MnOx was 0.5 g L−1 and the reaction solution was 100 mL. Solutions of Mn2+ and NH4+ were prepared by MnCl2·4H2O and NH4Cl, respectively. In the isotherm experiment, the concentrations of Mn2+ and NH4+ were 5–25 mg L−1 and 1–20 mg L−1, respectively, and the equilibration time was 150 min. In the kinetic experiment, the concentrations of Mn2+ and NH4+–N were 25 and 10 mg L−1, respectively, and the samples were taken at 0, 5, 10, 20, 30, 60, and 150 min for detection. Samples for Mn2+ and NH4+–N analysis were obtained by filtration of the suspension through a 0.22 μm filter cellulose acetate membrane.The adsorbed amount of NH4+ or Mn2+ at time t, qt (mg g−1), was calculated using eqn (1):
| |
 | (1) |
where
C0 (mg L
−1) is the initial concentration of NH
4+ and Mn
2+ (mg L
−1),
Ct is the concentration at time
t,
V (L) is the volume of the reaction solution, and
m (g) is the mass of the adsorbents.
2.3.2 Effect of pH. The removal of Mn2+ and NH4+ at various pH values was investigated. pH was adjusted in 2.0–8.0 by 0.1 mol L−1 NaOH and 1 mol L−1 HCl and was. The initial concentrations of Mn2+ and NH4+–N were 25 and 2 mg L−1, respectively. The equilibration time was 150 min.
2.3.3 Simultaneous removal of ammonium and manganese. The concentration of ammonium was 5.0 mg L−1 and the concentration of Mn2+ was 5.0, 10.0, 15.0 and 25.0 mg L−1, respectively, to study the effect of Mn2+ on ammonium removal. The concentration of manganese was 25.0 mg L−1 and the concentration of ammonium was 5.0, 10.0 and 15.0 mg L−1 respectively to study the effect of ammonium on manganese removal. The equilibrium time was 150 min, and the initial pH was 7.0.
2.3.4 Evaluation of catalytic oxidation capacity. An experiment was designed to determine whether the synthesized oxides had a catalytic oxidation capacity or merely absorption of ammonium and manganese. Two hundred mg L−1 of sodium bicarbonate, which is approximate to the alkalinity content in water sources in China,9,29 was added to the reaction solution to enhance the acid–base buffer capacity of the reaction system and eliminate the effect of pH. The initial pH of the reaction solution was approximately 8.17.The catalytic oxidation capacity of ammonium was evaluated by detecting the concentration of nitrate and nitrate produced in the removal process. To investigate the catalytic oxidation of Mn2+, a 50 mg L−1 Mn2+ solution (with 200 mg L−1 NaHCO3) of 345 mL was added to a sealed glass bottle and reacted with 25 mg Me–MnOx in a water bath shaker for 600 min. The catalytic oxidation capability of Mn2+ was evaluated by discriminating the adsorbed Mn2+ and oxidized Mn2+. The amount of total removed manganese (TMn) and the amount of adsorbed manganese (AMn) were detected. AMn was measured as described by Sahabi.19 When the reaction was complete, the mixture was filtered, and the residual Mn2+ in the filtrate was measured. The oxides were collected and washed with deionized water several times. Then, the separated oxide was placed in 100 mL of 10 mM CuSO4 solution (pH = 4.8) and stored in a closed polyethylene bottle for about 24 h. Since Cu2+ can replace Mn2+ on the oxides, any Mn2+ adsorbed but not oxidized would be desorbed back into the solution and be detected.
The amount of oxidized manganese (OMn) and the oxidation ratio (OR) were calculated using the following equation:
2.4 Analytical methods
The chemical reagents used in this study were of analytical grade and purchased from Sinopharm Chemical Reagent Co., Ltd. (Shanghai, China). The pH and dissolved oxygen (DO) were measured using a pH meter (PH-25, Leici Co., China) and dissolved oxygen meter (JPB-607A, Leici Co., China), respectively. The concentrations of Mn2+ and NH4+ were measured by potassium periodate oxidation spectrophotometry and Nessler's reagent photometry according to the guidelines of the Ministry of Environmental Protection of China.30
3 Results and discussion
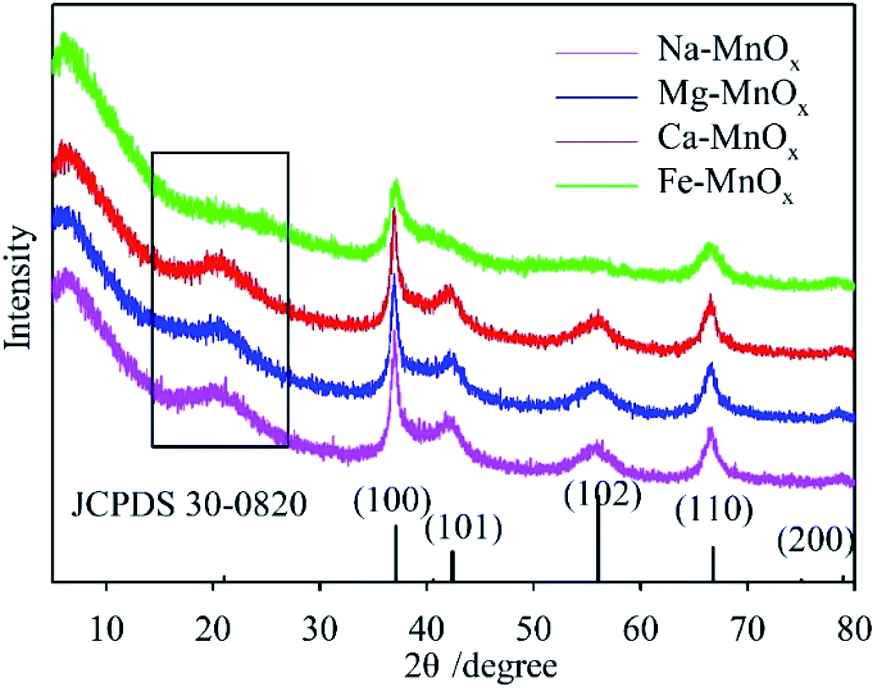
3.1 Phase structure of the synthesized manganese oxides
The XRD patterns of the synthesized oxides are shown in Fig. 1. This indicates that all the spectra can be indexed to akhtenskite as compared to the reference pattern (ε-MnO2, JCPDS 30-0820, a = 2.80, c = 4.45 Å). The structure of akhtenskite is similar to that of γ-MnO2, but shows more structural faults (De Wolff faults) and microtwinning.31,32 The manganese oxide tunnel could be occupied by charge-balancing cations, and the dimensions of the tunnel would vary slightly.25,33 This feature highlights the potential of manganese oxides as an adjustable molecular sieve.34 In this study, the experimental results showed that for Na–, Mg–, and Ca–MnOx, the broad peaks on the left (in the black box) of the spectra were at 21.17°, 20.44°, and 20.78°, respectively. Therefore, the corresponding interplanar spacing was 4.19 Å, 4.34 Å, and 4.27 Å, respectively, according to the Bragg diffraction equation.25 This indicated that Na+, Mg2+, and Ca2+ were inserted into the lattice of manganese oxide and changed the tunnel size. For Fe–MnOx, the intensities of the diffraction peaks of (101), (102), and at the left of the spectrum were weak and eventually disappeared. This suggested that Fe3+ made the structure more disordered and the crystalline size of the oxide was smaller.
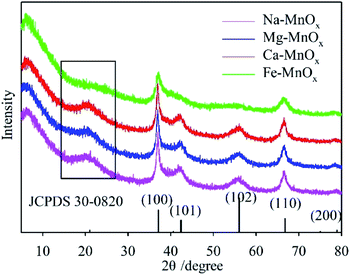 |
| | Fig. 1 XRD patterns of the synthesized manganese oxides with different structural cations. | |
3.2 Evaluation of removal capability
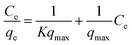
3.2.1 Adsorption isotherms. The Langmuir and Freundlich model equations are commonly used to describe the adsorption isotherms in water and wastewater treatment.12 From the adsorption isotherm data, the adsorption capacity or the amount of adsorbent required to remove a pollutant can be obtained. Langmuir and Freundlich data fitting were performed by linearization of eqn (4) and (5), respectively:12| |
 | (4) |
| |
 | (5) |
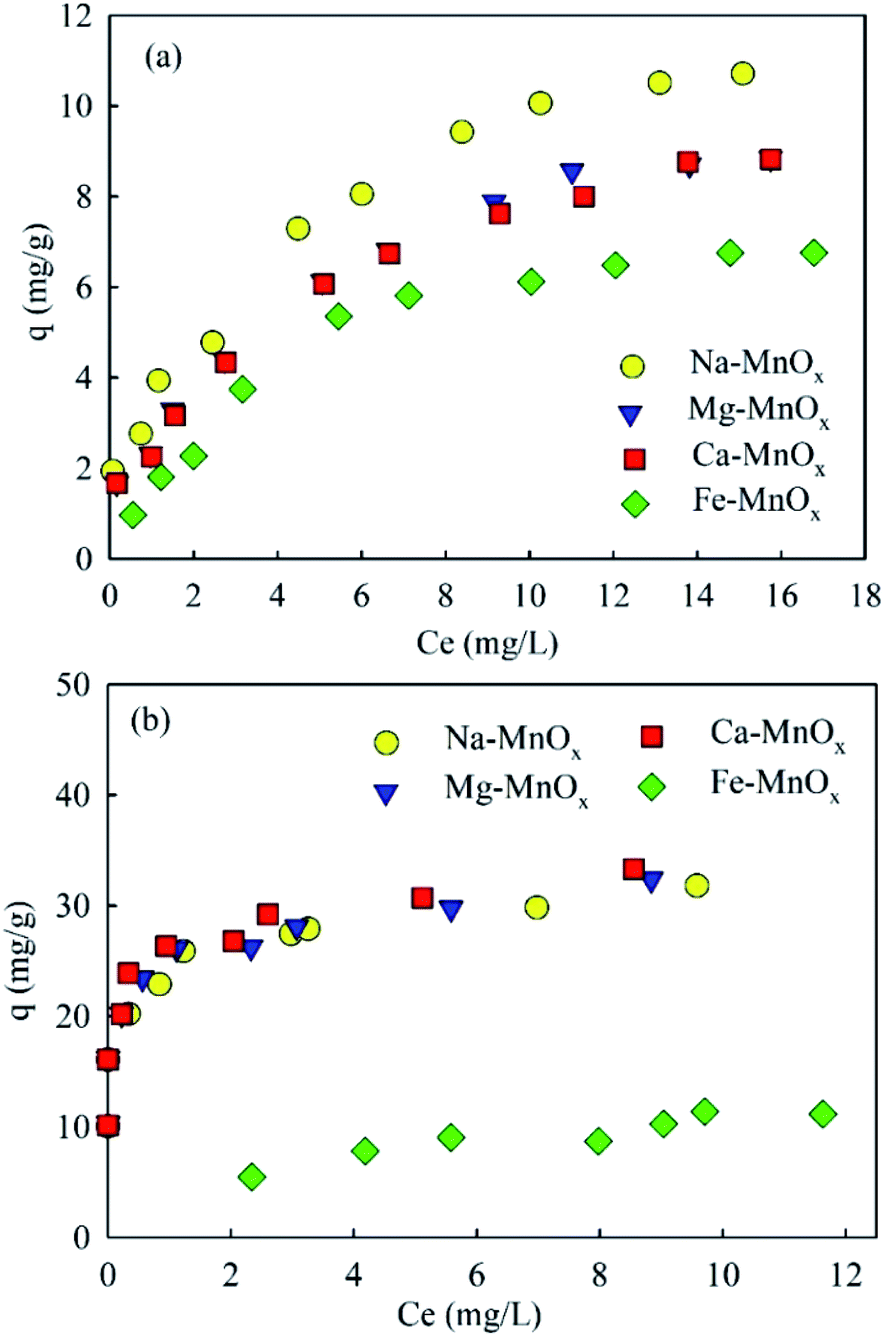
where qe (mg g−1) is the equilibrium adsorption capacity, Ce (mg L−1) is the concentration at equilibrium, qmax (mg Mn2+/NH4+–N g−1) is the maximum adsorption capacity, K (L mg−1 Mn2+/NH4+–N) is the equilibrium constant, KF (mg Mn2+/NH4+–N g−1 (L mg−1 Mn2+/NH4+–N)1/n) is the Freundlich capacity factor, and 1/n is the Freundlich intensity parameter.12,35The adsorption isotherms of the four oxides are shown in Fig. 2. This showed that the performance of Fe–MnOx was much lower than that of other oxides, especially for manganese removal. The calculated Langmuir and Freundlich parameters related to the adsorption of NH4+ and Mn2+ are presented in Table 1 and Table 2, respectively. This indicated that both the adsorption process simultaneously fitted the Langmuir and Freundlich model equations well, but the correlation coefficient (R2) of the Langmuir model equation is higher. According to the Langmuir model, these adsorption processes are preferred for monolayer adsorption.36
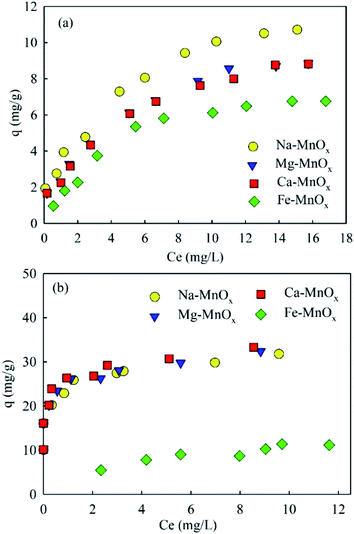 |
| | Fig. 2 Ammonium and manganese adsorption isotherms (initial pH for ammonium solution was about 5.0, for manganese was approximately 6.1, adsorbent dose = 0.5 g L−1). | |
Table 1 Parameters of adsorption isotherms of NH4+ adsorption onto MnOx
| Samples |
Langmuir model |
Freundlich model |
| qmax |
k |
R2 |
Kf |
1/n |
R2 |
| Na–MnOx |
12.21 |
0.43 |
0.972 |
4.06 |
0.35 |
0.946 |
| Mg–MnOx |
10.2 |
0.38 |
0.97 |
3.01 |
0.41 |
0.968 |
| Ca–MnOx |
10.1 |
0.36 |
0.967 |
2.93 |
0.41 |
0.962 |
| Fe–MnOx |
8.85 |
0.22 |
0.988 |
1.61 |
0.58 |
0.955 |
Table 2 Parameters of adsorption isotherms of Mn2+ adsorption onto MnOx
| Samples |
Langmuir model |
Freundlich model |
| qmax |
k |
R2 |
Kf |
1/n |
R2 |
| Na–MnOx |
31.55 |
4.53 |
0.997 |
23.2 |
0.12 |
0.946 |
| Mg–MnOx |
32.23 |
5.17 |
0.995 |
24.7 |
0.12 |
0.968 |
| Ca–MnOx |
33.33 |
6 |
0.996 |
25.6 |
0.12 |
0.937 |
| Fe–MnOx |
17.54 |
0.17 |
0.949 |
4.02 |
0.43 |
0.946 |
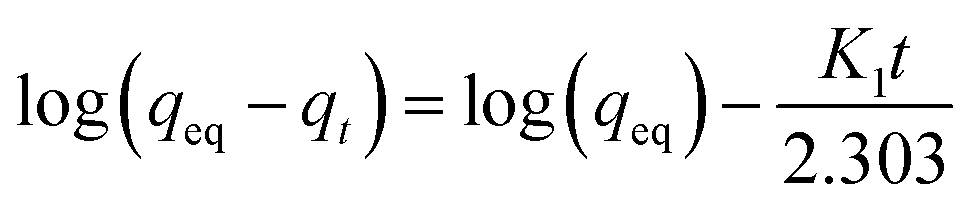
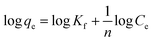
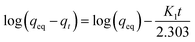
3.2.2 Adsorption kinetics. The adsorption kinetics of NH4+ and Mn2+ were evaluated using pseudo-first-order and pseudo-second-order kinetic models, respectively. The linear form of the pseudo-first-order kinetic model and pseudo-second-order kinetic model is represented by eqn (6) and (7), respectively:| |
 | (6) |
| |
 | (7) |
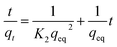
where qeq and qt are the amounts of NH4+ or Mn2+ adsorbed (mg g−1) at equilibrium and at time t, respectively; K1 is the Lagergren pseudo-first-order adsorption rate constant (min−1), and K2 is the pseudo-second-order adsorption rate constant (g mg−1 min−1).12,18The adsorption amounts as a function of time are shown in Fig. 3. This showed that the adsorption reaction proceeded rapidly, especially for manganese removal, which was almost complete in the first 10 min. The calculated parameters of the kinetic models are listed in Tables 3 and 4. This indicated that the kinetic processes of NH4+ and Mn2+ adsorption agreed well with the pseudo-second-order model. The correlation coefficient R2 was 0.999, and the fitted qeq approximated the data obtained in the experiment. It appears that the rate-limiting stage in this process could be the chemical adsorption involving valence forces through sharing or exchange of electrons between adsorbent and adsorbate, based on the assumption of the pseudo-second-order model.12
 |
| | Fig. 3 Adsorption amounts as a function of time: (a) ammonium, (b) manganese (initial pH for ammonium solution was about 5.0, for manganese was approximately 6.1, adsorbent dose = 0.5 g L−1, initial ammonium = 10 mg L−1, initial manganese = 25 mg L−1). | |
Table 3 Kinetic constants of NH4+ adsorption onto Me–MnOx
| Samples |
Pseudo first-order model |
Pseudo second-order model |
| K1 |
qeq |
R2 |
K2 |
qeq |
R2 |
| Na–MnOx |
0.056 |
4.29 |
0.888 |
0.055 |
9.26 |
0.999 |
| Mg–MnOx |
0.113 |
4.40 |
0.919 |
0.129 |
7.75 |
0.999 |
| Ca–MnOx |
0.058 |
3.09 |
0.818 |
0.083 |
7.75 |
0.999 |
| Fe–MnOx |
0.037 |
3.08 |
0.793 |
0.048 |
6.49 |
0.999 |
Table 4 Kinetic constants of Mn2+ adsorption onto Me–MnOx
| Samples |
Pseudo first-order model |
Pseudo second-order model |
| K1 |
qeq |
R2 |
K2 |
qeq |
R2 |
| Na–MnOx |
0.164 |
9.77 |
0.654 |
0.020 |
32.26 |
0.999 |
| Mg–MnOx |
0.062 |
10.47 |
0.817 |
0.030 |
33.33 |
0.999 |
| Ca–MnOx |
0.058 |
4.90 |
0.536 |
0.078 |
33.33 |
0.999 |
| Fe–MnOx |
0.060 |
7.23 |
0.908 |
0.032 |
14.49 |
0.999 |
3.2.3 Effect of pH. The adsorption capacity was studied as a function of pH (Fig. 4a). It showed that the adsorption amount of ammonium and manganese increased with the increasing pH. This can be explained by the increased zeta potential and catalytic activity of the oxides, which is significantly influenced by the pH of the aqueous solution.20,29 However, when the pH increased to 8.0, the adsorption amount of ammonium decreased. This behavior can be explained by the fact that more NH4+ could be converted into NH3 species at a pH above 8.0. Similar results have been reported previously for the layer-structured birnessite.15 Moreover, Fig. 4b shows that when the pH was as low as 2, Mn2+ could still be removed. This indicated that Mn in the oxides would not be leached out when the pH was higher than 2.0.
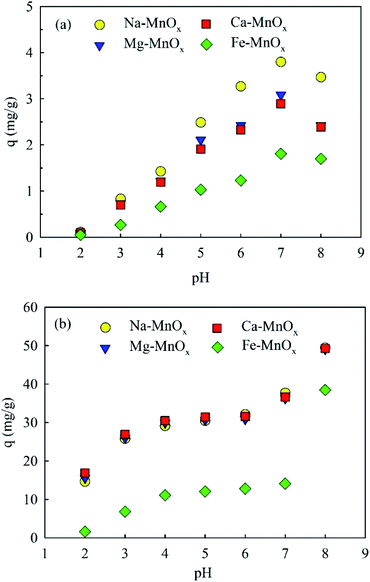 |
| | Fig. 4 Effect of pH on (a) ammonium and (b) manganese removal (adsorbent dose = 0.5 g L−1, temperature = 25 °C, initial ammonium = 2 mg L−1, initial manganese = 25 mg L−1). | |
3.2.4 Simultaneous removal of ammonium and manganese. Fig. 5 shows the results of the simultaneous removal of ammonium and manganese. It showed that an increased initial concentration of Mn2+or NH4+ could decrease the adsorption amounts of the other ions. This means that the removal processes of these two ions compete with each other. However, a maximum removal capacity of ammonium was also observed at 5 mg L−1, which suggested that a low concentration of Mn2+ may promote NH4+ removal. It appears that the adsorption sites are relatively adequate at lower concentrations of Mn2+, and when the adsorbed Mn2+ is oxidized, it may provide new active sites for ammonium removal. The changes of pH in these experiments are shown in Fig. S1.† In the experiment of ammonium removal at different concentration of Mn2+, the final pH decreased with the increase of the initial concentration of Mn2+. The final pH decreased from 7.49–7.75 (initial Mn2+ = 0 mg L−1) to 5.55–5.65 (initial Mn2+ = 25 mg L−1). In the experiment of Mn2+ removal at different concentration of NH4+, the final pH increased with the increase of the concentration of NH4+. The final pH increased from 5.48–5.57 (initial NH4+ = 0 mg L−1) to 5.68–5.82 (initial NH4+ = 15 mg L−1). The corresponding mechanism is clarified in Section 3.3.3.
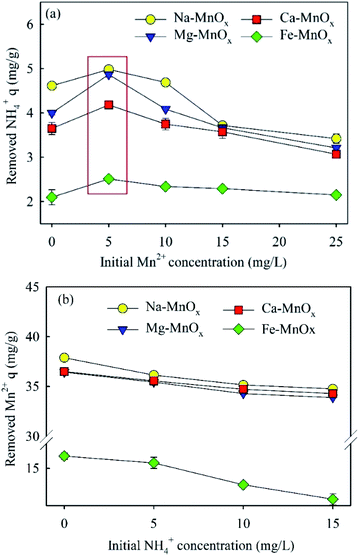 |
| | Fig. 5 Performance of the simultaneous removal of ammonium and manganese: (a) ammonium (5 mg L−1) removal at different initial Mn2+ concentration; (b) manganese (25 mg L−1) removal at different NH4+ concentration (initial pH was approximately 7.0, adsorbent dose = 0.5 g L−1). | |
3.2.5 Effects of the competent cations present in water. In the treatment of water source, Na+, Mg2+ and Ca2+ may affect the removal of NH4+ and Mn2+.15,37 In Fig. S2,† it indicates that Na+, Mg2+ and Ca2+ in water have some adverse effects on the adsorption of manganese. The adsorption capacity of Mn2+ decreased with the increase of the concentration of Na+, Mg2+ and Ca2+ in water. However, the impact is not significant. The maximum decrease of the adsorption capacity in the four oxides was from 32.7 mg g−1 to 29.50 mg g−1 (the effect of Mg2+ on the Mn2+ removal of Na–MnOx). Different form the removal of manganese, the adsorption capacity of ammonium decreased obviously with the increase of the concentration of Na+, Mg2+ and Ca2+ in water (Fig. S3†). The maximum decrease of the adsorption capacity in the four oxides was from 2.00 mg g−1 to 0.89 mg g−1 and the adsorption capacity decreased by 55.5% (the effect of Mg2+ on the NH4+ removal of Ca–MnOx). It shows that as a monovalent cation, the removal of NH4+ is more easily disturbed by other ions in water. In addition, Mg2+ has the most significant interference on the removal of ammonium and manganese. It may because of that Mg2+ has smaller radius than Ca2+, which results in the stronger electrostatic attraction with MnOx. Similar results were also found in previous study for the investigation of Na-rich birnessite. Researchers found that Mg2+ could increase the surface zeta potential of MnOx and weaken its surface electronegativity more obviously than Ca2+ and Na+ 15.
3.2.6 Comparation the adsorption capacity with other adsorbents. Table 5 shows the adsorption capacity of some commonly used adsorbents. It indicates that the maximum adsorption capacity of ammonium of akhtenskites is higher than biochar, commercial activated carbon, δ-MnO2 Coated Zeolite, Greensand and the maximum adsorption capacity of Mn2+ is higher than greensand, Fe and Mn oxide-coated sand and manganese oxide coated zeolite. Consequently, akhtenskites synthesized in this study are promising adsorbents.
Table 5 The maximum adsorption capacity of some commonly used adsorbents for NH4+ and Mn2+ removal
| Adsorbent |
Capacity (mg L−1) |
Reference |
| Ammonium |
Manganese |
| Biochar |
5.86 |
Not mentioned |
38 |
| Commercial activated carbon |
0.5 |
Not mentioned |
39 |
| NaOH treated corncob activated carbon |
17.03 |
Not mentioned |
40 |
| δ-MnO2 coated zeolite |
7.64 |
23.6 |
41 |
| Greensand |
2.53 |
11.29 |
42 |
| Na-rich birnessite |
22.61 |
Not mentioned |
15 |
| Fe and Mn oxide-coated sand |
Not mentioned |
2.617 |
43 |
| Manganese oxide coated zeolite |
Not mentioned |
1.123 |
12 |
| Synthetic manganese oxides |
25.77–28.90 |
Not mentioned |
37 |
| Synthesized akhtenskites |
8.85–12.21 |
17.54–33.3 |
This study |
3.3 Evaluation of removal mechanism
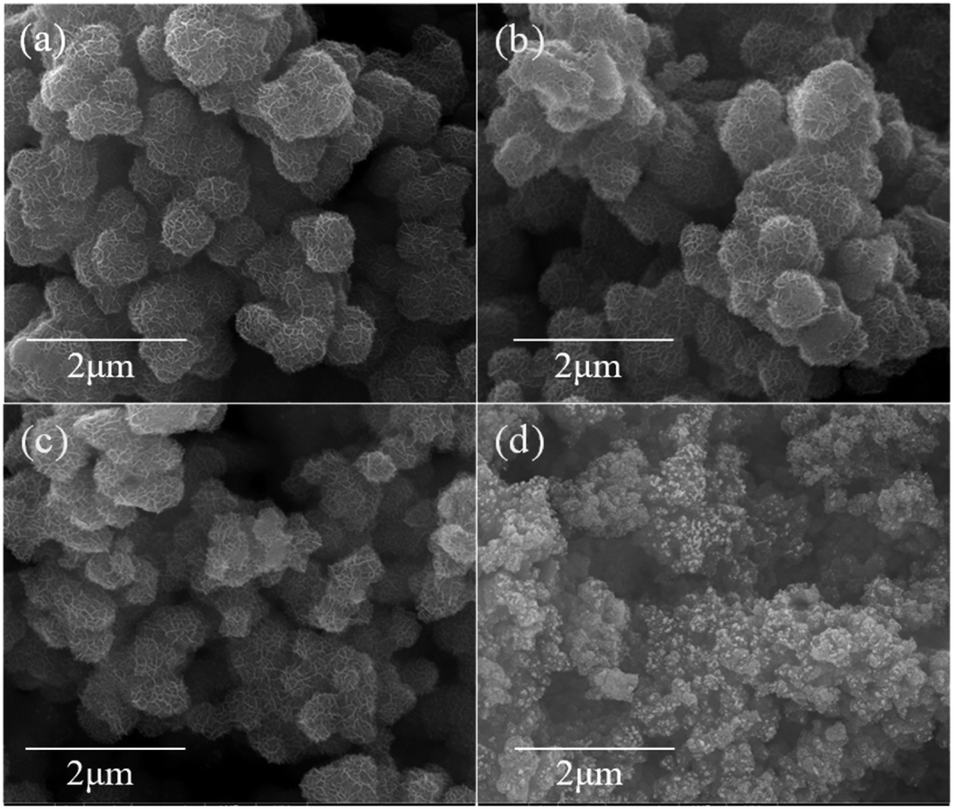
3.3.1 Morphology and specific surface area. SEM images of the four oxides are shown in Fig. 6. This figure indicates that Na–, Mg–, and Ca–MnOx consist of spherical particles with pores like a honeycomb or sponge. However, the morphology of Fe–MnOx was noticeably different, consisting of fine particles. This indicates that structural cations could significantly affect the morphology of manganese oxides. The specific surface area (SSA) and pore properties of the oxides are listed in Table 6. It showed that all the oxides had a high SSA, and that of Fe–MnOx was the largest. These results differ from those of a previous report on layer-structured birnessite, in which Fe–MnOx had the minimum specific surface area.25 However, as shown in Fig. 2–5, the capability of Fe–MnOx was the lowest, although it had the largest SSA and finer particles. It can be derived that the SSA and diameter of the particle are not the most important factors for determining the activity of the oxides. Moreover, it is assumed that zeta potential may be a more important factor, which can affect the removal capability of MnOx. Further discussion is processed in Section 3.3.2.
 |
| | Fig. 6 SEM images of manganese oxides (500![[thin space (1/6-em)]](https://www.rsc.org/images/entities/char_2009.gif) 00×): (a) Na–MnOx, (b) Mg–MnOx, (c) Ca–MnOx, (d) Fe–MnOx. 00×): (a) Na–MnOx, (b) Mg–MnOx, (c) Ca–MnOx, (d) Fe–MnOx. | |
Table 6 Specific surface area (SSA) and pore properties of the oxides
| Samples |
SBET (m2 g−1) |
Vpore (cm3 g−1) |
Dpore (Å) |
| Na–MnOx |
351.05 |
0.35 |
39.86 |
| Mg–MnOx |
368.93 |
0.39 |
41.92 |
| Ca–MnOx |
400.62 |
0.38 |
38.20 |
| Fe–MnOx |
416.86 |
0.57 |
54.92 |
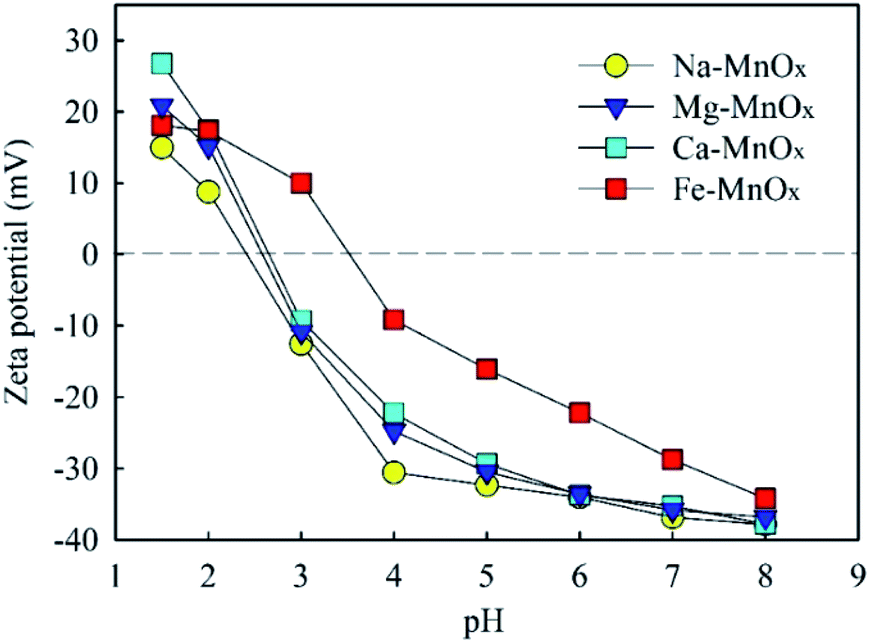
3.3.2 Zeta potential and pH changes in the removal process. To explore this mechanism further, the zeta potential of manganese oxide was measured (Fig. 7). This indicated that the point of zero charge (PZC) of Na–, Mg–, and Ca–MnOx were observed at pH = 2.4–2.7, and that of Fe–MnOx was measured at pH = 3.5. The results suggested that Fe could increase the PZC of akhtenskite. The adsorption ability of manganese oxide depends on its surface charges to a certain extent.15 When the pH value is higher than that of PZC, the surface of manganese oxides is negatively charged. It can effectively adsorb NH4+ and Mn2+ by electrostatic interactions. Moreover, the amount of negative charge increases with increasing pH. Therefore, this can explain the result of Fig. 4, in which a higher pH corresponds to a higher removal activity. Moreover, the lower removal performance of Fe–MnOx (Fig. 2–5) could be attributed to the higher zeta potential at pH 2–8, although it had the largest specific surface area (SSA) (Table 6). This indicates that the zeta potential was a more critical factor than SSA to influence the removal activity of manganese oxides. Further, at lower pH, negative charges on the surface of the oxides were less, which weakened the affinity towards NH4+ and Mn2+. In addition, increased H+ content at lower pH would intensify competition for adsorption sites.12,15
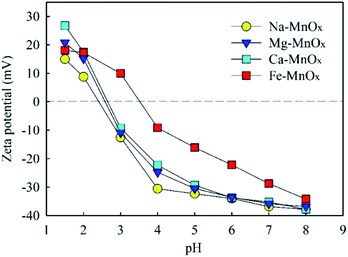 |
| | Fig. 7 Zeta potential of manganese oxide as a function of pH. | |
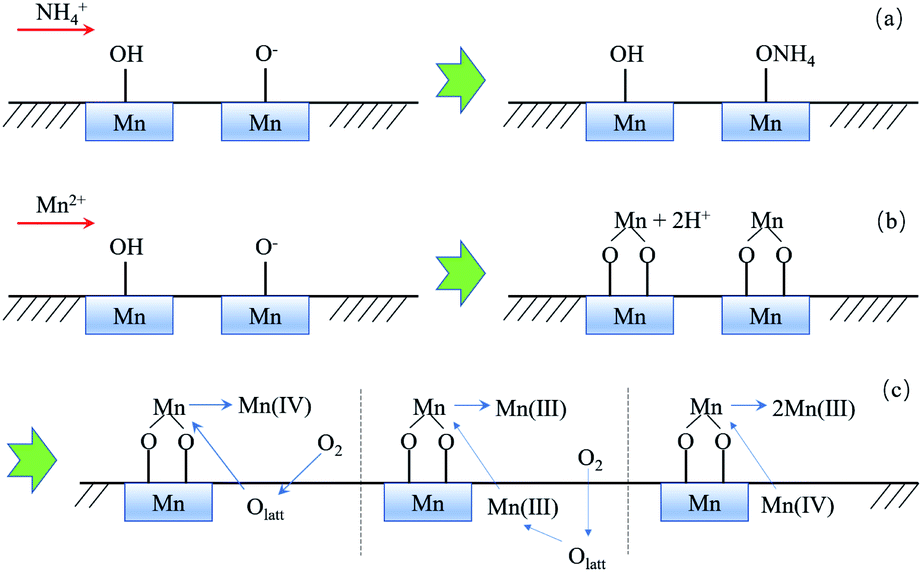
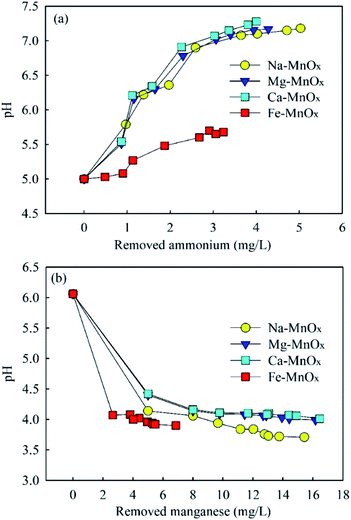
3.3.3 Removal mechanism of adsorption process. Previous research has shown that hydroxyl groups on the surface of manganese oxides are critical for their adsorption capability.12,44 In aqueous systems, metal oxides have surface hydroxyl groups that have acidic and basic characteristics simultaneously.12 When the solution pH is higher than the pH of the PZC, part of the surface hydroxyl groups on manganese oxides (Mn–OH) would change to Mn–O−, and the surface of the oxides was negatively charged.45 It is assumed that NH4+ was mainly adsorbed onto Mn–O−, which is a Brønsted base. When NH4+ was adsorbed, the reaction for NH4+ to NH3 was limited. As a result, the pH of the reaction solution increased. The surface reactions of divalent ions with metal oxide surfaces have been described as the free metal ions exchanged with the H in Mn–OH and formation a hydrolysis complex or abidendate complex.12 Unlike the removal of NH4+, it can be assumed that Mn2+ could also be removed by replacing the H in Mn–OH groups. Thus, the pH of the reaction solution decreased with the removal of Mn2+. This hypothesis could be supported by the change in pH in these experiments (Fig. 8). It indicated that pH increased in ammonium removal but decreased in Mn2+ removal. The relevant reactions are summarized as follows: | | |
Mn–O− + NH4+ ↔ Mn–ONH4
| (8) |
| | |
2Mn–O− + Mn2+ ↔ 2Mn–OMn
| (9) |
| | |
2Mn–OH + Mn2+ ↔ 2Mn–OMn + 2H+
| (10) |
 |
| | Fig. 8 The changes of pH in (a) ammonium and (b) manganese removal (initial ammonium = 2.0–15.0 mg L−1, initial manganese = 5.0–25.0 mg L−1). | |
This conclusion is also supported by the results of Fig. 4. When pH = 2, at which the hydroxyl group existed as Mn–OH, Mn2+ could still be removed significantly, but ammonium was hardly removed.
3.3.4 Possible catalytic oxidation activity of the oxides. Some layer-structured manganese oxides have been reported to remove ammonium and manganese from water by catalytic oxidation.9,10 In this study, the possible chemical catalytic oxidation capacity of tunnel-structured akhtenskite was also investigated.Nitrate and nitrite were measured in the ammonium removal experiment to explore the possible catalytic oxidation of ammonium. The results showed that when ammonium was removed from water, almost no nitrate or nitrite was detected. Therefore, ammonium was merely removed by adsorption. In previous study, researchers also found that Na-rich birnessite synthesized in laboratory, which is layered structure, also removed ammonium just by electrostatic adsorption.15
The absorbed and oxidized Mn2+ in the experiment were measured and calculated, respectively. The results are shown in Fig. 9. This indicated that the akhtenskites could also remove Mn2+ by catalytic oxidation. Previous studies suggested that the catalytic oxidation of Mn2+ by MnOx should be a self-catalytic oxidation reaction.19,46 In this reaction, MnOx is not only the catalyst but also the product. The reaction process can be described by the following equation:
| | |
2Mn–OMn + nO2 → 2Mn–O− + MnOx
| (11) |
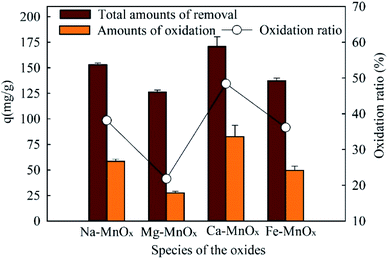 |
| | Fig. 9 Amount of oxidized Mn2+ in manganese removal by the oxides (dose = 0.07 g L−1, with 200 mg L−1 NaHCO3, initial pH = 8.25, manganese = 50 mg L−1, reaction time = 600 min). | |
As a result, MnOx is not consumed but produced, so the catalytic reaction can continuouly proceed. In addition, Ca– and Mg–MnOx had the highest and lowest catalytic capacities, respectively. This result is significantly different from the experimental results in Fig. 2–5, in which the activity of Fe–MnOx was the worst. It has been proven that the catalytic oxidation rates of Mn2+ are limited by alkalinity and pH.29 In this study, when 200 mg L−1 NaHCO3 was added, the oxidation rate was intensified. Moreover, as shown in Fig. 7, when the pH increased to approximately 8, the zeta potential difference between Fe–MnOx and other oxides was reduced significantly. Therefore, a higher activity of Fe–MnOx was observed in this stage.
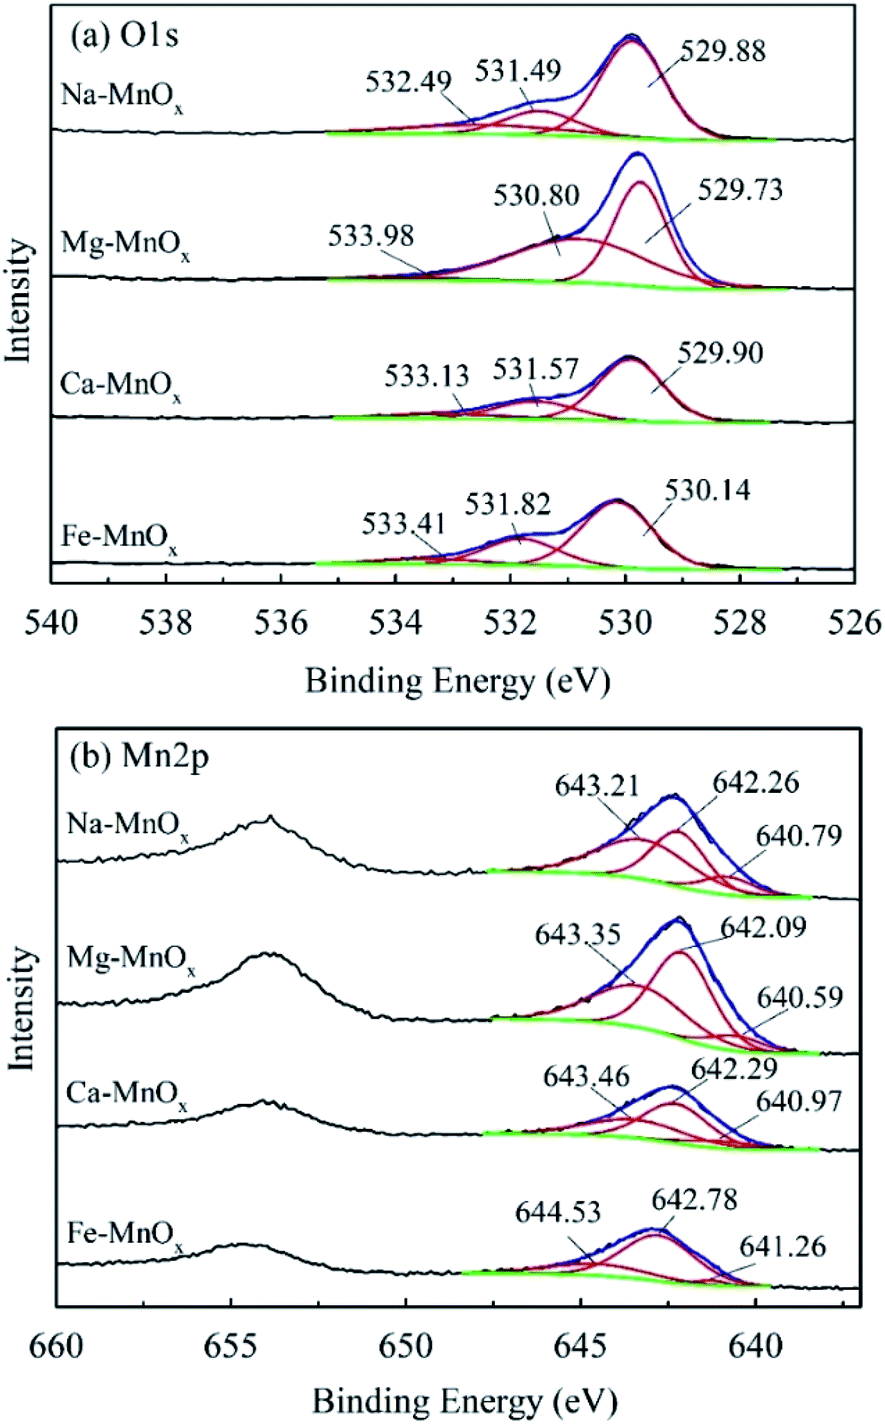
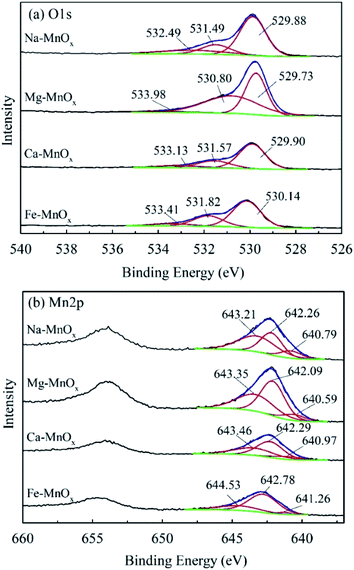
To investigate the manganese oxidation mechanism, XPS profiles were used to identify the species and chemical states of O and Mn present in manganese oxides (Fig. 10). This shows that the O1s spectra could be fitted to three peaks, representing different oxygen species (Fig. 10a). The peaks located at 529.73–530.14, 530.80–531.82, and 532.49–533.41 eV could be attributed to lattice oxygen bonding with Mn (Olatt), adsorption of oxygen species (Oads), and oxygen in surface residual water (Os), respectively.21,25 Olatt can participate in the oxidation of Mn(II) to Mn(IV), and a higher concentration is favorable for Mn removal.21 The atomic percentages of different species of O and Mn are shown in Table 7. It shows that the composition of Mn in different species on the surface of Ca– and Mg–MnOx is almost the same. However, the proportion of Olatt on the surface of Ca–MnOx is up to 67.2%, which is 44.83% higher than the proportion of Mg–MnOx (Table 7). In addition, Ca– and Mg–MnOx have the highest and lowest catalytic capacity, respectively (Fig. 9). Consequently, a higher concentration of surface Olatt is favorable for the oxidation of Mn2+. Lattice oxygen has stronger binding force with Mn(II) than the oxygen in water. It can react with Mn(II) to form new MnOx. When the lattice oxygen is consumed it will be reformed by O2 in water. Similar conclusion had been derived in a manganese oxides filter for the removal of manganese from groundwater.21 Moreover, it appears that Mg2+ is unfavorable for the formation of Olatt in manganese oxide, and the lower Olatt content may be the main factor that lowers the catalytic oxidation capability of Mg–MnOx. However, further studies should be performed to explore how Mg2+ can influence the content of Olatt in manganese oxides.
 |
| | Fig. 10 XPS profiles of O1s and Mn2p in manganese oxides: (a) O1s, (b) Mn2p. | |
Table 7 Atomic percentage of different species of O and Mn in manganese oxides
| Species of the oxides |
Species of O (%) |
Species of Mn (%) |
| Olatt |
Oad |
Os |
IV |
III |
II |
| Na–MnOx |
65.8 |
18.1 |
16.1 |
48.9 |
38.9 |
12.8 |
| Mg–MnOx |
46.4 |
50.4 |
3.3 |
39.5 |
52.2 |
8.4 |
| Ca–MnOx |
67.2 |
23.9 |
8.9 |
37.6 |
52.8 |
9.6 |
| Fe–MnOx |
64.6 |
27.3 |
8.0 |
25.1 |
71.5 |
3.4 |
Fig. 10b shows that the manganese spectra can also be fitted to three different species. The peaks located at 643.35–644.53, 642.09–642.78, and 640.59–641.26 can be assigned to Mn(IV), Mn(III), and Mn(II), respectively, according to the references in the NIST X-ray Photoelectron Spectroscopy Database. Table 7 shows that the percentage of Mn(III) was the lowest in the monovalent cation doping oxide Na–MnOx, middle in the divalent cation doping oxides Mg– and Ca–MnOx and the highest in the trivalent cation doping oxide Fe–MnOx. This indicates that higher valence cations can induce the formation of more Mn(III) in manganese oxides. Metal cations inside the crystal tunnels can stabilize the negative charge balance originating from Mn(III) in an otherwise perfect Mn(IV)O2 structure.34 This may be because higher valence ions can balance more negative charges in manganese oxides.
Moreover, Mn(III) is also an important factor affecting the catalytic activity of manganese oxides.47,48 Previous research indicated that the superior oxidizing capacity of active MnOx might arise from the higher Mn(III) content in MnOx.10,22 Mn2+ may be removed via Mn(III) in the following steps: (1) Mn2+ was oxidized by Mn(III) and Mn(III) transferred to Mn(II); (2) Mn(II) was oxidized to Mn(III) by Olatt; (3) O2 in the solution (O2(aq)) transferred to Olatt. In this reaction, Mn(III) was used as a catalyst.
In addition, the Mn(III) content in Fe–MnOx was the highest, reaching 71.47%. However, its catalytic activity is lower than that of Na–MnOx and Ca–MnOx. The reported Mn(III) content of high-activity manganese oxides is commonly 48.4–57.8%.10,21 It appears that the high proportion of Mn(III) may not be the best. This may be because of Mn(IV) and vacancy defect in the oxide. The XRD analysis showed that all four MnOx had poor crystallinity (Fig. 1), which commonly has a high vacancy defect content.49 It has been reported that vacancies can act as the active site absorbing Mn2+ and the adsorbed Mn2+ could be oxidized by Mn(IV) to form Mn(III).21 Therefore, the appropriate Mn(III) content should be dependent on the oxidation rate of Mn2+ by different chemical catalytic pathways, which requires further investigation.
To verify these conclusions further, the XPS spectra of the oxides after the reaction of Mn2+ removal was detected and shown in Fig. S4.† Different from the results before the reaction, O1s spectra of the oxides after the reaction can only be fitted as two species: Olatt and Oad, and OS was not detected (Fig. S4a†). In addition, the binding energies of different O species decreased. The binding energy of the Olatt was 529.55–529.60 eV and the binding energy of Oad was 531.07–531.12 eV. Fig. S4b† shows the Mn2p spectra of the oxides. The binding energies of Mn also decreased after the reaction. According to the fitting results of the Mn2p3/2 orbit, Mn can still be fitted into three mixed components. The binding energies at 642.89–643.01 eV, 641.82–641.85 eV and 640.62–640.85 eV represent Mn(IV), Mn(III) and Mn(II) respectively.
Table S1† is the proportion of different species of O and Mn after the reaction. It can be seen that after the reaction, the proportion of Mn(III) (except Fe–MnOx) and Mn(IV) on the surface of the oxides after reaction decreased significantly, while the proportion of Mn(II) increased. The main reason for the increase proportion of Mn(II) is that the removed Mn2+ is just partially oxidized probably. There is a good corresponding relationship between the proportion of Mn(II) and the oxidation rates of Mn2+ showed in Fig. 9. While the catalytic efficiency is low, the proportion of Mn(II) on the surface of the oxides is high. The proportion of Mn(II) on the surface of Mg–MnOx and Ca–MnOx is the highest (31.84%) and the lowest (21.83%), respectively. It indicates that the Mn2+ oxidation rate of Mg–MnOx is the lowest, and the Mn2+ oxidation rate of Ca–MnOx to is the highest. This conclusion is consistent with the results in Fig. 9.
Further, the ratios of Mn(IV):Mn(III) before the Mn2+ removal reaction are 1.25, 0.76, 0.71 and 0.35 respectively. After the reaction these values are 0.74, 0.85, 0.70 and 1.00, respectively. It shows that Mn(IV):Mn(III) of Ca–MnOx is almost unchanged, indicating that its structure is relatively stable. The increased ratio of Mn(IV):Mn(III) of Fe–MnOx indicates that Mn(IV) is formed in Mn2+ removal process. The relative ratios of Na–MnOx decreased. It can be derived that Mn(IV) is consumed or Mn(III) is formed in Mn2+ removal. These changes further show that the catalytic oxidation process of Mn2+ is related to the content of Mn(IV) and Mn(III) in the oxides.
In addition, the lattice oxygen ratio on the oxide surface decreased and the proportion of adsorbed oxygen on the oxide surface increased obviously. No OS was detected, indicating that the adsorption capability of water of the oxides weakened after the reaction. This may be related to the increase of Mn(II). The decrease of Olatt content can be attributed to the consumption of Olatt and the decrease of Mn(III) and Mn(IV) content. This further verifies that surface Olatt plays an important role in the removal of Mn2+.
In summary, Ca–MnOx had a higher lattice oxygen concentration, more suitable Mn(III) content, and lower zeta potential. These features may be responsible for its higher catalytic oxidation ability. In previous studies, it was thought that Ca had an important effect on the catalytic activity of manganese oxides.22,50,51 However, the underlying mechanism is not clear. The experimental results of this study may provide new insights into this question.
3.3.5 Summary of the probable removal mechanism. Based on the analysis of the above experimental results, the removal mechanism of ammonium and manganese can be summarized in Fig. 11. Ammonium is merely removed by electrostatic adsorption with Mn–O− (Fig. 11a), while Mn2+ can be removed by ion exchange with Mn–OH and directly absorbed by Mn–O− simultaneously (Fig. 11b). Moreover, absorbed Mn2+ can be further catalytically oxidized by three possible pathways (Fig. 11c): (1) being oxidized to Mn(IV) by lattice oxygen directly, and the consumed Olatt would be reformed by O2 in water; (2) being oxidized by Mn(III) and Olatt as the final electron acceptor, Olatt would also be consumed and reformed by O2 in water; (3) transferring into Mn(III) via a comproportionation reaction with Mn(IV). The newly formed oxide is coated on the original oxide surface and produces new surface hydroxyl groups and new lattice oxygen for continuing the removal of ammonium and manganese.
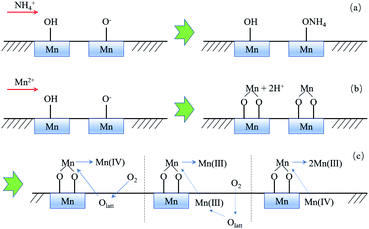 |
| | Fig. 11 Removal mechanism of NH4+ (a) and Mn2+ via MnOx (b, c). | |
4 Conclusion
In this study, four akhtenskites with different structure cations (Na+, Mg2+, Ca2+, Fe3+) were successfully synthesized. The experimental results indicated that the tunnel-structured akhtenskite could remove ammonium and manganese effectively, and the removal performance was significantly affected by pH. NH4+ was removed by electrostatic adsorption via Mn–O−. Mn2+ could be adsorbed by electrostatic adsorption and ion exchange with Mn–OH simultaneously, and then part of the adsorbed Mn2+ could be oxidized catalytically. The structure cations can significantly affect the properties and removal performance of akhtenskite. Higher valence ions can result in higher Mn(III) content in the synthesized manganese oxide. Mg2+ reduced the proportion of lattice oxygen in the oxide, and Fe3+ can increase the zeta potential of the oxides. Both of them are unfavorable for the oxidation of Mn2+, although Fe3+ could also increase the specific area of the oxides. Ca–MnOx had the optimal removal performance in the catalytic oxidation of Mn2+, which could be attributed to the higher Olatt content, appropriate percentage of and Mn(III), and lower zeta potential. In summary, the synthesized akhtenskites (especially the Ca–MnOx) are promising adsorbents for the removal of ammonium and manganese from water; in future, researchers can continually explore the regeneration process or strengthen the catalytic capability to further improve the removal capacity and service life of MnOx.
Author contributions
Ruifeng Zhang, Shilian Yang, Chuan Dong, Yu Qiao, Jianmin Zhang, Yingming Guo work together. Specifically, Ruifeng Zhang was responsible for funding acquisition, data curation and writing; Shilian Yang, Chuan Dong, Yu Qiao were responsible for data curation, investigation and methodology; Jianmin Zhang and Yingming Guo were responsible for data curation and project administration.
Conflicts of interest
There are no conflicts to declare.
Acknowledgements
This work was supported by the Natural Science Basic Research Plan in Shaanxi Province of China (2021JQ-688), and Scientific Research Program Funded by Shaanxi Provincial Education Department, China (No.20JK0656).
Notes and references
- Ministry of Ecology and Environment of China, available online: http://www.mee.gov.cn/home/jrtt_1/201905/t20190529_704841.shtml, 2019..
- J. E. Tobiason, A. Bazilio, J. Goodwill, X. Mai and C. Nguyen, Curr. Pollut. Rep., 2016, 2, 168–177 CrossRef CAS.
- A. C. Diehl, G. E. Speitel Jr, J. M. Symons and S. W. Krasner, Am. Water Works Assoc., J., 2000, 92, 76 CrossRef CAS.
- M. T. Lipponen, M. H. Suutari and P. J. Martikainen, Water Res., 2002, 36, 4319–4329 CrossRef CAS PubMed.
- A. G. Tekerlekopoulou, S. Pavlou and D. V. Vayenas, J. Chem. Technol. Biotechnol., 2013, 88, 751–773 CrossRef CAS.
- D. Zhang, W. Li, X. Huang, Q. Wen and L. Miao, Bioresour. Technol., 2013, 137, 147–152 CrossRef CAS PubMed.
- F. B. Wagner, P. B. Nielsen, R. Boehansen and H. J. Albrechtsen, Water Res., 2016, 95, 280–288 CrossRef CAS PubMed.
- H. Huang, H. Zhu, W. Gan, X. Chen and X. Yang, Chemosphere, 2017, 188, 257–264 CrossRef CAS PubMed.
- Y. Guo, T. Huang, G. Wen and X. Cao, Chem. Eng. J., 2017, 308, 322–329 CrossRef CAS.
- Y. Cheng, T. Huang, Y. Sun and X. Shi, Chem. Eng. J., 2017, 322, 82–89 CrossRef CAS.
- J. Huang, N. R. Kankanamge, C. Chow, D. T. Welsh, T. Li and P. R. Teasdale, J. Environ. Sci., 2018, 63, 174–197 CrossRef PubMed.
- S. R. Taffarel and J. Rubio, Miner. Eng., 2010, 23, 1131–1138 CrossRef CAS.
- S.-H. Pak, C.-G. Park, G. N. Kang and Y.-h. Kim, Desalin. Water Treat., 2018, 123, 203–210 CrossRef CAS.
- H. Jia, J. Liu, S. Zhong, F. Zhang, Z. Xu, X. Gong and C. Lu, J. Chem. Technol. Biotechnol., 2015, 90, 1727–1734 CrossRef CAS.
- Y. Cheng, T. Huang, X. Shi, G. Wen and Y. Sun, J. Environ. Sci., 2017, 57, 402–410 CrossRef CAS PubMed.
- J. E. Post, Proc. Natl. Acad. Sci. U. S. A., 1999, 96, 3447–3454 CrossRef CAS PubMed.
- C. M. Santelli, S. M. Webb, A. C. Dohnalkova and C. M. Hansel, Geochim. Cosmochim. Acta, 2011, 75, 2762–2776 CrossRef CAS.
- C. C. Kan, M. C. Aganon, C. M. Futalan and M. L. Dalida, J. Environ. Sci., 2013, 25, 1483–1491 CrossRef CAS.
- D. M. Sahabi, M. Takeda, I. Suzuki and J.-i. Koizumi, J. Biosci. Bioeng., 2009, 107, 151–157 CrossRef CAS PubMed.
- H. Yang, Z. Yan, X. Du, L. Bai, H. Yu, A. Ding, G. Li, H. Liang and T. M. Aminabhavi, Chem. Eng. J., 2020, 382, 123033 CrossRef CAS.
- Y. Cheng, T. Huang, C. Liu and S. Zhang, Chem. Eng. J., 2019, 371, 88–95 CrossRef CAS.
- Y. Cheng, Y. Li, T. Huang, Y. Sun, X. Shi and Y. Shao, J. Environ. Sci., 2018, 65, 327–334 CrossRef PubMed.
- J. H. Bruins, B. Petrusevski, Y. M. Slokar, K. Huysman, K. Joris, J. C. Kruithof and M. D. Kennedy, Water Res., 2015, 69, 154–161 CrossRef CAS PubMed.
- S. Namgung, C.-M. Chon and L. Giehyeon, Geosci. J., 2018, 22, 373–381 CrossRef CAS.
- J. Wang, D. Li, P. Li, P. Zhang, Q. Xu and J. Yu, RSC Adv., 2015, 5, 100434–100442 RSC.
- M. I. Said, J. Alloys Compd., 2019, 152976 Search PubMed.
- Y. J. Shih, R. L. Huang and Y. H. Huang, J. Cleaner Prod., 2015, 87, 897–905 CrossRef CAS.
- W. Xu, G. Lv, X. Xing, X. J. Zhang and G. S. Wang, Sci. Adv. Mater., 2016, 8, 966–971 CrossRef CAS.
- X. Tian, R. Zhang, T. Huang and G. Wen, J. Environ. Sci., 2019, 77, 349–356 Search PubMed.
- SEPA, Analytical Methods of Water and Wastewater, China Environmental Science Press, Beijing, China, 4th edn, 2002 Search PubMed.
- Y.-S. Ding, X.-F. Shen, S. Gomez, H. Luo and S. L. Suib, Adv. Funct. Mater., 2006, 16, 549–555 CrossRef CAS.
- Y. Liu, H. Wang, Y. Zhu, X. Wang, X. Liu, H. Li and Y. Qian, Solid State Commun., 2009, 149, 1514–1518 CrossRef CAS.
- Y. Yuan, K. He, B. W. Byles, C. Liu, K. Amine, J. Lu, E. Pomerantseva and R. Shahbazian-Yassar, Chem, 2019, 5, 1793–1805 CAS.
- R. Koivula, J. Pakarinen, M. Sivenius, K. Sirola, R. Harjula and E. Paatero, Sep. Purif. Technol., 2009, 70, 53–57 CrossRef CAS.
- N. Oeztuerk and T. E. Bektas, J. Hazard. Mater., 2004, 112, 155–162 CrossRef PubMed.
- Y. Zheng, J. Zhang and A. Wang, Chem. Eng. J., 2009, 155, 215–222 CrossRef CAS.
- L. Zhang, J. Wang, H. Qiao, F. Liu and Z. Fu, J. Cleaner Prod., 2020, 272, 123055 CrossRef CAS.
- X. Zheng, Y. Zhiman, X. Xiaohui, D. Meng and G. Rongbo, J. Chem. Technol. Biotechnol., 2018, 93, 198–206 CrossRef CAS.
- D. Carey, P. J. Mcnamara and D. H. Zitomer, Water Environ. Res., 2015, 87, 2098–2106 CrossRef CAS PubMed.
- T. V. Mai, H. P. Chao, T. V. Trinh, T. T. Le, C. C. Lin and N. T. Hai, J. Cleaner Prod., 2018, 180, 560–570 CrossRef.
- W. J. Ma, T. H. Chen, D. Chen, H. B. Liu and Y. Z. Zhang, Environ. Sci., 2019, 40, 4553–4561 Search PubMed.
- A. Mag, A. Sfmk, B. Apa, B. Basa and C. Aam, Journal of Water Process Engineering, 2020, 39, 101714 Search PubMed.
- C.-C. Kan, M. C. Aganon, C. M. Futalan and M. L. P. Dalida, J. Environ. Sci., 2013, 25, 1483–1491 CrossRef CAS.
- Z. W. Han R, Z. Zhang, J. Shi and J. Yang, J. Hazard. Mater., 2006, 137, 480–488 CrossRef PubMed.
- G. Fu, H. E. Allen and C. E. Cowan, Soil Sci., 1991, 152, 72–81 CrossRef CAS.
- J. Cerrato, W. Knocke, M. Hochella, A. M. Dietrich, A. Jones and T. Cromer, Environ. Sci. Technol., 2011, 45, 10068–10074 CrossRef CAS PubMed.
- M. A. Peluso, L. A. Gambaro, E. Pronsato, D. Gazzoli, H. J. Thomas and J. E. Sambeth, Catal. Today, 2008, 133, 487–492 CrossRef.
- G. Wu, Y. Gao, F. Ma, B. Zheng, L. Liu, H. Sun and W. Wu, Chem. Eng. J., 2015, 271, 14–22 CrossRef CAS.
- Y. Yang, J. Huang, S. Wang, S. Deng, B. Wang and G. Yu, Appl. Catal., B, 2013, 142–143, 567–568 Search PubMed.
- M. Wiechen, M. M. Najafpour, S. I. Allakhverdiev and L. Spiccia, Energy Environ. Sci., 2014, 7, 2203–2212 RSC.
- Z. I. Baktash E and M. Schröder, et al., Dalton Trans., 2013, 42, 16920–16929 RSC.
Footnote |
| † Electronic supplementary information (ESI) available. See DOI: 10.1039/d1ra06025b |
|
| This journal is © The Royal Society of Chemistry 2021 |
Click here to see how this site uses Cookies. View our privacy policy here. 
 Open Access Article
 This Open Access Article is licensed under a Creative Commons Attribution-Non Commercial 3.0 Unported Licence
 *,
Shilian Yang,
Chuan Dong,
Yu Qiao,
Jianmin Zhang and
Yingming Guo
*,
Shilian Yang,
Chuan Dong,
Yu Qiao,
Jianmin Zhang and
Yingming Guo