 Open Access Article
Tuning Brønsted and Lewis acidity on phosphated titanium dioxides for efficient conversion of glucose to 5-hydroxymethylfurfural†
Siripit Songtaweeab,
Bunyarat Rungtaweevoranit a,
Chalida Klaysombc and
Kajornsak Faungnawakij
 *a
*a
aNanoCatalysis and Molecular Simulation Research Group, National Nanotechnology Center (NANOTEC), National Science and Technology Development Agency (NSTDA), Pathumthani 12120, Thailand. E-mail: kajornsak@nanotec.or.th; Fax: +66 2 564 6981; Tel: +66 2 564 7100
bCenter of Excellence in Particle and Material Processing Technology, Department of Chemical Engineering, Faculty of Engineering, Chulalongkorn University, Bangkok, Thailand
cBio-Circular-Green Economy Technology & Engineering Center (BCGeTEC), Department of Chemical Engineering, Faculty of Engineering, Chulalongkorn University, Bangkok, Thailand
First published on 1st September 2021
Abstract
5-Hydroxymethylfurfural (HMF) derived from cellulosic sugars has become increasingly important as a platform chemical for the biorefinery industry because of its versatility in the conversion to other chemicals. Although HMF can be produced in high yield from fructose dehydration, fructose is rather expensive because it requires multiple processing steps. On the other hand, HMF can be produced directly from highly abundant glucose, which could reduce time and cost. However, an effective and multifunctional catalyst is needed to selectively promote the glucose-to-HMF reaction. In this work, we report a bifunctional phosphated titanium dioxide as an efficient catalyst for such a reaction. The best catalyst exhibits excellent catalytic performance for the glucose conversion to HMF with 72% yield and 83% selectivity in the biphasic system. We achieve this by tuning the solvent system, controlling the amount of Brønsted and Lewis acid sites on the catalyst, and modification of the reaction setup. From the analysis of acid sites, we found that the addition of phosphate group (Brønsted acid site) onto the surface of TiO2 (Lewis acid site) significantly enhanced the HMF yield and selectivity when the optimum ratio of Brønsted and Lewis acid sites is reached. The high catalytic activity, good reusability, and simple preparation method of the catalyst show a promise for the potential use of this catalytic system on an industrial scale.
1. Introduction
Effective production of 5-hydroxymethylfurfural (HMF) is one of the keys toward renewable chemical industry because HMF possesses various functionalities amenable for subsequent chemical conversion to manufacture various chemicals such as polymers, pharmaceuticals, and biofuels.1–3 To produce HMF, simple dehydration mediated by Brønsted acid catalysts can yield HMF in high yield.4–6 Due to the high cost of fructose, it is more desirable to synthesize HMF from highly available resources such as glucose, the most common monosaccharide unit found in cellulose.7–9 However, this process requires a catalytic system capable of performing (i) glucose isomerization to fructose catalyzed by a Lewis acid and (ii) fructose dehydration to HMF which is favored under Brønsted acid conditions.10–12 Consequently, the use of bifunctional solid catalysts, consisting of both Lewis and Brønsted acid sites, is an efficient approach to promote glucose conversion to HMF.11,13In this context, different metal phosphates were reported for catalyzing glucose to HMF in a biphasic system of water/methyl isobutyl ketone (MIBK), producing HMF selectivity range from 30% to 60% depending on the ratio of the Brønsted to Lewis acid sites.14 Yabushita and coworkers studied the glucose dehydration over a phosphate modified Zr-based metal–organic framework (MOF), NU-1000, and reported the HMF selectivity of 64% at 150 °C in a biphasic system of water/2-propanol.15 Fan et al. used a solid heteropolyacid salt (Ag3PW12O40) as a heterogeneous catalyst for the dehydration of glucose. They reported that the reaction carried out at 130 °C for 4 h can produce the HMF yield of 76% and selectivity of 85%.16 Several other bifunctional solid catalysts including metal phosphates,17,18 metal sulfates,19–21 mixed metal oxides,22,23 metal-supported catalysts,24,25 MOFs,26,27 and heteropolyacids,28,29 were also examined for the HMF production from hexose sugar. Despite their efficient HMF production, the synthesis of these catalysts is rather complicated, generates a large amount of waste, and requires high production expense. Therefore, it is necessary to seek a simpler and more environmentally friendly process for the preparation of effective bifunctional solid catalysts.
Among various heterogeneous catalysts, titanium dioxide (TiO2) is an attractive choice due to its low cost and its acidic properties suitable for several catalytic reactions.30–33 As such, TiO2 has recently been explored as a catalyst for the production of HMF.34–36 For instance, Dutta et al. demonstrated the synthesis of HMF from glucose over mesoporous TiO2 under microwave-assisted heating conditions, providing the HMF yield of 37%.37 Attempts to impart Brønsted acidity on TiO2 have been shown to slightly improve the HMF yields. For example, phosphate-immobilized TiO2 could yield HMF (34%).38 Similarly, hybrid organic–inorganic anatase (hybrid-TiO2), which is synthesized by a hydrothermal synthesis technique using citric acid (CA), displays the HMF yield of 45%.39 Such low to moderate HMF yields are likely due to the instability of HMF in heated water leading to various side products.34
Here, we report a catalytic system comprising a phosphate-modified TiO2 catalyst (P–TiO2) for high yield production of HMF from glucose. We employed a collection of strategies including (i) a biphasic system with an extracting phase (EP) to prevent HMF degradation, (ii) a bifunctional catalyst with suitable Lewis–Brønsted acid composition for enhancing HMF production, and (iii) a semi-batch process where the substrate was injected into the reactor at the desired reaction temperature to suppress unwanted side reactions. We investigated several biphasic systems to identify the suitable pairs of solvents with high efficiency of in situ HMF extraction. A cheap and commercially available catalyst, TiO2, was modified with phosphate via a simple impregnation method. The density Lewis and Brønsted sites on TiO2 were controlled by varying the impregnation content of phosphate which has a profound impact on the HMF yield as verified by in situ diffuse reflectance infrared Fourier transform spectroscopy (DRIFTS) of adsorbed pyridine combined with temperature-programmed desorption of adsorbed ammonia (NH3-TPD). Under the optimal conditions, the bifunctional P–TiO2 catalytic material exhibits excellent catalytic performance with remarkable HMF yield (72%) and HMF selectivity (83%). The recyclability of the prepared catalysts was also examined.
2. Experimental
2.1 Catalyst preparation
Phosphate functionalized TiO2 was prepared via a wetness impregnation technique. Specifically, titanium(IV) oxide-anatase (TiO2, ∼325 mesh, ≥99% metals basis, Sigma-Aldrich) was dried in an oven at temperature 80 °C for 12 h to remove residual water prior to surface modification. The desired quantity of ammonium phosphate monobasic (NH4H2PO4, Honeywell) was dissolved in deionized water to obtain 15 wt%, 30 wt%, and 60 wt% of phosphate on TiO2. The dried TiO2 powders were mixed with the NH4H2PO4 solution under a continuous stirring condition at room temperature for 6 h. Then, evaporation of the excess solvent and drying of the catalysts were implemented in an oven at 80 °C for 12 h. After that, calcination of the samples was done in air at 600 °C for 4 h. The final catalysts are denoted as xP–TiO2, where “x” indicates the amount of phosphate loading in wt%.2.2 Catalyst characterization
The specific surface area, total pore volume, and average pore size of the catalysts were evaluated by the Brunauer–Emmett–Teller (BET) N2 sorption method (Autosorb iQ3, Quantachrome Instruments). The crystallinity was identified by powder X-ray diffraction technique (PXRD; D8 ADVANCE, Bruker) using Cu Kα radiation performed at 40 kV and 40 mA and equipped with a LYNXEYE (1D mode) detector. The PXRD patterns at 2θ of 10–80° were recorded with a scan speed of 0.02° s−1 and a step time of 0.5 s. Identification of functional groups on the catalysts was done on the attenuated total reflectance Fourier-transform infrared spectroscopy (ATR-FTIR). The FTIR spectra were collected in the 4000–400 cm−1 range, with a resolution of 4 cm−1 using an IRTracer-100 spectrophotometer (Shimadzu).The elemental composition of the catalysts was analyzed by micro energy dispersive X-ray fluorescence spectrometer (μ-EDXRF; Orbis PC Micro-XRF, EDAX). The total acidity of the catalysts was identified by temperature-programmed desorption of adsorbed ammonia (chemisorption analyzer; ChemStar TPX, Quantachrome Instruments). Before the measurement, each sample was pretreated at 150 °C under a helium flow (30 mL min−1) for 1 h. Then, the catalyst sample was saturated with ammonia (5% NH3 in He) at 60 °C for 1 h. After that, the helium gas stream was re-introduced to remove physically adsorbed ammonia molecules from the catalyst sample. Finally, the ammonia desorption was performed by increasing temperature from 60 to 600 °C with a ramping rate of 5 °C min−1, while the ammonia desorption profile was monitored with a thermal conductivity detector (TCD). In situ diffuse reflectance infrared Fourier transform spectroscopy (DRIFTS) of adsorbed pyridine was applied to identify the nature of acid sites. The experiment was performed on a Nicolet iS50 equipped with an MCT detector. 20 mg of the sample was introduced into the analysis cell (Harrick Scientific) and activated at 150 °C under N2 flow. Pyridine was introduced to the catalyst using N2 as a carrier gas at 150 °C for 1 h. Then, pyridine desorption was carried out from the sample under N2 flow at 150 °C for 4 h while the IR spectra were collected at 15, 30, 45, 60, 120, and 240 min. The carbon deposition on the spent catalyst surface was analyzed by a carbon–hydrogen–nitrogen analytical instrument (CHN; CHN628, LECO, Japan).
2.3 HMF production
The dehydration reactions were conducted in a stainless-steel autoclave. In a typical experiment, the required amount of the catalyst was added in a 130 mL reactor containing glucose (0.3 g, Sigma-Aldrich) in a biphasic reaction media consisting of saturated sodium chloride (NaClaq, 9 mL) and organic solvent (21 mL) in a ratio of ratio 3![[thin space (1/6-em)]](https://www.rsc.org/images/entities/char_2009.gif) :
:![[thin space (1/6-em)]](https://www.rsc.org/images/entities/char_2009.gif) 7 v/v. The reactor was purged with nitrogen gas before being pressurized up to 15 bar. Note that pressure ranging from 15 to 30 bar did not significantly influence the activity of the catalyst. The autoclave was heated up to the reaction temperature (170 °C) and the reaction was carried out for 0–4 h with a constant stirring. To terminate the reaction, the autoclave was cooled down to the ambient temperature with an ice-water bath and the pressure was carefully released. The liquid product from the organic phase was separated from the aqueous phase by a separation funnel. In the study on reaction set-up and reusability test, the volume of reaction solution was increased to 100 mL while the larger reactor vessel of 300 mL and the higher N2 pressure of 30 bar were used to better stabilize the reaction condition.
7 v/v. The reactor was purged with nitrogen gas before being pressurized up to 15 bar. Note that pressure ranging from 15 to 30 bar did not significantly influence the activity of the catalyst. The autoclave was heated up to the reaction temperature (170 °C) and the reaction was carried out for 0–4 h with a constant stirring. To terminate the reaction, the autoclave was cooled down to the ambient temperature with an ice-water bath and the pressure was carefully released. The liquid product from the organic phase was separated from the aqueous phase by a separation funnel. In the study on reaction set-up and reusability test, the volume of reaction solution was increased to 100 mL while the larger reactor vessel of 300 mL and the higher N2 pressure of 30 bar were used to better stabilize the reaction condition.
The concentrations of liquid products in both aqueous and organic phases, such as glucose, HMF, and others were determined with high-performance liquid chromatography (HPLC, LC-20A Series, Shimadzu) equipped with an ultraviolet (UV) detector at 210 nm combined with a reflective index detector and a Biorad Aminex HPX-87H column. The temperature of the column oven was set at 45 °C. The sulfuric solution (5 mM) used as a mobile phase was fed to the column at a flow rate of 0.6 mL min−1. The glucose conversion, the HMF yield, the HMF selectivity, and the extraction ratio were calculated by eqn (1)–(4), respectively, as follows:
 | (1) |
 | (2) |
 | (3) |
 | (4) |
The partition coefficient in the biphasic system is described by eqn (5),
 | (5) |
3. Results and discussion
3.1 Characterizations of the phosphate functionalized TiO2 catalysts
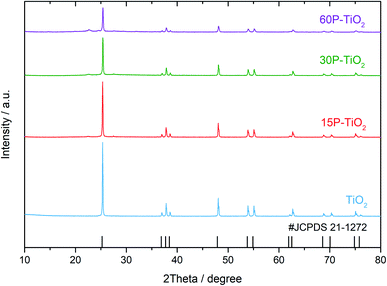
The crystallinity of the prepared catalysts with different phosphate contents was examined using PXRD as shown in Fig. 1. The diffraction patterns of all TiO2 catalysts with and without phosphate modifications exhibit strong diffraction peaks at 25°, 37°, 38°, 39°, 48°, 54°, and 55°, indicating the anatase phase of TiO2 (JCPDS no. 21-1272). For phosphate functionalized TiO2 (xP–TiO2), the samples show a broad peak centered at 22° which indicates the presence of titanium phosphate (TiP2O7) on the catalysts.35 Additionally, the analysis of the crystallite sizes using the Scherrer equation shows that the crystallite sizes of TiO2 decreased from 14 to 6 nm with increasing phosphate loading (Table 1).| Samples | Phosphorous loadingcalca (mole) | Phosphorous loadingexpb | Surface area (m2 g−1) | Total pore volume (cm3 g−1) | Average pore size (nm) | Crystallite sizec (nm) | Total acidity (mmol g−1) | Acidity densityd (mmol m−2) | Weak to medium acid site ratioe | |
|---|---|---|---|---|---|---|---|---|---|---|
| (%) | (mole) | |||||||||
| a Calculated phosphorous loading based on the amount of NH4H2PO4 employed during the synthesis of P was added in the Experimental section.b Experimental phosphorus loading measured by μ-EDXRF technique.c Calculated by the Sherrer equation.d Calculated by dividing the total acidity by surface area.e Calculated by dividing the weak acid site peak area by the medium acid site peak area. | ||||||||||
| TiO2 | — | — | — | 13 | 0.064 | 18.7 | 14 | 0.080 | 0.006 | 0.0 |
| 15P–TiO2 | 0.16 | 7.6 | 0.09 | 10 | 0.072 | 28.3 | 11 | 0.267 | 0.026 | 0.114 |
| 30P–TiO2 | 0.31 | 15.2 | 0.17 | 9 | 0.052 | 22.3 | 9 | 0.130 | 0.014 | 0.172 |
| 60P–TiO2 | 0.63 | 28.2 | 0.29 | 9 | 0.025 | 10.8 | 6 | 0.043 | 0.005 | 0.217 |
The amount of phosphate in the catalysts was evaluated by μ-EDXRF technique (Table 1). As expected, the phosphorus content (P) increases with a higher amount of phosphate precursor loaded during the impregnation process. It is worth mentioning that the amount of phosphorous detected on TiO2 is approximately half the amount of the precursor added. The specific surface areas of the catalysts were obtained by N2 sorption isotherms. The values of both metrics decrease with the increasing amount of phosphate loading, suggesting that the phosphate could partially block the pore of TiO2 (Table 1). In addition, the decrease in the total pore volume and average pore size in 15P–TiO2, 30P–TiO2 and 60P–TiO2 corresponds well with the amount of phosphate loading.
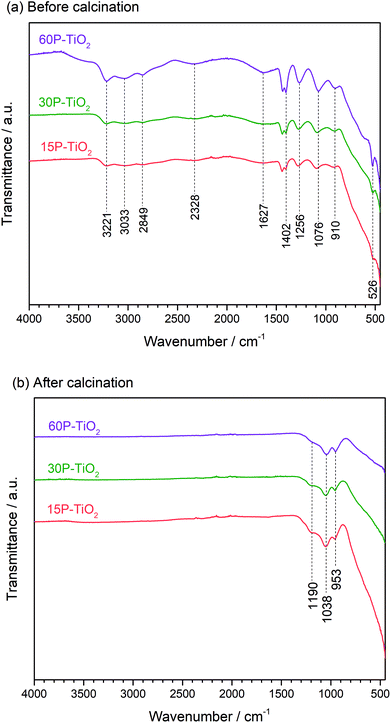
We then characterized the phosphate species on the catalyst surface using FTIR (Fig. 2). The FTIR spectra of 15P–TiO2, 30P–TiO2, and 60P–TiO2 catalysts before calcination were similar in peak positions. The phosphate functionalized TiO2 without calcination (Fig. 2a) showed the band at 1627 cm−1 and around 2600–3600 cm−1 which are attributed to the bending and stretching vibration of O–H group, respectively. These peaks can also be dedicated to the vibration of OH groups of water adsorbed on the surface of the sample.36,40 Several bands assignable to phosphoric acid were found including 2328 cm−1 (P–H vibration band), 1402 cm−1 (stretching vibration of the P![[double bond, length as m-dash]](https://www.rsc.org/images/entities/char_e001.gif) O), 1265 cm−1 (asymmetric stretching vibration of PO2−), 910 cm−1 (stretch vibration of P–OH), and 526 cm−1 (PO43− vibrational band).41–43
O), 1265 cm−1 (asymmetric stretching vibration of PO2−), 910 cm−1 (stretch vibration of P–OH), and 526 cm−1 (PO43− vibrational band).41–43
The FTIR spectra of phosphate functionalized TiO2 calcined at 600 °C for 6 h are shown in Fig. 2b. The bands related to O–H group of water and phosphoric acid disappeared while the peaks associated with the phosphate species emerged. The band at 953 and 1190 cm−1 corresponded to the valence vibration of P–O–P bridge and the asymmetric vibration of P–O, respectively. While the band at 1038 cm−1 is assigned to the stretch of Ti–O–P skeleton similar to this reported by Attia et al.43 who suggested the heat treatment (>500 °C) can transform phosphoric acid in the presence of TiO2 to titanium pyrophosphate (TPP) or other phosphate derivatives.43–45 This result confirms the presence of titanium pyrophosphate corroborating the PXRD analysis.46
Catalytic dehydration of glucose into HMF requires optimal acid sites. It is therefore critical to understand the quantity and types of acid sites located on the catalyst surface. We employed the NH3-TPD technique to determine the total acidity and the acid strength of the catalysts.
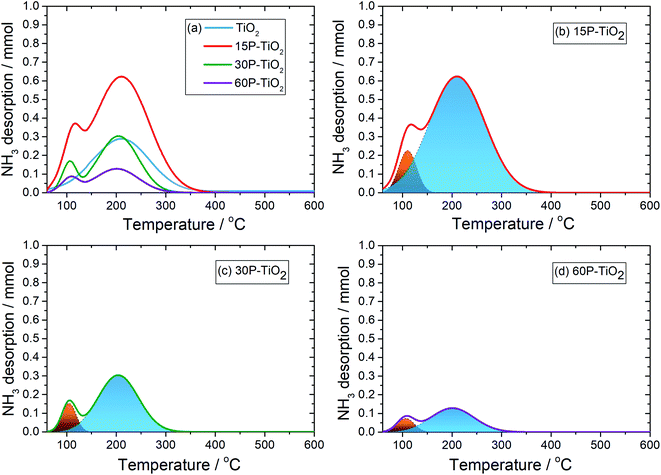
Generally, the desorption peak of NH3 of the materials appears at different temperature ranges which are correlated with the acid strength. The NH3 released below 200 °C, 200–400 °C, and above 400 °C are considered to be adsorbed on weak, medium, and strong acid sites, respectively.19,47 Fig. 3 presents NH3-TPD spectra of TiO2 with different phosphate content and their deconvoluted peaks fitted with the Gaussian model. Pristine anatase–TiO2 shows one NH3 desorption peak related to the medium acid sites (blue) located on the titanium center48 which have been reported as a reaction site for the glucose conversion.49 In the phosphate-modified TiO2 catalysts, one additional NH3 desorption peak was observed which can be assigned to the weak acid sites (orange). This peak must therefore be related to the O–H group bound to phosphorous of the titanium pyrophosphate species on TiO2![[thin space (1/6-em)]](https://www.rsc.org/images/entities/char_2009.gif) 50 which is in agreement with the presence of the Brønsted acid site found from in situ DRIFTS of adsorbed pyridine discussed below. This feature has also been reported as a catalytic site for the dehydration to HMF.4,51 From the NH3-TPD analysis (Table 1), the total acid site increases from 0.080 mmol g−1 in TiO2 to 0.267 mmol g−1 in 15P–TiO2 indicating that more acidic sites are formed on the catalyst surface. However, further increase of phosphate loading results in a decrease of the number of total acid sites to 0.130 mmol g−1 in 30P–TiO2 and 0.043 mmol g−1 in 60P–TiO2. In terms of acid site density, after the functionalization with phosphate, the total acidity and acid site densities experience a significant decrease from 0.267 mmol g−1 and 0.026 mmol cm−2 for 15P–TiO2 to 0.130 mmol g−1 and 0.005 mmol cm−2 for 60P–TiO2. This reduction is well correlated with the catalyst surface areas. Accordingly, the decrease of the acid densities and surface area would lead to lower available catalytic sites for the HMF production. The surface area could be relatively responsible for influencing the total acidity in terms of accessibility of the probe gas to available acid sites. The increase in phosphate loading induces the agglomeration and low dispersion, which decreased the surface area, pore volume, and acidity. Maarouf et al.52 reported that the P NMR spectroscopy demonstrated the coexistence of phosphorus sites inside the mixed phosphate structure in accordance with the IR observations.
50 which is in agreement with the presence of the Brønsted acid site found from in situ DRIFTS of adsorbed pyridine discussed below. This feature has also been reported as a catalytic site for the dehydration to HMF.4,51 From the NH3-TPD analysis (Table 1), the total acid site increases from 0.080 mmol g−1 in TiO2 to 0.267 mmol g−1 in 15P–TiO2 indicating that more acidic sites are formed on the catalyst surface. However, further increase of phosphate loading results in a decrease of the number of total acid sites to 0.130 mmol g−1 in 30P–TiO2 and 0.043 mmol g−1 in 60P–TiO2. In terms of acid site density, after the functionalization with phosphate, the total acidity and acid site densities experience a significant decrease from 0.267 mmol g−1 and 0.026 mmol cm−2 for 15P–TiO2 to 0.130 mmol g−1 and 0.005 mmol cm−2 for 60P–TiO2. This reduction is well correlated with the catalyst surface areas. Accordingly, the decrease of the acid densities and surface area would lead to lower available catalytic sites for the HMF production. The surface area could be relatively responsible for influencing the total acidity in terms of accessibility of the probe gas to available acid sites. The increase in phosphate loading induces the agglomeration and low dispersion, which decreased the surface area, pore volume, and acidity. Maarouf et al.52 reported that the P NMR spectroscopy demonstrated the coexistence of phosphorus sites inside the mixed phosphate structure in accordance with the IR observations.
Besides the amount of acid sites, the other factor affecting the efficiency of glucose dehydration is the types of acid sites.53 Therefore, we carried out the in situ DRIFTS of adsorbed pyridine experiments (Fig. 4) to investigate the nature of acid sites on the catalysts. TiO2 sample exhibits the adsorption band at 1445 cm−1 corresponding to the Lewis acid sites indicating that TiO2 is a pure Lewis acid catalyst.54 Modification of TiO2 with phosphate appends the Brønsted acidity on the catalyst as indicated by the appearance of 1545 cm−1 peak (Fig. 4).11,13,22,55 By comparison of the peak areas of pyridine bound to Lewis and Brønsted acid sites, we observed an increase in Brønsted acid sites with increasing phosphate loading.
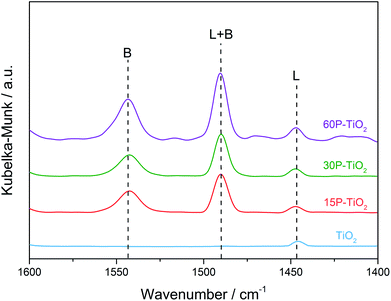 | ||
| Fig. 4 In situ DRIFTS spectra of pyridine adsorbed on TiO2, 15P–TiO2, 30P–TiO2, and 60P–TiO2. B and L represent Brønsted acid and Lewis acid sites, respectively. | ||
3.2 Screening for a suitable solvent system
The biphasic system was selected as a reaction media of choice in this work due to its ability to promote HMF yield by transferring the HMF produced in the aqueous phase to the organic one and thereby suppressing the HMF degradation in the aqueous phase. For the aqueous phase, we chose NaCl solution because of the increased ionic strength compared to water which further enhances the HMF partitioning into the organic phase and thereby shifts the reaction equilibrium toward HMF.56–60 Thus, one of the key remaining factors dictating the reaction efficiency in this system is the choice of organic solvent as an extraction phase (EP). This EP aids in the effective and continuous transfer of HMF product to the organic phase after HMF was formed in the reactive phase (RP).61 We first investigated the effects of the polarity of the EP systematically in the absence of a catalyst by using solvents with different properties comprising non-polar solvents, polar protic solvents, and aprotic polar solvents. These solvent systems include NaClaq:toluene, NaClaq:MIBK, and NaClaq:1-butanol. All experiments were carried out with a fixed ratio of NaClaq![[thin space (1/6-em)]](https://www.rsc.org/images/entities/char_2009.gif) :
:![[thin space (1/6-em)]](https://www.rsc.org/images/entities/char_2009.gif) organic solvent = 3
organic solvent = 3![[thin space (1/6-em)]](https://www.rsc.org/images/entities/char_2009.gif) :
:![[thin space (1/6-em)]](https://www.rsc.org/images/entities/char_2009.gif) 7 v/v at 170 °C for 2 h. In a controlled experiment, heating glucose in pure water gave HMF in 20% yield with a low glucose conversion of 29% (Fig. 5). In comparison, all biphasic systems offer higher glucose conversions and HMF yields than the monophasic system. The NaClaq:1-butanol solvent system provides the highest HMF yield of 38% followed by NaClaq:MIBK and NaClaq:toluene (Table 2). To understand this trend, we measured the concentration of HMF in the aqueous and organic phases and calculated the partition coefficient (R) which is the relationship between the HMF concentration in the organic phase and the aqueous phase.60 From these results, we found that the R values follow the order of 1-butanol > MIBK > toluene > water which coincide with the trend of HMF yields similar to this report by Gomes et al.59 who suggested that the R-value is correlated with the HMF yield. Besides the R-value, many researchers employ the Conductor-like Screening Model for Realistic Solvation (COSMO-RS) computational methods to estimate activity coefficients of HMF, allowing identification of high performing solvents for solvent selection.62–64 The effect of HMF partition coefficient (PHMF) has been reported by Blumenthal et al.63 who found that 1-butanol with a value of 1.7 is the better than MIBK (PHMF = 1.1). Wang et al.62 studied the use of sigma potential for measuring pseudo-chemical potential experienced by a molecular surface segment carrying a specific surface charge density. They found that the toluene exhibits a parabolic shape with positive chemical potentials for polar surface segments, indicating unfavorable solvent interactions of these segments of HMF and water.
7 v/v at 170 °C for 2 h. In a controlled experiment, heating glucose in pure water gave HMF in 20% yield with a low glucose conversion of 29% (Fig. 5). In comparison, all biphasic systems offer higher glucose conversions and HMF yields than the monophasic system. The NaClaq:1-butanol solvent system provides the highest HMF yield of 38% followed by NaClaq:MIBK and NaClaq:toluene (Table 2). To understand this trend, we measured the concentration of HMF in the aqueous and organic phases and calculated the partition coefficient (R) which is the relationship between the HMF concentration in the organic phase and the aqueous phase.60 From these results, we found that the R values follow the order of 1-butanol > MIBK > toluene > water which coincide with the trend of HMF yields similar to this report by Gomes et al.59 who suggested that the R-value is correlated with the HMF yield. Besides the R-value, many researchers employ the Conductor-like Screening Model for Realistic Solvation (COSMO-RS) computational methods to estimate activity coefficients of HMF, allowing identification of high performing solvents for solvent selection.62–64 The effect of HMF partition coefficient (PHMF) has been reported by Blumenthal et al.63 who found that 1-butanol with a value of 1.7 is the better than MIBK (PHMF = 1.1). Wang et al.62 studied the use of sigma potential for measuring pseudo-chemical potential experienced by a molecular surface segment carrying a specific surface charge density. They found that the toluene exhibits a parabolic shape with positive chemical potentials for polar surface segments, indicating unfavorable solvent interactions of these segments of HMF and water.
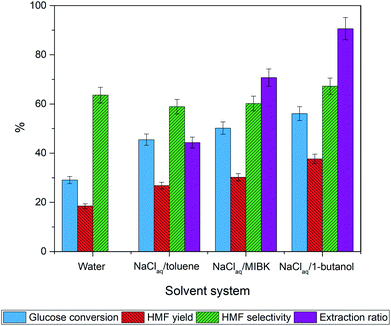 | ||
| Fig. 5 Effect of organic solvent in the biphasic system on glucose dehydration to HMF without a catalyst. The reaction was performed at 170 °C for 2 h. | ||
| Solvent system | HMF in organic phase (%) | HMF in aqueous phase (%) | Partition coefficient (R) |
|---|---|---|---|
| a Reaction condition: total volume 30 mL of solvent, reaction temperature at 170 °C, reaction time 2 h. | |||
| Water | 0 | 100 | 0 |
| NaClaq/toluene | 44.3 | 55.7 | 0.3 |
| NaClaq/MIBK | 70.7 | 29.3 | 1.0 |
| NaClaq/1-butanol | 90.6 | 9.4 | 4.1 |
As for NaClaq:toluene system, the existence of a high concentration of HMF in the aqueous phase is detrimental as HMF is transformed to byproducts resulting in low HMF yield. In contrast, 1-butanol having similar polarity as HMF facilitates the HMF transfer from the aqueous phase to the organic phase prohibiting the decomposition of HMF while driving the reaction toward HMF production.34,65 Thus, NaClaq:1-butanol was chosen as a solvent system of choice for further study in this work due to the highest value of the partition coefficient (R = 4.1) and the highest extraction ratio (91%). Besides, the use of primary alcohols such as ethanol, isopropanol, acetone, and n-butanol as EP is more feasible for HMF production because they have low boiling points enabling the product isolation and they are environmentally friendly.61 In addition, unlike unsaturated solvents like toluene or MIBK, 1-butanol is inert during our hydrogenolysis stage.64
3.3 Effects of phosphate modification on catalytic reactivity
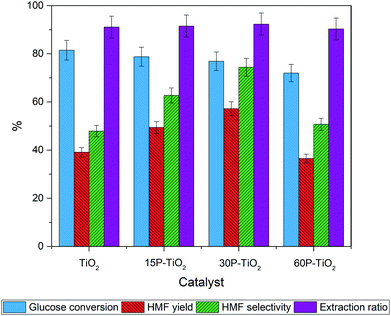
We then investigated the effects of functionalization of phosphate on TiO2 for the glucose conversion to HMF using 3![[thin space (1/6-em)]](https://www.rsc.org/images/entities/char_2009.gif) :
:![[thin space (1/6-em)]](https://www.rsc.org/images/entities/char_2009.gif) 7 v/v of NaClaq/1-butanol as the solvent (Fig. 6). Addition of phosphate to TiO2 results in a slight decrease in glucose conversion which is corresponded to the total acidity.
7 v/v of NaClaq/1-butanol as the solvent (Fig. 6). Addition of phosphate to TiO2 results in a slight decrease in glucose conversion which is corresponded to the total acidity.
On the contrary, HMF selectivity increases with increasing phosphate loading from 39% to 50% and 58% over TiO2, 15P–TiO2, and 30P–TiO2, respectively, before decreasing with 60P–TiO2 catalyst. A comparable trend was observed for the yield of HMF where the maximal yield of 57% was obtained with 30P–TiO2. These results obviously reveal that the presence of Brønsted acid from the phosphate groups in combination with a suitable ratio of Brønsted and Lewis acid sites are required for attaining optimal HMF yield and selectivity as displayed in the 30P–TiO2 catalyst. At excessive loading of the phosphate (60 wt%), sharp drops of HMF yield and HMF selectivity were observed, possibly resulting from insufficient total acidity and acid density of the catalyst. Note that the extraction ratio of all reactions was maintained at a constant indicating that the difference in the conversion, selectivity, and yield are solely correlated with the intrinsic properties of the catalysts.
3.4 Effects of reaction setup
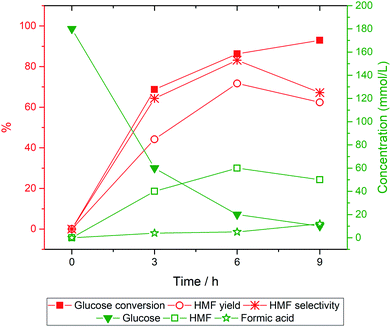
Another factor that could affect the catalytic reactions is how the reaction is set up. Typically, a reaction containing a catalyst, glucose, and solvent is heated up from room temperature to the desired temperature. However, the HMF production is highly sensitive to the reaction temperature.4 Undesirable side reactions favored at low temperatures could occur during the temperature ramp-up. To avoid such an issue, we injected glucose solution into the system that was already preheated to the setpoint temperature. Specifically, 30P–TiO2 (0.3 g) and 1-butanol (70 mL) were added into a 300 mL semi-batch reactor. The system was pressurized with nitrogen gas to 30 bar and heated up to 170 °C. When the system reached the set temperature at 170 °C, 0.3 wt% of glucose concentration in 30 mL of NaCl solution was introduced into the reactor by a liquid pump with a feed flow rate of 10 mL min−1. It takes 3 min to introduce the 30 mL of glucose/NaCl solution to the system. The reaction was performed for 9 h with a sampling interval of 3 h yielding the concentration profile shown in Fig. 7.From the catalytic testing, glucose conversion increased rapidly in the first 6 h and reached 92% conversion after 9 h while HMF selectivity and yield increased up to 6 h of reaction. The drop of HMF selectivity and yield at the prolonged reaction (9 h) might be associated with the rehydration of HMF as indicated by the increased concentration of formic acid.51,66 Besides, humins formed via HMF polymerization were also observed in the reaction for an extended amount of time which could be noticed from the darker color of the used catalyst and the product solution.67,68 Overall, the optimal reaction time is 6 h giving 86% of glucose conversion and 72% of HMF yield, showing a significant improvement over the typical reaction setup.
The direct conversion of glucose to HMF was studied over various catalytic systems as shown in Table 3. Zeolites, metal–oxides, and metal–organic frameworks have been reported to catalyze this reaction. The reaction temperature basically ranged in 120–200 °C, althought the temperature below 140 °C typically gave relatively low HMF yield.26,38,39 The HMF yield above 50% were obtained from catalysts functionalized by acids including SO3H-ZSM-5,69 SnP,70 PO4/NU(half),15 and Fe/AR.67 The SO3H-SPPS catalyst exhibited very high HMF yield of 87% in an ionic liquid [EMIM]Cl as a reaction medium, yet the cost effectiveness of ionic liquid remains controversial in an industrialization aspect. Besides, the microwave system combined with Ni-rGO71 and NiGO-FD71 catalyst would give excellent HMF yield of 75% and 95%, respectively, althought scaling up microwave reactor to industrial application is highly challenging. The present work applying a simple modification on a cheap commercial catalyst like TiO2 could offer the promising HMF yield above 70% in conventional thermal process. The use of 1-butanol as a solvent is beneficial for biomass conversion applications, while 1-butanol can be produced by the fermentation of biomass-derived carbohydrates providing integrated biorefinery concept. Moreover, the developed catalyst could work effectively with a greener solvent system using alcohol as the extraction phase. It should be noted that setup and configuration of the reactor (such as reactor size and heating process) as well as reaction conditions could strongly influence the performance and behavior of the catalyst and system.
| Catalyst | Reaction condition | HMF yield (%) | Ref. | |||
|---|---|---|---|---|---|---|
| Medium | Total volume (mL) | Temp (°C) | Time (h) | |||
| a N/A: not available. M-A: microwave-assisted. | ||||||
| MIL-101(Cr)–SO3H | H2O/THF | 5 | 130 | 24 | 29 | 26 |
| Phosphate-TiO2 | H2O/SBP | 8 | 120 | 2 | 34 | 38 |
| Hybrid-TiO2 | Water | 160 | 130 | 7 | 45 | 39 |
| Hβ zeolite | H2O/THF | 9.5 | 180 | 2 | 50 | 72 |
| SO3H-ZSM-5 | H2O/DMSO | N/A | 140 | 4 | 54 | 69 |
| SnP | NaClaq/THF | 12 | 175 | 1 | 61 | 70 |
| PO4/NU(half) | H2O/2-propanol | 1 | 140 | 5 | 64 | 15 |
| Fe/AR | NaClaq/THF | 40 | 160 | 1 | 68 | 67 |
| SO3H-SPPS | [EMIM]Br | 5 | 140 | 4 | 87 | 73 |
| Ni-rGOM-A | H2O/THF | 4 | 200 | 1 | 75 | 71 |
| NiGO-FDM-A | H2O/THF | 4 | 200 | 1 | 95 | 71 |
| 30P–TiO2 | NaClaq/1-butanol | 100 | 170 | 6 | 72 | This work |
3.5 Reusability of catalyst
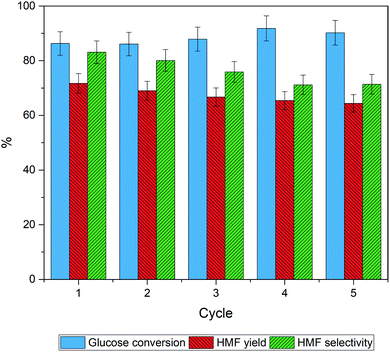
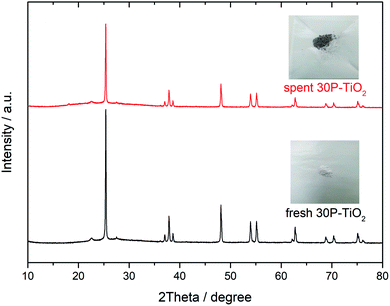
The reusability of catalyst is an important parameter determining the process feasibility. The spent catalysts were separated from the product solution by filtration and then rinsed with deionized water and ethanol until a clear supernatant was obtained. Finally, the spent catalyst was dried in an oven at 80 °C for 12 h. After that, the catalyst was reused under the optimal conditions described in Section 3.3. Fig. 8 shows that the glucose conversion remains rather stable after five cycles while slight decreases of the HMF yield and the HMF selectivity were observed. The results suggest that the catalytic sites for the reaction were partially blocked. The PXRD patterns of the fresh catalyst and the spent catalysts (5th cycle), shown in Fig. 9 were quite similar suggesting that the crystallinity was retained although the peak intensity was slightly decreased. The spent catalyst turned slightly darker in color indicating the carbonaceous deposition on the catalyst surface. Regarding the elemental analysis, the carbon content of 1% was observed after the 5th cycle, in which the catalyst performance was slightly suppressed. Besides the carbonaceous deposition, ion exchange on the catalyst surface may also contribute to the catalyst deactivation. Tang et.al.74 reported that the protons of Brønsted acid can be replaced by common cations such as Na+ and K+ in the reaction solution. Proton in the system would become free protons depending on the extent of ion exchange. After that, the process was catalyzed by both the free proton and the remaining protons of the solid acid. The amount of phosphorus and sodium in the spent catalysts in this work were evaluated by μ-EDXRF technique (see Fig. S1 and Table S1†). The phosphorus content of the spent 30P–TiO2 decreased from 15 to 12% while the sodium content increased to ca. 5%, confirming that the catalyst deactivation was partially attributed to the cation exchanged on the catalyst. When the phosphorus content is reduced, the HMF yield and HMF selectivity both decrease slightly.4. Conclusion
We report here a facile and green synthesis of bifunctional P–TiO2 catalysts for the one-pot conversion of glucose into HMF. Effects of solvent composition, nature of acid sites, and reaction setup were investigated and found to play an important function to obtain high HMF yield. Under optimal reaction conditions with the semi-batch process to reduce undesirable side reactions during the preheating step, the catalyst exhibits exceptional glucose conversion of 86% and HMF yield of 72% at 170 °C for 6 h. The low cost, ease of synthesis, high catalytic activity, and good reusability of this catalyst make it a good candidate for industrial implementation.Conflicts of interest
There are no conflicts to declare.Acknowledgements
We are grateful for the financial and technical supports from Nanocatalysis and Molecular Simulation research group, National Nanotechnology Center (Grant no. P1857155) and the Thailand Graduate Institute of Science and Technology (TGIST) from National Science and Technology Development Agency (NSTDA). We acknowledge the support from the Program Management Unit Competitiveness (Grant no. C10F630222). We are also thankful to Prof. S. Seraphin (NSTDA Professional Authorship Center) for fruitful discussion on manuscript preparation.References
- C. Moreau, M. N. Belgacem and A. Gandini, Top. Catal., 2004, 27, 11–30 CrossRef CAS.
- J. B. Binder and R. T. Raines, J. Am. Chem. Soc., 2009, 131, 1979–1985 CrossRef CAS PubMed.
- A. A. Rosatella, S. P. Simeonov, R. F. M. Frade and C. A. M. Afonso, Green Chem., 2011, 13, 754–793 RSC.
- V. Choudhary, S. H. Mushrif, C. Ho, A. Anderko, V. Nikolakis, N. S. Marinkovic, A. I. Frenkel, S. I. Sandler and D. G. Vlachos, J. Am. Chem. Soc., 2013, 135, 3997–4006 CrossRef CAS PubMed.
- J. N. C. Yuriy Román-Leshkov and J. A. Dumesic, SCIENCE, 2006, 312, 1933–1937 CrossRef PubMed.
- X. Liu, X. Min, H. Liu, Y. Cao, Y. Liu, M. Han, Z.-M. Sun and S. Ji, Sustainable Energy Fuels, 2020, 4, 5795–5801 RSC.
- D.-M. Gao, Y.-B. Shen, B. Zhao, Q. Liu, K. Nakanishi, J. Chen, K. Kanamori, H. Wu, Z. He, M. Zeng and H. Liu, ACS Sustainable Chem. Eng., 2019, 7, 8512–8521 CrossRef CAS.
- A. A. Marianou, C. M. Michailof, D. K. Ipsakis, S. A. Karakoulia, K. G. Kalogiannis, H. Yiannoulakis, K. S. Triantafyllidis and A. A. Lappas, ACS Sustainable Chem. Eng., 2018, 6, 16459–16470 CrossRef CAS.
- J. J. Wiesfeld, R. Gaquere and E. J. M. Hensen, ACS Sustainable Chem. Eng., 2019, 7, 7552–7562 CrossRef CAS.
- K. Li, M. Du and P. Ji, ACS Sustainable Chem. Eng., 2018, 6, 5636–5644 CrossRef CAS.
- Y. Zhang, Q. Xiong, Y. Chen, M. Liu, P. Jin, Y. Yan and J. Pan, Ind. Eng. Chem. Res., 2018, 57, 1968–1979 CrossRef CAS.
- K. Nakajima, Y. Baba, R. Noma, M. Kitano, J. N. Kondo, S. Hayashi and M. Hara, J. Am. Chem. Soc., 2011, 133, 4224–4227 CrossRef CAS PubMed.
- M. Nahavandi, T. Kasanneni, Z. S. Yuan, C. C. Xu and S. Rohani, ACS Sustainable Chem. Eng., 2019, 7, 11970–11984 CAS.
- V. V. Ordomsky, V. L. Sushkevich, J. C. Schouten, J. van der Schaaf and T. A. Nijhuis, J. Catal., 2013, 300, 37–46 CrossRef CAS.
- M. Yabushita, P. Li, T. Islamoglu, H. Kobayashi, A. Fukuoka, O. K. Farha and A. Katz, Ind. Eng. Chem. Res., 2017, 56, 7141–7148 CrossRef CAS.
- C. Fan, H. Guan, H. Zhang, J. Wang, S. Wang and X. Wang, Biomass Bioenergy, 2011, 35, 2659–2665 CrossRef CAS.
- K. Saravanan, K. S. Park, S. Jeon and J. W. Bae, ACS Omega, 2018, 3, 808–820 CrossRef CAS PubMed.
- X. Wang, F. Liang, C. Huang, Y. Li and B. Chen, Catal. Sci. Technol., 2015, 5, 4410–4421 RSC.
- E. Kılıç and S. Yılmaz, Ind. Eng. Chem. Res., 2015, 54, 5220–5225 CrossRef.
- S. Kassaye, C. Pagar, K. K. Pant, S. Jain and R. Gupta, Bioresour. Technol., 2016, 220, 394–400 CrossRef CAS PubMed.
- A. Osatiashtiani, A. F. Lee, D. R. Brown, J. A. Melero, G. Morales and K. Wilson, Catal. Sci. Technol., 2014, 4, 333–342 RSC.
- A. A. Silahua-Pavón, C. G. Espinosa-González, F. Ortiz-Chi, J. G. Pacheco-Sosa, H. Pérez-Vidal, J. C. Arévalo-Pérez, S. Godavarthi and J. G. Torres-Torres, Catal. Commun., 2019, 129, 105273–105279 CrossRef.
- L. Atanda, A. Silahua, S. Mukundan, A. Shrotri, G. Torres-Torres and J. Beltramini, RSC Adv., 2015, 5, 80346–80352 RSC.
- M. Moreno-Recio, J. Santamaría-González and P. Maireles-Torres, Chem. Eng. J., 2016, 303, 22–30 CrossRef CAS.
- A. R. Aylak, S. Akmaz and S. N. Koc, Part. Sci. Technol., 2016, 35, 490–493 CrossRef.
- A. Herbst and C. Janiak, New J. Chem., 2016, 40, 7958–7967 RSC.
- Y. Zhang, W. Guan, H. Song, Y. Wei, P. Jin, B. Li, C. Yan, J. Pan and Y. Yan, Microporous Mesoporous Mater., 2020, 305, 110328–110339 CrossRef CAS.
- X. Yi, I. Delidovich, Z. Sun, S. Wang, X. Wang and R. Palkovits, Catal. Sci. Technol., 2015, 5, 2496–2502 RSC.
- Y. J. Pagán-Torres, T. Wang, J. M. R. Gallo, B. H. Shanks and J. A. Dumesic, ACS Catal., 2012, 2, 930–934 CrossRef.
- L. Atanda, M. Konarova, Q. Ma, S. Mukundan, A. Shrotri and J. Beltramini, Catal. Sci. Technol., 2016, 6, 6257–6266 RSC.
- I. Ali, M. Suhail, Z. A. Alothman and A. Alwarthan, RSC Adv., 2018, 8, 30125–30147 RSC.
- D. Ziental, B. Czarczynska-Goslinska, D. T. Mlynarczyk, A. Glowacka-Sobotta, B. Stanisz, T. Goslinski and L. Sobotta, Nanomaterials, 2020, 10, 387–417 CrossRef CAS PubMed.
- P. Sudarsanam, H. Li and T. V. Sagar, ACS Catal., 2020, 10, 9555–9584 CrossRef CAS.
- L. Shuai and J. Luterbacher, ChemSusChem, 2016, 9, 133–155 CrossRef CAS PubMed.
- L. Kőrösi and I. Dékány, Colloids Surf., A, 2006, 280, 146–154 CrossRef.
- M. H. Gouda, W. Gouveia, N. A. Elessawy, B. Šljukić, A. A. A. Nassr and D. M. F. Santos, Int. J. Hydrogen Energy, 2020, 45, 15226–15238 CrossRef CAS.
- S. Dutta, S. De, A. K. Patra, M. Sasidharan, A. Bhaumik and B. Saha, Appl. Catal., A, 2011, 409, 133–139 CrossRef.
- R. Noma, K. Nakajima, K. Kamata, M. Kitano, S. Hayashi and M. Hara, J. Phys. Chem. C, 2015, 119, 17117–17125 CrossRef CAS.
- C. A. S. Lanziano, S. F. Moya, D. H. Barrett, E. Teixeira-Neto, R. Guirardello, F. de Souto da Silva, R. Rinaldi and C. B. Rodella, ChemSusChem, 2018, 11, 872–880 CrossRef CAS PubMed.
- B. Das and K. Mohanty, Sustainable Energy Fuels, 2020, 4, 6030–6044 RSC.
- L. He, G. Dong and C. Deng, Ceram. Int., 2016, 42, 11918–11923 CrossRef CAS.
- K. Ba, A. Chahine, M. Ebn Touhami, J. G. Alauzun and A. Manseri, SN Appl. Sci., 2020, 2, 350–362 CrossRef CAS.
- A. Attia, Q. Wang, X. Huang and Y. Yang, J. Solid State Electrochem., 2011, 16, 1461–1471 CrossRef.
- B. C. Cornilsen and R. A. Condrate, J. Phys. Chem. Solids, 1977, 38, 1327–1332 CrossRef CAS.
- M. J. Bushiri, K. Byrappa and V. U. Nayar, Mater. Today: Proc., 2015, 2, 973–976 Search PubMed.
- P. Patnaik, Dean's analytical chemistry handbook, McGraw Hill, New York, 2004 Search PubMed.
- P. Berteau and B. Delmon, Catal. Today, 1989, 5, 121–137 CrossRef CAS.
- M. I. Zaki, M. A. Hasan, F. A. Al-Sagheer and L. Pasupulety, Colloids Surf., A, 2001, 190, 261–274 CrossRef CAS.
- M. Watanabe, Y. Aizawa, T. Iida, R. Nishimura and H. Inomata, Appl. Catal., A, 2005, 295, 150–156 CrossRef CAS.
- G. Ramis, G. Busca, V. Lorenzelli, A. La Ginestra, P. Galli and M. A. Massucci, J. Chem. Soc., Dalton Trans., 1988, 881–886, 10.1039/DT9880000881.
- R. Tomer and P. Biswas, New J. Chem., 2020, 44, 20734–20750 RSC.
- I. Maarouf, A. Oulmekki, J. Toyir, F. Lefebvre, A. Harrach and M. Ijjaali, J. Mater. Environ. Sci., 2017, 8, 2722–2728 CAS.
- E. Nikolla, Y. Román-Leshkov, M. Moliner and M. E. Davis, ACS Catal., 2011, 1, 408–410 CrossRef CAS.
- T. Barzetti, E. Selli, D. Moscotti and L. Forni, J. Chem. Soc., Faraday Trans., 1996, 92, 1401–1407 RSC.
- Q. Hou, M. Zhen, L. Liu, Y. Chen, F. Huang, S. Zhang, W. Li and M. Ju, Appl. Catal., B, 2018, 224, 183–193 CrossRef CAS.
- Y. Román-Leshkov and J. A. Dumesic, Top. Catal., 2009, 52, 297–303 CrossRef.
- S. Mohammad, C. Held, E. Altuntepe, T. Kose and G. Sadowski, J. Phys. Chem. B, 2016, 120, 3797–3808 CrossRef CAS PubMed.
- M. Li, W. Li, Y. Lu, H. Jameel, H.-m. Chang and L. Ma, RSC Adv., 2017, 7, 14330–14336 RSC.
- F. N. D. C. Gomes, L. R. Pereira, N. F. P. Ribeiro and M. M. V. M. Souza, Braz. J. Chem. Eng., 2015, 32, 119–126 CrossRef.
- A. Kumar and R. Srivastava, Sustainable Energy Fuels, 2019, 3, 2475–2489 RSC.
- B. Saha and M. M. Abu-Omar, Green Chem., 2014, 16, 24–38 RSC.
- Z. Wang, S. Bhattacharyya and D. G. Vlachos, Green Chem., 2020, 22, 8699–8712 RSC.
- L. C. Blumenthal, C. M. Jens, J. Ulbrich, F. Schwering, V. Langrehr, T. Turek, U. Kunz, K. Leonhard and R. Palkovits, ACS Sustainable Chem. Eng., 2015, 4, 228–235 CrossRef.
- Y. Roman-Leshkov, C. J. Barrett, Z. Y. Liu and J. A. Dumesic, Nature, 2007, 447, 982–985 CrossRef CAS PubMed.
- X. Li, Q. Xia, V. C. Nguyen, K. Peng, X. Liu, N. Essayem and Y. Wang, Catal. Sci. Technol., 2016, 6, 7586–7596 RSC.
- N. Jiang, R. Huang, W. Qi, R. Su and Z. He, BioEnergy Res., 2011, 5, 380–386 CrossRef.
- S. Q. Xu, C. Y. Yin, D. H. Pan, F. Hu, Y. F. Wu, Y. A. Miao, L. J. Gao and G. M. Xiao, Sustainable Energy Fuels, 2019, 3, 390–395 RSC.
- Z. Xu, Y. Yang, P. Yan, Z. Xia, X. Liu and Z. C. Zhang, RSC Adv., 2020, 10, 34732–34737 RSC.
- P. H. Hoang, N. M. Dat, T. D. Cuong and D. T. Tung, RSC Adv., 2020, 10, 13489–13495 RSC.
- K. T. V. Rao, S. Souzanchi, Z. S. Yuan, M. B. Ray and C. B. Xu, RSC Adv., 2017, 7, 48501–48511 RSC.
- Y. Hirano, J. N. Beltramini, A. Mori, M. Nakamura, M. R. Karim, Y. Kim, M. Nakamura and S. Hayami, RSC Adv., 2020, 10, 11727–11736 RSC.
- J. Tan, H. Wang, L. Ma, C. Wang, Q. Liu, Q. Zhang and M. He, RSC Adv., 2018, 8, 24534–24540 RSC.
- Z. H. Li, K. M. Su, J. Ren, D. J. Yang, B. W. Cheng, C. K. Kim and X. D. Yao, Green Chem., 2018, 20, 863–872 RSC.
- P. Tang and J. Yu, Ind. Eng. Chem. Res., 2014, 53, 11629–11637 CrossRef CAS.
Footnote |
| † Electronic supplementary information (ESI) available. See DOI: 10.1039/d1ra06002c |
| This journal is © The Royal Society of Chemistry 2021 |

