 Open Access Article
Electrospun cationic nanofiber membranes for adsorption and determination of Cr(VI) in aqueous solution: adsorption characteristics and discoloration mechanisms
Run Fang *ab,
Bing-Chiuan Shiuab,
Yuansong Yeab,
Yuchi Zhangab,
Hanyu Xueab,
Ching-Wen Louacdfg and
Jia-Horng Lin
 *acdef
aDepartment of Material and Chemical Engineering, Minjiang University, Fuzhou 350108, China. E-mail: jhlin@fcu.edu.tw; readfung@163.com; Tel: +886 4 24518661 Tel: +86 591 83761630
bFujian Engineering and Research Center of New Chinese Lacquer Materials, Fuzhou 350108, China
cInnovation Platform of Intelligent and Energy-Saving Textiles, School of Textile Science and Engineering, Tiangong University, Tianjin 300387, China
dAdvanced Medical Care and Protection Technology Research Center, College of Textile and Clothing, Qingdao University, Shandong 266071, China
eLaboratory of Fiber Application and Manufacturing, Department of Fiber and Composite Materials, Feng Chia University, Taichung 40724, Taiwan, China
fSchool of Chinese Medicine, China Medical University, Taichung 40402, Taiwan, China
gDepartment of Bioinformatics and Medical Engineering, Asia University, Taichung 41354, Taiwan, China
First published on 27th September 2021
Abstract
In this study, a novel cationic nanofiber membrane with various functional groups, good structural stability, and high adsorption capacity of Cr(VI) is presented. This nanofiber membrane is prepared by electrospinning a mixed aqueous solution of a cationic polycondensate (CP) and polyvinyl alcohol (PVA). With the aid of PVA, CP can be smoothly electrospun without using any organic solvents, and the cross-linking between CP and PVA improves the stability of membrane in acidic solution. Chemical and morphology characterization reveals that the CP/PVA membrane is composed of interwoven nanofibers that contain numerous cationic groups. Due to its high cationicity and hydrophilicity, the CP/PVA membrane shows great affinity for HCr2O7− and Cr2O72−. Adsorption experiments indicate that the CP/PVA membrane can remove Cr(VI) from simulated wastewater rapidly and efficiently in both batch and continuous mode. Besides, the presence of most coexisting ions will not interfere with the adsorption. Due to the redox reaction between the CP/PVA membrane and adsorbed Cr(VI), the CP/PVA membrane exhibits distinct color change after Cr(VI) adsorption and the discoloration is highly dependent on the adsorption amount. Therefore, in addition to serving as a highly efficient adsorbent, the CP/PVA membrane is also expected to be a convenient and low-cost method for semi-quantitative determination of Cr(VI) in wastewater.
1. Introduction
Plating, textile dyeing, and metal processing industries generate a considerable amount of chromium-containing wastewaters. Cr(VI) in the wastewaters is highly mobile and carcinogenic, which can be collected and transported along the food chain and cause permanent damage to the human body and plants.1 The large-scale Cr(VI) treatment usually consists of two steps: reduction and precipitation. Cr(VI) is first reduced to Cr(III) under acidic conditions by a reducing agent. Then, the pH of the wastewater is increased and the Cr(III) is turned into Cr(OH)3, which is thereafter removed by coagulation and precipitation.2 Nonetheless, this method inevitably creates a large quantity of mixed sludge containing multiple hydroxides, and brings troublesome secondary pollutions. To overcome the dilemma, many convenient and efficient processing techniques have been developed, such as electrochemical treatment, photocatalytic reduction, ion exchange, and adsorption.3–5 In particular, adsorption method has the advantages of low energy cost, easy operation process, and mild operation conditions, which can be either concurrently used with reduction-precipitation method or membrane separation, or used alone to deal with chromium-containing wastewater consisting of simple components. Therefore, numerous novel adsorbents for Cr(VI) removal, including modified biomass, graphene oxide, MOFs and nanoparticles, have been reported in recent years.6–10 Although some of them have extremely high adsorption capacity, the complex preparation process and high cost of raw materials restrict their large-scale application to a certain extent.Chromium-containing wastewater is usually acidic. Unlike most heavy metal ions, Cr(VI) is mainly present in HCr2O7− and Cr2O72− anion state in an acidic aqueous solution, and the adsorbents with cationic functional groups usually have high affinity for Cr(VI).11 Therefore, it is a simple and effective strategy to improve the adsorption capacity of Cr(VI) by designing the molecular structure of adsorbents based on electrostatic interaction. In addition to the design of chemical structure, the optimization of adsorbent morphology is another effective measure to improve the adsorption efficiency. Comparing to many lumpy, granular, or spherical adsorbents, nanofiber membranes made by electrospinning have larger specific surface areas and considerably high porosity. Moreover, a large diversity of functional groups can be immobilized onto nanofibers by means of grafting reaction.12 These characteristics significantly improve the adsorption capacity, water flux, and mass transfer rate of nanofiber membranes, facilitating the metal ion adsorption effectively.13,14 As a result, nanofiber membranes with cationic groups have become a research hotspot in the field of Cr(VI)-containing wastewater treatment.
Two main methods are commonly used for producing nanofiber membranes with adsorption capacity of Cr(VI). The first one is to prepare cationic nanofiber membranes directly by electrospinning polymers containing cationic groups. Chitosan and some cellulose derivatives are the most representative polymers for this method because they contain amine groups that can be protonated in acidic solution.15–18 However, the relatively low content of amine groups contained by these nanofiber membranes leads to fewer adsorption sites. So in many cases, chitosan and cellulose derivatives need to be further modified to achieve higher adsorption capacity of Cr(VI). Moreover, the poor stability of chitosan in strong acidic solution is also a problem affecting its practical application. The second method consists of two steps: the electrospinning of nanofibers and the modification of membranes. Polymers that have reactive groups like hydroxymethyl and cyano groups were electrospun to yield uncharged nanofiber membranes. Then, the membranes undergo surface modification and the functional groups that demonstrate strong affinity to metal ions, such as amine, thiol and carboxyl groups were immobilized on the fiber surface.19–23 Although abundant functional groups, including cationic groups, can be grafted on the surface of nanofibers by this method, complex operations, highly active monomers and precise condition control are needed to obtain the ideal modification effect.
In this study, we present a novel cationic nanofiber membrane with various functional groups, good stability in acidic solution, and high adsorption capacity of Cr(VI). This nanofiber membrane is prepared by directly electrospinning a mixed aqueous solution of a cationic polycondensate (CP) and polyvinyl alcohol (PVA). Different from most cationic polymers that are prepared by free radical polymerization/copolymerization or natural polymer modification, the proposed CP is synthesized by polycondensation using inexpensive and readily available monomers and could be readily grafted and cross-linked because of its abundant functional groups. With the aid of PVA, nanofiber membranes can be conveniently electrospun without using any organic solvents. In order to evaluate the potential application of CP/PVA membranes in the removal of Cr(VI) from wastewater, batch and continuous adsorption experiments were performed and the effect of solution pH, adsorption time, initial Cr(VI) concentration, and coexisting ions on the adsorption capacity were systematically studied. Finally, the discoloration phenomenon of CP/PVA membranes caused by Cr(VI) adsorption was also investigated.
2. Experimental
2.1 Materials
Triethylenetetramine, acetone, formaldehyde (37 wt% in aqueous solution), glutaraldehyde (GA, 50 wt% in aqueous solution), potassium polyvinyl sulfate (PVSK), diphenylcarbazide (DPC), polyvinyl alcohol (PVA-1799), Triton X-100, K2Cr2O7, CuCl2·2H2O, NiCl2·6H2O, ZnCl2, Na2SO4, NaNO3, and NaCl were of analytical or biochemical reagent grade and purchased from Aladdin Industrial Co., Ltd. The number average molecular weight (Mn) of PVA-1799 was about 75![[thin space (1/6-em)]](https://www.rsc.org/images/entities/char_2009.gif) 000 and the alcoholysis degree was 99%.
000 and the alcoholysis degree was 99%.
2.2 Preparation of CP/PVA nanofiber membranes
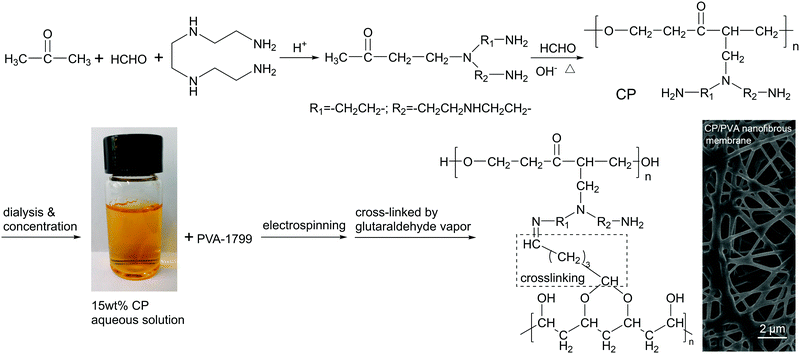
CP was synthesized using the aqueous polycondensation method described in our previous study.24 Firstly, triethylenetetramine (30 mL), formaldehyde (40 mL), and acetone (36 mL) were added to a three-necked flask equipped with a condensate reflux and a mechanical stirrer. Hydrochloric acid was then used to adjust pH = 3, and the mixtures were blended at room temperature for one hour to have intermediate products. Next, the second batch of formaldehyde (36 mL) was added and the mixtures were adjusted to pH = 8 with a sodium hydroxide solution. The mixtures were heated to 60 °C and kept for reaction for 40 min, thereby obtaining orange CP aqueous solutions. CP aqueous solutions were thereafter infused to a semi-permeable tubing, and the salt and oligomer in the solution were removed by dialysis in deionized water. Finally, the purified solutions were condensed to form CP solutions with a solid content 15 wt% and then used to formulate the electrospinning solutions.The CP solutions (20 mL) were infused into a conical flask that is placed in a water bath and heated to 85 °C, after which different amounts of PVA powders and 0.1 mL Triton X-100 were added and magnetically stirred until PVA is completely dissolved in the solutions. The solutions were left stand for 3 h and then electrospinning was conducted to produce nanofiber membranes with electrospinning voltage being 15.3 kV, a jet rate being 0.5 mL h−1, a collection distance being 10 cm, a humidity being 35 ± 5%, and a collection media being PET nonwoven fabrics. Afterwards, the nanofiber membranes were vacuum dried at 60 °C for 6 h and then placed in a desiccator, the bottom of which was added with 10 mL of GA. The GA vapor reacted with the amine and hydroxyl groups on CP and PVA for 12 h, expediting the inter-crosslinking between them.25,26 Finally, the nanofiber membranes were dried again and the crosslinked samples were used for subsequent experiments. Fig. 1 shows the preparation steps of CP/PVA membranes.
2.3 Characterization of CP/PVA membranes
Purified CP powders were dissolved in deionized water and the PVSK colloidal titration was employed to measure the cationicity as related to pH values.27 GPC (P230, Dalian Elite, China) was used to measure the molecular weight and molecular weight distribution of CP with Agilent PL aquagel-OH column. Modular Rheometer System (Mars60, Thermo Scientific, U.S.) was used to measure the viscosity of CP/PVA electrospining solutions as related to the CP/PVA ratio. The functional groups of cross-linked CP/PVA membranes as well as control samples were analyzed using FT-IR spectrometer (iS50, Thermo Nicolet, U.S.) in the region of 500–4000 cm−1 and the surface morphology was observed using SEM (SU8010, Hitachi, Japan). The CP/PVA membranes were cut into 10 × 100 mm long strips, and the tensile strength was measured at the speed of 10 mm min−1 using a universal testing machine (HT2402, Hungta, China).2.4 Batch adsorption and regeneration experiments
The dried K2Cr2O7 (0.2828 g) was weighed and dissolved in deionized water, formulating a stock solution with a specified volume being 1 L and a concentration being 100 mg L−1, which was used in the static adsorption experiments. To evaluate the removal ability of CP/PVA membranes toward real Cr(VI) wastewater, a Cr(VI) containing wastewater sample provided by an electroplating enterprise was also used in the experiments.During the adsorption experiments, 50 mL of K2Cr2O7 solution (50 mg L−1) or real wastewater was infused into a 250 mL flask, after which different mass of CP/PVA membranes were cut into 5 × 5 mm small pieces and added into the flask. Next, 0.5 mol L−1 HCl and NaOH solutions were used to adjust the pH value as desired and the flask was thereafter placed in a water bath shaker that operated at a rate of 150 rpm. The adsorption was performed for a certain length of time, and then the solution was filtered to have the post-adsorption solutions. With diphenylcarbazide being the chromogenic agent, a UV-Vis spectrophotometer (UV-2450, Shimadzu, Japan) was used to record the absorbance of the complex at 540 nm and the Cr(VI) concentration was calculated according to the standard curve.28. The equilibrium adsorption capacity qe (mg Cr(VI)/g dry membrane) was computed with the equation as follows:
 | (1) |
2.5 Continuous adsorption and discoloration phenomenon
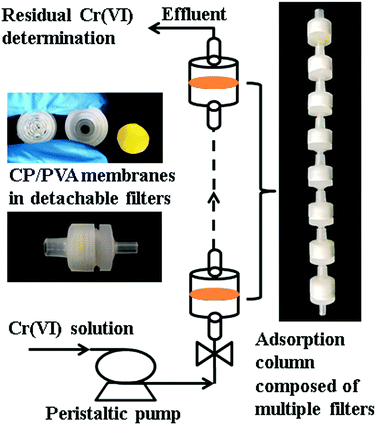
Continuous adsorption experiments were performed using a series of detachable filters, which are connected to form an adsorption column (Fig. 2). CP/PVA membranes were trimmed along with the substrate into circular specimens with a diameter of 14 mm and a mass of 8 mg, and packed in the filters. 10 mg L−1 of Cr(VI) solution was pumped upward through the filter column at a flow rate of 4 mL min−1 using a peristaltic pump. The concentration of residual Cr(VI) in the effluent was determined regularly and the breakthrough curves were thereafter plotted. The amount of adsorbed Cr(VI) per gram of dry membrane at bed exhaustion, qexh (mg g−1) was calculated according to the following equation:
 | (2) |
 | (3) |
3. Results and discussion
3.1 Chemical and morphology characterizations
GPC analysis indicated that CP had a number-average molecular weight (Mn) being 10![[thin space (1/6-em)]](https://www.rsc.org/images/entities/char_2009.gif) 300, a weight-average molecular weight (Mw) being 18
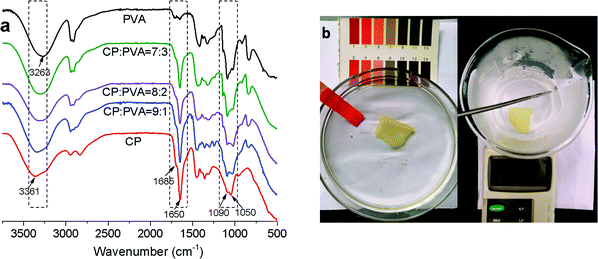
300, a weight-average molecular weight (Mw) being 18![[thin space (1/6-em)]](https://www.rsc.org/images/entities/char_2009.gif) 100, and a polydispersity coefficient (Mw/Mn) being 1.76. Although CP has a lower molecular weight, the molecular structure shown in Fig. 1 indicates that it contains many polar groups, including amine, hydroxyl, carbonyl, and ether bond. Fig. 3a compares the FT-IR spectra of CP/PVA membranes as related to the CP/PVA ratio. The adsorption peaks at 1090 and 1050 cm−1 are attributed to C–O stretching vibration of hydroxyl and C–N stretching vibration of amine, respectively. The relative intensity of C–O peak decreases with increasing CP content, while that of C–N peak increases simultaneously. Meanwhile, the adsorption peak at 3200–3400 cm−1 shifts toward high wavenumbers. These characteristic peaks indicate that CP/PVA membranes contain a large quantity of –OH and –NH2 and the peak intensity variation indicates that a rise in the CP ratio has a positive influence on the –NH2 content of the membranes.29 Comparing to pure PVA membrane, the CP/PVA membranes exhibit characteristic absorption peaks at 1650 and 1685 cm−1, corresponding to N–H bending and C
100, and a polydispersity coefficient (Mw/Mn) being 1.76. Although CP has a lower molecular weight, the molecular structure shown in Fig. 1 indicates that it contains many polar groups, including amine, hydroxyl, carbonyl, and ether bond. Fig. 3a compares the FT-IR spectra of CP/PVA membranes as related to the CP/PVA ratio. The adsorption peaks at 1090 and 1050 cm−1 are attributed to C–O stretching vibration of hydroxyl and C–N stretching vibration of amine, respectively. The relative intensity of C–O peak decreases with increasing CP content, while that of C–N peak increases simultaneously. Meanwhile, the adsorption peak at 3200–3400 cm−1 shifts toward high wavenumbers. These characteristic peaks indicate that CP/PVA membranes contain a large quantity of –OH and –NH2 and the peak intensity variation indicates that a rise in the CP ratio has a positive influence on the –NH2 content of the membranes.29 Comparing to pure PVA membrane, the CP/PVA membranes exhibit characteristic absorption peaks at 1650 and 1685 cm−1, corresponding to N–H bending and C![[double bond, length as m-dash]](https://www.rsc.org/images/entities/char_e001.gif) N stretching vibrations, respectively, and the latter of which is caused by GA cross-linking.30,31 Therefore, the combine of CP and PVA involves physical blending and chemical cross-linking, which improved the stability of the composite membranes.16 Fig. 3b shows the good structural stability of CP/PVA membranes, which are free from dissolution, rupture and shrinkage in HCl solution at pH = 1 or in hot water at 60 °C.
N stretching vibrations, respectively, and the latter of which is caused by GA cross-linking.30,31 Therefore, the combine of CP and PVA involves physical blending and chemical cross-linking, which improved the stability of the composite membranes.16 Fig. 3b shows the good structural stability of CP/PVA membranes, which are free from dissolution, rupture and shrinkage in HCl solution at pH = 1 or in hot water at 60 °C.
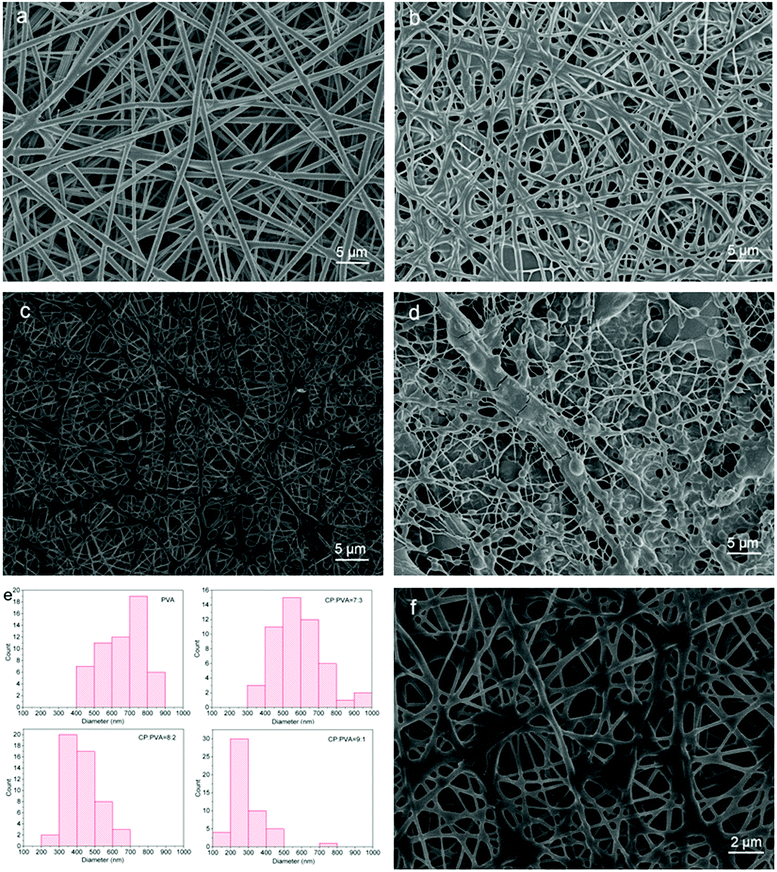
SEM images in Fig. 4 show the morphology of CP/PVA membranes with different CP/PVA ratio. PVA has an Mn being 75![[thin space (1/6-em)]](https://www.rsc.org/images/entities/char_2009.gif) 000 and an alcoholysis degree being 99%. An appropriate molecular weight and drastic hydrogen bond effect provide a PVA aqueous solution with a higher viscosity and a good spinnability. Fig. 4a shows the morphology of pure PVA nanofiber membrane, which is composed of randomly interleaving nanofibers without distinct defects or conglutination. By contrast, CP is a low molecular weight polycondensate with a Mn being 10
000 and an alcoholysis degree being 99%. An appropriate molecular weight and drastic hydrogen bond effect provide a PVA aqueous solution with a higher viscosity and a good spinnability. Fig. 4a shows the morphology of pure PVA nanofiber membrane, which is composed of randomly interleaving nanofibers without distinct defects or conglutination. By contrast, CP is a low molecular weight polycondensate with a Mn being 10![[thin space (1/6-em)]](https://www.rsc.org/images/entities/char_2009.gif) 300, and the interaction force between CP molecules is lower. As a result, the viscosity of 15 wt% CP solution is only about 20 mPa s, and the pure CP solution can only be drawn to form electrostatic atomization droplets instead of nanofibers. However, it was found that the viscosity of the spinning solution increased significantly with the addition of PVA. The viscosity of the CP/PVA mixed solution with mass ratio of 8
300, and the interaction force between CP molecules is lower. As a result, the viscosity of 15 wt% CP solution is only about 20 mPa s, and the pure CP solution can only be drawn to form electrostatic atomization droplets instead of nanofibers. However, it was found that the viscosity of the spinning solution increased significantly with the addition of PVA. The viscosity of the CP/PVA mixed solution with mass ratio of 8![[thin space (1/6-em)]](https://www.rsc.org/images/entities/char_2009.gif) :
:![[thin space (1/6-em)]](https://www.rsc.org/images/entities/char_2009.gif) 2 and 7
2 and 7![[thin space (1/6-em)]](https://www.rsc.org/images/entities/char_2009.gif) :
:![[thin space (1/6-em)]](https://www.rsc.org/images/entities/char_2009.gif) 3 reached 315 and 525 mPa s, respectively. Fig. 4b, c and d show the SEM images of CP/PVA membranes with corresponding CP/PVA ratio of 7
3 reached 315 and 525 mPa s, respectively. Fig. 4b, c and d show the SEM images of CP/PVA membranes with corresponding CP/PVA ratio of 7![[thin space (1/6-em)]](https://www.rsc.org/images/entities/char_2009.gif) :
:![[thin space (1/6-em)]](https://www.rsc.org/images/entities/char_2009.gif) 3, 8
3, 8![[thin space (1/6-em)]](https://www.rsc.org/images/entities/char_2009.gif) :
:![[thin space (1/6-em)]](https://www.rsc.org/images/entities/char_2009.gif) 2, and 9
2, and 9![[thin space (1/6-em)]](https://www.rsc.org/images/entities/char_2009.gif) :
:![[thin space (1/6-em)]](https://www.rsc.org/images/entities/char_2009.gif) 1. A constant increase in CP ratio changes the morphology of nanofibers significantly, particularly an increasing level of conglutination where nanofibers cross. In Fig. 4d, the flake-like conglutinations almost block the pores of the membranes while lots of breakage can be observed on the nanofibers. Meanwhile, the diameter of the nanofibers decreases constantly as shown in Fig. 4e. The diameter is 668.5 ± 131.7, 582.4 ± 141.1, 428.6 ± 103.9, and 284.6 ± 105.4 nm for Fig. 4a, b, c and d, respectively. Therefore, although the rise of CP proportion will increase the number of amine groups and the adsorption capacity of nanofiber membranes, it will concurrently reduce the viscosity and spinnability of the spinning solutions, thus hindering the formation of the porous structure and network morphology of the nanofiber membranes. Fig. 4f is the magnified image of the 8
1. A constant increase in CP ratio changes the morphology of nanofibers significantly, particularly an increasing level of conglutination where nanofibers cross. In Fig. 4d, the flake-like conglutinations almost block the pores of the membranes while lots of breakage can be observed on the nanofibers. Meanwhile, the diameter of the nanofibers decreases constantly as shown in Fig. 4e. The diameter is 668.5 ± 131.7, 582.4 ± 141.1, 428.6 ± 103.9, and 284.6 ± 105.4 nm for Fig. 4a, b, c and d, respectively. Therefore, although the rise of CP proportion will increase the number of amine groups and the adsorption capacity of nanofiber membranes, it will concurrently reduce the viscosity and spinnability of the spinning solutions, thus hindering the formation of the porous structure and network morphology of the nanofiber membranes. Fig. 4f is the magnified image of the 8![[thin space (1/6-em)]](https://www.rsc.org/images/entities/char_2009.gif) :
:![[thin space (1/6-em)]](https://www.rsc.org/images/entities/char_2009.gif) 2 CP/PVA membrane sample. In spite of the existence of a few conglutinations, the membrane retains an intact network structure and a uniform pore distribution, achieving a good balance between the nanofiber structure and the content of cationic groups. In addition, the tensile strength of 8
2 CP/PVA membrane sample. In spite of the existence of a few conglutinations, the membrane retains an intact network structure and a uniform pore distribution, achieving a good balance between the nanofiber structure and the content of cationic groups. In addition, the tensile strength of 8![[thin space (1/6-em)]](https://www.rsc.org/images/entities/char_2009.gif) :
:![[thin space (1/6-em)]](https://www.rsc.org/images/entities/char_2009.gif) 2 CP/PVA membrane is 0.87 MPa, which can meet the requirements of batch and continuous adsorption applications. In this regard, this sample was selected for further studies.
2 CP/PVA membrane is 0.87 MPa, which can meet the requirements of batch and continuous adsorption applications. In this regard, this sample was selected for further studies.
3.2 Batch adsorption study
![[thin space (1/6-em)]](https://www.rsc.org/images/entities/char_2009.gif) :
:![[thin space (1/6-em)]](https://www.rsc.org/images/entities/char_2009.gif) 2 CP/PVA membrane was calculated to have a cationicity of 3.1, 2.8, and 0.9 mmol g−1. These results indicate that CP/PVA membranes carry considerable amount of cationic groups in acidic condition, and the cationicity declines significantly in alkaline environment. Fig. 1 and 3 show that there are numerous Et–NH2, Et2–NH and Et3–N groups on the molecular chains of CP/PVA nanofibers. It can be found in the Bordwell pKa table that the pKa of Et–N+H3 and Et3–N+H is approximately 10.6 and 10.75, respectively, indicating these amine groups can be protonated even in alkaline solutions. Therefore, the presence of cationic groups is attributed to the protonation of abundant amine groups on the nanofibers.32
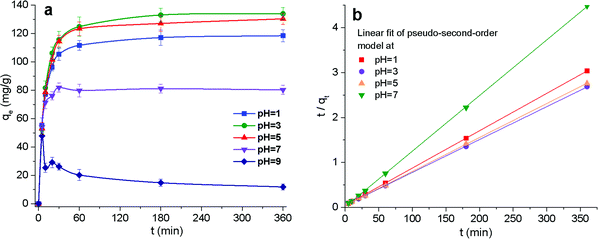
2 CP/PVA membrane was calculated to have a cationicity of 3.1, 2.8, and 0.9 mmol g−1. These results indicate that CP/PVA membranes carry considerable amount of cationic groups in acidic condition, and the cationicity declines significantly in alkaline environment. Fig. 1 and 3 show that there are numerous Et–NH2, Et2–NH and Et3–N groups on the molecular chains of CP/PVA nanofibers. It can be found in the Bordwell pKa table that the pKa of Et–N+H3 and Et3–N+H is approximately 10.6 and 10.75, respectively, indicating these amine groups can be protonated even in alkaline solutions. Therefore, the presence of cationic groups is attributed to the protonation of abundant amine groups on the nanofibers.32Studies revealed that Cr(VI) existed in the form of HCr2O7− and Cr2O72− in acidic aqueous solutions and CrO42− in weakly alkaline conditions.33 Due to its high cationicity within a range of pH = 1–9, CP/PVA membranes have great affinity for Cr(VI) via electrostatic attraction. Fig. 5a shows that CP/PVA nanofiber membranes can efficiently adsorb Cr(VI) from simulate wastewater in a broad pH range. Furthermore, the change of the maximum adsorption capacity is consistent with the variation of the cationicity at different pH, indicating that the adsorption capacity of CP/PVA membranes is highly dependent on the number of cationic groups, i.e. protonated amine groups. When the solution pH decreased from 9 to 1, the equilibrium adsorption capacity (qe) first increased and then decreased. In alkaline environment, the protonation of amine groups is constrained by excessive OH−, which leads to the reduction of cationic groups and adversely affects the adsorption of CrO42−. On the contrary, a large amount of H+ combine with amine groups, which increases the number of cationic groups and makes the molecular chain expand due to the electrostatic repulsion between the same charges. As a result, CP/PVA membranes can contact and adsorb Cr2O72− and HCr2O7− from wastewater readily.34 When the solution pH declines to 1, HCr2O7− and Cr2O72− gradually transform into H2CrO4, which weakens the electrostatic interaction and reduces the adsorption capacity, regardless of a great number of protonated amine groups.
As eqn (4) and (5), pseudo-first-order model and pseudo-second-order model are employed to investigate the adsorption behaviors of CP/PVA membranes.
 | (4) |
 | (5) |
By linear regression of the experimental data, the calculated model parameters along with the correlation coefficient values are listed in Table 1, where qe(exp) and qe(cal) are the experimental and the calculated theoretical adsorption capacity, respectively. Fig. 5b shows the fitting results of pseudo-second-order model. Obviously, pseudo-second-order model fits the experimental results well for R2 is close to 1 and the experimental data qe(exp) is very close to qe(cal). These results are consistent with the findings reported in other literatures where the adsorbents with saturated adsorption sites demonstrated similar kinetics characteristics.36–38 In the adsorption process, protonated amine groups are the active adsorption sites of CP/PVA membranes, which are significantly dependent on the CP/PVA ratio and solution pH, and reaches saturation gradually with increasing adsorption time.
| Solution pH | qe(exp) (mg g−1) | Pseudo-first-order model | Pseudo-second-order model | ||||
|---|---|---|---|---|---|---|---|
| k1 | qe(cal) (mg g−1) | R2 | k2 | qe(cal) (mg g−1) | R2 | ||
| 1 | 118.48 | 9.20 × 10⁻³ | 29.41 | 0.801 | 1.65 × 10⁻³ | 120.24 | 1.000 |
| 3 | 133.99 | 8.75 × 10⁻³ | 38.02 | 0.795 | 1.18 × 10⁻³ | 136.61 | 1.000 |
| 5 | 130.36 | 8.75 × 10⁻³ | 36.43 | 0.780 | 1.23 × 10⁻³ | 132.45 | 1.000 |
| 7 | 80.27 | 5.07 × 10⁻³ | 5.62 | 0.271 | 13.96 × 10⁻³ | 80.71 | 0.999 |
| 9 | 11.83 | 4.38 × 10⁻³ | 10.75 | 0.205 | −5.85 × 10⁻³ | 11.74 | 0.990 |
 | (6) |
 | (7) |
| Temperature (°C) | Langmuir model | Freundlich model | ||||
|---|---|---|---|---|---|---|
| qm (mg g−1) | kl | R2 | kf | n | R2 | |
| 15 | 162.07 | 0.375 | 0.995 | 103.03 | 10.41 | 0.956 |
| 25 | 156.08 | 0.263 | 0.992 | 90.82 | 9.01 | 0.929 |
| 35 | 148.59 | 0.270 | 0.994 | 85.46 | 8.62 | 0.958 |
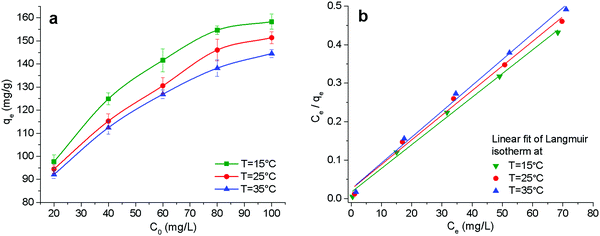
The electrostatic adsorption of heavy metal ions on many adsorbents also follows Langmuir isotherm model. Table 3 compares the maximum adsorption capacity of Cr(VI) by some novel adsorbents, such as GO/chitosan composites, MOFs, nanofibers and nanoparticles, under similar adsorption conditions. Comparatively, CP/PVA membrane exhibits higher adsorption capacity than most other adsorbents, which is primarily ascribed to its higher cationic group density and nanofiber network.
| Adsorbents | Maximum adsorption capacity (mg g−1) | References |
|---|---|---|
| Porous polyacrylonitrile/graphene oxide nanofibers | 382.5 | 39 |
| Triethylenetetramine modified graphene oxide/chitosan composite | 291.5 | 7 |
| Fe3O4-coated cellulose acetate/chitosan nanofibers | 193.2 | 18 |
| CP/PVA composite nanofibers | 162.1 | This work |
| Stacked chitosan nanofibers | 131.6 | 25 |
| Zinc-biochar nanocomposites | 102.7 | 40 |
| Chitosan/PMMA composite nanofibers | 92.5 | 41 |
| Thiol-modified cellulose nanofibers | 87.5 | 19 |
| PAN/polypyrrole core/shell nanofibers | 74.9 | 42 |
| Silver-triazolate MOF | 37.0 | 6 |
| Magnetic Fe3O4 nanoparticles | 34.9 | 43 |
| Amine-functionalized MCM-41 nanoparticles | 2.8 | 44 |
ΔG = −RT![[thin space (1/6-em)]](https://www.rsc.org/images/entities/char_2009.gif) ln ln![[thin space (1/6-em)]](https://www.rsc.org/images/entities/char_2009.gif) K K
| (8) |
 | (9) |
 | (10) |
| Temperature (K) | ΔG (kJ mol−1) | ΔH (kJ mol−1) | ΔS (J (mol−1 K−1)) |
|---|---|---|---|
| 288 K | −3.58 | −7.36 | −13.24 |
| 298 K | −3.34 | ||
| 308 K | −3.33 |
It can be seen in Table 4 that ΔG < 0 at three different temperatures, indicating that the Cr(VI) adsorption is a spontaneous process. ΔS < 0 means the decrease randomness at the solid–liquid interface while ΔH < 0 means that the adsorption involves an exothermic process. Therefore, a decrease in the reaction temperature promotes the adsorption of Cr(VI).
3.3 Continuous adsorption and discoloration phenomenon
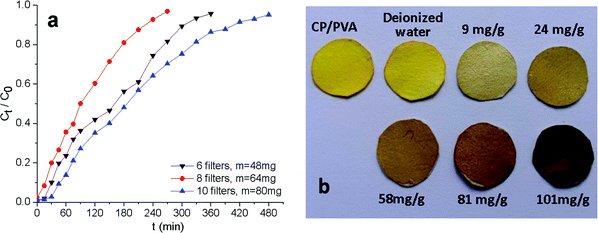
Continuous adsorption experiments were designed to further evaluate the potential practical application of CP/PVA membranes. In the experiments, CP/PVA membranes were trimmed into circular specimens and packed in the detachable PP filters. Several detachable filters were thereafter connected to form an adsorption column. The breakthrough curves were plotted in terms of normalized concentration Ct/C0 versus time for each experiment and presented in Fig. 8a. As illustrated in Fig. 8a, although the thickness of single membrane is only about 30 μm, Cr(VI) can still be effectively removed from wastewater by a series of CP/PVA membranes. When the adsorption column is composed of 10 filters, i.e. the dosage of CP/PVA membranes is 80 mg, the effluent concentration of Cr(VI) remains below 0.5 mg L−1 after continuous treatment for more than 30 min, which is within the limit set by Chinese environmental regulation GB8978-2002 for the discharge of industrial wastewater. According to eqn (2) and (3), the amounts of adsorbed Cr(VI) per gram of dry membrane at bed exhaustion are calculated to be 88.9, 100.6 and 101.7 mg g−1 for 6, 8 and 10 filters, respectively, indicating the applicability of CP/PVA membranes in both static and continuous adsorption modes. Moreover, the adsorption efficiency can be flexibly controlled by changing the number of filters to meet different treatment requirements, and the saturated membranes can also be easily replaced.During the experiments, it was found that CP/PVA membranes that adsorbed Cr(VI) changed the color after drying at 70 °C for 10 min. Fig. 8b demonstrates the discoloration of Cr(VI)-loaded CP/PVA membranes as related to the Cr(VI) adsorption amount. The original CP/PVA membrane and the control sample (deionized water) show the same color, whereas the experimental groups exhibit discoloration from yellowish to the dark brown corresponding to the increasing adsorption amount. The observation results indicate that the discoloration is highly correlated with Cr(VI) adsorption levels.
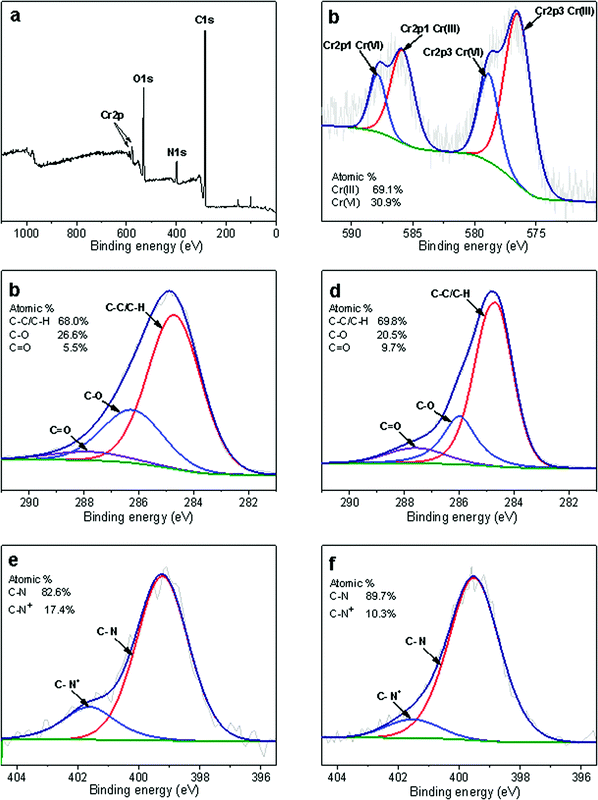
XPS can be used not only for the analysis of element types and valence states, but also for the semi-quantitative determination of the percentage content of different atoms.47 To further investigate the discoloration mechanisms, Cr(VI)-loaded CP/PVA membranes were examined for XPS analysis, and the spectra were shown in Fig. 9. In the survey spectrum as Fig. 9a, CP/PVA membrane exhibit two characteristic peaks at 577.1 and 587.1 eV after adsorption, which separately corresponds to Cr 2p1/2 and Cr 2p3/2, confirming the effective adsorption of Cr(VI) by CP/PVA membrane. Fig. 9b shows the Cr 2p spectrum where the Cr element exists in the forms of Cr(III) and Cr(VI), with a ratio of about 1![[thin space (1/6-em)]](https://www.rsc.org/images/entities/char_2009.gif) :
:![[thin space (1/6-em)]](https://www.rsc.org/images/entities/char_2009.gif) 2. It means that after being adsorbed and air-dried, Cr(VI) undergone a reduction reaction and a portion of it was reduced to Cr(III). Meanwhile, the obvious difference of C 1s spectra before and after adsorption in Fig. 9c and d also confirms the oxidation of CP/PVA membranes. In the spectra, three peaks at 284.6, 286.1 and 287.7 eV correspond to the carbon on saturated alkyl (C–C/C–H), the carbon on hydroxyl or ether bond (C–O), and the carbon on carbonyl (C
2. It means that after being adsorbed and air-dried, Cr(VI) undergone a reduction reaction and a portion of it was reduced to Cr(III). Meanwhile, the obvious difference of C 1s spectra before and after adsorption in Fig. 9c and d also confirms the oxidation of CP/PVA membranes. In the spectra, three peaks at 284.6, 286.1 and 287.7 eV correspond to the carbon on saturated alkyl (C–C/C–H), the carbon on hydroxyl or ether bond (C–O), and the carbon on carbonyl (C![[double bond, length as m-dash]](https://www.rsc.org/images/entities/char_e001.gif) O), respectively.48 Comparing to the blank sample, the proportion of C element in the form of C–O decreases significantly after Cr(VI) adsorption, while the proportion of C
O), respectively.48 Comparing to the blank sample, the proportion of C element in the form of C–O decreases significantly after Cr(VI) adsorption, while the proportion of C![[double bond, length as m-dash]](https://www.rsc.org/images/entities/char_e001.gif) O increases greatly. Therefore, it can be inferred that when Cr(VI) is reduced to Cr(III), some of the hydroxyl or ether bonds on CP/PVA membrane are oxidized into carbonyl or carboxyl, resulting in the increase of C
O increases greatly. Therefore, it can be inferred that when Cr(VI) is reduced to Cr(III), some of the hydroxyl or ether bonds on CP/PVA membrane are oxidized into carbonyl or carboxyl, resulting in the increase of C![[double bond, length as m-dash]](https://www.rsc.org/images/entities/char_e001.gif) O ratio.49 As a typical organic chromophore, the increase of C
O ratio.49 As a typical organic chromophore, the increase of C![[double bond, length as m-dash]](https://www.rsc.org/images/entities/char_e001.gif) O darkens the color of the membranes. At the same time, the reduction reaction produces dark green Cr2O3, which makes the color change of the membranes more obvious. These two factors may concurrently contribute to the color darkening of CP/PVA membranes, and both of them are in proportion to the adsorption amount of Cr(VI). Fig. 9e and f shows the N 1s spectra before and after adsorption. Two characteristic peaks corresponding to C–N and C–N+ can be observed at 399.4 and 401.6 eV, respectively, and the latter is derived from the protonation of amine groups.41 Although the binding energy of these two peaks do not change significantly after Cr(VI) adsorption, the relative content of C–N+ decreases significantly. This confirms that the protonated amine groups of CP/PVA membranes serve as the adsorption sites in the experiments.
O darkens the color of the membranes. At the same time, the reduction reaction produces dark green Cr2O3, which makes the color change of the membranes more obvious. These two factors may concurrently contribute to the color darkening of CP/PVA membranes, and both of them are in proportion to the adsorption amount of Cr(VI). Fig. 9e and f shows the N 1s spectra before and after adsorption. Two characteristic peaks corresponding to C–N and C–N+ can be observed at 399.4 and 401.6 eV, respectively, and the latter is derived from the protonation of amine groups.41 Although the binding energy of these two peaks do not change significantly after Cr(VI) adsorption, the relative content of C–N+ decreases significantly. This confirms that the protonated amine groups of CP/PVA membranes serve as the adsorption sites in the experiments.
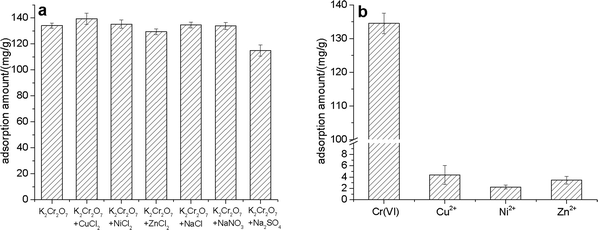
The commonly used Cr(VI) concentration measurement methods include ICP-MS, ICP-OES, and diphenylcarbazide spectrophotometry. However, these methods usually require sophisticated instruments and complex pretreatment. On the contrary, CP/PVA membrane provides a semi-quantitative measurement method without any complicated instrument and operation. The nanofiber structure and abundant function groups are helpful for the efficient enrichment of Cr(VI) in wastewater; the electrostatic repulsion among cations shields most of the interference caused by coexisting metal ions; and the stable chemical structure enables the membranes to be preserved and used easily. Therefore, apart from being a highly efficient adsorbent, CP/PVA membrane is also expected to be a convenient and low-cost method for semi-quantitative determination of Cr(VI) in wastewater.
4. Conclusions
In this study, a novel cationic nanofiber membrane was prepared by electrospinning a mixed aqueous solution of CP and PVA. As a cationic polycondensate, CP had high cationicity and abundant functional groups. The incorporation of PVA increased the viscosity and the spinnability of the composite electrospinning solution. With CP![[thin space (1/6-em)]](https://www.rsc.org/images/entities/char_2009.gif) :
:![[thin space (1/6-em)]](https://www.rsc.org/images/entities/char_2009.gif) PVA = 8
PVA = 8![[thin space (1/6-em)]](https://www.rsc.org/images/entities/char_2009.gif) :
:![[thin space (1/6-em)]](https://www.rsc.org/images/entities/char_2009.gif) 2, CP/PVA membranes achieved a good balance between the nanofiber structure and the content of cationic groups, which enabled the membranes to rapidly, massively, and selectively adsorb Cr(VI) from aqueous solutions over a wide range of pH. Equilibrium adsorption data showed good fit to Langmuir isotherm model and the maximum adsorption capacity reached 162.07 mg g−1 at pH = 3. The adsorption process followed pseudo-second-order model, achieving nearly 90% of the equilibrium adsorption capacity within 30 min. Besides, the adsorption of Cr(VI) was hardly affected by the coexisting metal ions. Due to the redox reaction between CP/PVA membrane and adsorbed Cr(VI), CP/PVA membrane exhibits distinct color change after Cr(VI) adsorption and the discoloration is highly dependent on the adsorption amount. Therefore, in addition to serving as a highly efficient adsorbent, CP/PVA membrane is also expected to be a convenient and low-cost method for semi-quantitative determination of Cr(VI) in wastewater.
2, CP/PVA membranes achieved a good balance between the nanofiber structure and the content of cationic groups, which enabled the membranes to rapidly, massively, and selectively adsorb Cr(VI) from aqueous solutions over a wide range of pH. Equilibrium adsorption data showed good fit to Langmuir isotherm model and the maximum adsorption capacity reached 162.07 mg g−1 at pH = 3. The adsorption process followed pseudo-second-order model, achieving nearly 90% of the equilibrium adsorption capacity within 30 min. Besides, the adsorption of Cr(VI) was hardly affected by the coexisting metal ions. Due to the redox reaction between CP/PVA membrane and adsorbed Cr(VI), CP/PVA membrane exhibits distinct color change after Cr(VI) adsorption and the discoloration is highly dependent on the adsorption amount. Therefore, in addition to serving as a highly efficient adsorbent, CP/PVA membrane is also expected to be a convenient and low-cost method for semi-quantitative determination of Cr(VI) in wastewater.
Conflicts of interest
There are no conflicts to declare.Acknowledgements
This work was financially supported by the Natural Science Foundation of Fujian Province of China (Grant No. 2019J01759, 2021J011021) and the Science and Technology Project of Fuzhou (Grant No. 2020-GX-4).References
- J. H. Li, C. L. Yao, Y. B. Liu, D. Li, B. Zhou and W. M. Cai, J. Hazard. Mater., 2012, 221–222, 56–61 CrossRef CAS PubMed.
- N. Daneshvar, D. Salari and S. Aber, J. Hazard. Mater., 2002, B94, 49–61 CrossRef.
- C. X. Zhang, Y. B. Sun, Z. Q. Yu, G. Y. Zhang and J. W. Feng, Chemosphere, 2018, 191, 527–536 CrossRef CAS PubMed.
- N. Abdullah, N. Yusof, W. J. Lau, J. Jaafar and A. F. Ismail, J. Ind. Eng. Chem., 2019, 76, 17–38 CrossRef CAS.
- M. Shirzad Siboni, M. T. Samadi, J. K. Yang and S. M. Lee, Environ. Technol., 2011, 32, 1573–1579 CrossRef CAS PubMed.
- L. L. Li, X. Q. Feng, R. P. Han, S. Q. Zang and G. Yang, J. Hazard. Mater., 2017, 321, 622–628 CrossRef CAS PubMed.
- H. C. Ge and Z. W. Ma, Carbohydr. Polym., 2015, 131, 280–287 CrossRef CAS PubMed.
- A. A. Babaei, M. Ahmadi, G. Goudarzi, N. Jaafarzadeh and Z. Baboli, Desalin. Water Treat., 2016, 57, 12244–12256 CrossRef CAS.
- C. Wang, C. Xiong, Y. L. He, C. Yang, X. T. Li, J. Z. Zheng and S. X. Wang, Chem. Eng. J., 2021, 415, 128923 CrossRef CAS.
- R. Zhao, Y. Y. Tian, S. Y. Li, T. T. Ma, H. T. Lei and G. S. Zhu, J. Mater. Chem. A, 2019, 7, 22559–22570 RSC.
- H. Gao, Y. G. Liu, G. M. Zeng, W. H. Xu, T. Li and W. B. Xia, J. Hazard. Mater., 2008, 150, 446–452 CrossRef CAS PubMed.
- P. Sagitha, C. R. Reshmi, S. P. Sundaran and A. Sujith, Eur. Polym. J., 2018, 105, 227–249 CrossRef CAS.
- D. Li and Y. Xia, Adv. Mater., 2004, 16, 1151–1170 CrossRef CAS.
- X. F. Wang and B. S. Hsiao, Curr. Opin. Chem. Eng., 2016, 12, 62–81 CrossRef.
- R. X. Wu, G. F. Zheng, W. W. Li, L. B. Zhong and Y. M. Zheng, J. Nanosci. Nanotechnol., 2018, 18, 5624–5635 CrossRef CAS PubMed.
- M. Aliabadi, M. Irani, J. Ismaeili, H. Piri and M. J. Parnian, Chem. Eng. J., 2013, 220, 237–243 CrossRef CAS.
- A. A. Taha, Y. N. Wu, H. T. Wang and F. T. Li, J. Environ. Manage., 2012, 112, 10–16 CrossRef CAS PubMed.
- A. Karamipour, P. K. Parsi, P. Zahedi and S. M. A. Moosavian, Int. J. Biol. Macromol., 2020, 154, 1132–1139 CrossRef CAS PubMed.
- R. Yang, K. B. Aubrecht, H. Y. Ma, R. Wang, R. B. Grubbs, B. S. Hsiao and B. Chu, Polymer, 2014, 55, 1167–1176 CrossRef CAS.
- J. J. Deng, X. J. Kang, L. Q. Chen, Y. Wang, Z. Z. Gu and Z. H. Lu, J. Hazard. Mater., 2011, 193, 187–193 CrossRef PubMed.
- H. Y. Ma, B. S. Hsiao and B. Chu, Curr. Org. Chem., 2013, 17, 1361–1370 CrossRef CAS.
- A. Almasian, M. Giahi, G. C. Fard, S. A. Dehdsat and L. Maleknia, Chem. Eng. J., 2018, 351, 1166–1178 CrossRef CAS.
- R. Zhao, Y. M. Li, X. Li, Y. Z. Li, B. L. Sun, S. Chao and C. Wang, J. Colloid Interface Sci., 2018, 514, 675–685 CrossRef CAS PubMed.
- R. Fang, W. X. He, H. Y. Xue and W. J. Chen, React. Funct. Polym., 2016, 102, 1–10 CrossRef CAS.
- L. Li, Y. X. Li, L. X. Cao and C. F. Yang, Carbohydr. Polym., 2015, 125, 206–213 CrossRef CAS PubMed.
- G. Z. Kyzas, N. K. Lazaridis and M. Kostoglou, Chem. Eng. J., 2014, 248, 327–336 CrossRef CAS.
- Q. Y. Yue, B. Y. Gao, Y. Wang, H. Zhang, X. Sun, S. G. Wang and R. R. Gu, J. Hazard. Mater., 2008, 152, 221–227 CrossRef CAS PubMed.
- R. B. Baird, A. D. Eaton and E. W. Rice, Standard Methods for the Examination of Water and Wastewater, APHA/AWWA/WEF, Washington, 23rd edn, 2017 Search PubMed.
- L. Jin and R. B. Bai, Langmuir, 2002, 18, 9765–9770 CrossRef CAS.
- A. A. Oladipo, M. Gazi and S. Saber-Samandari, J. Taiwan Inst. Chem. Eng., 2014, 45, 653–664 CrossRef CAS.
- R. Cheng, S. Ou, M. Li, Y. Li and B. Xiang, Ethylenediamine modified starch as biosorbent for acid dyes, J. Hazard. Mater., 2009, 172, 1665–1670 CrossRef CAS PubMed.
- Y. Liu, Y. Zheng and A. Q. Wang, J. Environ. Sci., 2010, 22, 486–493 CrossRef CAS.
- M. Q. Hu, H. Y. Shen, S. Ye, Y. Wang, J. L. Zhang and S. S. Lv, RSC Adv., 2018, 8, 10686–10697 RSC.
- L. Li, Y. X. Li and C. F. Yang, Carbohydr. Polym., 2016, 140, 299–307 CrossRef CAS PubMed.
- Y. S. Ho and G. McKay, Water Res., 2000, 34, 735–742 CrossRef CAS.
- K. Z. Elwakeel, A. A. Atia and E. Guibal, Bioresour. Technol., 2014, 160, 107–114 CrossRef CAS PubMed.
- F. K. Mahar, L. L. He, K. Wei, M. Mehdi, M. L. Zhu, J. Gu, K. Q. Zhang, Z. Khatri and I. Kim, Chemosphere, 2019, 225, 360–367 CrossRef CAS PubMed.
- H. Yan, J. Dai, Z. Yang, H. Yang and R. S. Cheng, Chem. Eng. J., 2011, 174, 586–594 CrossRef CAS.
- Z. Q. Feng, X. Yuan and T. Wang, Chem. Eng. J., 2020, 392, 123730 CrossRef CAS.
- C. Gan, Y. G. Liu, X. F. Tan, S. F. Wang, G. M. Zeng, B. H. Zheng, T. T. Li, Z. J. Jiang and W. Liu, RSC Adv., 2015, 5, 35107–35115 RSC.
- Z. Y. Li, T. T. Li, L. B. An, P. F. Fu, C. J. Gao and Z. M. Zhang, Carbohydr. Polym., 2016, 137, 119–126 CrossRef CAS PubMed.
- J. Q. Wang, K. Pan, Q. W. He and B. Cao, J. Hazard. Mater., 2013, 244–245, 121–129 CrossRef CAS PubMed.
- S. Rajput, C. U. Pittman Jr and D. Mohan, J. Colloid Interface Sci., 2016, 468, 334–346 CrossRef CAS PubMed.
- Y. X. Bao, X. M. Yan, W. Du, X. N. Xie, Z. Q. Pan, J. L. Zhou and L. S. Li, Chem. Eng. J., 2015, 281, 460–467 CrossRef CAS.
- B. Q. Ren, L. Y. Zhao, Y. L. Wang, X. X. Song, Y. Jin, F. J. Ouyang, C. W. Cui and H. W. Zhang, RSC Adv., 2021, 11, 7704–7712 RSC.
- Y. Nakano, K. Takeshita and T. Tsutsumi, Water Res., 2001, 35, 496–500 CrossRef CAS PubMed.
- R. F. Nie, M. Miao, W. C. Du, J. J. Shi, Y. C. Liu and Z. Y. Hou, Appl. Catal., B, 2016, 180, 607–613 CrossRef CAS.
- L. P. Zhu, Z. Yi, F. Liu, X. Z. Wei, B. K. Zhu and Y. Y. Xu, Eur. Polym. J., 2008, 44, 1907–1914 CrossRef CAS.
- R. Zhao, X. Li, B. L. Sun, H. Ji and C. Wang, J. Colloid Interface Sci., 2017, 487, 297–309 CrossRef CAS PubMed.
| This journal is © The Royal Society of Chemistry 2021 |

