
 Open Access Article
 This Open Access Article is licensed under a Creative Commons Attribution-Non Commercial 3.0 Unported Licence
Growth of narrow-bandgap Cl-doped carbon nitride nanofibers on carbon nitride nanosheets for high-efficiency photocatalytic H2O2 generation†
Tingshuo Jia,
Yanzhen Guo *b,
Huili Liub,
Binbin Changb,
Xuefeng Wei*a and
Baocheng Yang*b
*b,
Huili Liub,
Binbin Changb,
Xuefeng Wei*a and
Baocheng Yang*b
aCollege of Chemical Engineering & Pharmaceutics, Henan University of Science and Technology, Luoyang, 471023, PR China
bHenan Provincial Key Laboratory of Nanocomposites and Applications, Institute of Nanostructured Functional Materials, Huanghe Science and Technology College, Zhengzhou 450006, China. E-mail: baochengyang@infm.hhstu.edu.cn
First published on 22nd September 2021
Abstract
Heterojunction construction has been proved to be an effective way to enhance photocatalysis performance. In this work, Cl-doped carbon nitride nanofibers (Cl–CNF) with broadband light harvesting capacity were in situ grown on carbon nitride nanosheets (CNS) by a facile hydrothermal method to construct a type II heterojunction. Benefiting from the joint effect of the improved charge carriers separation efficiency and a broadened visible light absorption range, the optimal heterostructure of Cl–CNF/CNS exhibits a H2O2 evolution rate of 247.5 μmol g−1 h−1 under visible light irradiation, which is 3.4 and 3.1 times as much as those of Cl–CNF (72.2 μmol g−1 h−1) and CNS (80.2 μmol g−1 h−1), respectively. Particularly, the heterojunction nanostructure displays an apparent quantum efficiency of 23.67% at 420 nm. Photoluminescence spectra and photocurrent measurements both verified the enhanced charge carriers separation ability. Our work provides a green and environmentally friendly strategy for H2O2 production by elaborate nanostructure design.
1. Introduction
H2O2, as an important chemical reagent, has been widely used in medical disinfection, industrial production, daily sterilization and decontamination.1,2 In addition, due to its high energy density (2.1 MJ kg−1 for 60% aqueous H2O2), harmless products emission and convenient storage and transportation conditions, H2O2 is regarded as a promising energy carrier.3,4 H2O2 has also been added as a favorable electron acceptor to boost charge carrier separation to enhance the photocatalytic performance of photocatalysts.5–7 At present, H2O2 is predominantly prepared by industrial oxidation of anthraquinone, which currently accounts for more than 95% of the total production of H2O2. However, the anthraquinone oxidation method is environmentally hazardous, and consumes extensive energy. Therefore, it is urgent to develop an environmentally friendly and low energy consumption method for H2O2 synthesis.8 Photocatalysis, which is driven by solar energy, has been considered to be one of the effective ways to solve the energy and environmental crisis.9 Among various kinds of photocatalyst, g-C3N4, because of its unique features, such as a suitable bandgap for light harvesting, facile preparation process, favorable heat and chemical stability and metal-free characteristics,10–12 has attracted extensive interest in photocatalytic production of H2 (ref. 13–16) and H2O2,17–19 nitrogen fixation,20–22 organic pollutants decomposition,23–25 CO2 reduction26–28 and organic reactions.29,30 However, several shortcomings, such as a narrow light absorption range, serious recombination of photogenerated charge carriers and low surface charge transfer efficiency still exist in g-C3N4, which limit its photocatalytic activity.31–34Based on the above problems, a lot of methods have been employed to improve the photocatalytic performance, including defect construction, heteroatom doping, morphology optimization, etc.35–40 For example, the photocatalytic H2O2 generation activity was significantly enhanced by constructing carbon vacancies18 or nitrogen vacancies19 on the surface of g-C3N4 due to the improved light harvesting capacity. Heteroatom doping, for example, Fe and non-metal S, P doping, has been proved to be an effective approach to boost the photocatalytic hydrogen generation activity and pollutants degradation.5–7,33,41 Similarly, the halogen (F, Cl and Br)-doped photocatalysts exhibited some advantages of improving optical absorption, promoting charge migration and tuning band positions for photocatalytic applications.42 However, the photoexcited charge carriers recombination problem is always difficult to be alleviated in single-component photocatalyst. Accordingly, heterojunction construction is developed and has been proved to be an effective strategy to inhibit the recombination of charge carriers during photocatalysis process.
Among different types of heterojunction, the type II heterojunction can take both advantages of the two semiconductors to broaden the light absorption range. Moreover, the staggered band structure in type II heterojunction is supposed to be favorable for charge carriers separation, thus is ideal for enhancing photocatalytic performance. Polymeric graphitic carbon nitride has been reported to combine with an all-inorganic cesium lead halide perovskite (CsPbBrCl2) to prepare a type II heterojunction.43 Due to the delay of the photogenerated electron–hole pairs recombination, the synthesized hybrid presented remarkably improved performance in toxic cationic and anionic dyes degradation as compared to individual building units. Hao et al. reported on the preparation of a ZnS/g-C3N4 heterostructure with abundant zinc vacancy defects modified on the surface of ZnS.44 The heterostructure possessed expanded light absorption range according to its absorption spectra. Moreover, the staggered band structure and large number of zinc vacancies could boost the separation of photogenerated charge carriers. Due to the joint effect of broadened light absorption capacity and boosted charge carriers separation ability, the photocatalytic hydrogen production activity of ZnS/g-C3N4 is more than 30 times than that of pure g-C3N4. The calculation results by Wei et al. also show that the formation of g-C3N4/r-TiO2 heterojunction can expand its absorption range toward visible light.45 In addition, the staggered alignments of band structure and built-in electric field could efficiently promote the separation of photoinduced electron–hole pairs, therefore leading to an improved H2S splitting performance. Particularly, the 1D/2D heterostructure could realize the unique dimensionality-dependent advantages of rapid carrier transfer along the 1D nanostructures and superior electron mobility of 2D materials and simultaneously alleviate the drawbacks of the single units, such as the low surface area of 1D nanofibers and the tendency of 2D nanosheets toward restacking.46 Combining the advantages of doping and heterojunction, the construction of Cl-doped carbon nitride nanofibers on carbon nitride nanosheets is expected to show superior photocatalytic activity.
Herein, we fabricated a type II heterojunction nanostructure by growing narrow-bandgap 1D Cl–CNF on 2D CNS via a simple hydrothermal synthesis procedure. A variety of characterization methods were applied to verify the formation of the heterostructure. The light absorption ability of the heterostructure was improved because of the introduction of Cl–CNF, which exhibits broadband light harvesting capacity. In addition, the photoluminescence spectra and photocurrent measurements jointly demonstrated that the charge carriers generation and separation ability was significantly enhanced in the heterojunction. Therefore, a H2O2 generation rate of 247.5 μmol g−1 h−1 was obtained in the optimal sample of Cl–CNF/CNS under visible light irradiation (λ > 420 nm), which is 3.4 and 3.1 times as much as those of single-component Cl–CNF (72.2 μmol g−1 h−1) and CNS (80.2 μmol g−1 h−1), respectively. Especially, the optimal type II heterojunction nanostructure achieves an apparent quantum efficiency of 23.67% at 420 nm benefiting by the synergistic effect the Cl–CNF and CNS.
2. Experimental
2.1. Preparation of the photocatalysts
The CNS powder was prepared by polymerization of dicyandiamide in air, accompanied by using ammonium chloride as a gas template.31 Typically, dicyandiamide (2 g) and ammonium chloride (10 g) were first ground in a mortar to mix homogeneously and then the mixture was transferred to a covered crucible. The thermal condensation was accomplished by heating the crucible in a muffle furnace with a heating rate of 1 °C min−1 and a maintaining temperature of 550 °C for 3 h. To prepare a uniformly-distributed heterojunction nanostructure, the CNS sample should be acidified in advance. The acidification of CNS was proceeded by adding the CNS powder (0.5 g) into a hydrochloric acid aqueous solution (30 mL, 3 mol L−1). The mixture was stirred for 12 h to make sure the acidification was finished completely. Then the dispersion was centrifuged and washed with water for several times until the pH of the supernatant is close to neutral. The acidified powder was finally collected after drying the precipitate in an oven. For comparison, melamine-derived carbon nitride and dicyandiamide-derived carbon nitride were prepared under the same preparation condition as that of CNS by polymerization of sole dicyandiamide and melamine, respectively.The narrow-bandgap Cl–CNF semiconductor with broadband light harvesting capacity was prepared by a hydrothermal method according to a previous report.35 Typically, melamine (0.252 g) and cyanuric chloride (0.738 g) were added into acetonitrile solution (30 mL) in sequence, and then the mixture was stirred for 24 h at room temperature and hydrothermally reacted for another 24 h at 180 °C. The precipitate was collected and respectively washed with water and ethanol for several times to remove the impurities on the catalyst surface. Finally, the precipitate was dried in an oven at 60 °C.
The Cl–CNF/CNS nanohybrids were prepared under the same hydrothermal condition with that of Cl–CNF, except for the introduction of acidified CNS. After the acetonitrile solution containing melamine and cyanuric chloride was stirred for 12 h, acidified CNS was added and then the mixture was stirred for another 12 h to ensure that the Cl–CNF precursors were uniformly adsorbed on the acidified CNS nanosheets surface. The Cl–CNF/CNS samples were then obtained after the suspension mixture hydrothermally reacted at 180 °C for 24 h. The grafting density of Cl–CNF on the CNS surface can be adjusted by changing the addition amount of acidified CNS. In the abbreviation of Cl–CNF/CNS-x, x is the addition mass of acidified CNS. Unless otherwise specially mentioned, the Cl–CNF/CNS sample represents Cl–CNF/CNS-0.4. As control samples, Cl–CNF/melamine-derived carbon nitride and Cl–CNF/dicyandiamide-derived carbon nitride with carbon nitride addition amount of 0.4 g were prepared similarly with that of Cl–CNF/CNS for H2O2 generation.
2.2. Characterizations
The surface charges of the samples and precursors were measured by their zeta potentials on Zetasizer Nano (Malvern Instruments) in their reaction solutions. The morphologies of the samples were investigated on scanning electron microscope (SEM, Quanta 250 FEG FEI) equipped with an energy-dispersive X-ray (EDX) detector and transmission electron microscope (TEM) (Tecnai G2 20 TEM) with an accelerating voltage of 200 kV. The light harvesting capacities of the samples were characterized by their absorption spectra on a Hitachi ultraviolet/visible/near-infrared (UV-vis-NIR) spectrophotometer equipped with an integrating sphere with BaSO4 as a base. The crystalline characteristics of the samples were investigated by collecting their X-ray diffraction (XRD) patterns on a Bruker D8 Advance diffractometer with tube voltage and current of 40 kV and 40 mA, respectively. The Fourier transform infrared (FTIR) spectra of the samples were collected on a Thermo Scientific Nicolet iS5 infrared spectrophotometer using potassium bromide pellet technique. X-ray photoelectron spectroscopy (XPS) measurements were recorded on an Escalab 250 Xi (Thermo Fisher Scientific) system with Al Kα (hν = 1486.6 eV) as the X-ray source. The photoluminescence (PL) measurements (Hitachi F-4600 spectrophotometer) were carried out to investigate the radiative recombination of the photogenerated charge carriers. The transient-state photoluminescence (TRPL) spectra were recorded on Edinburgh Instruments FLS980 spectrophotometer with excitation and emission wavelength of 350 and 455 nm, respectively. N2 adsorption–desorption isotherms, which were used to calculate the Brunauer–Emmett–Teller (BET) specific surface areas, were collected on a Micromeritics ASAP 2020 analyzer.2.3. Photocatalytic performance measurements
The photocatalytic performances of the photocatalysts were evaluated through the photogeneration of H2O2 in a photoreactor by employing a 300 W Xe lamp (CEL-HXF300, CEAULIGHT, Beijing, China) equipped with a cut-off filter of 420 nm as the light source. Typically, the photocatalyst (50 mg) was first dispersed into an ethanol aqueous solution (50 mL, 10 vol% ethanol in deionized water). The mixture was subjected to ultrasonic treatment for 10 min to obtain a uniformly mixed suspension, and then bubbled with O2 for 20 min to create an oxygen-rich environment under stirring before light was turned on. During photocatalytic reaction process, every 1.5 mL of the reaction solution was taken out after 0, 0.5, 1.0, 1.5 and 2.0 h of light irradiation, respectively. The concentration of H2O2 generated in the reaction solution was determined by a Ce(SO4)2 titration method1 based on that yellow Ce4+ solution can be reduced by H2O2 to colorless Ce3+ solution: 2Ce4+ + H2O2 → 2Ce3+ + 2H+ + O2. The generation of H2O2 can therefore be quantificationally calculated by the decrease amount of Ce4+. Moreover, the evolution amount of H2O2 under monochromatic light was measured with a bandpass filter under the same reaction condition. The power intensity of monochromatic light was measured with an optical power meter (CEL-NP2000-2, CEAULIGHT, Beijing, China). The apparent quantum yield (AQY) was estimated by the H2O2 amount generated under monochromatic light and corresponding power density according to the equation: AQY (%) = (number of reacted electrons/number of incident photons) × 100 = (2 × number of produced H2O2 molecules)/(number of incident photons) × 100.2.4. Photoelectrochemical measurements
The photoelectrochemical measurements were carried out on a CHI 760E electrochemical workstation (Shanghai Chenghua) by using a standard three-electrode system, in which the sample electrode, the Ag/AgCl electrode and the Pt plate electrode were served as the working electrode, the reference electrode and the counter electrode, respectively. Notably, the working electrode was prepared by deposition of photocatalyst suspension (10 mg mL−1 in 5.0 vol% Nafion ethanol solution) on a cleaned fluorine-doped tin oxide (FTO) glass substrate with a surface area of 1 × 1 cm2. The aqueous Na2SO4 solution (0.5 M, pH = 6.6) was used as electrolyte.47 The normal hydrogen electrode (NHE at pH = 0) can be converted from the reference electrode potential (vs. Ag/AgCl) according to ENHE = EAg/AgCl + 0.059 × pH + E0Ag/AgCl, where E0Ag/AgCl is 0.198 V at 25 °C.48 The Mott–Schottky curves for flat potential confirmation were measured by impedance-potential method. The photocurrents were measured at a potential of 0.2 V (vs. Ag/AgCl) under on-off visible light irradiation. The electrochemical impedance spectroscopy (EIS) tests were performed in the frequency range of 0.01 Hz to 100 kHz.3. Results and discussion
3.1. Morphology, structure and property
The Cl–CNF/CNS heterostructure was synthesized by an in situ hydrothermal method in the presence of acidified CNS (Scheme 1). Due to the high negative potential of cyanuric chloride, the CNF precursors cannot be well adsorbed onto the negative-charged CNS surface (Fig. S1†). We therefore acidified CNS by HCl to change its surface potential (sample acidified CNS in Fig. S1†) in advance to ensure the adsorption of the Cl–CNF precursors. Pure Cl–CNF and CNS were also prepared for control experiments. As shown in Fig. 1a, the Cl–CNF sample synthesized by hydrothermal method exhibits a fibrous nanostructure with a diameter of about tens of nanometers and a length of several hundred nanometers. The EDX spectrum of Cl–CNF verified the successful doping of Cl element in the framework (Fig. S2†). The doping of Cl has been reported to be beneficial to adjust the energy band structure and inhibit the recombination of photogenerated charge carriers,40,49 thus endow Cl–CNF with broadband spectral response. The CNS sample, obtained by calcining a mixture of dicyandiamide and ammonium chloride, exhibits wrinkled nanosheet characteristic (Fig. 1b). The sheet-like CNS surface can enlarge its specific surface area and provide sufficient space for Cl–CNF anchoring.25 No Cl element was observed in the EDX spectrum of CNS (Fig. S2†), indicating ammonium chloride worked as a gas template other than a dopant during the calcination process.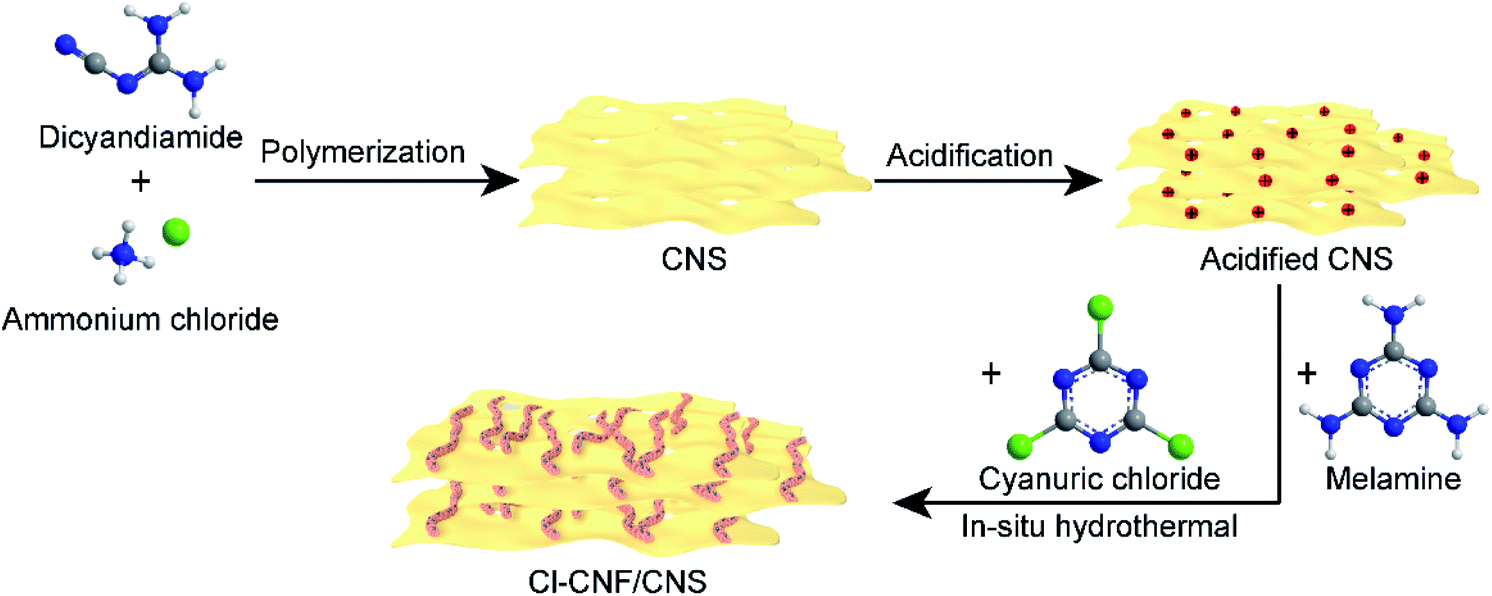 | ||
| Scheme 1 Schematic illustration for the synthesis of the heterostructure. | ||
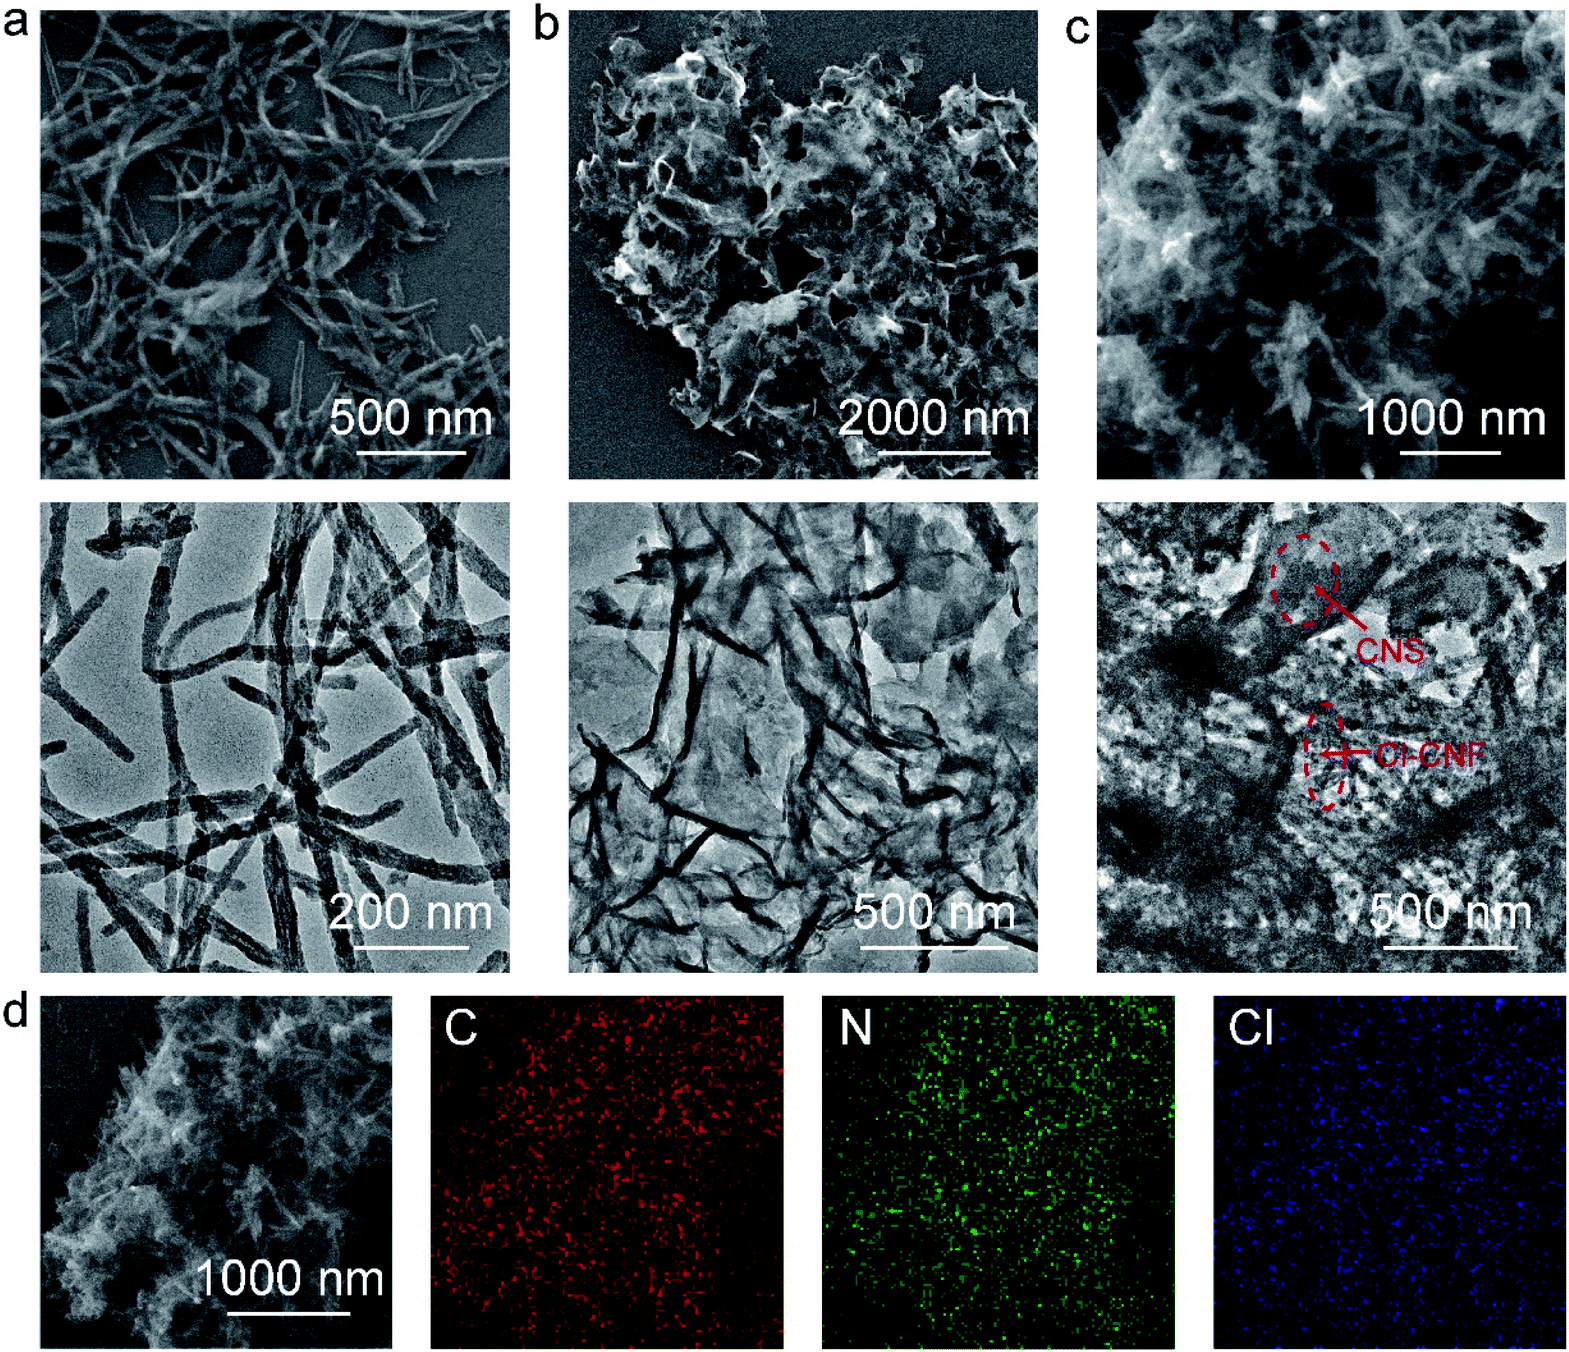 | ||
| Fig. 1 Morphology of the photocatalysts. (a) SEM and TEM images of Cl–CNF. (b) SEM and TEM images of CNS. (c) SEM and TEM images of Cl–CNF/CNS. (d) SEM elemental mapping. | ||
In the Cl–CNF/CNS nanohybrid, Cl–CNF was tightly grown on the surface of CNS (Fig. 1c), indicating the successful formation of the heterostructure. The tightly contact interface formed between Cl–CNF and CNS is beneficial for the charge carrier migration and transfer in photocatalytic reaction. Moreover, the Cl content of Cl–CNF/CNS is remarkably decreased compared with that of pure Cl–CNF because of the existence of CNS substrate (Fig. S2 and Table S1†). The SEM elemental mapping images in Fig. 1d demonstrate that the C, N and Cl elements are uniformly distributed on the surface of the heterostructure, suggesting Cl–CNF is homogeneously bound on the surface of CNS. In addition, the ratio of Cl–CNF to CNS can be adjusted by changing the amount of CNS added. However, Cl–CNF cannot be well loaded on CNS surface when CNS adding amount is too low or too high. When the CNS amount is too low, scattered Cl–CNF can be observed beyond the CNS surface (Fig. S3a†). On the other hand, when the CNS amount is too high, the morphology of Cl–CNF will be damaged during the hydrothermal process (Fig. S3b and c†).
The crystal structures of the samples were investigated by their XRD patterns (Fig. 2a). CNS shows two characteristic diffraction peaks of 13.0° and 27.6° corresponding to g-C3N4, which can be indexed to the in-planar packing (1 0 0) and interlayer stacking (0 0 2) plane, respectively.50 However, the peak of (1 0 0) plane in Cl–CNF vanishes, suggesting that the repeatability of the tri-s-triazine unit in the layer is significantly destroyed, which is probably caused by the Cl doping. In addition, the intensity of (0 0 2) peak in Cl–CNF decreases and the peak width at half height broadens, suggesting that the crystallinity of Cl–CNF is weakened intensively.14 Moreover, compared with pure CNS, the (0 0 2) peak of Cl–CNF/CNS shifts to 27.1°, indicating an increase in the distance between interlayers. The intensities of the (1 0 0) and (0 0 2) peaks in Cl–CNF/CNS are between those in Cl–CNF and CNS, demonstrating that Cl–CNF and CNS are well integrated. Fig. 2b presents the FTIR spectra of the samples. The peaks range from 3000 to 3500 cm−1 can be assigned to the stretching vibration of the N–H bond caused by the incomplete condensation of the precursor or the O–H bond of the adsorbed water molecules.51 The peaks range from 1100 to 1700 cm−1 can be indexed to the N![[double bond, length as m-dash]](https://www.rsc.org/images/entities/char_e001.gif) C–N heterocyclic stretches of tri-s-triazine unit. The peak at 814 cm−1 represents the out-of-plane bending mode of tri-s-triazine unit,52,53 which can only be observed in the periodic structure of CNS and the Cl–CNF/CNS nanohybrid, further verifying the disordered structure of Cl–CNF. However, no obvious N–Cl or C–Cl bonds appeared in the nanohybrid, probably because these bands overlap with the C–N stretching band.
C–N heterocyclic stretches of tri-s-triazine unit. The peak at 814 cm−1 represents the out-of-plane bending mode of tri-s-triazine unit,52,53 which can only be observed in the periodic structure of CNS and the Cl–CNF/CNS nanohybrid, further verifying the disordered structure of Cl–CNF. However, no obvious N–Cl or C–Cl bonds appeared in the nanohybrid, probably because these bands overlap with the C–N stretching band.
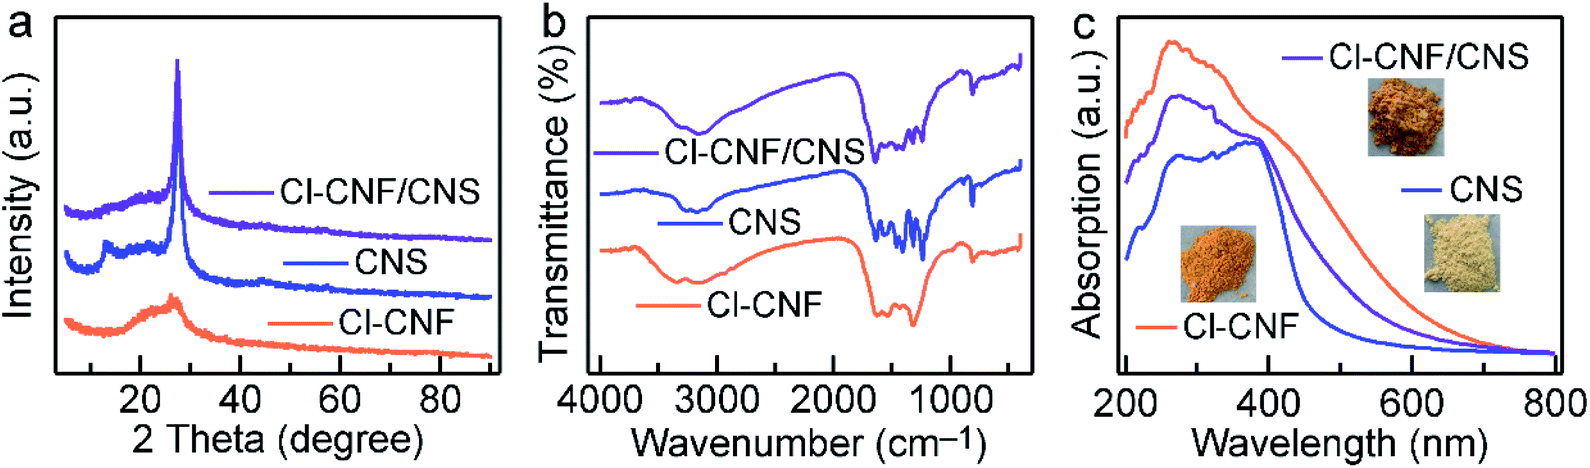 | ||
| Fig. 2 Structures and properties of the samples. (a) XRD patterns. (b) FTIR spectra. (c) Absorption spectra of the samples. Inset shows the photos of the sample powders. | ||
The light harvesting abilities of the samples were characterized by their UV-vis absorption spectra (Fig. 2c). Due to its unique structure and Cl doping, Cl–CNF exhibits strong light absorption in the visible light region, and its absorption tail can even extend to ∼628 nm, endowing it a superior semiconductor to enhance the light absorption ability of the heterostructure. The orange color of the Cl–CNF powder also reflects its strong light absorption ability and narrow bandgap characteristic (Fig. 2c, inset). On the contrary, CNS exhibits moderate visible light absorption capacity with a bandgap of 2.80 eV (Fig. 2c and S4†). After hybridizing, the light absorption ability of CNS was significantly enhanced in Cl–CNF/CNS, which is favorable for photocatalytic applications.
The valence states and charge transfer behaviors of the samples were analyzed by their XPS spectra. The trend of the Cl amount in the survey spectra (Fig. 3a) is consistent with the EDX.
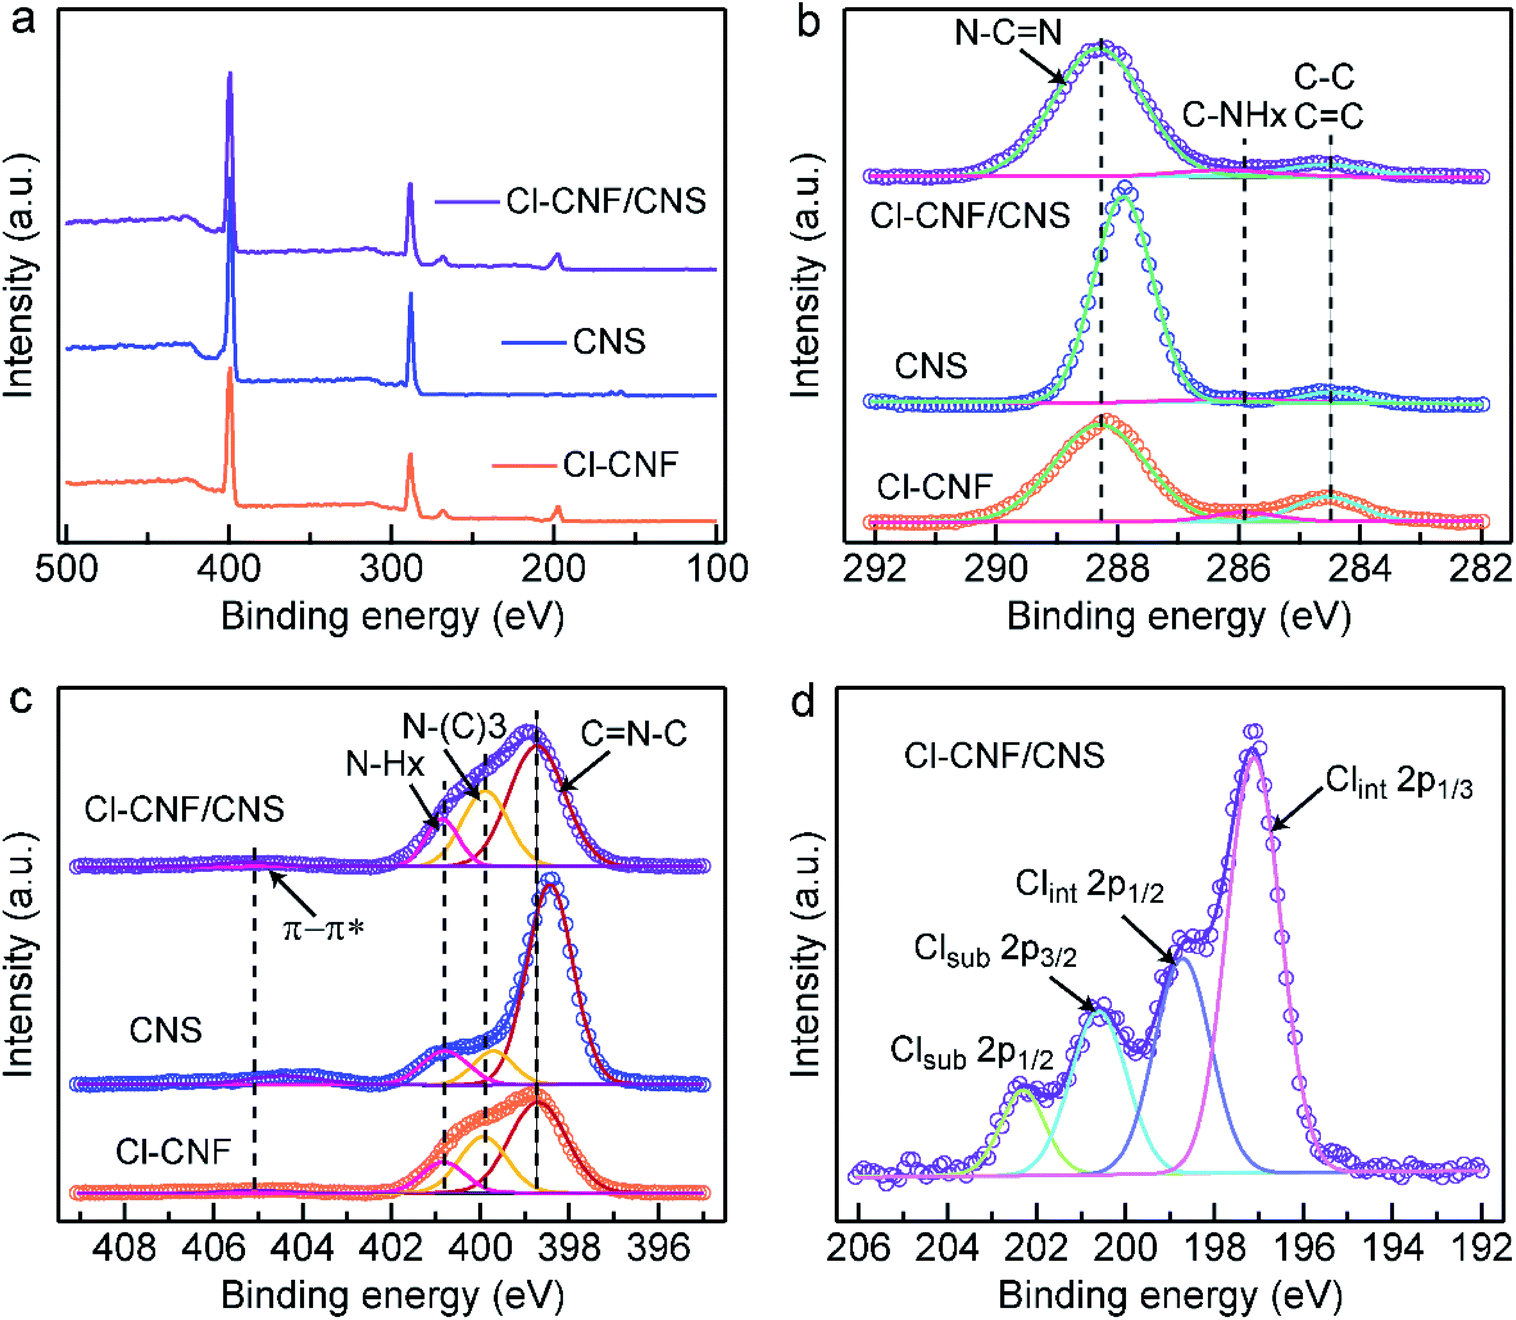 | ||
| Fig. 3 XPS spectra of the samples. (a) XPS survey spectra the three samples. (b) High-resolution C 1s spectra of Cl–CNF, CNS and Cl–CNF/CNS. (c) High-resolution N 1s spectra of Cl–CNF, CNS and Cl–CNF/CNS. (d) High-resolution Cl 2p spectrum of Cl–CNF/CNS. | ||
The results in Table S1,† indicating the successful hybridization of Cl–CNF and CNS. Fig. 3b shows the high-resolution C 1s spectra of the sample, the peaks of Cl–CNF in 288.3, 285.9 and 284.5 eV are respectively indexed to sp2 C (N–CN) in the tri-s-triazine unit, C–NHx groups on the edge of the framework and carbon contamination (C–C, CC species) introduced during the condensation process. In CNS, the main peak of sp2 C located at 287.9 eV, lowing than the binding energy value in the Cl–CNF/CNS nanohybrid. That is, the binding energy corresponding to sp2 C in CNS was increased after it interacted with Cl–CNF. The results indicate that the electron density of CNS is reduced in the Cl–CNF/CNS nanohybrid, in other words, electrons are being transferred from CNS to Cl–CNF at the Cl–CNF/CNS interface. In the high-resolution N 1s spectra (Fig. 3c), the peaks of Cl–CNF centered at 398.7, 400.0, 400.9 and 405.2 eV are respectively assigned to sp2 N (C–NC), tertiary carbon-nitrogen bonds [N–(C)3], NHx groups and charge effect (π → π*). Similar with the result of the high-resolution C 1s spectra of the samples, the sp2 N peak of CNS also shows a lower binding energy relative to Cl–CNF/CNS, further demonstrating the electron is transferred from CNS to Cl–CNF. In addition, the obvious peaks of Cl element in Cl–CNF/CNS suggest Cl was successfully doped into the conjugate heptazine units (Fig. 3d).11,54 The Cl 2p spectrum could be deconvolved into two possible Cl sites of substitutional and interstitial sites (Clsub and Clint). The peaks centered at 202.3 and 200.6 eV can be indexed to the 2p1/2 and 2p3/2 peaks of Clsub dopants stemmed from the C–Cl bonds in the framework. The other two peaks at 198.7 and 197.0 eV can be attributed to the Clint dopants derived from the Cl− ions.55 The photocatalytic activity is expected to be improved by Cl-doping due to its effect of broadening optical absorption and promoting charge migration.42 Benefiting from the role of ammonium chloride as a gas template, the surface area of CNS (56.76 m2 g−1) is higher than that of Cl–CNF (19.97 m2 g−1) according to their nitrogen adsorption–desorption isothermal curves (Fig. S5†). Particularly, the Cl–CNF/CNS nanohybrid also possesses a large specific surface area (54.53 m2 g−1), which can provide abundant active sites for photocatalytic reactions. Combining with the improved light absorption capacity, Cl–CNF/CNS is expected to show superior performance for H2O2 generation.
3.2. Photocatalytic H2O2 evolution
The photocatalytic activity of the samples was evaluated by H2O2 generation with ethanol as an electron donor. In our work, H2O2 was assumed to be produced through the two-electron reduction reaction of oxygen molecules. The H2O2 concentration of all the samples increased with prolonging the reaction time (Fig. 4a). Through screening experiment, the Cl–CNF/CNS-0.4 (always abbreviated as Cl–CNF/CNS) nanohybrid is found to show the highest H2O2 production rate of 247.5 μmol g−1 h−1 under visible light irradiation (λ > 420 nm), which is about 3.4 and 3.1 times as much as those of Cl–CNF and CNS (Fig. 4a and b). The detectable activity of pure Cl–CNF and CNS toward H2O2 generation demonstrates that the conduction bands of both components are more negative than the redox potential of O2/H2O2 (0.68 V vs. NHE at pH = 0). Moreover, the photocatalytic activities of the four nanohybrids with different CNS contents toward H2O2 generation are higher than those of pure Cl–CNF and CNS. The enhanced activity of the nanohybrids is believed to be caused by the synergistic effect of the improved photogenerated charge carriers separation efficiency and the enhanced light harvesting ability in the heterostructure.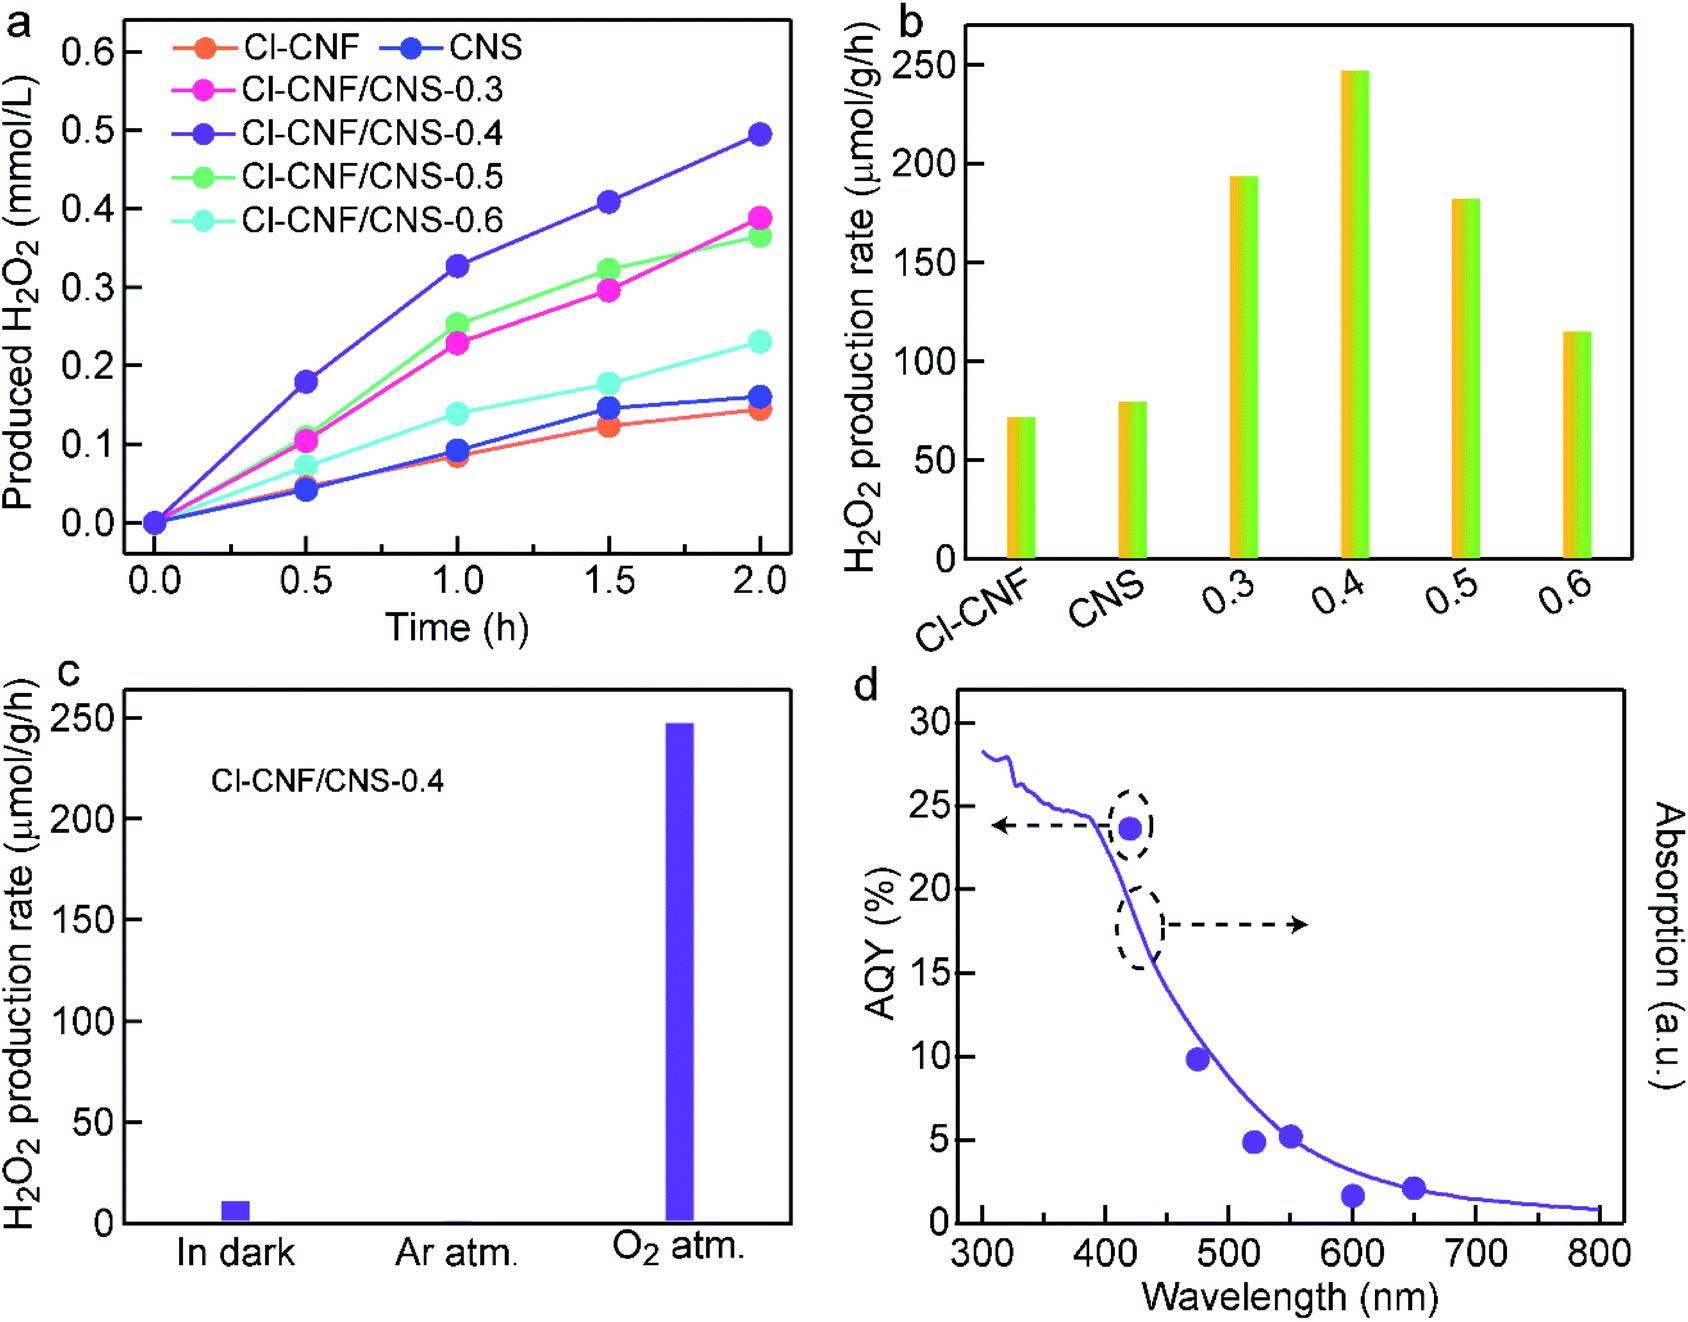 | ||
| Fig. 4 Photocatalytic H2O2 generation under visible light. (a) Time courses of the samples for H2O2 generation. (b) Photocatalytic H2O2 generation rates of the various samples. The samples of 0.3, 0.4, 0.5 and 0.6 represent Cl–CNF/CNS-0.3, Cl–CNF/CNS-0.4, Cl–CNF/CNS-0.5 and Cl–CNF/CNS-0.6. (c) Photocatalytic H2O2 generation rates of Cl–CNF/CNS under different conditions. (d) AQYs and absorption spectrum of Cl–CNF/CNS. | ||
The photocatalytic activity of the samples was evaluated by H2O2 generation with ethanol as an electron donor. In our work, H2O2 was assumed to be produced through the two-electron reduction reaction of oxygen molecules. The H2O2 concentration of all the samples increased with prolonging the reaction time (Fig. 4a). Through screening experiment, the Cl–CNF/CNS-0.4 (always abbreviated as Cl–CNF/CNS) nanohybrid is found to show the highest H2O2 production rate of 247.5 μmol g−1 h−1 under visible light irradiation (λ > 420 nm), which is about 3.4 and 3.1 times as much as those of Cl–CNF and CNS (Fig. 4a and b). The detectable activity of pure Cl–CNF and CNS toward H2O2 generation demonstrates that the conduction bands of both components are more negative than the redox potential of O2/H2O2 (0.68 V vs. NHE at pH = 0). Moreover, the photocatalytic activities of the four nanohybrids with different CNS contents toward H2O2 generation are higher than those of pure Cl–CNF and CNS. The enhanced activity of the nanohybrids is believed to be caused by the synergistic effect of the improved photogenerated charge carriers separation efficiency and the enhanced light harvesting ability in the heterostructure.
To investigate the effect of Cl–CNF and CNS in Cl–CNF/CNS for H2O2 generation activity improvement, we have also prepared other control samples for comparison. Among the carbon nitrides synthesized by different precursors, the H2O2 generation rates of melamine-polymerized carbon nitride and dicyandiamide-polymerized carbon nitride are both lower than that of CNS (Fig. S6†), which is probably due to the suitable energy band structure and large specific surface area of CNS, verifying the crucial role of ammonium chloride. Expectedly, the H2O2 generation rate of Cl–CNF/melamine-derived carbon nitride (nanohybrid of Cl–CNF and melamine-polymerized carbon nitride) and Cl–CNF/dicyandiamide-derived carbon nitride (nanohybrid of Cl–CNF and dicyandiamide-polymerized carbon nitride) are both enhanced compared with their pure components, further implying Cl–CNF is a favorable semiconductor to construct heterojunctions for H2O2 generation. Moreover, the photocatalytic activity of Cl–CNF/CNS toward H2O2 generation is the highest among the nanohybrids with the same carbon nitride addition content, indicating the abundant active sites and strong light absorption ability are both vital and indispensable for photocatalysis performance enhancement.
In order to verify our assumption that H2O2 was generated through two-electron reduction reaction of oxygen in our work, the H2O2 generation reactions were carried out under different conditions (Fig. 4c). A trace amount of H2O2 was detected in darkness, demonstrating that light is the energy source to drive the photocatalytic reaction. Negligible amount of H2O2 was detected under Ar atmosphere, indicating the presence of O2 is a prerequisite for H2O2 production. Control experiments under different atmospheres verify that H2O2 was produced via light-driven two-electron reduction process of oxygen in our work. H2O2 decomposition is an important factor to restrict the activity improvement for H2O2 generation, thus the decomposition behavior of H2O2 over Cl–CNF/CNS was investigated under visible light irradiation. As shown in Fig. S7,† Cl–CNF/CNS can lead to a small amount decomposition of H2O2 under light irradiation due to the instability of H2O2. The result also explained why the growth rate of H2O2 concentration in the reaction solution gradually decreased with prolonging the reaction time in Fig. 4a. Under monochromatic light irradiation, the AQY of Cl–CNF/CNS was measured and compared with its absorption spectrum (Fig. 4d). The trend of the AQY values agrees well with the absorption spectrum, indicating that the two-electron oxygen reduction reaction in the formation of H2O2 is light-driven. Especially, the AQY value reaches 23.67% at 420 nm, which is higher than many reported values (Table S2†), manifesting the Cl–CNF/CNS heterostructure is a superior catalyst for photocatalytic H2O2 generation.
The cycle test was performed to investigate the stability of Cl–CNF/CNS. As shown in Fig. 5a, the Cl–CNF/CNS heterostructure exhibits favorable stability for photocatalytic H2O2 evolution. The small reduction of H2O2 generation rate in the second and third run is probably caused by the catalyst loss during centrifugation. According to the XRD patterns and FTIR spectra comparisons between the fresh and used Cl–CNF/CNS samples in Fig. 5b and c, no obvious change was occurred in the crystal and chemical structure of Cl–CNF/CNS after cyclic test. Additionally, there is no obvious change in the morphology of Cl–CNF/CNS after stability test (Fig. 5b and c), further confirming the stability of the photocatalyst.
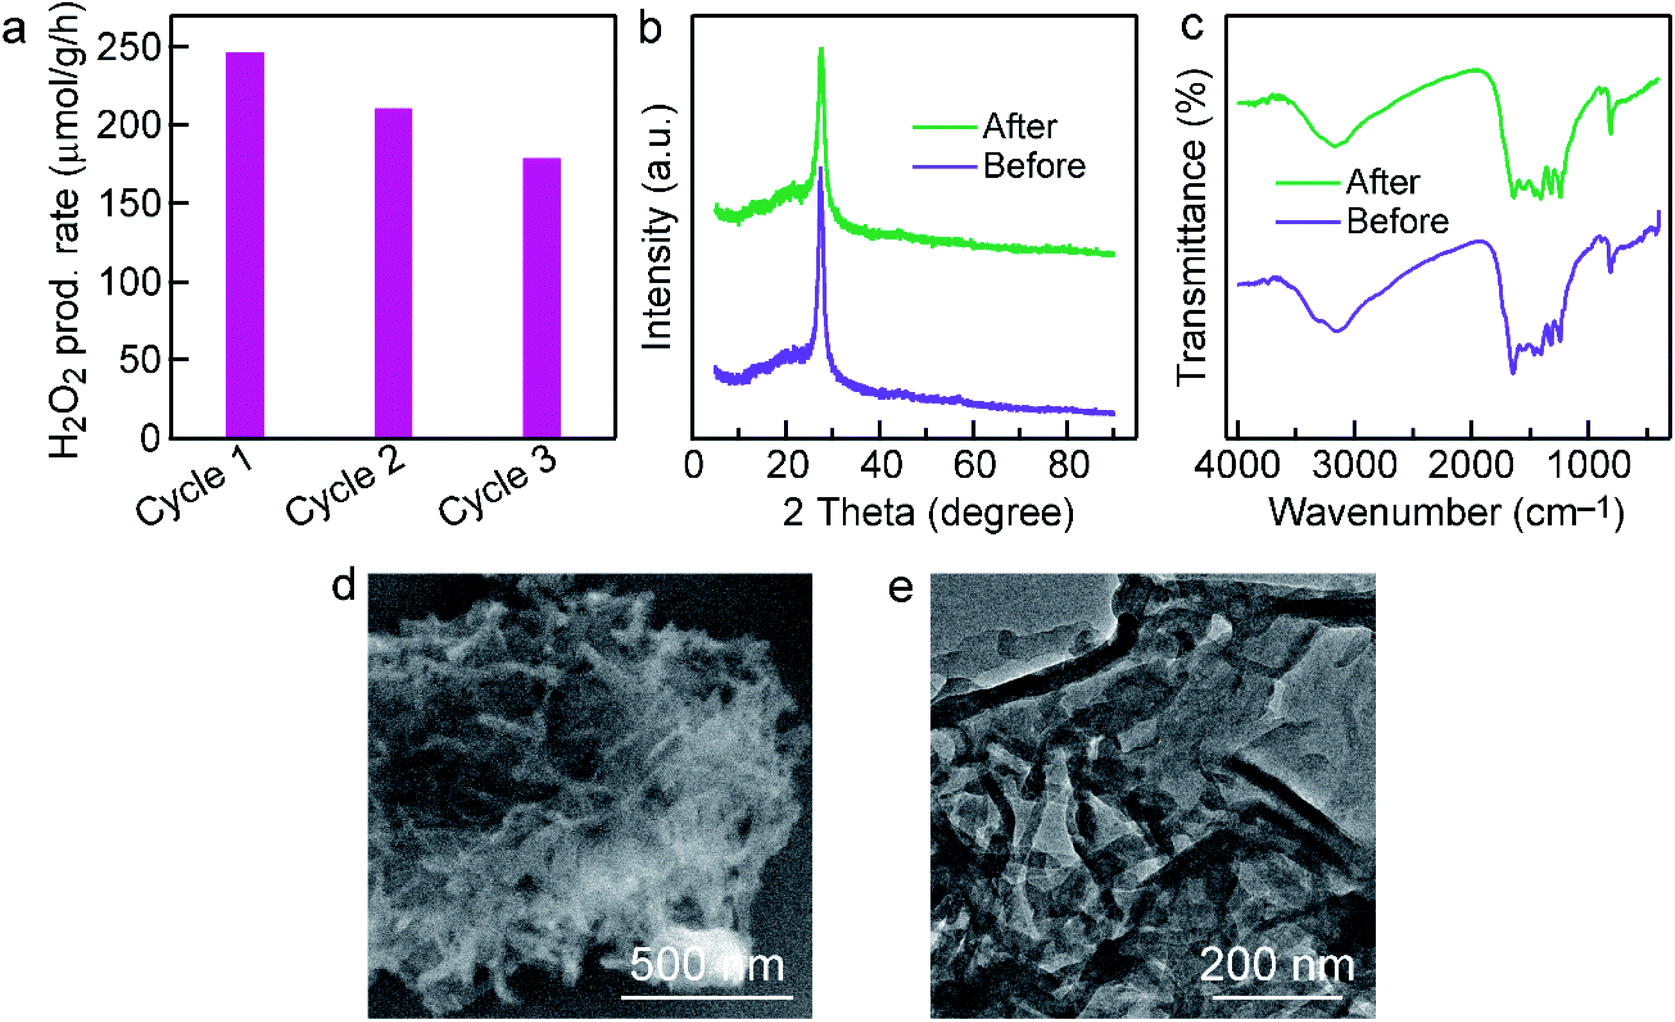 | ||
| Fig. 5 Stability test of Cl–CNF/CNS. (a) Cyclic test of Cl–CNF/CNS for H2O2 generation. (b) XRD patterns and (c) FTIR spectra of Cl–CNF/CNS before and after stability test. (d) SEM and (e) TEM images of Cl–CNF/CNS after stability test. | ||
3.3. Mechanism analysis
To uncover the mechanism for photocatalytic activity improvement in the heterostructure, photocurrent measurements of the three samples (Cl–CNF, CNS and Cl–CNF/CNS) were first carried out under discontinuous visible light (λ > 420 nm) to investigate the generation and separation of photoexcited charge carriers (Fig. 6a). The results show that the current density of Cl–CNF/CNS is higher than those of Cl–CNF and CNS, indicating that the generation and separation efficiency of photogenerated charge carriers was significantly improved compared with pure Cl–CNF and CNS electrodes, the enhanced charge carriers separation efficiency is beneficial for photocatalytic H2O2 generation. The EIS curves of the samples show that the Cl–CNF/CNS heterojunction processes the smallest charge transfer resistance whether the measurements were performed under light irradiation (Fig. 6b) or in dark (Fig. S8†), indicating the fastest charge transfer and migration rate in Cl–CNF/CNS.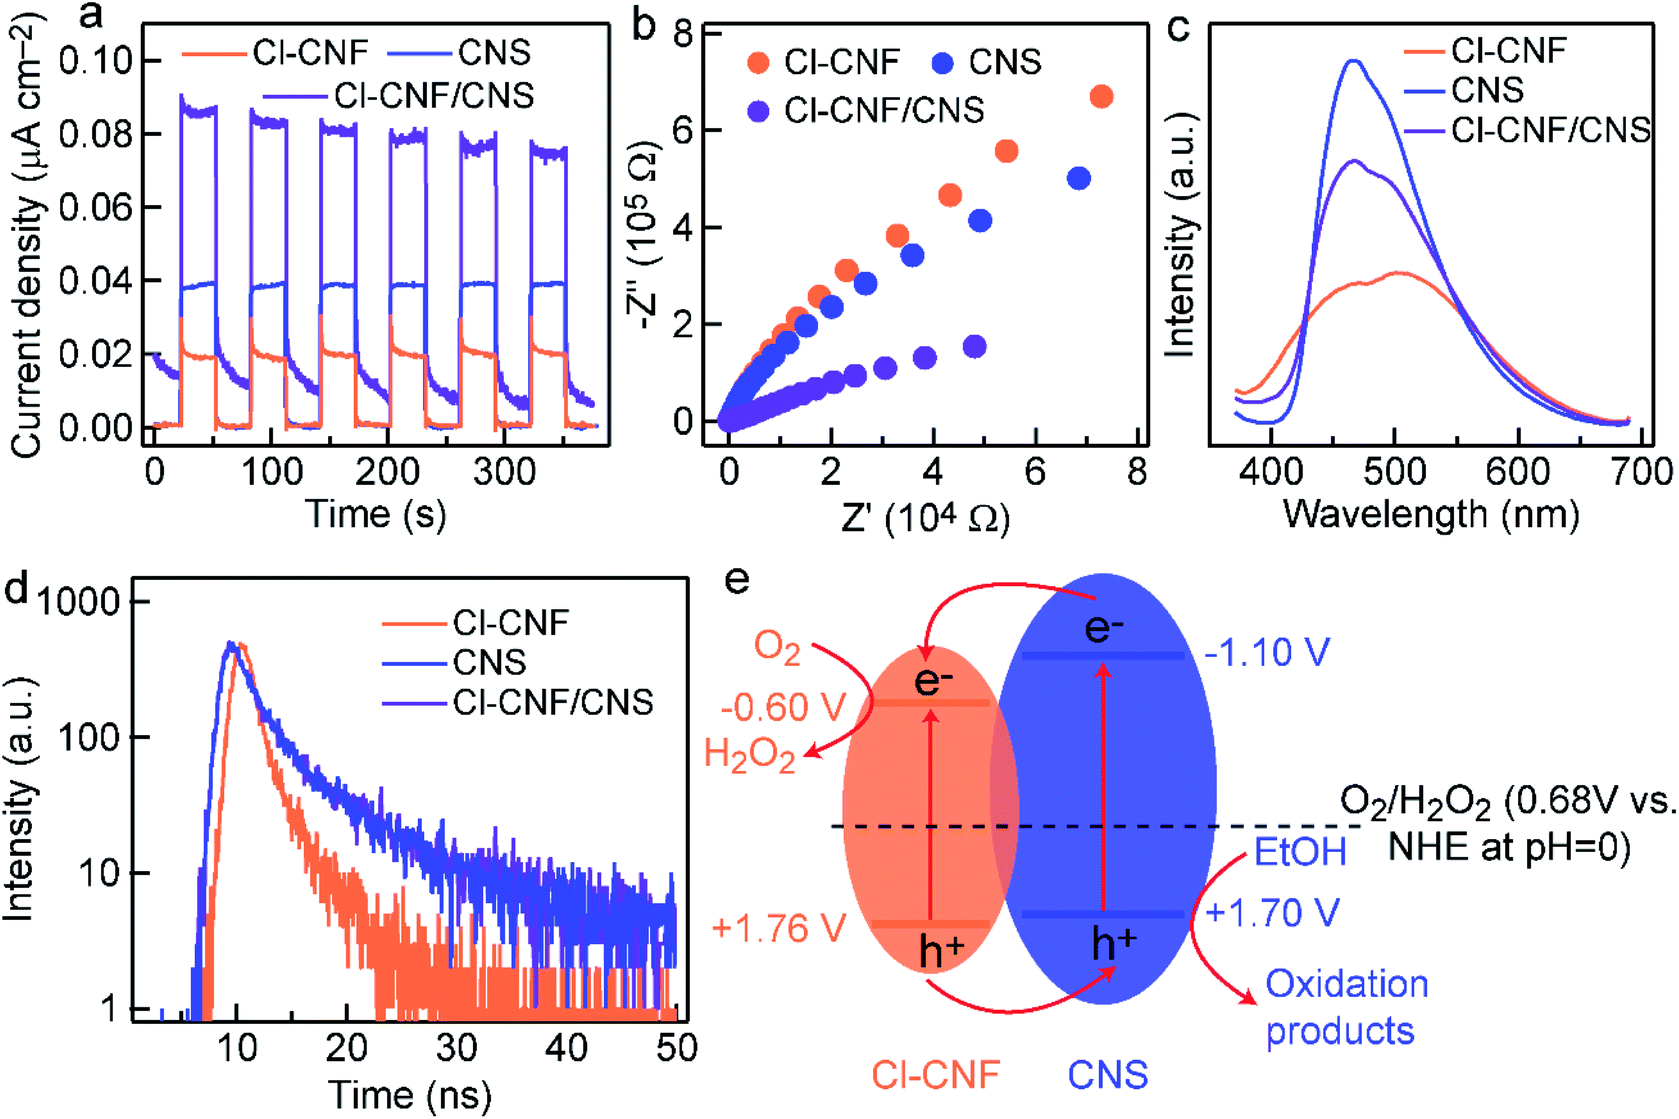 | ||
| Fig. 6 Proposed charge transfer mechanism in the Cl–CNF/CNS heterostructure. (a) Photocurrent densities of the sample electrodes under chopped visible light illumination. (b) EIS curves of the electrodes under light irradiation. (c) PL and (d) TRPL spectra of the samples. (e) The possible charge transfer behaviors at the Cl–CNF/CNS interface. | ||
The separation and transfer properties of the photogenerated charge carriers were further investigated by the PL spectra (Fig. 6c). The PL intensity of CNS is the strongest, suggesting its serious radiative recombination of photogenerated electron–hole pairs.56 The PL peak position of Cl–CNF redshifts to ∼525 nm, corresponding to its bandgap excitation of 2.36 eV. The PL intensity of Cl–CNF/CNS decreases in comparison with that of CNS, demonstrating the radiative recombination of the photogenerated charge carriers was effectively inhibited. As shown in Fig. 6d, the TRPL spectra were also collected to calculate the lifetime of the charge carriers by a fitted bi-exponential equation: I(t) = A1![[thin space (1/6-em)]](https://www.rsc.org/images/entities/char_2009.gif) exp(−t/τ1) + A2exp(−t/τ2), where τ1, τ2 are the emission lifetime values, and A1, A2 are the corresponding amplitudes. The calculated lifetime values of the samples are shown in Table 1. The lifetime of Cl–CNF/CNS is shortened compared with that of CNS, indicating the improved charge transfer kinetic for photocatalytic reactions.
exp(−t/τ1) + A2exp(−t/τ2), where τ1, τ2 are the emission lifetime values, and A1, A2 are the corresponding amplitudes. The calculated lifetime values of the samples are shown in Table 1. The lifetime of Cl–CNF/CNS is shortened compared with that of CNS, indicating the improved charge transfer kinetic for photocatalytic reactions.
| τ1 (ns) | τ2 (ns) | A1 (%) | A2 (%) | |
|---|---|---|---|---|
| Cl–CNF | 1.1354 | 4.0053 | 74.21 | 25.79 |
| CNS | 2.2483 | 10.8263 | 58.09 | 41.91 |
| Cl–CNF/CNS | 2.0915 | 10.1601 | 53.15 | 46.85 |
The Mott–Schottky curves of Cl–CNF and CNS were measured to calculate their band structures and further depict the charge transfer direction (Fig. S9†). Their positive slopes indicate that they are both n-type semiconductors.53 The flat potentials of Cl–CNF and CNS, which are obtained according to the intersection of the X-axis and the slopes at different frequencies, are directly deemed as their conduction band. The conduction band potentials of Cl–CNF and CNS are calculated to be −1.21 and −1.71 V (vs. Ag/AgCl), respectively, which are respectively −0.60 and −1.10 V vs. NHE at pH = 0. The pure Cl–CNF and CNS catalysts can therefore reduce oxygen molecules to H2O2. Combining with the bandgap values in Fig. S4,† the band structures of Cl–CNF and CNS were obtained and presented in Fig. 5e. We therefore proposed the charge transfer mechanism for photocatalytic H2O2 production over Cl–CNF/CNS. Upon light excitation, the photogenerated electrons transferred from the conduction band of CNS to that of Cl–CNF due to the more negative conduction band potential of CNS, which is consistent with the XPS results. The electrons on the conduction band of Cl–CNF then react with oxygen molecules through two-electron reduction reaction to generate H2O2. On the contrary, photogenerated holes left on the valence band of Cl–CNF transferred to that of CNS for ethanol oxidation (Fig. 6e). Thus, the photogenerated charge carriers can be effectively separated to participate the redox reactions and improve the photocatalytic activity.
4. Conclusions
In summary, a 1D/2D heterostructure was synthesized by grafting narrow-bandgap Cl–CNF on CNS substrate through an in situ hydrothermal method. The light harvesting ability of CNS was significantly enhanced due to the introduction of Cl–CNF with broadband spectral response. Moreover, the heterojunction shows a favorable photogenerated charge carriers separation efficiency, which is beneficial to improve its photocatalytic performance. The optimal Cl–CNF/CNS sample exhibits a H2O2 generation rate of 247.5 μmol g−1 h−1 under visible light irradiation, which is 3.4 and 3.1 times as much as those of Cl–CNF and CNS, respectively. Especially, Cl–CNF/CNS reaches a high AQY value of 23.67% at 420 nm. Our work provides a feasible method for constructing heterojunctions with different dimensions to improve the photogenerated charge carriers separation ability and the photocatalytic performance.Conflicts of interest
There are no conflicts of interest to declare.Acknowledgements
This work was financially supported by National Natural Science Foundation of China (51872110 and 21403058) and the Key Scientific Research Projects of Higher Education Institutions in Henan Province, China (20A610001).References
- L. Chen, L. Wang, Y. Wan, Y. Zhang, Z. Qi, X. Wu and H. Xu, Adv. Mater., 2020, 32, 1904433 CrossRef CAS PubMed.
- S. Wu, H. Yu, S. Chen and X. Quan, ACS Catal., 2020, 10, 14380–14389 CrossRef CAS.
- H. Zhang, L. Jia, P. Wu, R. Xu, J. He and W. Jiang, Appl. Surf. Sci., 2020, 527, 146584 CrossRef CAS.
- P. Zhang, Y. Tong, Y. Liu, J. J. M. Vequizo, H. Sun, C. Yang, A. Yamakata, F. Fan, W. Lin, X. Wang and W. Choi, Angew. Chem., Int. Ed., 2020, 59, 16209–16217 CrossRef CAS PubMed.
- P. Raizada, A. A. P. Khan and P. Singha, Sep. Purif. Technol., 2020, 247, 116957 CrossRef CAS.
- A. Sudhaik, P. Raizada, S. Thakur, R. V. Saini, A. K. Saini, P. Singh, V. K. Thakur, V.-H. Nguyen, A. A. P. Khan and A. M. Asirif, J. Taiwan Inst. Chem. Eng., 2020, 113, 142–154 CrossRef CAS.
- A. Sudhaik, P. Raizada, P. Singh, A. Hosseini-Bandegharaei, V. K. Thakur and V.-H. Nguyen, J. Environ. Chem. Eng., 2020, 8, 104483 CrossRef CAS.
- C. Feng, L. Tang, Y. Deng, J. Wang, J. Luo, Y. Liu, X. Ouyang, H. Yang, J. Yu and J. Wang, Adv. Funct. Mater., 2020, 30, 2001922 CrossRef CAS.
- A. Ullah, J. Khan, M. Sohail, A. Hayat, T. K. Zhao, B. Ullah, M. Khan, I. Udddin, S. Ullah, R. Ullah, A. U. Rehman and W. U. Khan, J. Photochem. Photobiol., A, 2020, 401, 112764 CrossRef CAS.
- J. Fu, J. Yu, C. Jiang and B. Cheng, Adv. Energy Mater., 2018, 8, 1701503 CrossRef.
- L. Shi, L. Yang, W. Zhou, Y. Liu, L. Yin, X. Hai, H. Song and J. Ye, Small, 2018, 14, 1703142 CrossRef PubMed.
- B. Wu, L. Zhang, B. Jiang, Q. Li, C. Tian, Y. Xie, W. Li and H. Fu, Angew. Chem., Int. Ed., 2021, 60, 4815–4822 CrossRef CAS PubMed.
- Q. Xu, B. Zhu, C. Jiang, B. Cheng and J. Yu, Sol. RRL, 2018, 2, 1800006 CrossRef.
- Y. Chen, X. Liu, L. Hou, X. Guo, R. Fu and J. Sun, Chem. Eng. J., 2020, 383, 123132 CrossRef CAS.
- H. Yu, R. Shi, Y. Zhao, T. Bian, Y. Zhao, C. Zhou, G. I. N. Waterhouse, L. Z. Wu, C. H. Tung and T. Zhang, Adv. Mater., 2017, 29, 1605148 CrossRef PubMed.
- H. Yu, H. Ma, X. Wu, X. Wang, J. Fan and J. Yu, Sol. RRL, 2021, 5, 2000372 CrossRef CAS.
- J. Jia, W. Huang, C. Feng, Z. Zhang, K. Zuojiao, J. Liu, C. Jiang and Y. Wang, J. Alloys Compd., 2019, 790, 616–625 CrossRef CAS.
- S. Li, G. Dong, R. Hailili, L. Yang, Y. Li, F. Wang, Y. Zeng and C. Wang, Appl. Catal., B, 2016, 190, 26–35 CrossRef CAS.
- X. Li, J. Zhang, F. Zhou, H. Zhang, J. Bai, Y. Wang and H. Wang, Chinese. J. Catal., 2018, 39, 1090–1098 CrossRef CAS.
- X. Li, X. Sun, L. Zhang, S. Sun and W. Wang, J. Mater. Chem. A, 2018, 6, 3005–3011 RSC.
- W. Wang, H. Zhang, S. Zhang, Y. Liu, G. Wang, C. Sun and H. Zhao, Angew. Chem., Int. Ed., 2019, 58, 16644–16650 CrossRef CAS PubMed.
- Y. Liu, X. Huang, Z. Yu, L. Yao, S. Guo and W. Zhao, ChemistrySelect, 2020, 5, 7720–7727 CrossRef CAS.
- Q. Wang, Y. Shi, Z. Du, J. He, J. Zhong, L. Zhao, H. She, G. Liu and B. Su, Eur. J. Inorg. Chem., 2015, 2015, 4108–4115 CrossRef CAS.
- Y. Wu, H. Liao and M. Li, Micro. Nano. Lett., 2018, 13, 752–757 CrossRef CAS.
- J. Niu, K. Wang, Z. Ma, F. Yang and Y. Zhang, ChemistrySelect, 2020, 5, 12353–12364 CrossRef CAS.
- J. Fu, B. Zhu, C. Jiang, B. Cheng, W. You and J. Yu, Small, 2017, 13, 1603938 CrossRef PubMed.
- L. Cheng, H. Yin, C. Cai, J. Fan and Q. Xiang, Small, 2020, 16, 2002411 CrossRef CAS PubMed.
- Y. Xie, Y. Zhuo, S. Liu, Y. Lin, D. Zuo, X. Wu, C. Li and P. Wong, Sol. RRL, 2020, 4, 1900440 CrossRef CAS.
- I. Camuussi, B. Mannucci, A. Speltini, A. Profumo, C. Milanese, L. Malavasi and P. Quadrelli, ACS Sustainable Chem. Eng., 2019, 7, 8176–8182 CrossRef.
- N. D. Shcherban, P. Mäki-Arvela, A. Aho, S. A. Sergiienko, P. S. Yaremov, K. Eränenband and D. Y. Murzin, Catal. Sci. Technol., 2018, 8, 2928–2937 CAS.
- Y. Guo, B. Chang, T. Wen, S. Zhang, M. Zeng, N. Hu, Y. Su, Z. Yang and B. Yang, J. Colloid Interface Sci., 2020, 567, 213–223 CrossRef CAS PubMed.
- H. Li, G. Huang, H. Xu, Z. Yang, X. Xu, J. Li, A. Qu and Y. Chen, J. Solid State Chem., 2020, 292, 121705 CrossRef CAS.
- N. T. T. Truc, T. D. Pham, M. V. Nguyen, D. V. Thuan, D. Q. Trung, P. Thao, H. T. Trang, V. N. Nguyen, D. T. Tran, D. N. Minh, N. T. Hanh and H. M. Ngoc, J. Alloys Compd., 2020, 842, 155860 CrossRef.
- X. Wang, D. Han, Y. Ding, J. Liu, H. Cai, L. Jia, X. Cheng, J. Wang and X. Fan, J. Alloys Compd., 2020, 845, 156293 CrossRef CAS.
- Y. Cui, Z. Ding, X. Fu and X. Wang, Angew. Chem., Int. Ed., 2012, 51, 11814–11818 CrossRef CAS PubMed.
- Q. Gu, Y. Liao, L. Yin, J. Long, X. Wang and C. Xue, Appl. Catal., B, 2015, 165, 503–510 CrossRef CAS.
- D. Liu, D. Chen, N. Li, Q. Xu, H. Li, J. He and J. Lu, Angew. Chem., Int. Ed., 2020, 59, 4519–4524 CrossRef CAS PubMed.
- Q. Zhu, B. Qiu, M. Du, J. Ji, M. Nasir, M. Xing and J. Zhang, ACS Sustainable Chem. Eng., 2020, 8, 7497–7502 CrossRef CAS.
- P. H. Linh, P. D. Chung, N. V. Khien, L. T. M. Oanh, V. T. Thu, T. N. Bach, L. T. Hang, N. M. Hung and V. D. Lam, Diam. Relat. Mater., 2021, 111, 108214 CrossRef CAS.
- D. Wang, X. Huang, Y. Huang, X. Yu, Y. Lei, X. Dong and Z. Su, Colloids Surf., A, 2021, 611, 125780 CrossRef CAS.
- A. Sudhaik, P. Raizada, S. Thakur, A. K. Saini, P. Singh, A. Hosseini-Bandegharaei, J.-H. Lim, D. Y. Jeong and V.-H. Nguyen, Appl. Nanosci., 2020, 10, 4115–4137 CrossRef CAS.
- Z. Cheng, K. Y. Zheng, G. Y. Lin, S. Q. Fang, L. Y. Li, J. H. Bi, J. N. Shen and L. Wu, Nanoscale Adv., 2019, 1, 2674–2680 RSC.
- T. Paul, D. Das, B. K. Das, S. Sarkar, S. Maiti and K. K. Chattopadhyay, J. Hazard. Mater., 2019, 380, 120855 CrossRef CAS PubMed.
- X. Hao, J. Zhou, Z. Cui, Y. Wang, Y. Wang and Z. Zou, Appl. Catal., B, 2018, 229, 41–51 CrossRef CAS.
- S. Wei, F. Wang, P. Yan, M. Dan, W. Cen, S. Yu and Y. Zhou, J. Catal., 2019, 377, 122–132 CrossRef CAS.
- Z. L. He, J. Zhang, X. Li, S. N. Guan, M. C. Dai and S. G. Wang, Small, 2020, 16, 2005051 CrossRef CAS PubMed.
- S. Hong, S. Lee, J. Jang and J. Lee, Energ Environ. Sci., 2011, 4, 1781–1787 RSC.
- W. Li, P. Da, Y. Zhang, Y. Wang, X. Lin, X. Gong and G. Zheng, ACS Nano, 2014, 8, 11770–11777 CrossRef CAS PubMed.
- F. Guo, M. Li, H. Ren, X. Huang, K. Shu, W. Shi and C. Lu, Sep. Purif. Technol., 2019, 228, 115770 CrossRef CAS.
- Q. Gao, J. Xu, Z. Wang and Y. Zhu, Appl. Catal., B, 2020, 271, 118933 CrossRef CAS.
- C. Zhao, C. Ding, C. Han, X. Yang and J. Xu, Sol. RRL, 2021, 5, 2000486 CrossRef CAS.
- G. Tzvetkov, M. Tsvetkov and T. Spassov, Superlattices Microstruct., 2018, 119, 122–133 CrossRef CAS.
- W. Wang, H. Zhang, S. Zhang, Y. Liu, G. Wang, C. Sun and H. Zhao, Angew. Chem., Int. Ed., 2019, 58, 16644–16650 CrossRef CAS PubMed.
- X. Fang, S. Cai, M. Wang, Z. Chen, C. Lu and H. Yang, Angew. Chem., Int. Ed., 2021, 60, 7046–7050 CrossRef CAS PubMed.
- M. Y. Cao, K. Wang, I. Tudela and X. F. Fan, Appl. Surf. Sci., 2021, 536, 147784 CrossRef CAS.
- S. Hu, X. Sun, Y. Zhao, W. Li, H. Wang and G. Wu, J. Taiwan Inst. Chem. Eng., 2020, 107, 129–138 CrossRef CAS.
Footnote |
| † Electronic supplementary information (ESI) available. See DOI: 10.1039/d1ra05787a |
| This journal is © The Royal Society of Chemistry 2021 |