DOI:
10.1039/D1RA05537B
(Paper)
RSC Adv., 2021,
11, 27845-27854
Molecularly imprinted polymer coated Mn-doped ZnS quantum dots embedded in a metal–organic framework as a probe for selective room temperature phosphorescence detection of chlorpyrifos
Received
20th July 2021
, Accepted 11th August 2021
First published on 17th August 2021
Abstract
As one of the most widely used organophosphorus pesticides, chlorpyrifos (CPF) is toxic to humans. However, the rapid, effective and sensitive detection of CPF is still a challenge. In this paper, a novel molecularly imprinted phosphorescent sensor with a core–shell structure (Mn:ZnS QDs@ZIF-8@MIP) using Mn:ZnS quantum dots (QDs) as phosphorescent emitters was prepared for the highly sensitive and selective detection of CPF, and a simple and rapid room-temperature phosphorescence (RTP) detection method for CPF was proposed. For the prepared Mn:ZnS QDs@ZIF-8@MIP, Mn:ZnS QDs had good phosphorescence emission characteristics, ZIF-8 as support materials was used to improve the dispersibility of Mn:ZnS QDs, and molecularly imprinted polymer (MIP) on the surface of ZIF-8 was used to improve the selectivity of Mn:ZnS QDs for CPF. Under the optimal response conditions, the RTP intensity of Mn:ZnS QDs@ZIF-8@MIP showed a rapid response to CPF (less than 5 min), the RTP intensity ratio of P0/P had a good linear relationship with the concentration of CPF in the range of 0–80 μM, and the detection limit of this method was 0.89 μM with the correlation coefficient of 0.99. Moreover, this simple and rapid method has been successfully used to detect CPF in real water samples with satisfactory results, and the recoveries ranged from 92% to 105% with a relative standard deviation of less than 1%. This method combines the advantages of phosphorescence emission and molecular imprinting, and greatly reduces the potential interferences of competitive substances, background fluorescence and scattered light, which opens up a broad prospect for the highly sensitive and selective detection of pollutants in water based on molecularly imprinted phosphorescent sensors.
1. Introduction
As one of the most widely used organophosphorus insecticides, chlorpyrifos (CPF) has a positive impact and gives an essential guarantee for the healthy growth and yield of crops. However, CPF can effectively inhibit acetylcholinesterase and prevent the transmission of signals between nerve cells, which will lead to the dysfunction of the human central nervous system, and pose a serious threat to human health.1 In addition, since the utilization rate of pesticides is usually low, the large-scale use of CPF has led to the enormous presence of CPF residues or their derivatives in aquatic ecosystems. The sanitary standard for drinking water and the environmental quality standard for surface water set the limit for CPF not to exceed 1.0 μM, in order to ensure the safety of water quality and human health, it is of great practical significance to develop rapid, highly sensitive, and highly selective detection methods for CPF in water environment.
So far, a variety of application technologies for the detection of CPF have been developed, such as gas chromatography (GC),2 high performance liquid chromatography (HPLC),3,4 liquid chromatography-mass spectrometry (LC-MS),5 and capillary electrophoresis (CE).6 Although these chromatographic methods have high sensitivity, they usually require expensive equipment, skilled personnel, and tedious and complicated sample pretreatment processes.7 Therefore, there is an urgent need to develop the more simple, rapid, low-cost, and reliable methods for the detection of CPF in environmental samples, especially in water samples.
In recent years, quantum dots (QDs), as a kind of light-emitting nanomaterials, have attracted widespread attention in the environmental and biological fields. Different from traditional organic fluorophores, QDs have the advantages of wide excitation spectrum, narrow emission spectrum, good symmetry, no tailing, high luminescence quantum yield, good light stability, and tunable luminescence.8 These unique characteristics make QDs as ideal fluorescent probes widely used in biological macromolecule detection,9 small molecule recognition,10 metal ion recognition,11 cell imaging12 and other fields. For example, in the detection of organophosphorus pesticides in water, Zheng et al.13 integrated CdTe QDs with acetylcholinesterase enzyme (AChE) for the detection of organophosphorus pesticides such as paraoxon and parathion; Ren et al.14 synthesized acrylamide-based Mn(II)-doped ZnS QDs and used it as a fluorescent probe for the sensitive detection of CPF. However, the real pollutants in water are complex and diverse, and fluorescence analysis of target pollutants is easily interfered by the autofluorescence and scattered light of other substances in the water (such as humic acid, etc.), which reduces the accuracy and sensitivity of the fluorescence analysis methods based on QDs fluorescent probes.
Compared with fluorescence, phosphorescence is a rarer luminescence phenomenon. Because the lifetime of phosphorescence is longer than fluorescence, the phosphorescence analysis method of pollutants that uses phosphorescence as the analysis signal can effectively avoid the interferences of matrix autofluorescence and scattered light, so the sensitivity and accuracy will be improved compared with fluorescence analysis methods. These advantages make phosphorescent QDs for detecting target molecules in complex environmental samples more feasible than fluorescent QDs. Therefore, in recent years, Mn:ZnS QDs with phosphorescent emission characteristics have become a research hotspot, and have been successfully used as phosphorescent probes to develop various sensors for pollutants in water environment.15,16 However, the ligand coated on the surface of the Mn:ZnS QDs can usually be combined with variety of substances, which will affect the selectivity of the phosphorescent probes in the application.
Molecular Imprinting Technology (MIT) is a technology for preparing Molecularly Imprinted Polymers (MIPs) with high affinity and selectivity for target compounds (template molecules). The prepared MIPs contains three-dimensional holes, which are highly matched with the template molecule in terms of spatial structure and functional group arrangement. So this makes MIPs have high recognition performance for the template molecule, non-molecularly imprinted polymers (NIPs) cannot recognize template molecules. Due to its unique characteristics such as predictability of structure, specificity of recognition and versatility of application, the MIPs have been widely used in many fields such as chromatographic separation,17 solid phase extraction18 and chemical sensors.19 Therefore, combining MIPs and QDs to prepare phosphorescent sensors can effectively improve the selectivity of QDs in response to target analytes. But there are still several problems for the combination of MIPs and QDs, which may affect the sensitivity for the detection of target substance. For example, QDs usually agglomerate during the imprinting process, which will affect the stability of phosphorescence measurement in practical applications; if the molecularly imprinted layer on the surface of the quantum dot is too thick, it will prevent the elution of the template molecule in the molecularly imprinted polymer and its recombination with the template molecule, thus reducing the sensitivity of target recognition.
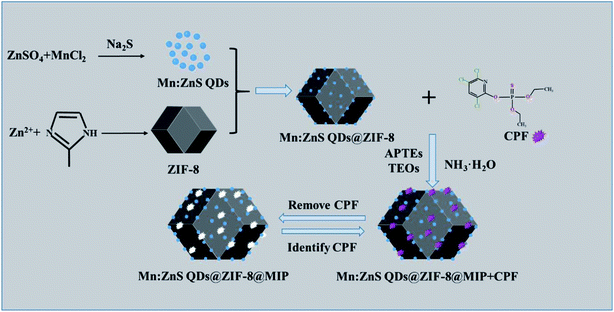
Metal–organic frameworks (MOFs) are one-dimensional, two-dimensional or three-dimensional infinite network porous materials composed of metal ions and organic ligands. They are widely used in catalysis,20 drug delivery21 and sensing.22 The MOFs have a large specific surface area, tunable pore size and tunable inner surface properties. Therefore, encapsulating nanoparticles into MOFs can effectively prevent the agglomeration of guest nanoparticles, thereby improving the performance of nanoparticles in application.23 As a typical imidazole-based MOFs material, zeolitic imidazolate framework-8 (ZIF-8) not only has a high specific surface area and large pores, but also has excellent chemical and thermal stability, so it can be used as an excellent molecular imprinting support material.24 Therefore in this study, we used ZIF-8 as a perfect support material and Mn:ZnS QDs as phosphorescent emitters, and prepared a novel molecularly imprinted phosphorescent sensor with a core–shell structure (Mn:ZnS QDs@ZIF-8@MIP), which has highly sensitive and selective recognition performance for CPF. Based on the phosphorescence “off” behavior of Mn:ZnS QDs@ZIF-8@MIP phosphorescent sensor, a simple, rapid, highly selective and sensitive RTP detection method for CPF was developed and successfully applied to detect CPF in real water samples.
2. Experimental
2.1 Reagents
Ultrapure water (18.25 MΩ cm) was used throughout in our experiment and it was obtained from a Millipore Milli-Q Purification System (Molecular Corporation, Shanghai, China). ZnSO4·7H2O, Zn (NO3)2·6H2O, Na2HPO4·12H2O, NaH2PO4·2H2O and ammonia solution were purchased from Shanghai Su Yi chemical reagent Co., Ltd. (Shanghai, China). MnCl2·4H2O was purchased from Guoyao Chemical Reagent Company (Shanghai, China). Na2S·9H2O, (3-mercaptopropyl)trimethoxysilane (MPTs), 2-methylimidazole (2-Hmin), tetraethoxysilane (TEOs), (3-aminopropyl)triethoxysilane (APTEs), ethanol, and methanol were purchased from Aladdin Chemistry Co., Ltd. (Shanghai, China). All the reagents used in our experiment were of analytical grade.
2.2 Instruments
The measurements of RTP were performed using a F-7000 fluorescence spectrophotometer (Hitachi, Tokyo, Japan) equipped with a four-way quartz sample cuvette (1.0 cm × 1.0 cm) under ambient conditions. UV-vis absorption spectra were measured on a UV-2550 UV-vis spectrophotometer (Shimadzu, Tokyo, Japan) with a pair of quartz sample cuvettes (1.0 cm × 1.0 cm). The morphology and microstructure images of the prepared samples were recorded by a SU8010 field emission scanning electron microscope (SEM; Hitachi, Tokyo, Japan) and a FEI F20 transmission electron microscopy (TEM; FEI, USA), respectively. The phase compositions were characterized by X-ray diffraction (XRD) patterns measured by a Bruker D8 advance X-ray diffractometer (Bruker, Germany). Fourier-transform infrared (FT-IR) spectra (4000–400 cm−1) were obtained by KBr disks on a Nicolet IS5 FTIR apparatus (Thermo Fisher, USA).
2.3 Synthesis of MPTs modified Mn:ZnS QDs and ZIF-8
Mn:ZnS QDs were synthesized according to the reported procedures in literature with little modifications.25 First, in a 250 mL three-necked flask, 12.5 mmol ZnSO4, 1 mmol MnCl2, and 80 mL ultrapure water were sequentially added, the mixed solution was magnetically stirred for 20 min under nitrogen at room temperature. Then, 20 mL Na2S (6.25 mmol) solution was injected slowly into the mixture under the protection of nitrogen gas. After stirring for 30 min, the 10 mL of 0.0625 mol L−1 MPTs ethanol solution was added, and the mixture was continuously stirred for 20 h. Finally, the obtained Mn:ZnS QDs were centrifuged repeatedly, then washed with ultrapure water and ethanol for three times and dried in a vacuum.
ZIF-8 was synthesized in a typical experiment according to previous report with some modifications.26 1.974 mmol Zn (NO3)2·6H2O and 15.808 mmol 2-Hmin were dispersed into a 40 mL methanol, respectively. Then, the above two methanol solutions were mixed uniformly by a magnetic stirrer at ambient conditions. Until the mixture turned turbid, the mixture was continuously stirred for 1 h, and then the white precipitate was obtained by centrifugal separation, washed with absolute methanol for several times, and dried in a vacuum.
2.4 Synthesis of Mn:ZnS QDs@ZIF-8@MIP
The Mn:ZnS QDs@ZIF-8@MIP was prepared by the sol–gel method with some modifications.27 Firstly, 100 mg Mn:ZnS QDs and 50 mg ZIF-8 were dispersed in a 40 mL ethanol with ultrasonic for 1.0 h. Then, 200 μL APTEs as functional monomer and 50 mg the template of CPF were added to the above mixture and the mixture was stirred for 1.0 h in the dark. Then 600 μL TEOs were added drop by drop to the mixture, after 30 min, 800 μL NH3·H2O was added, then the mixture was continuously stirred for 20 h in the dark. Finally, the products were centrifuged and washed repeatedly with a mixed solvent of methanol and ethanol (8![[thin space (1/6-em)]](https://www.rsc.org/images/entities/char_2009.gif) :2, v/v) until no template molecule CPF was detected in the eluate. The entire synthesis process of Mn:ZnS QDs@ZIF-8@MIP was presented in Scheme 1. And Mn:ZnS QDs@ZIF-8@NIP was prepared in the same way except that the template molecule CPF was not added.
:2, v/v) until no template molecule CPF was detected in the eluate. The entire synthesis process of Mn:ZnS QDs@ZIF-8@MIP was presented in Scheme 1. And Mn:ZnS QDs@ZIF-8@NIP was prepared in the same way except that the template molecule CPF was not added.
 |
| | Scheme 1 Schematic illustration of synthesis process of Mn:ZnS QDs@ZIF-8@MIP. | |
2.5 RTP detection of CPF
Firstly, 1 mg mL−1 Mn:ZnS QDs@ZIF-8@MIP uniformly dispersed aqueous solution and 1 mmol L−1 CPF ethanol solution were prepared, respectively. Then, 500 μL of 0.2 mol L−1 Na2HPO4–NaH2PO4 buffer solution (pH 6.5), 120 μL of 1 mg mL−1 Mn:ZnS QDs@ZIF-8@MIP solution and different volumes of the 1 mmol L−1 CPF solution were successively added to a series of 10 mL colorimetric tubes. All the mixtures were diluted to 10 mL with ultrapure water and mixed thoroughly. After reacting for 5 min, the RTP spectra of the solutions were measured with the excitation wavelength of 275 nm and emission wavelength range of 500–700 nm. For the measurement of RTP spectrum, the slit widths of excitation and emission were 10 nm and 20 nm, respectively; the scan speed was set at 240 nm min−1; and the photomultiplier tube (PMT) voltage was set at 700 V. The RTP spectra of Mn:ZnS QDs@ZIF-8@NIP and the reaction solution of Mn:ZnS QDs@ZIF-8@NIP with CPF were measured under the same conditions.
2.6 Analysis of real water samples
In order to verify whether Mn:ZnS QDs@ZIF-8@MIP can be applied to the detection of CPF in real water samples, real water samples from tap water and local Dongpu reservoir were collected, respectively. The tap water and lake water were filtered through 0.45 μm filters for 2 times to remove the insoluble solids. A recovery test was carried out by adding a certain amount of CPF solution to the water sample to evaluate the reliability of the developed method.
3. Results and discussion
3.1 Morphological characterization of ZIF-8, Mn:ZnS QDs@ZIF-8@MIP and Mn:ZnS QDs@ZIF-8@NIP
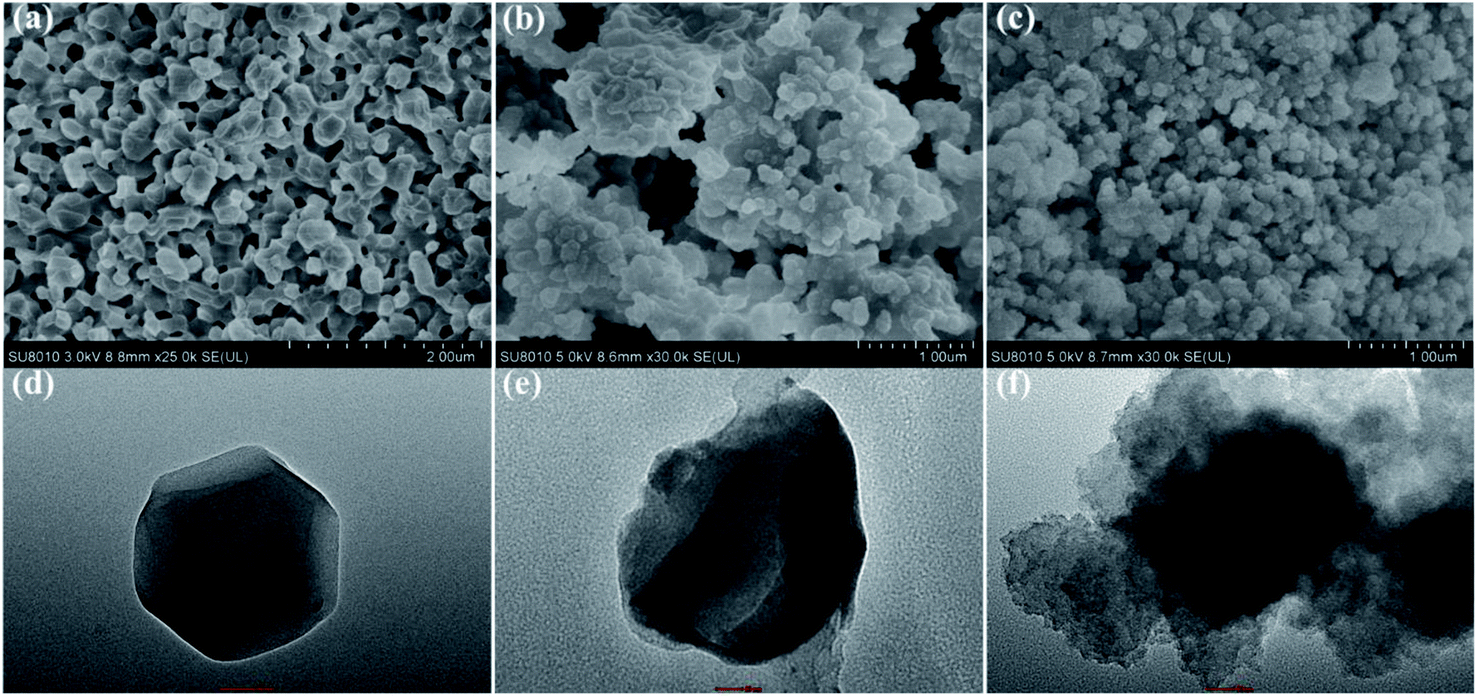
The surface morphologies of ZIF-8, Mn:ZnS QDs@ZIF-8@MIP and Mn:ZnS QDs@ZIF-8@NIP were observed by SEM and TEM, and the SEM images and TEM images are shown in Fig. 1. We can see from Fig. 1(a) and (d) that ZIF-8 has excellent dispersibility, and has a characteristic structure of rhombohedral dodecahedron with a smooth surface. The morphologies of Mn:ZnS QDs@ZIF-8@MIP (as shown in Fig. 1(b) and (e)) and Mn:ZnS QDs@ZIF-8@NIP (as shown in Fig. 1(c) and (f)) are similar to ZIF-8. Moreover, from Fig. 1(d) and (e) we can observe that for the Mn:ZnS QDs@ZIF-8@MIP, ZIF-8 is used as a support material, and a layer of molecularly imprinted polymer is covered on the surface of ZIF-8 embedded with Mn:ZnS QDs by polymerization reaction. So Mn:ZnS QDs@ZIF-8@MIP shows a typical core–shell structure.
 |
| | Fig. 1 SEM images of (a) ZIF-8, (b) Mn:ZnS QDs@ZIF-8@MIP and (c) Mn:ZnS QDs@ZIF-8@NIP; TEM images of (d) ZIF-8, (e) Mn:ZnS QDs@ZIF-8@MIP and (f) Mn:ZnS QDs@ZIF-8@NIP. | |
3.2 FT-IR spectra and XRD characterization of Mn:ZnS QDs, ZIF-8 and Mn:ZnS QDs@ZIF-8@MIP
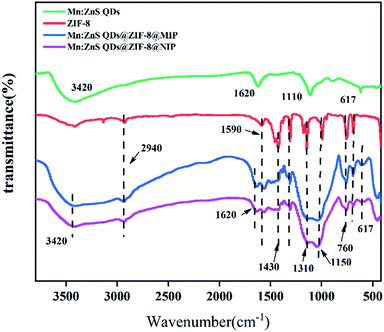
The measured FT-IR spectra of Mn:ZnS QDs, ZIF-8, Mn:ZnS QDs@ZIF-8@MIP and Mn:ZnS QDs@ZIF-8@NIP shown in Fig. 2. From Fig. 2 we can see that for the FT-IR spectrum of Mn:ZnS QDs, the strong and broad peak around 1110 cm−1 indicates the Si–O–Si asymmetric stretching, other observed bands around 617 cm−1 also show the Si–O vibrations. For the FT-IR spectra of ZIF-8, Mn:ZnS QDs@ZIF-8@MIP and Mn:ZnS QDs@ZIF-8@NIP, the peaks at 3200 cm−1 and 1590 cm−1 are corresponding to the C–N stretching vibration and C![[double bond, length as m-dash]](https://www.rsc.org/images/entities/char_e001.gif) N stretching of imidazole rings, respectively. The absorption peaks around 1310 cm−1 and 1430 cm−1 could be identified the C–H bending vibrations, while the peaks at 1150 cm−1 may be caused by the bending of the inner plane of the ring. The peak around 760 cm−1 corresponds to the olefin bending vibration, and the typical peak at 472 cm−1 is determined to be the stretching vibration of the Zn–N bond. There are bands around 2940 cm−1 (C–H stretching band), 3420 cm−1 and 1620 cm−1 (N–H band), indicating the presence of aminopropyl group. All these same peaks indicate that the Mn:ZnS QDs@ZIF-8@MIP was successfully prepared by the sol–gel condensation of APTEs and TEOs. After CPF was eluted by eluent, the spectra of Mn:ZnS QDs@ZIF-8@MIP and Mn:ZnS QDs@ZIF-8@NIP have similar typical peaks, which indicates that Mn:ZnS QDs@ZIF-8@MIP and Mn:ZnS QDs@ZIF-8@NIP have been successfully prepared.
N stretching of imidazole rings, respectively. The absorption peaks around 1310 cm−1 and 1430 cm−1 could be identified the C–H bending vibrations, while the peaks at 1150 cm−1 may be caused by the bending of the inner plane of the ring. The peak around 760 cm−1 corresponds to the olefin bending vibration, and the typical peak at 472 cm−1 is determined to be the stretching vibration of the Zn–N bond. There are bands around 2940 cm−1 (C–H stretching band), 3420 cm−1 and 1620 cm−1 (N–H band), indicating the presence of aminopropyl group. All these same peaks indicate that the Mn:ZnS QDs@ZIF-8@MIP was successfully prepared by the sol–gel condensation of APTEs and TEOs. After CPF was eluted by eluent, the spectra of Mn:ZnS QDs@ZIF-8@MIP and Mn:ZnS QDs@ZIF-8@NIP have similar typical peaks, which indicates that Mn:ZnS QDs@ZIF-8@MIP and Mn:ZnS QDs@ZIF-8@NIP have been successfully prepared.
 |
| | Fig. 2 FT-IR spectra of Mn:ZnS QDs, ZIF-8, Mn:ZnS QDs@ZIF-8@MIPand Mn:ZnS QDs@ZIF-8@NIP. | |
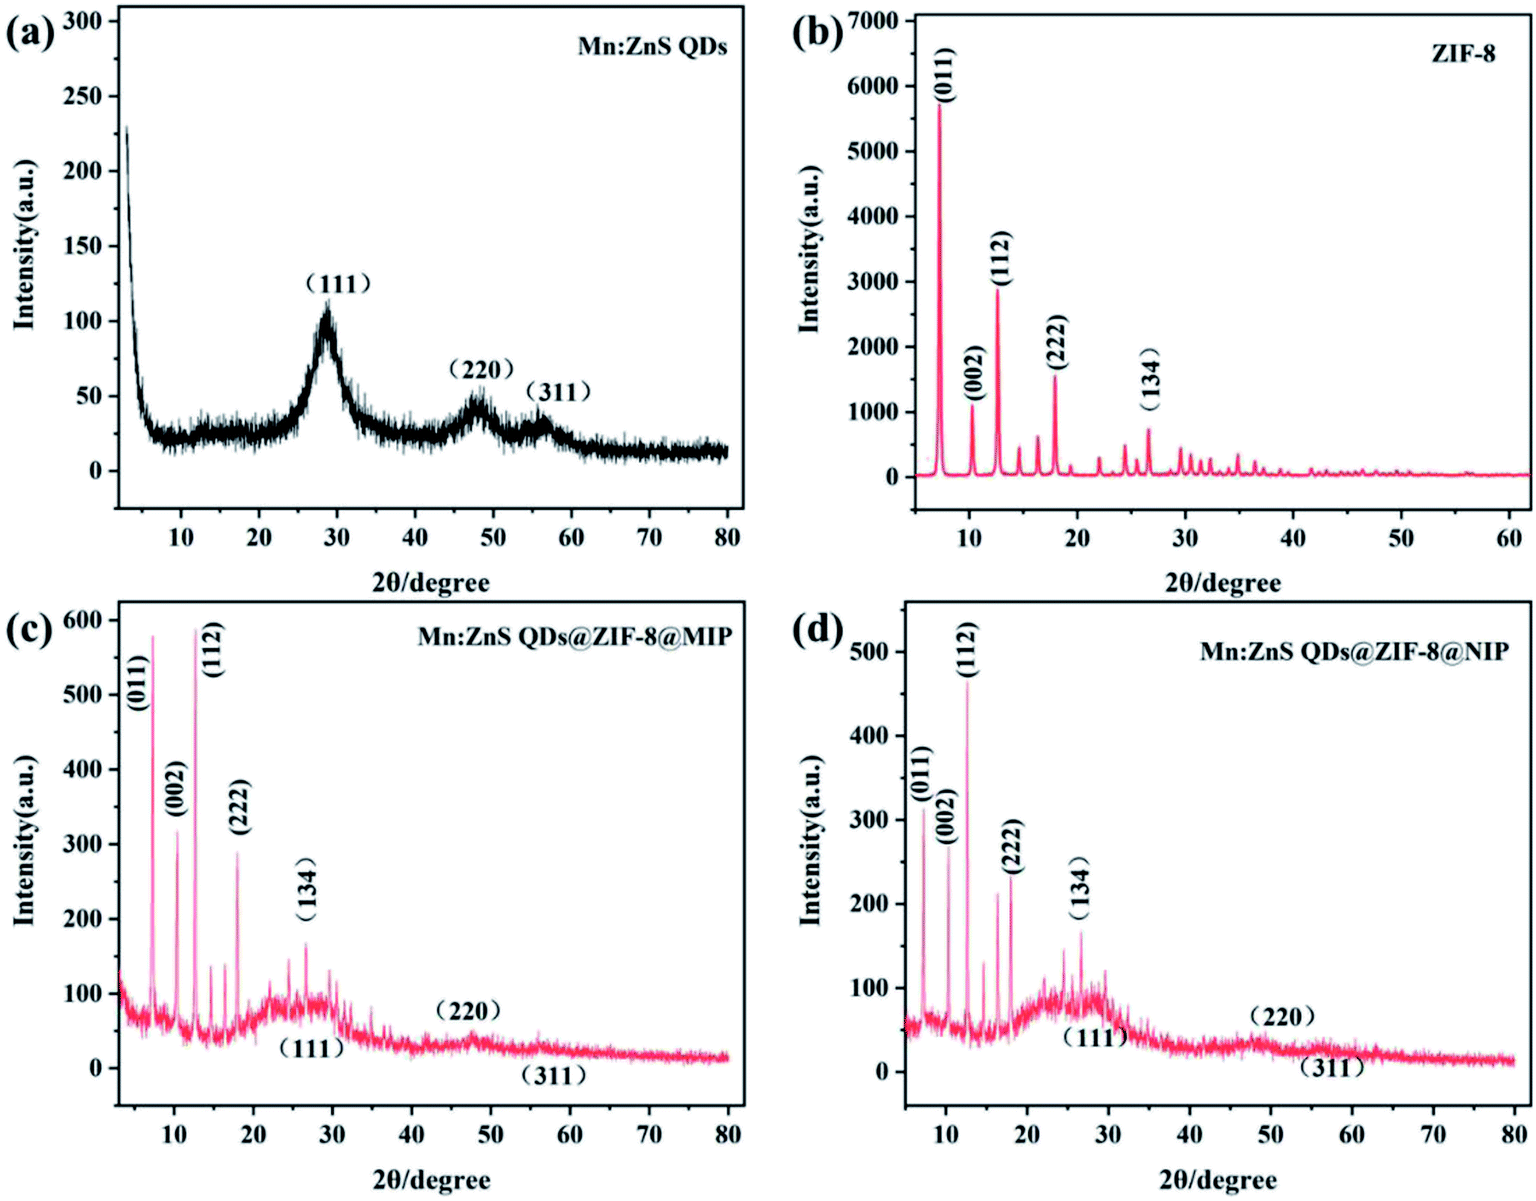
The crystal structures of the synthesized Mn:ZnS QDs, ZIF-8, Mn:ZnS QDs@ZIF-8@MIP and Mn:ZnS QDs@ZIF-8@NIP were characterized by XRD and the XRD patterns are shown in Fig. 3. We can see from Fig. 3 that the diffraction peaks of Mn:ZnS QDs@ZIF-8@MIP and Mn:ZnS QDs@ZIF-8@NIP are similar to those of Mn:ZnS QDs and ZIF-8. This result indicates that the crystal structure of Mn:ZnS QDs and ZIF-8 did not be changed after being coated with a molecularly imprinted layer, which further shows that Mn:ZnS QDs@ZIF-8@MIP and Mn:ZnS QDs@ZIF-8@NIP was successfully prepared.
 |
| | Fig. 3 XRD patterns for (a) Mn:ZnS QDs, (b) ZIF-8, (c) Mn:ZnS QDs@ZIF-8@MIP and (d) Mn:ZnS QDs@ZIF-8@NIP. | |
3.3 Optimization of response conditions
In order to study the phosphorescence response performance of the prepared Mn:ZnS QDs@ZIF-8@MIP to CPF, the optimal response conditions including the response time and the pH value of the reaction solution were first explored.
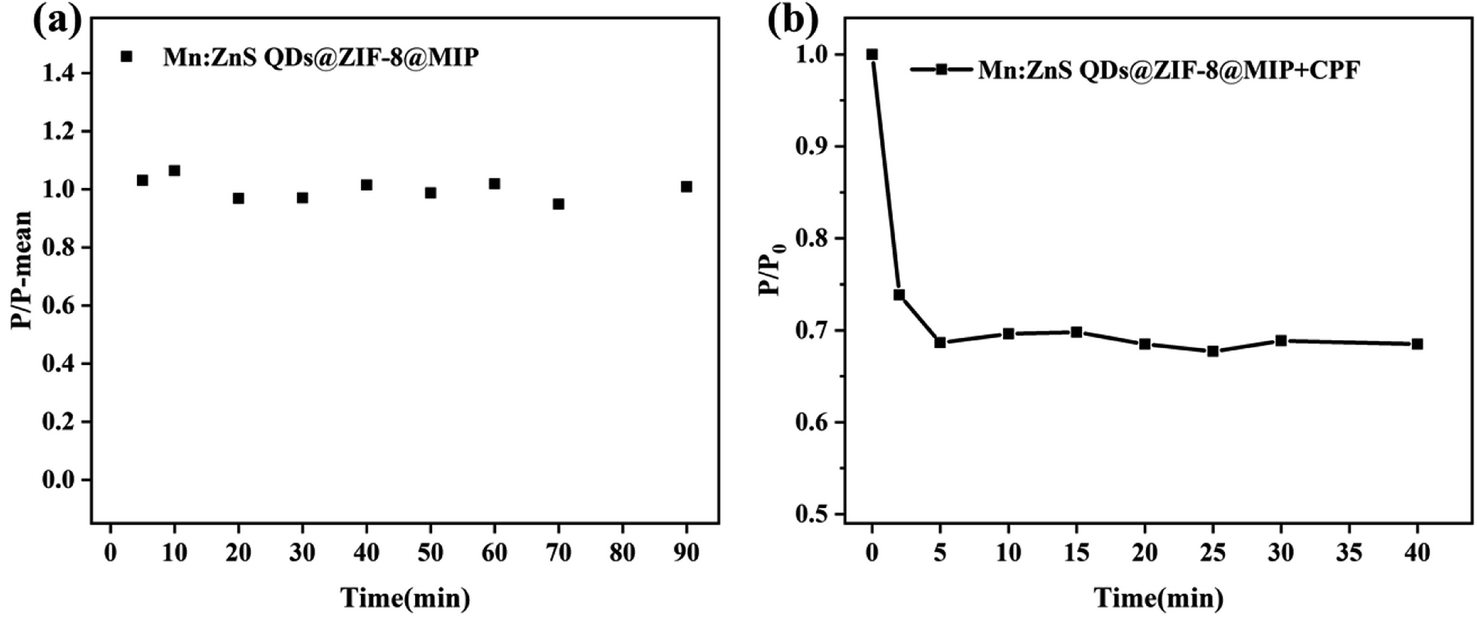
Before and after adding CPF, the changes of RTP intensity of Mn:ZnS QDs@ZIF-8@MIP with time are shown in Fig. 4. From Fig. 4(a) we can see that within 90 min, the RTP intensity of pure Mn:ZnS QDs@ZIF-8@MIP without adding CPF is basically maintained at about 1.0, which indicates that the RTP phosphorescence emission characteristics of the Mn:ZnS QDs@ZIF-8@MIP has good stability within 90 min. However, after adding CPF, we can see from Fig. 4(b) that the RTP intensity of Mn:ZnS QDs@ZIF-8@MIP shows a rapid decrease trend within 5 min, then after 5 min, it remains basically stable. This result indicates that due to the large surface area of ZIF-8 and the thin layer of imprinted polymer on the surface of Mn:ZnS QDs@ZIF-8, Mn:ZnS QDs@ZIF-8@MIP could quickly identify and phosphorescent response to CPF. And this response and identification process can be completed in 5 min. Based on the above analysis, 5 min is considered to be the best response time in the subsequent experimental research.
 |
| | Fig. 4 (a) Stability of the RTP intensity of Mn:ZnS QDs@ZIF-8@MIP; (b) effects of time on P/P0 of Mn:ZnS QDs@ZIF-8@MIP in the presence of CPF. | |
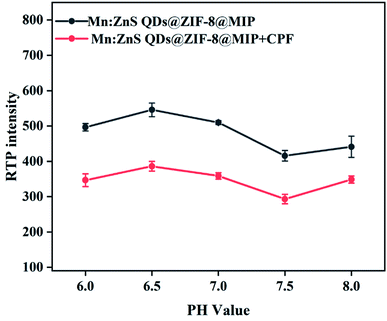
Many published articles have reported that the pH value has an important influence on the luminescence intensity of QDs-based fluorescence or phosphorescence sensors and the response characteristics of them to the analytes. Therefore, we studied the influence of pH on the RTP intensity of the prepared Mn:ZnS QDs@ZIF-8@MIP and the response characteristics of it to CPF. Considering that when the pH value is too low, the solution is a strong acid environment, so the S in Mn:ZnS QDs@ZIF-8@MIP will interact with H+ in the solution to generate H2S, which will lead to the RTP intensity of Mn:ZnS QDs@ZIF-8@MIP to be unstable. However, when the pH value is too high, the RTP intensity of Mn:ZnS QDs@ZIF-8@MIP in the strong alkaline solution decrease rapidly, thereby reducing the response sensitivity of Mn:ZnS QDs@ZIF-8@MIP to CPF. So we have studied in detail the influence of pH on the RTP intensity of Mn:ZnS QDs@ZIF-8@MIP to CPF before and after the adding of CPF when the pH is in the range of 6–8, and the results are shown in Fig. 5. From Fig. 5 we can see that when the pH value increased from 6 to 8, the RTP intensities of Mn:ZnS QDs@ZIF-8@MIP before and after adding CPF have the same change with pH, and when the pH is 6.5, the RTP intensities of them are the maximum. Therefore, the optimal pH value of the reaction solution is 6.5, and all subsequent experiments are carried out in the reaction solution with pH 6.5.
 |
| | Fig. 5 Effects of pH on RTP intensity of Mn:ZnS QDs@ZIF-8@MIP. | |
3.4 RTP responses of Mn:ZnS QDs@ZIF-8@MIP and Mn:ZnS QDs@ZIF-8@NIP to CPF
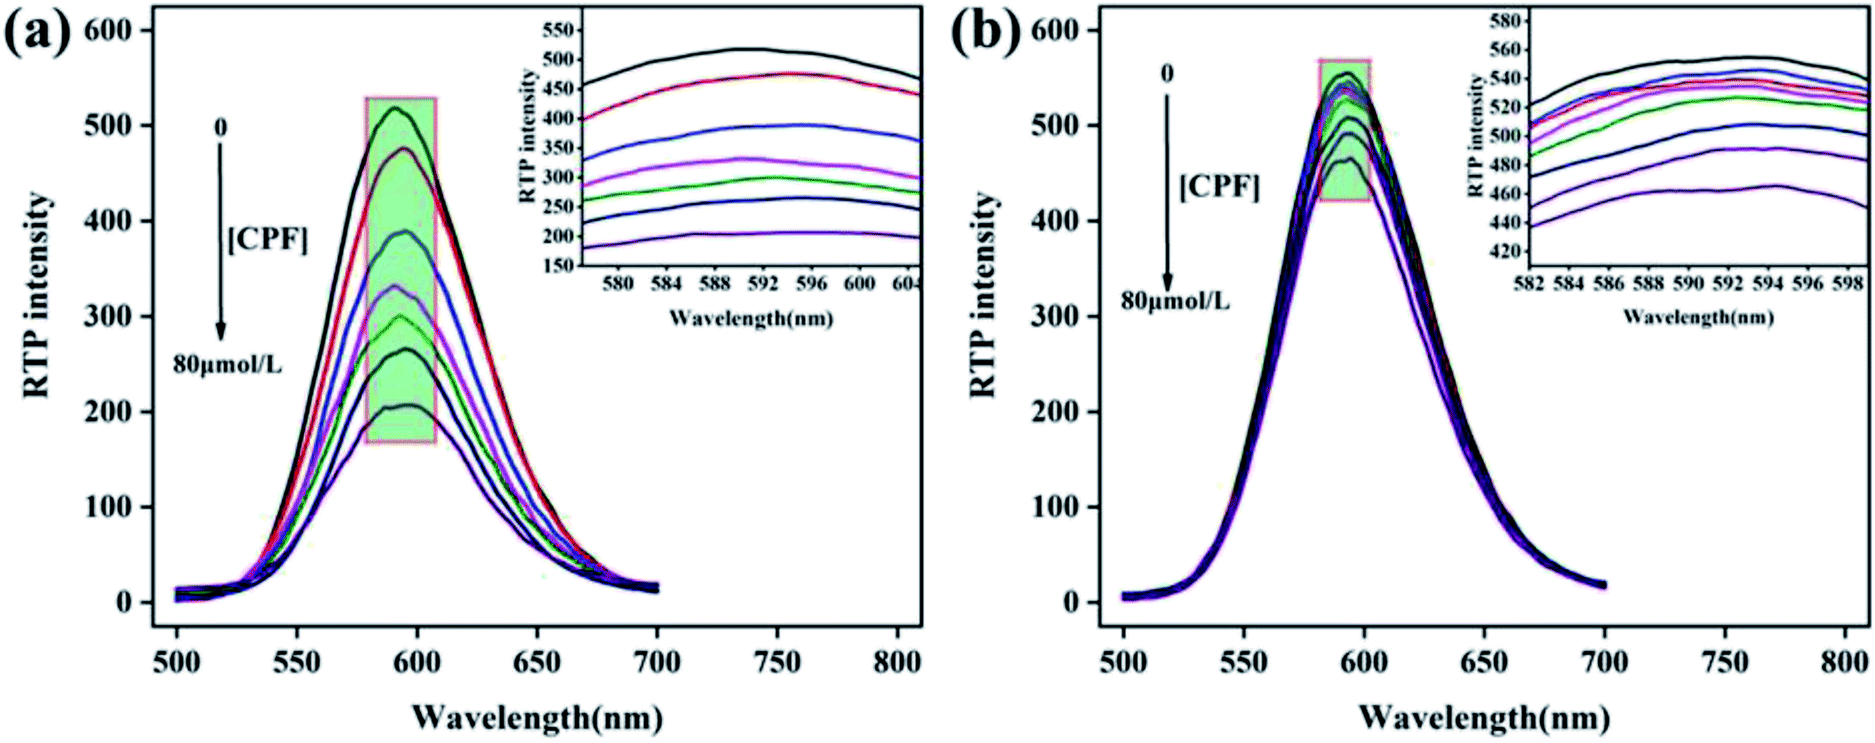
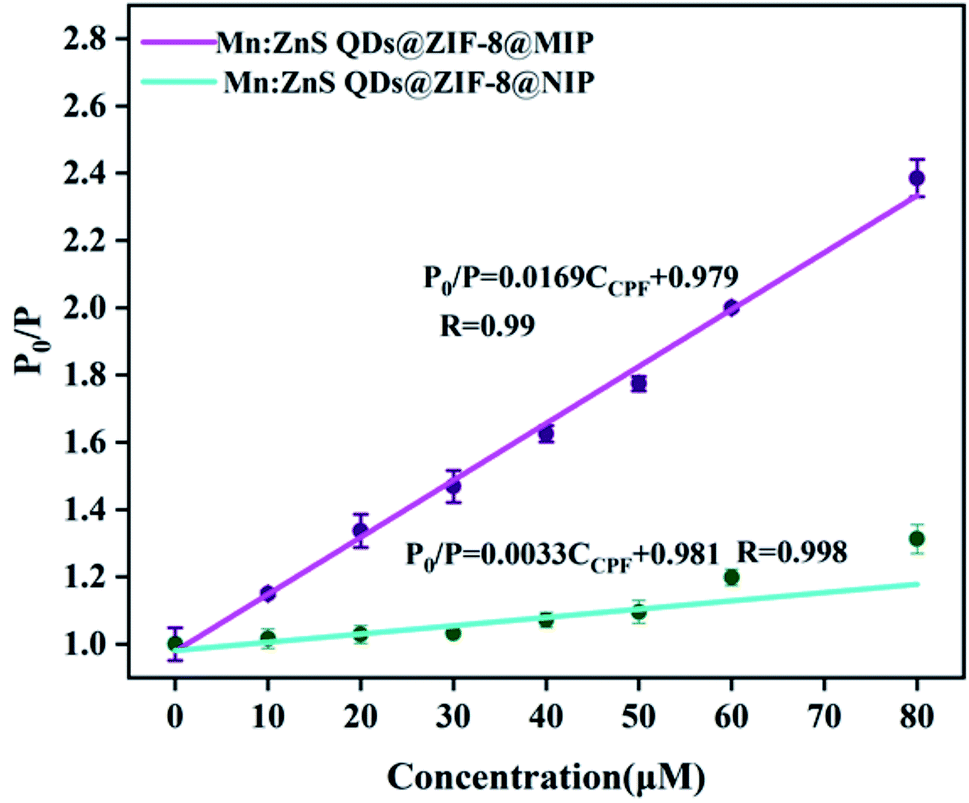
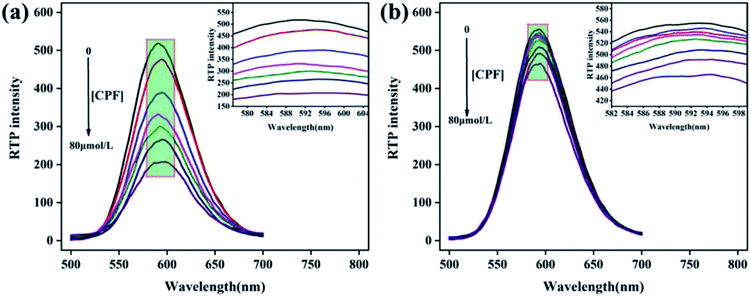
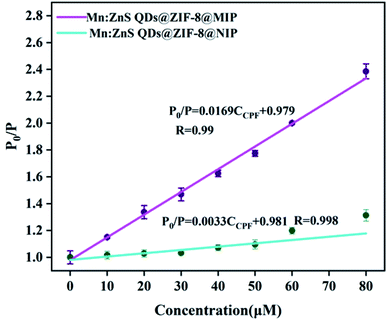
Under optimal conditions, the RTP response characteristics of Mn:ZnS QDs@ZIF-8@MIP and Mn:ZnS QDs@ZIF-8@NIP to different concentrations of CPF were evaluated. After adding different concentrations of CPF, the RTP spectra of Mn:ZnS QDs@ZIF-8@MIP and Mn:ZnS QDs@ZIF-8@NIP are shown in Fig. 6 when the response time is 5 min. As can been seen from Fig. 6 that in the CPF concentration range of 0–80 μM, the RTP intensity of both Mn:ZnS QDs@ZIF-8@MIP and Mn:ZnS QDs@ZIF-8@NIP decreases with the increase of CPF concentration, but the reduction degree of RTP intensity of Mn:ZnS QDs@ZIF-8@MIP is significantly greater than that of Mn:ZnS QDs@ZIF-8@NIP. Because the quenching degree of RTP intensity of Mn:ZnS QDs@ZIF-8@MIP or Mn:ZnS QDs@ZIF-8@NIP depended on the concentration of CPF, so the relationship between the RTP intensity ratio value of P0/P of Mn:ZnS QDs@ZIF-8@MIP or Mn:ZnS QDs@ZIF-8@NIP and the concentration of CPF was studied. As shown in Fig. 7, in the concentration range from 0–80 μM, for both Mn:ZnS QDs@ZIF-8@MIP and Mn:ZnS QDs@ZIF-8@NIP, before and after adding CPF, the RTP intensity ratio value of P0/P has a very good linear relationship with the concentration of CPF, which is well expressed by the Stern–Volmer RTP quenching equation:25
where P0 and P represent the RTP intensity of Mn:ZnS QDs@ZIF-8@MIP or Mn:ZnS QDs@ZIF-8@NIP in the absence and presence of CPF, respectively; C represents the concentration of CPF; KSV represents the Stern–Volmer quencher constant. As shown in Fig. 7, for the RTP quenching effect of CPF on Mn:ZnS QDs@ZIF-8@MIP, the KSV is 1.69 × 10⁻² (R = 0.99), but for the RTP quenching effect of CPF on Mn:ZnS QDs@ZIF-8@NIP, the KSV is 3.3 × 10⁻³ (R = 0.998). Based on the linear relationship between the ratio of RTP intensity and the concentration of CPF, the quenching effect of CPF on the RTP of Mn:ZnS QDs@ZIF-8@MIP can be used to develop a detection method of CPF based on Mn:ZnS QDs@ZIF-8@MIP as a phosphorescence sensors. And the limit of detection (LOD) of this method for detecting CPF was 0.89 μM according to the calculation formula LOD = 3σ/s, where σ is signified as the standard deviation of multiple measurements (n = 11) for blank sample, s is the slope of the calibration curve. Because drinking water hygiene standards and surface water environmental quality standards stipulate that the CPF limit does not exceed 1.0 μM, the LOD of Mn:ZnS QDs@ZIF-8@MIP for CPF is 0.89 μM, which is within its detection limit. So the LOD of Mn:ZnS QDs@ZIF-8@MIP shows that sensitivity can be used to detect the safety value of CPF in water. Imprinting factor (IF) is defined as IF = KSV,MIP/KSV,NIP, which is one of the key parameters to evaluate the specific recognition ability of phosphorescent sensors. In this study, the calculated value of IF is 5, which indicates that Mn:ZnS QDs@ZIF-8@MIP has higher sensitivity and selectivity than Mn:ZnS QDs@ZIF-8@NIP in terms of room temperature phosphorescence response to CPF. Because Mn:ZnS QDs@ZIF-8@MIP contains a large number of specific recognition sites to quickly and accurately match CPF, so it is reason that Mn:ZnS QDs@ZIF-8@MIP more pronounced quenching over the Mn:ZnS QDs@ZIF-8@NIP by CPF. Moreover, the detection performance of this phosphorescence detection method developed in this study was compared with other detection methods for CPF. As shown in Table 1, compared with chromatography, this phosphorescence method has a lower detection limit. At the same time, because it avoids complicated and cumbersome pre-processing, this phosphorescence method is fast, simple, and more suitable for field applications. Moreover, compared with other sensor-based methods, the detection limit of this phosphorescence method is the same order of magnitude as other methods, but this phosphorescence method has a wider detection range. The above results indicate that the phosphorescence method based on the constructed phosphorescent sensor of Mn:ZnS QDs@ZIF-8@MIP has obvious advantages in the field and rapid detection of CPF.
 |
| | Fig. 6 RTP response of (a) Mn:ZnS QDs@ZIF-8@MIP and (b) Mn:ZnS QDs@ZIF-8@NIP to different concentrations of CPF. | |
 |
| | Fig. 7 Relationship between P0/P and CPF concentration. | |
Table 1 Comparison of this method with other methods for the detection of CPF
| Methods |
Linear range (μM) |
LOD (μM) |
Reference |
| Solid phase extraction-HPLC-UV |
1 × 10² to 1 × 10⁷ |
2.9 |
28 |
| Graphene nanocomposites (rGO) electrochemical sensor |
0.71–71.13 |
0.23 |
29 |
| Fluorescence detector |
0.3–60 |
0.17 |
30 |
| Fluorescence, molecularly imprinted |
10–60 |
0.80 |
31 |
| Mn:ZnQDs@ZIF-8@MIP RTP sensor |
0–80 |
0.89 |
This work |
3.5 Selectivity of Mn:ZnS QDs@ZIF-8@MIP to CPF
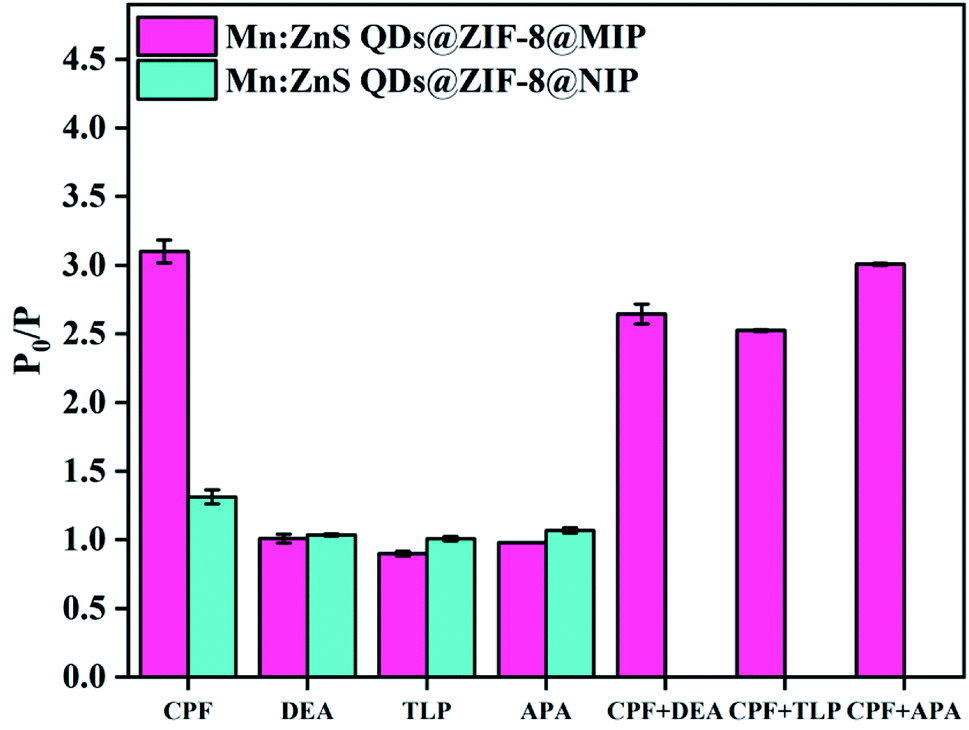
The responses of Mn:ZnS QDs@ZIF-8@MIP and Mn:ZnS QDs@ZIF-8@NIP to structural analogs of CPF (other organophosphorus pesticides such as dimethoate (DEA), trichlorfon (TLP) and acephate (APA)) with the same concentration (80 μM) were investigated. As shown in Fig. 8, when the four organophosphorus pesticides are present separately, only CPF has a significant effect on the RTP intensity of Mn:ZnS QDs@ZIF-8@MIP, and the ratio P0/P of RTP intensity can reach 3.1. However, DEA, TLP and APA have almost no effect on the RTP intensity of Mn:ZnS QDs@ZIF-8@MIP, and the ratio P0/P of RTP intensity is only in the range of 0.9–1.02, which is close to 1. In contrast, these four organophosphorus pesticides have a weaker effect on the RTP intensity of Mn:ZnS QDs@ZIF-8@NIP, and the degree of impact is relatively close, and the ratios P0/P of RTP intensity are all in the range of 1.02–1.35. Therefore, the IF of this Mn:ZnS QDs@ZIF-8@MIP response to CPF is the largest, which is much higher than that of Mn:ZnS QDs@ZIF-8@MIP response to the other three organophosphorus pesticides. When the three competing substances are present at the same time with the same concentration of CPF, the RTP quenching effect of Mn:ZnS QDs@ZIF-8@MIP in each system is similar to that in the system where only CPF existed. This indicates that the presence of competing substances with similar structures will not affect the RTP response of Mn:ZnS QDs@ZIF-8@MIP to CPF. The above results indicate that the successful coating of the molecularly imprinted layer on the surface of Mn:ZnS QDs@ZIF-8@MIP enables the phosphorescent sensor to have three-dimensionality and binding sites that are highly matched with CPF, which makes this phosphorescent sensor have better recognition performance for CPF, but for other organophosphorus pesticides, this recognition performance is poor. Therefore, the phosphorescent probe of Mn:ZnS QDs@ZIF-8@MIP is highly selective for CPF and can be used to selectively detect CPF based on the RTP quenching effect.
 |
| | Fig. 8 RTP quenching of Mn:ZnS QDs@ZIF-8@MIP and Mn:ZnS QDs@ZIF-8@NIP by different substances. | |
3.6 RTP response mechanism of Mn:ZnS QDs@ZIF-8@MIP to CPF
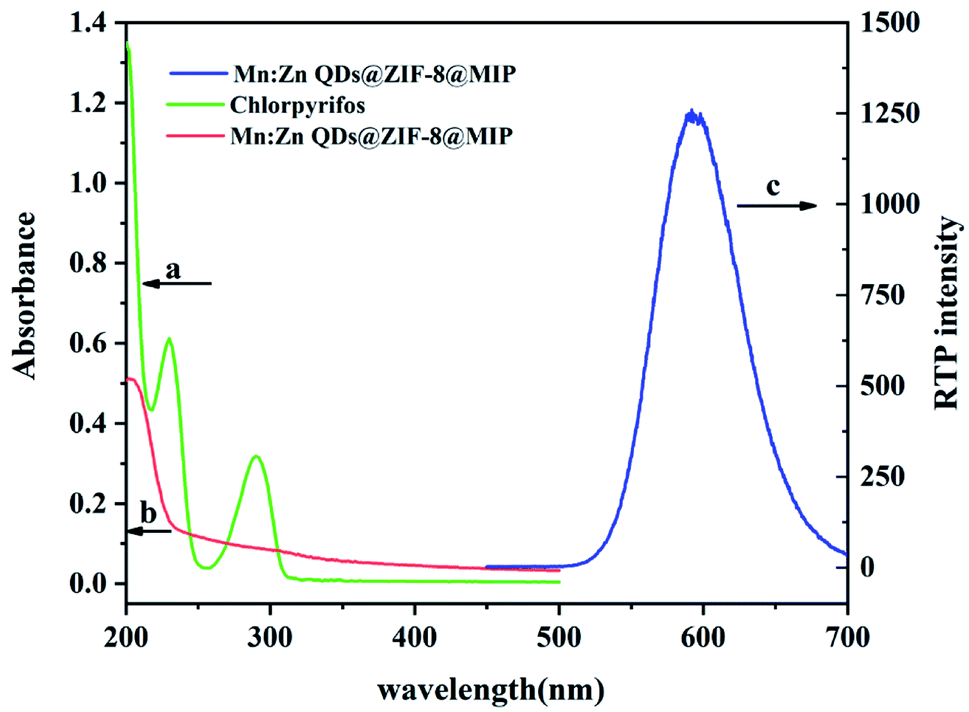
According to most literature reports on the study of fluorescence and phosphorescence quenching mechanism, the quenching effect between the quencher and the fluorescence or phosphorescent substance is mainly through photoinduced electron transfer (PIET) or energy resonance transfer.32 In order to explore the phosphorescence quenching mechanism of Mn:ZnS QDs@ZIF-8@MIP by CPF, the UV absorption spectra of CPF and Mn:ZnS QDs@ZIF-8@MIP, and the RTP spectrum of Mn:ZnS QDs@ZIF-8@MIP are shown in Fig. 9. From Fig. 9, we can see that the phosphorescence emission spectrum of Mn:ZnS QDs@ZIF-8@MIP in this experiment is in the range of 500–700 nm, which does not overlap with the absorption spectrum of CPF. This result indicates that there is no resonance energy transfer between Mn:ZnS QDs@ZIF-8@MIP and CPF. Therefore, the quenching process between Mn:ZnS QDs@ZIF-8@MIP and CPF can be attributed to PIET. The UV absorption of CPF is very close to the conduction band of Mn:ZnS QDs@ZIF-8@MIP. Excited electrons from Mn:ZnS QDs@ZIF-8@MIP to the conduction band can be directly transmitted to the lowest vacant molecular orbital ultraviolet energy level of CPF, and the excited state electrons return to the ground state, which explains how RTP of Mn:ZnS QDs@ZIF-8@MIP is quenched by CPF. As the concentration of CPF increases, the hydrogen bond between CPF and the binding sites of Mn:ZnS QDs@ZIF-8@MIP gradually increases, thereby increasing the PIET between Mn:ZnS QDs@ZIF-8@MIP and CPF. Therefore, due to the intermolecular interaction, the electron transfer between Mn:ZnS QDs@ZIF-8@MIP and CPF results in a quenching effect on the phosphorescence intensity of Mn:ZnS QDs@ZIF-8@MIP.
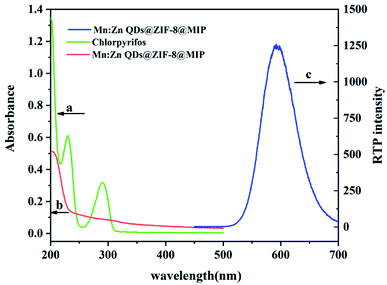 |
| | Fig. 9 Mechanism showing how CPF quenches the RTP of Mn:ZnS QDs@ZIF-8@MIP: (a) UV absorption spectrum of CPF; (b) UV absorption spectrum of Mn:ZnS QDs@ZIF-8@MIP; (c) RTP spectrum of Mn:ZnS QDs@ZIF-8@MIP. | |
3.7 Interference of potentially interfering ions
Usually real water contain a variety of metal ions. In order to explore whether these metal ions will affect the phosphorescence response of Mn:ZnS QDs@ZIF-8@MIP to CPF, under the optimal response conditions, the change of the RTP intensity of the Mn:ZnS QDs@ZIF-8@MIP and CPF detection system was studied when a variety of common ions coexist in the water body. As shown in Table 2, with the presence of 1 μM CPF, adding 2000 times K+, 2000 times Ca2+, 2000 times Mg2+, 2000 times Na+, 200 times Ba2+, 200 times NH4+, 200 times Zn2+ and 10 times Fe3+ to the detection system, there is no significant impact on the RTP intensity of Mn:ZnS QDs@ZIF-8@MIP-CPF and CPF detection system, and the degree of RTP intensity change of the system is in the range from −5.57% to 5.93%. This results show that Mn:ZnS QDs@ZIF-8@MIP can well resist the interference of the common ions on the detection of CPF.
Table 2 Effect of different metal ions on the RTP intensity of Mn:ZnS QDs@ZIF-8@MIP
| Metal ion |
[Co-existing substance]/CPF |
The change of RTP intensity (%) |
| K+(Cl−) |
2000 |
0.72 |
| Ca2+(Cl−) |
2000 |
5.93 |
| Mg2+(Cl−) |
2000 |
1.68 |
| Na+(Cl−) |
2000 |
4.41 |
| Ba2+(Cl−) |
200 |
1.53 |
| NH4+(Cl−) |
200 |
−0.15 |
| Zn2+(SO42−) |
200 |
3.08 |
| Fe3+(Cl−) |
10 |
−5.57 |
3.8 Real water sample analysis
In order to further evaluate the practical application of the developed method for CPF detection based on Mn:ZnS QDs@ZIF-8@MIP as a phosphorescence sensor, river water and tap water were collected as different analysis samples of CPF. Since CPF was not found in these real water samples by the developed method, a standard addition method was adopted to carry out the recovery experiment. As shown in Table 3, when 10 μM and 50 μM CPF was spiked into the real water samples, respectively, the recoveries range from 92% to 105% with a relative standard deviation of less than 1%. The above results fully demonstrate that the developed method has high precision and reliability for the detection of CPF in real water samples.
Table 3 Quantitative determination of CPF in real water samples
| Sample |
Added (μM) |
Found (μM) |
RSD (%) (n = 3) |
Recovery (%) |
| Tap water |
0 |
0 |
— |
— |
| 10 |
10.03 |
0.23 |
100.3 |
| 50 |
51.99 |
0.48 |
103.98 |
| River water |
0 |
0 |
— |
— |
| 10 |
9.25 |
0.39 |
92.5 |
| 50 |
47.81 |
0.41 |
95.62 |
4. Conclusion
Aiming at the problems of QDs agglomeration and easy to obtain thicker molecular imprinting layer during the preparation of target sensors by the combination of QDs and MIPs which affects the measurement precision and the sensitivity of detecting target analyte, using ZIF-8 as the imprinting support material and Mn:ZnS QDs as the phosphorescent emitter, we successfully prepared a phosphorescence sensor (Mn:ZnS QDs@ZIF-8@MIP) with high selectivity to CPF. The sensor has a sensitive phosphorescence quenching response to CPF in a wide range of CPF concentration. The developed RTP detection method of CPF based on the phosphorescence sensor (Mn:ZnS QDs@ZIF-8@MIP) can effectively avoid the interference of matrix auto-fluorescence and scattered light, and will not be affected by the common coexisting metal ions in the water, which has been successfully applied to the detection of CPF in real water samples. Moreover, the RTP detection method of CPF has the characteristics of simplicity, rapidity, high selection and high sensitivity. In brief, this research provides an important basis for the development of new molecularly imprinted phosphorescence probes for water pollutants and the establishment of new phosphorescence detection methods.
Author contributions
Mengxi Fan designed the experiments, processed the data and wrote the paper; Fangbeibei Cheng helped process experimental data; Tingting Gan revised the paper; Gaofang Yin and Nanjing Zhao checked and revised the paper. All the authors have given approval to the final version of the manuscript.
Conflicts of interest
The authors declare no competing interests.
Acknowledgements
This work was financially supported by the National Natural Science Foundation of China [grant number 61805254], the Chinese Academy of Sciences Instrument and Equipment Function Development Technology Innovation Project [grant number Y93H3g1251], the National Key Research and Development Program of China [grant number 2016YFC1400602], and the Dean Fund of Hefei Institutes of Physical Science, Chinese Academy of Sciences [grant number YZJJ201606].
Notes and references
- R. D. Burke, S. W. Todd, E. Lumsden, R. J. Mullins, J. Mamczarz, W. P. Fawcett, R. P. Gullapalli, W. R. Randall, E. F. R. Pereira and E. X. Albuquerque, J. Neurochem., 2017, 142, 162–177 CrossRef CAS PubMed.
- E. Ballesteros and M. J. Parrado, J. Chromatogr. A, 2004, 1029, 267–273 CrossRef CAS PubMed.
- G. L. Peng, Q. He, D. Mmereki, G. M. Zhou, W. L. Pan, L. Gu, L. L. Fan, X. H. Tang, J. H. Chen and Y. F. Mao, J. Sep. Sci., 2015, 38, 3487–3493 CrossRef CAS PubMed.
- G. Ma and L. G. Chen, Food Anal. Methods, 2014, 7, 377–388 CrossRef.
- S. Bogialli, R. Curini, A. D. Corcia, M. Nazzari and R. Samperi, Anal. Chem., 2003, 75, 1798–1804 CrossRef CAS PubMed.
- G. Font, A. Juan-García and Y. Picó, J. Chromatogr. A, 2007, 1159, 233–241 CrossRef CAS PubMed.
- Q. Xu, X. Y. Guo, L. Xu, Y. Ying, Y. P. Wu, Y. Wen and H. F. Yang, Sens. Actuators, B, 2017, 241, 1008–1013 CrossRef CAS.
- A. M. Derfus, W. C. W. Chan and S. N. Bhatia, Nano Lett., 2004, 4, 11–18 CrossRef CAS PubMed.
- J. L. Chen, Microchim. Acta, 2017, 184, 1335–1343 CrossRef CAS.
- S. Q. Luo, G. Q. Yan and X. J. Sun, New J. Chem., 2018, 42, 9510–9516 RSC.
- T. T. Gan, Y. J. Zhang, N. J. Zhao, X. Xiao, G. F. Yin, S. H. Yu, H. B. Wang, J. B. Duan, C. Y. Shi and W. Q. Liu, Spectrochim. Acta, Part A, 2012, 99, 62–68 CrossRef CAS PubMed.
- U. Hasegawa, S.-i. M. Nomura, S. C. Kaul, T. Hirano and K. Akiyoshi, Biochem. Biophys. Res. Commun., 2005, 331, 917–921 CrossRef CAS PubMed.
- Z. Z. Zheng, Y. L. Zhou, X. Y. Li, S. Q. Liu and Z. Y. Tang, Biosens. Bioelectron., 2011, 26, 3081–3085 CrossRef CAS PubMed.
- X. H. Ren, H. C. Liu and L. G. Chen, Microchim. Acta, 2015, 18, 193–200 CrossRef.
- Y. M. Miao, X. J. Sun, J. Z. Lv and G. Q. Yan, ACS Appl. Mater. Interfaces, 2019, 11, 2264–2272 CrossRef CAS PubMed.
- G. D. T. M. Jayasinghe, R. Domínguez-Gonzalez, P. Bermejo-Barrera and A. Moreda-Piñeiro, Anal. Chim. Acta, 2020, 1103, 183–191 CrossRef PubMed.
- S. Yang, Y. H. Wang, Y. D. Jiang, S. Li and W. Liu, Polymers, 2016, 8(6), 216 CrossRef PubMed.
- J. W. Li, Y. L. Wang, S. Yan, X. J. Li and S. Y. Pan, Food Chem., 2016, 192, 260–267 CrossRef CAS PubMed.
- J. Wackerlig and P. A. Lieberzeit, Sens. Actuators, B, 2015, 207, 144–157 CrossRef CAS.
- A. H. Chughtai, N. Ahmad, H. A. Younus, A. Laypkovc and F. Verpoort, Chem. Soc. Rev., 2015, 44, 6804–6849 RSC.
- Q. R. Fang, J. H. Wang, S. Gu, R. B. Kaspar, Z. B. Zhuang, J. Zheng, H. X. Guo, S.
L. Qiu and Y. S. Yan, J. Am. Chem. Soc., 2015, 137, 8352–8355 CrossRef CAS PubMed.
- F. Y. Yi, J. P. Li, D. Wu and Z. M. Sun, Chem.–Eur. J., 2015, 21, 11475–11482 CrossRef CAS PubMed.
- Y. J. Ma, G. H. Xu, F. D. Wei, Y. Cen, X. M. Xu, M. L. Shi, X. Cheng, Y. Y. Chai, M. Sohail and Q. Hu, ACS Appl. Mater. Interfaces, 2018, 10, 20801–20805 CrossRef CAS PubMed.
- G. Lu, S. Z. Li, Z. Guo, O. K. Farha, B. G. Hauser, X. Y. Qi, Y. Wang, X. Wang, S. Y. Han, X. G. Liu, J. S. DuChene, H. Zhang, Q. C. Zhang, X. D. Chen, J. Ma, S. C. J. Loo, W. D. Wei, Y. H. Yang, J. T. Hupp and F. W. Huo, Nat. Chem., 2012, 4, 310–316 CrossRef CAS PubMed.
- H. F. Wang, Y. He, T. R. Ji and X. P. Yan, Anal. Chem., 2009, 81, 1615–1621 CrossRef CAS PubMed.
- L. H. Xu, M. F. Pan, G. Z. Fang and S. Wang, Sens. Actuators, B, 2019, 286, 321–327 CrossRef CAS.
- X. Q. Liu, Z. P. Zhou, T. Wang, P. Y. Deng and Y. S. Yan, J. Mater. Sci., 2020, 55, 14153–14165 CrossRef CAS.
- Q. Lu, X. M. Chen, L. Nie, J. Luo, H. J. Jiang, L. N. Chen, Q. Hu, S. H. Du and Z. P. Zhang, Talanta, 2010, 81, 959–966 CrossRef CAS PubMed.
- Y. Zhang, Z. Xia, Q. Z. Li, G. F. Gui, G. Y. Zhao and L. L. Lin, J. Electrochem. Soc., 2017, 164(2), B48–B53 CrossRef CAS.
- X. H. Ren, H. C. Liu and L. G. Chen, Microchim. Acta, 2015, 182, 193–200 CrossRef CAS.
- Y. C. Wang, N. W. Wang, X. N. Ni, Q. Q. Jiang, W. M. Yang, W. H. Huang and W. Z. Xu, RSC Adv., 2015, 5, 73424–73433 RSC.
- Q. Yang, J. H. Li, X. Y. Wang, H. L. Peng, H. Xiong and L. X. Chen, Biosens. Bioelectron., 2018, 112, 54–71 CrossRef CAS PubMed.
|
| This journal is © The Royal Society of Chemistry 2021 |
Click here to see how this site uses Cookies. View our privacy policy here. 
 Open Access Article
 This Open Access Article is licensed under a Creative Commons Attribution-Non Commercial 3.0 Unported Licence
 a,
Tingting Gan
a,
Tingting Gan