
 Open Access Article
 This Open Access Article is licensed under a Creative Commons Attribution-Non Commercial 3.0 Unported Licence
Single-atom niobium doped BCN nanotubes for highly sensitive electrochemical detection of nitrobenzene
Meng Lia,
Xianyun Pengb,
Xijun Liu b,
Huaisheng Wangc,
Shusheng Zhang*a and
Guangzhi Hu*ade
b,
Huaisheng Wangc,
Shusheng Zhang*a and
Guangzhi Hu*ade
aCollege of Chemistry, Zhengzhou University, Zhengzhou 450000, China. E-mail: zsszz@126.com
bInstitute for New Energy Materials and Low-Carbon Technologies, Tianjin University of Technology, Tianjin 300384, China
cSchool of Chemistry and Chemical Engineering, Liaocheng University, Liaocheng 252000, China
dInstitute for Ecological Research and Pollution Control of Plateau Lakes, School of Ecology and Environmental Science, Yunnan University, Kunming 650504, China. E-mail: guangzhihu@ynu.edu.cn
eCollege of Biological, Chemical Sciences and Engineering, Jiaxing University, Jiaxing, Zhejiang 314001, China
First published on 31st August 2021
Abstract
Herein, single-atom niobium-doped boron–carbon–nitrogen nanotubes (SANb-BCN) were synthesized and utilized to fabricate an electrochemical sensor for the detection of nitrobenzene (NB), an environmental pollutant. SANb-BCN were characterized through scanning transmission electron microscopy, scanning electron microscopy, transmission electron microscopy, X-ray diffraction analysis, and Raman spectroscopy. The Nb-BNC material modified on a glassy carbon electrode (GCE) showed an excellent electrochemical response behavior toward NB. The SANb-BCN-modified GCE (SANb-BCN/GCE) gave rise to a prominent NB reduction peak at −0.6 V, which was positively shifted by 120 mV from the NB reduction peak of the bare GCE. Furthermore, the NB peak current (55.74 μA) obtained using SANb-BCN/GCE was nearly 42-fold higher than that using the bare GCE (1.32 μA), indicating that SANb-BCN/GCE is a highly sensitive electrochemical sensor for NB. An ultralow limit of detection (0.70 μM, S/N = 3) was also achieved. Furthermore, the SANb-BCN/GCE sensor was found to possess favorable anti-interference ability during NB detection; thus, the presence of various organic and inorganic coexisting species, including Mg2+, Cr6+, Cu2+, K+, Ca2+, NH4+, Cd2+, urea, 1-bromo-4-nitrobenzene, 3-hydroxybenzoic, terephthalic acid, 1-iodo-4-nitrobenzene, and toluene, minimally affected the NB detection signal. Notably, the SANb-BNC sensor material exhibited high sensitivity and specificity toward detection of NB in environmental samples. Thus, the use of the proposed sensor will serve as an effective alternative method for the identification and treatment of pollutants.
Introduction
Nitrobenzene (NB) is a raw material used in various organic syntheses, such as the production of aniline and pesticides.1,2 However, it is a persistent organic pollutant, and its presence in the environment must be monitored. NB can enter the human body through the skin and respiratory tract, and its total retention rate can reach ∼80%.3 In addition, intermediate substances produced by the biotransformation of NB,4 such as m-nitrophenol and p-nitrophenol, are more toxic than NB itself. Due to the high toxicity of NB in humans and animals, the World Health Organization listed it as a 2B carcinogen in 2017. NB is often unavoidably released into the environment, and regular monitoring of NB in water systems is the only preventive measure to avoid permanent damage to human and animal health.5–7 To this end, the development of efficient, rapid, and convenient NB detection methods is of great significance.Numerous methods have been developed for detecting NB in water systems, which employ techniques such as high-phase liquid chromatography, meteorological chromatography, and electrochemical analysis.8,9 Although rapid and selective NB detection is achievable through chromatography, several disadvantages including low recognition ability, complex operation, and bulky equipment prevent its application as a portable technique for on-site detection.10 In contrast, electrochemical methods allow for rapid, portable, convenient analysis as well as exhibit low limits of detection (LODs).11 In addition, electrochemical methods allow for the integration of various analysis modes such as differential pulse voltammetry, and linear sweep voltammetry (LSV), cyclic voltammetry, square wave voltammetry.
Single-atom catalysis has emerged as an effective tool for numerous typical heterogeneous catalytic processes,12 including CO oxidation,13,14 the water-gas shift reaction,15 hydrogen evolution reaction,16,17 hydrogenation,18,19 oxygen reduction reaction,20,21 and degradation of persistent organic pollution.22 Single-atom catalysts exhibit excellent performance toward various reactions owing to their unique coordination structure as well as high atom utilization rate, activity, and selectivity.23,24 The use of such catalysts is expected to bridge the gap between homogeneous25 and heterogeneous catalysis.26,27 The synthetic technology for accessing single-atom catalysts has gradually matured.28 Yin et al. synthesized single atom Fe catalysis to catalyze Fenton-type reactions,29 and Xu et al. developed single cobalt atom catalyst improving peroxymonosulfate oxidation of several organic pollutants.30 Wu et al. developed a monoatomic iron catalyst for nitrate reduction and electrochemical ammonia synthesis.31
Every structural unit of monoatomic materials cannot be ignored. Similar to metal enzymes in nature, in fact, in addition to the central metal atom, the structure of the single-atom sensor also has adjacent coordination atoms, as well as the supported substrate and the functional groups on its surface, all of which play an important role. The reason for the excellent performance of monoatomic materials in electrochemical sensing applications is the unique monodisperse metal sites and electronic structure. Although such representative studies have demonstrated the effectiveness and applicability of single-atom catalysis, only a few single-atom sensors have been reported for the detection of NB.32,33 Therefore, it is important to develop a single-atom sensor for the detection of pollutants.
Herein, we reported the composite of single-atom niobium-doped boron–nitrogen–carbon nanotubes (SANb-BCN) for highly sensitive electrochemical detection of NB. Fig. 1 illustrates the preparation process and detection mechanism of the sensor. A single-atom Nb sensor supported on B, N, and C co-doped carbon nanotubes was prepared using the template method.34,35 The following characterization methods were applied successively to determine the morphology and element distribution: X-ray diffraction (XRD), scanning electron microscopy (SEM), scanning transmission electron microscopy (STEM), transmission electron microscopy (TEM) analysis, and Raman spectroscopy. A modified electrode (SANb-BCN/GCE) was prepared as the sensor, and the electrochemical behavior of NB on the electrode was studied by controlling the electrochemical experimental conditions. Under optimized conditions, SANb-BCN/GCE exhibited high selectivity for NB and a low LOD. Finally, SANb-BCN/GCE was used to analyze the target contaminant in actual samples and showed excellent results.
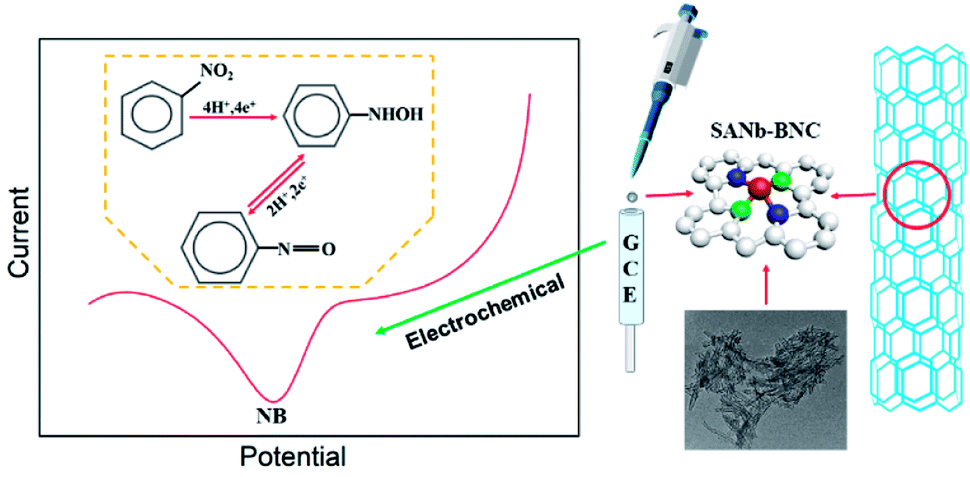 | ||
| Fig. 1 Detection mechanism and preparation process of Nb-BNC/GCE. | ||
Experimental
Reagents and instruments
All reagents were of analytical grade. Polyethylene glycol (HO(CH2CH2O)nH), urea (CH4N2O), and boric acid (H3BO3) were purchased from Aladdin (Shanghai, China). Niobium oxalate (C10H5NbO20) and NB (C6H5NO2) were obtained from Macklin (Shanghai, China) and were used directly without purification. The PBS buffer solution contained a certain concentration of sodium dihydrogen phosphate (Macklin) and disodium hydrogen phosphate (Macklin) and was freshly prepared. Ultrapure water (≥18.25 MΩ cm−1) was used to configure all solutions used in the experiments.LSV responses were recorded using an electrochemical workstation named CHI-660E (Shanghai Chenhua Instrument Co., Ltd., China) equipped with a three-electrode system at room temperature. In this system, the counter electrode is a platinum wire electrode, the reference electrode uses Ag/AgCl electrode, and the modified electrode and GCE were used as the working electrode.
Synthesis of SANb-BCN
Briefly, niobium oxalate (50 mg), urea (10 g), polyethylene glycol (1 g), and boric acid (0.3 g) were dissolved in deionized water with stirring. Then, a melamine foam template (0.3 g) was soaked in the solution for 15 hours. After solvent removal, the sample was vacuum dried at 80 °C for 24 hours to obtain a solid powder. The powder was calcined and carbonized in a tube furnace under a nitrogen atmosphere at 900 °C (2 °C min−1) to obtain SANb-BCN.Preparation of SANb-BCN/GCE
The GCE was gently wiped with moist lens cleaning paper to ensure that the electrode surface was clean and smooth. The electrode surface was then successively polished with 300 nm and 50 nm polishing powder using a chamois. And in each polishing stage, use deionized water, ethanol and acetone in order to ultrasonic for 15 s, and then dried in a nitrogen atmosphere for later use. SANb-BCN (2 mg) was ultrasonically dispersed in deionized water (1 mL), and the dispersion (10 μL) was dropped onto the surface of the vertical GCE, followed by air drying for 48 h to obtain SANb-BCN/GCE, at room temperature.Electrochemical measurements
LSV was performed at a scan rate of 50 mV s−1 in the range from −0.1 to −1 V potential range. Prior to each measurement, N2 was bubbled through the electrolyte for 15 min to remove any dissolved oxygen. The amperometric i–t (IT) curve allows NB to be deposited on the electrode surface for LSV testing. The IT curve was obtained by stirring and enriching NB for 100 s (enrichment time) at a voltage of −0.3 V (deposition potential). The electrolyte used for the LSV test comprised PBS (10 mL, 0.1 M, pH 7.0) containing 0.1 mM NB.Results and discussion
Characterization of SANb-BCN
As seen in the TEM and SEM images shown in Fig. 2a and b, respectively, the prepared SANb-BCN presented in the form of rod-shaped nanotubes morphology. The length of the nanotubes varied, and their diameter was approximately 50 nm. Single Nb sites, as opposed to Nb clusters, can be clearly observed in the STEM images. In addition, the EDS elemental mapping results confirmed that Nb, B, N, and C were uniformly distributed. These findings verified that the Nb atoms were monodispersed in the nanotubes. Such uniform dispersion can maximize atom utilization, activity, and contact with the test substance. | ||
| Fig. 2 (a) SEM, (b) TEM, (c) STEM images of SANb-BCN; some SANb sites are highlighted by red circles. (d–h) Elemental maps of as-synthesized SANb-BNC showing the distribution of B (e), C (f), N (g), Nb (h). | ||
Two peaks were observed at 1330 and 1585 cm−1 in the Raman spectrum of Nb-BNC (Fig. 3a), characteristic of carbon atom crystals. Peak D represents defects in the lattice of C atoms, and peak G is attributed to the in-plane stretching vibration of sp2 hybridized C atoms.33 A simple calculation [I(D)/I(G) = 1.16] was employed to reveal the existence of defects in the C atom crystal. In the XRD pattern shown in Fig. 3b, the two diffraction peaks at 27° and 42° correspond to the two faces of graphitic carbon (002 and 101). Nb diffraction peaks were not observed in the entire scanned spectrum. Based on these results, it was concluded that SANb-BCN did not contain Nb-related crystals. X-ray absorption fine structure (EXAFS) of the Nb-BCN nanotubes confirmed that each Nb atom in Nb-BNC nanotubes was atomically coordinated with two B atoms and two N atoms fourfold.36 The dispersion of single Nb atoms on the nanotube provides abundant active sites on SANb-BCN, thereby enhancing its electrochemical sensing performance.
 | ||
| Fig. 3 (a) Raman spectrum and (b) XRD pattern of Nb-BNC. | ||
Electrode comparison
To evaluate the electrochemical sensing performance of SANb-BCN/GCE for NB, we compared the LSV curves of a bare GCE and those of SANb-BCN/GCE obtained under the same NB concentration (Fig. 4). In the case of the bare electrode, the curves obtained in the presence (red curve) and absence of NB (black curve) differed only slightly, with the former showing a weak reduction peak at −0.72 V. In contrast, the two modified electrodes displayed a relatively strong current signal response in the presence of NB. SANb-BCN/GCE and BCN/GCE gave rise to a strong reduction peak at −0.6 V, which was positively offset by 120 mV from that of the bare GCE. The NB peak current attained using BCN/GCE (11.83 μA) was nearly 9-fold higher than that of the bare GCE (1.32 μA). Moreover, the NB peak current attained using SANb-BCN/GCE (55.74 μA) was nearly 42-fold higher than that of the bare GCE. These electrochemical test results indicate the applicability of SANb-BCN/GCE as an electrochemical sensor for NB detection. | ||
| Fig. 4 LSV curves of bare GCE and SANb-BNC/GCE and BNC/GCE in 0.1 M PBS with 0.1 mM NB, and the LSV of bare GCE without NB, scan rate: 50 mV s−1. | ||
Optimization of experimental conditions
To maximize the NB current signal of the modified electrode, a series of conditions were optimized. The amount of SANb-BCN on the surface of the modified electrode affects its response.37 Hence, we first explored the influence of SANb-BCN concentration on the current signal. Within a certain range, the current signal intensity increased rapidly with increasing SANb-BCN concentration, reaching a maximum at a concentration of 2 mg mL−1 (Fig. 5a). Further increase in the concentration led to the reduction of the current signal. Interestingly, the amount of modification applied to the electrode surface had a significant impact on the current signal (Fig. 5b). As the amount of SANb-BCN dropped onto the surface of the electrode increased, the current signal continued to increase, stabilizing with the deposition of ∼8 μL. | ||
| Fig. 5 Effect of SANb-BCN (a) concentration and (b) modification amount on the signal response. (c) signal response of SANb-BCN/GCE in 0.1 M PBS containing 0.1 mM NB at pH ranging from 4 to 10. (d) Relationship between pH and voltage. (e) The effect of enrichment time (10–200 s) and (f) enrichment potential (0.3, 0, −0.1, −0.2, −0.3, −0.4, −0.5 V) on current response. (g) LSV curves of different scan rates (10–100 mV s−1), (h) the effect of different scan rates on current response. | ||
The pH of a solution is indicative of the total hydrogen ion concentration and is an important parameter affecting redox activity.38 Therefore, the NB reduction performance of SANb-BCN/GCE was evaluated at a pH range of 4–10; the corresponding results are shown in Fig. 5c. As the pH increased, the current signal first increased and then decreased, reaching a maximum at pH 7.0. This may be because the concentration of H+ ions affect the electrochemical performance of SANb-BCN/GCE when the pH is not neutral. Moreover, the NB reduction peak position shifted as the pH increased. Fig. 5d illustrates that the NB reduction peak potential and the pH are linearly dependent, with R2 = 0.994. This result confirms that H+ concentration affects the electrochemical behavior of the electrode surface, and that the optimal pH for NB reduction is 7.0. In addition, by analyzing the relationship between pH and voltage, it can be concluded that NB is first reduced to phenylhydroxylamine by accepting four electrons, followed by conversion to nitrosobenzene through a two-electron oxidation process.39
With the optimized electrode and electrolyte in hand, we commenced the optimization of the experimental program, including the enrichment time and enrichment potential. The default enrichment time of the instrument is 100 s, and the substance to be tested is generally enriched in equilibrium for this duration. Thus, we tested the current response at enrichment time in the range of 10–200 s (Fig. 5e). Evidently, when the enrichment time reached 100 s, the current response signal was balanced. As the enrichment time increased further, the current signal increased negligibly. With regard to the enrichment potential, it was found that the current signal reached a maximum at a potential of −0.3 V, and as the voltage increased further, the current response shows a downward trend (Fig. 5f). Presumably, when the enrichment voltage exceeds a certain threshold, the oxidation of NB is no longer the dominant reaction and the incidence of side reactions increases.
The LSV curves of different scanning rates is to analyze the specific reaction mechanism of the electrode surface. As shown in Fig. 5g and h, the LSV curves with the scan rates of 10–100 mV s−1 presents a different current background. As the scan rate increases, the current response first increases and then decreases, and the current value reaches the maximum at 50 mV s−1. At the same time, as the scanning speed increases, the peak position slowly moves to a more negative potential. This is because a too fast scan rate will increase the charging current density of the electric double layer and the decrease in the solution ohmic point, which will reduce the utilization of the material. A scan rate that is too slow will cause the NB on the electrode surface to stay for too long and hinder the reduction of other NB molecules.
Linear fit
To further understand the electrochemical NB sensing mechanism of SANb-BCN/GCE, LSV curves were acquired under optimized conditions at varying concentrations of NB. As shown in the LSV curve in Fig. 6a, the current response increased with increasing NB concentration. Based on the two graphs in Fig. 6b and c, it can be concluded that the current response is linearly correlated with NB concentration. It is worth noting that we have partitioned the linear range into two concentration ranges: 2–100 μM and 100–600 μM. Generally, pollutants must be adsorbed onto the sensor modified on the electrode surface to be reduced or oxidized, thereby generating a certain current response to be detected. When the NB concentration is low, the active sites on the sensor surface are not all occupied. When the concentration of the reactant increases to a certain point, adsorption saturation is reached to a degree, and the adsorption enhancement effect gradually weakens. Hence, the current response growth rate decreases.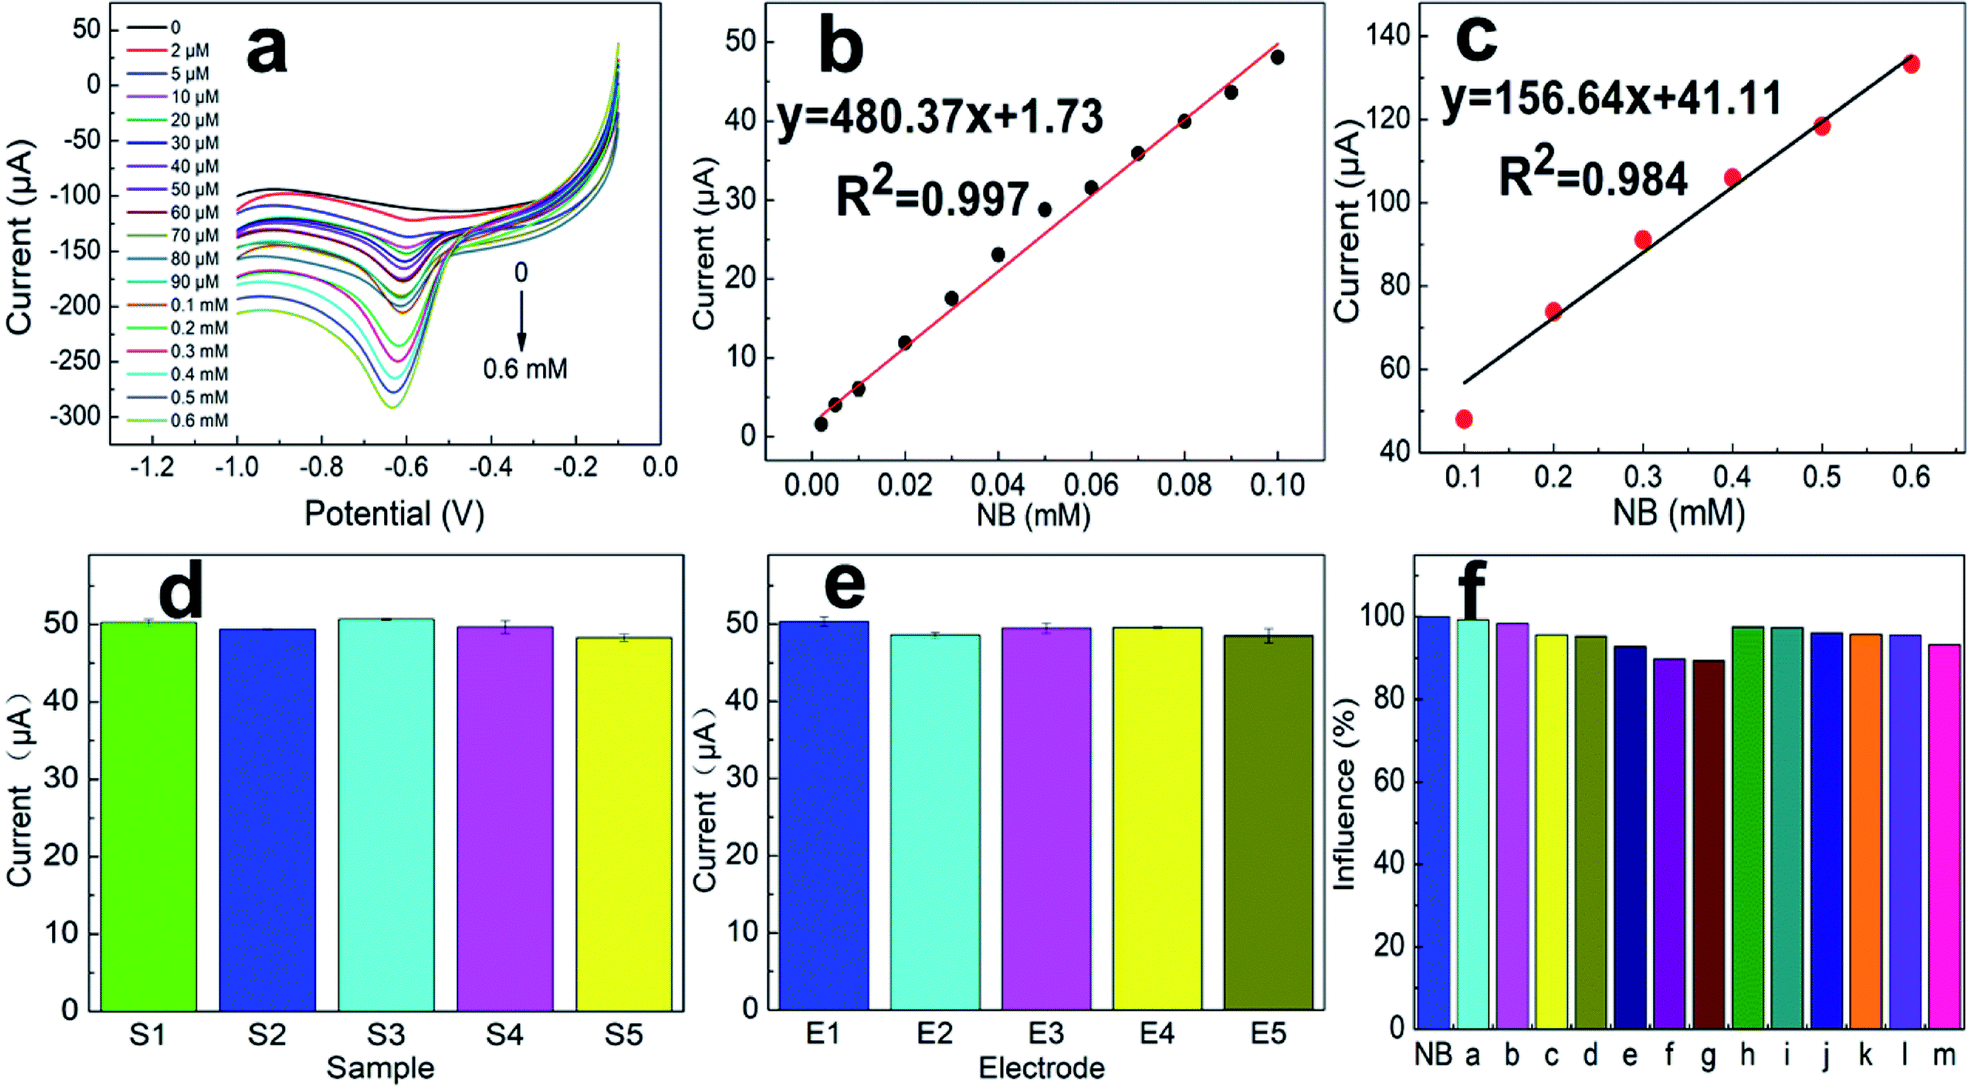 | ||
| Fig. 6 (a) LSV curves obtained at NB concentrations of 0–600 μM under optimized conditions (pH 7.0, 0.1 M PBS). Current response at NB concentrations of (b) 2–100 μM and (c) 100–600 μM. (d) Current signal responses of a single SANb-BCN/GCE acquired using five individual samples. (e) Current signal responses of five SANb-BCN/GCEs obtained using the same sample. (f) Current signal interference resulting from the presence of Mg2+, Cr6+, Cu2+, K+, Ca2+, NH4+, Cd2+, urea, 1-bromo-4-nitrobenzene, 3-hydroxybenzoic, terephthalic acid, 1-iodo-4-nitrobenzene, and toluene (labeled a–m, all at a 100-times higher concentration than that of NB). | ||
Therefore, the linear range was fitted sectionally, as is commonly practiced. The regression equations obtained by linear fitting are expressed as follows:
2–100 μM:
| I (μA) = 480.37C (NB per mM) + 1.73, R2 = 0.997, |
100–600 μM:
| I (μA) = 156.64C (NB per mM) + 41.11, R2 = 0.984. |
| Modified electrode | Detection method | Linear range (μM) | LOD (μM) | R2 | Reference |
|---|---|---|---|---|---|
| a PAA: poly amic acid, AgNPs: silver nanoparticles, GC: glassy carbon electrode, ZSO–gCN: stannate–graphitic carbon nitride, LDH: layered double hydroxides, SDS: sodium dodecyl sulfate, UiO-66-NH2: Zr-based metal organic frameworks, GO: oxide graphene sheets, ATP: attapulgite, BiF: bismuth-film, GPE: carbon paste electrode. | |||||
| PAA–AgNPs/GC | Amperometry | 10–600 | 1.68 | 0.9735 | 42 |
| ZSO–gCN/GCE | LSV | 30–100, 100–1000 | 2.2 | 0.971, 0.994 | 43 |
| Ni/Fe–LDH | DPV | 1–10, 10–100, 100–350 | 0.327 | 0.999, 0.984, 0.999 | 44 |
| Ni/Fe(SDS)–LDH | DPV | 1–10,10–100,100–350 | 0.093 | 0.983, 0.995, 0.999 | 44 |
| UiO-66-NH2 | Fluorescence quenching | 0–30 | 0.91 | 0.995 | 6 |
| TiO2GO-1 | CV | 2–8 | 2.64 | 0.968 | 45 |
| TiO2GO-2 | CV | 0–4 | 0.969 | 45 | |
| ATP–Ag/GCE | LSV | 3–30 | 1.1 | 0.997 | 46 |
| BiF/CPE | SWV | 1–100 | 0.83 | 0.998 | 47 |
| SANb-BCN/GCE | LSV | 2–100, 100–600 | 0.70 | 0.997, 0.984 | This work |
Repeatability and reproducibility
The consistency between consecutive measurement results obtained using a single device under similar conditions represents repeatability. The consistency between the measurement results when the measurement conditions are changed indicates the reproducibility.40 The repeatability and reproducibility of an electrode are indicative of its reliability and applicability. Thus, at a scan rate of 50 mV s−1, the response of one electrode was recorded in five different 0.1 M PBS solutions containing 0.1 mM NB. The results were shown in Fig. 6d; the current response error of the electrode for the five solutions was less than 5%. In addition, under the same conditions, the current signal responses of five individual electrodes to the same solution were comparable (Fig. 6e). These results indicate that SANb-BCN/GCE is capable of generating repeatable and reproducible data.Evaluation of anti-interference
Natural water systems contain various ions and chemicals41 that may affect pollutant detection results to varying degrees. The selectivity of SANb-BCN/GCE for NB was studied in the presence of various inorganic and organic substances. Thus, the same detection method and environment were used to detect the current signal response for NB in the presence of potential interference species, namely, Mg2+, Cr6+, Cu2+, K+, Ca2+, NH4+, Cd2+, urea, 1-bromo-4-nitrobenzene, 3-hydroxybenzoic, terephthalic acid, 1-iodo-4-nitrobenzene, and toluene, all at a 100-times higher concentration than that of NB (Fig. 6f, (a–m)). Not surprisingly, the presence of the above-mentioned interfering species at such high concentrations resulted in a slight change in the NB current response, but the interference was less than 9%. This result demonstrates the excellent selectivity of SANb-BCN/GCE for NB detection.Real sample analysis
The recovery rate reflects the operational skill level of the analyst, but more importantly, it reflects whether the analytical method is suitable for testing a specific substrate.48 To further verify the applicability of SANb-BCN/GCE, real water samples were analyzed, including tap water and lake water. NB (30 μM and 50 μM) was added to the actual water samples to simulate water pollution, and the recovery rate was calculated. The tap water sample was obtained from a faucet in the laboratory of Yunnan University without dilution and filtration. Lake water was sampled from Qilu lake, one of the eight major plateau lakes in China. Because the lake water sample was relatively turbid, it was filtered through a membrane with a diameter of 0.45 μm.In the case of tap water (Fig. 7a), R2 = 0.999 and the recovery rates of 30 and 50 μM NB were 108.4% and 98.1%, respectively. For lake water (Fig. 7b), R2 = 0.999, and the recovery rates of 30 and 50 μM NB were 108.3% and 99.3%, respectively. The value of the linear correlation coefficient and excellent recovery rates indicate that SANb-BCN/GCE is applicable for electrochemical sensing in actual water samples.
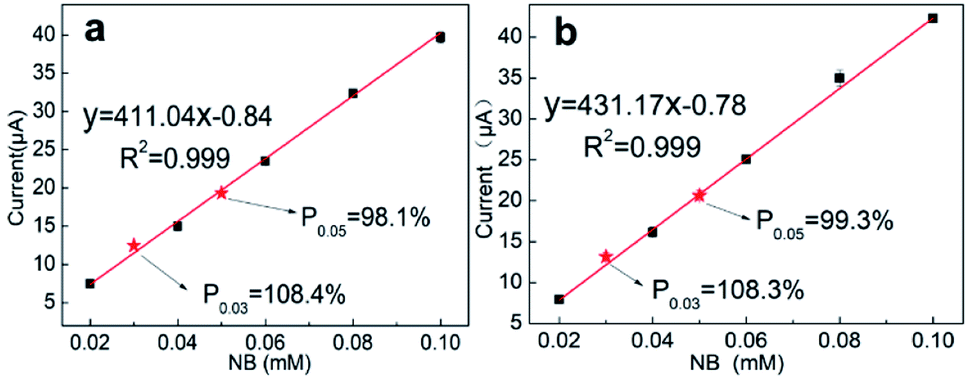 | ||
| Fig. 7 NB detection using SANb-BCN/GCE in (a) tap water and (b) Qilu lake water samples; the red dots represent the standard samples. | ||
Conclusions
Monoatomic Nb doped BNC nanotubes were prepared via the template method, and the prepared materials were modified on GCE. The resultant sensor was used for the detection of NB in aqueous media. SANb-BCN was characterized through STEM, TEM, EDS, SEM, and XRD analysis to determine its morphology and element distribution. In addition to revealing the morphology of the nanotubes, the characterization results indicated that monoatomic Nb was well-dispersed. The monodispersing of Nb is advantageous for enhancing the electrochemical sensing performance of the modified electrode. Moreover, the optimal monitoring conditions were determined by optimizing the modification amount and concentration, enrichment time and potential, and pH. Furthermore, a good linear relationship, relatively low LOD, and a relatively wide linear range were achieved using the developed sensing method. Finally, the successful detection of NB in lake and tap water samples confirmed the practical utility of SANb-BCN/GCE. Owing to the high selectivity of SANb-BCN/GCE for NB and the low LOD, its application for the detection of NB in the environment is feasible. Therefore, the proposed detection system can be used for on-site environmental sample analysis.Author contributions
Meng Li: investigation, validation, original draft writing. Xianyun Peng and Xijun Liu: investigation and validation. Huaisheng Wang: investigation, methodology. Shusheng Zhang and Guangzhi Hu: supervision, resources, writing-review.Conflicts of interest
There are no conflicts to declare.Acknowledgements
This work was financially supported by the National Key Research & Development Program of China (2019YFC1804400), National Natural Science Foundation of China (21974124, 22004109, 22076174), and ‘Double-First Class’ University Construction Project (C176220100042 and CZ21623201).References
- D. Gu, N. Shao, Y. Zhu, H. Wu and B. Wang, J. Hazard. Mater., 2017, 321, 703–710 CrossRef CAS PubMed
.
- T. He, C. Zhang, L. Zhang and A. Du, Nano Res., 2019, 12, 1817–1823 CrossRef CAS
- M. Velmurugan, N. Karikalan, S.-M. Chen and Z.-C. Dai, J. Colloid Interface Sci., 2017, 490, 365–371 CrossRef CAS PubMed
- X. Zhao, C. Xiang, F. Zhang, F. Yao, R. Sheng, Q. Ding, W. Liu, H. Zhang and X. Zhou, ACS Appl. Mater. Interfaces, 2019, 11, 43214–43222 CrossRef CAS
- G. Koleva, B. Galabov, B. Hadjieva, H. F. Schaefer Iii and P. v. R. Schleyer, Angew. Chem., Int. Ed., 2020, 59, 7986 CrossRef CAS PubMed
- K. Vellingiri, D. W. Boukhvalov, S. K. Pandey, A. Deep and K.-H. Kim, Sens. Actuators, B, 2017, 245, 305–313 CrossRef CAS
- T.-T. Li, L. Liu, M.-L. Gao and Z.-B. Han, Chem. Commun., 2019, 55, 4941–4944 RSC
- H. Qu and X. Duan, Sci. China Mater., 2019, 62, 611–623 CrossRef
- T. Kartanas, A. Levin, Z. Toprakcioglu, T. Scheidt, T. A. Hakala, J. Charmet and T. P. J. Knowles, Anal. Chem., 2021, 93, 2848–2853 CrossRef CAS PubMed
- N. Abdulhussain, S. Nawada and P. Schoenmakers, Chem. Rev., 2021 DOI:10.1021/acs.chemrev.0c01244
- M. V. Mirkin, T. Sun, Y. Yu and M. Zhou, Acc. Chem. Res., 2016, 49, 2328–2335 CrossRef CAS
- Q. Zhang and J. Guan, Adv. Funct. Mater., 2020, 30, 2000768 CrossRef CAS
- X. Zhang, J. Lei, D. Wu, X. Zhao, Y. Jing and Z. Zhou, J. Mater. Chem. A, 2016, 4, 4871–4876 RSC
- T. Hu, H. Su, Q. Li and E. Kan, J. Mater. Chem. A, 2020, 8, 20725–20731 RSC
- L. Sun, J. Xu, X. Liu, B. Qiao, L. Li, Y. Ren, Q. Wan, J. Lin, S. Lin, X. Wang, H. Guo and T. Zhang, ACS Catal., 2021, 11, 5942–5950 CrossRef CAS
- D. Wang, Q. Li, C. Han, Z. Xing and X. Yang, Appl. Catal., B, 2019, 249, 91–97 CrossRef CAS
- K. Jiang, M. Luo, Z. Liu, M. Peng, D. Chen, Y.-R. Lu, T.-S. Chan, F. M. F. de Groot and Y. Tan, Nat. Commun., 2021, 12, 1687 CrossRef CAS
- Y. Feng, Y. Guan, H. Zhang, Z. Huang, J. Li, Z. Jiang, X. Gu and Y. Wang, J. Mater. Chem. A, 2018, 6, 11783–11789 RSC
- J. Li, M. N. Banis, Z. Ren, K. R. Adair, K. Doyle-Davis, D. M. Meira, Y. Z. Finfrock, L. Zhang, F. Kong, T.-K. Sham, R. Li, J. Luo and X. Sun, Small, 2021, 17, 2007245 CrossRef CAS
- M. Xiao, J. Zhu, G. Li, N. Li, S. Li, Z. P. Cano, L. Ma, P. Cui, P. Xu, G. Jiang, H. Jin, S. Wang, T. Wu, J. Lu, A. Yu, D. Su and Z. Chen, Angew. Chem., Int. Ed., 2019, 58, 9648 CrossRef
- P. Song, M. Luo, X. Liu, W. Xing, W. Xu, Z. Jiang and L. Gu, Adv. Funct. Mater., 2017, 27, 1700802 CrossRef
- J. Yang, D. Zeng, Q. Zhang, R. Cui, M. Hassan, L. Dong, J. Li and Y. He, Appl. Catal., B, 2020, 279, 119363 CrossRef CAS
- Y. Wang, J. Mao, X. Meng, L. Yu, D. Deng and X. Bao, Chem. Rev., 2019, 119, 1806–1854 CrossRef CAS
- Y. Zhang, Nat. Rev. Chem., 2018, 2, 0151 CrossRef
- M. L. Pegis, C. F. Wise, D. J. Martin and J. M. Mayer, Chem. Rev., 2018, 118, 2340–2391 CrossRef CAS PubMed
- N. Zheng and T. Zhang, Natl. Sci. Rev., 2018, 5, 625 CrossRef
- A. Chatterjee and V. R. Jensen, ACS Catal., 2017, 7, 2543–2547 CrossRef CAS
- D. Liu, A. Barbar, T. Najam, M. S. Javed, J. Shen, P. Tsiakaras and X. Cai, Appl. Catal., B, 2021, 297, 120389 CrossRef CAS
- Y. Yin, L. Shi, W. Li, X. Li, H. Wu, Z. Ao, W. Tian, S. Liu, S. Wang and H. Sun, Environ. Sci. Technol., 2019, 53, 11391–11400 CrossRef CAS
- H. Xu, N. Jiang, D. Wang, L. Wang, Y. Song, Z. Chen, J. Ma and T. Zhang, Appl. Catal., B, 2020, 263, 118350 CrossRef CAS
- Z.-Y. Wu, M. Karamad, X. Yong, Q. Huang, D. A. Cullen, P. Zhu, C. Xia, Q. Xiao, M. Shakouri, F.-Y. Chen, J. Y. Kim, Y. Xia, K. Heck, Y. Hu, M. S. Wong, Q. Li, I. Gates, S. Siahrostami and H. Wang, Nat. Commun., 2021, 12, 2870 CrossRef CAS PubMed
- R. Ramachandran, T.-W. Chen, S.-M. Chen, T. Baskar, R. Kannan, P. Elumalai, P. Raja, T. Jeyapragasam, K. Dinakaran and G. p. Gnana kumar, Inorg. Chem. Front., 2019, 6, 3418–3439 RSC
- M. B. Gawande, K. Ariga and Y. Yamauchi, Small, 2021, 17, 2101584 CrossRef CAS
- F. Lü, S. Zhao, R. Guo, J. He, X. Peng, H. Bao, J. Fu, L. Han, G. Qi, J. Luo, X. Tang and X. Liu, Nano Energy, 2019, 61, 420–427 CrossRef
- L. Zhang, L. Han, H. Liu, X. Liu and J. Luo, Angew. Chem., Int. Ed., 2017, 56, 13694–13698 CrossRef CAS PubMed
- X. Peng, Y. Mi, H. Bao, Y. Liu, D. Qi, Y. Qiu, L. Zhuo, S. Zhao, J. Sun, X. Tang, J. Luo and X. Liu, Nano Energy, 2020, 78, 105321 CrossRef CAS
- J. Tashkhourian, M. Daneshi, F. Nami-Ana, M. Behbahani and A. Bagheri, J. Hazard. Mater., 2016, 318, 117–124 CrossRef CAS
- S. Rojas-Carbonell, K. Artyushkova, A. Serov, C. Santoro, I. Matanovic and P. Atanassov, ACS Catal., 2018, 8, 3041–3053 CrossRef CAS
- Y. Sang, Y. Cui, Z. Li, W. Ye, H. Li, X. S. Zhao and P. Guo, Sens. Actuators, B, 2016, 234, 46–52 CrossRef CAS
- J. V. Sweedler, Anal. Chem., 2019, 91, 7971–7972 CrossRef CAS
- X. Zhang, Y. Zhang, P. Shi, Z. Bi, Z. Shan and L. Ren, Sci. Total Environ., 2021, 770, 144674 CrossRef CAS
- V. M. Kariuki, S. A. Fasih-Ahmad, F. J. Osonga and O. A. Sadik, Analyst, 2016, 141, 2259–2269 RSC
- S. Vinoth, P. Mary Rajaitha and A. Pandikumar, Compos. Sci. Technol., 2020, 195, 108192 CrossRef CAS
- S.-S. Li, J.-H. Fang, L. Li, M. Zhu, F. Zhang, B.-Y. Zhang, T.-J. Jiang and Y.-X. Zhang, Talanta, 2021, 225, 122087 CrossRef CAS
- M. M. Ruiz-Ramirez, C. Silva-Carrillo, J. J. Hinostroza-Mojarro, Y. Y. Rivera-Lugo, P. Valle-Trujillo and B. Trujillo-Navarrete, Fuel, 2021, 283, 119326 CrossRef CAS
- F. Liang, B. Liu, Y. Deng, S. Yang and C. Sun, Microchim. Acta, 2011, 174, 407 CrossRef CAS
- L. Luo, X. Wang, Y. Ding, Q. Li, J. Jia and D. Deng, Anal. Methods, 2010, 2, 1095–1100 RSC
- S. Kubendhiran, S. Sakthinathan, S.-M. Chen, P. Tamizhdurai, K. Shanthi and C. Karuppiah, J. Colloid Interface Sci., 2017, 497, 207–216 CrossRef CAS PubMed
| This journal is © The Royal Society of Chemistry 2021 |