 Open Access Article
Effects of TiO2 doping on the performance of thermochemical energy storage based on Mn2O3/Mn3O4 redox materials
Boyan Wang ab,
Zhiyuan Wang
 *ab,
Binlin Douab,
Yan Maab and
Yijing Liangab
aSchool of Energy and Power Engineering, University of Shanghai for Science and Technology, Shanghai 200093, China. E-mail: wangzhiyuan@usst.edu.cn
bShanghai Key Laboratory of Multiphase Flow and Heat Transfer in Power Engineering, Shanghai 200093, China
First published on 15th October 2021
Abstract
A thermochemical energy storage (TCES) system can adjust problems of unstable energy supply for solar concentrating power plants. Mn2O3/Mn3O4 system is a promising TCES system, but it has the problem of a difficult reoxidation process. In this paper, TiO2 was doped into the manganese oxide TCES system to solve this problem and the factors which influence the performance of this method were analyzed. The different performances between commercial Mn2O3 (Mn) and Mn2O3 synthesized by the Pechini method (PCMn), and different scales of doping agents (25Ti, 100Ti) were compared. Because of the formation of the Mn2TiO4, adding TiO2 into the manganese oxide TCES system could improve its reoxidation process obviously. During single complete redox process, PCMn had better performance than Mn whether doped with TiO2 or not, but Mn had a higher optimum oxidation temperature and a narrow temperature range of the redox reactions after adding TiO2. Adding 25Ti could bring higher energy storage density than adding 100Ti, and the optimal doping ratio was 0.05. As the doping ratio of 25Ti was increased, the activation energy (Ea) was increased and then decreased. The Ea of the samples doped with 25Ti was higher than that doped with 100Ti. Moreover, the Ea of the 25Mn0.05 was decreased firstly and then was increased in the later stage of the reaction. The doped Mn samples exhibited better performance and lower attenuation than the doped PCMn samples after 30 cycles. During cyclic tests, the Mn2TiO4 was initially formed at the boundary between Mn2O3 and TiO2, and it was generated continuously with the extension of operating time. Therefore, the operating temperature, morphology of the Mn2O3, the doping agents, the doping ratio, and the phase change with the operating time should be all considered when doping TiO2 into the Mn2O3/Mn3O4 TCES system to improve its performance. Moreover, the results obtained from Mn–Ti systems would make a lot sense when other similar systems are considered, such as Mn–Fe, Mn–Si, Mn–Cr, etc.
1. Introduction
With the continuous population growth, the energy demand of human beings is on the rise. Direct burning of fossil fuels is one of the main ways to obtain energy, but it causes a lot of problems, such as environmental pollution and greenhouse gas emissions. Hanif et al.1 investigated the effects of burning fossil fuels on the triggered CO2 emissions in emerging Asian economies. They demonstrated that most of the environmental degradation in Asia is caused by fossil fuels rather than other factors. Therefore, replacing fossil fuels with green renewable energy is very important for the sustainable development of human society, and renewable energy sources have become of main interest for clean energy production in recent years. Due to its green and renewable characteristics, solar energy has been widely studied as an alternative to fossil fuels. With the development of technology, the efficiency of solar energy equipment is higher. Gradually, solar power generation can be divided into two types – solar photovoltaic power generation and solar thermal power generation. A concentrating solar power (CSP) plant is a kind of solar thermal power generation scheme, which transforms sunlight to electrical energy involving sunlight to heat and heat to electricity. However, it exhibits the inherent disadvantages of the instability of power generation, which is varied with the season, weather, and many other factors.2 Therefore, heat storage systems are commonly implemented in CSP to improve efficiency. Nowadays, the percentage of concentrating solar power plants with heat storage systems has been reached around 70%, and the most used heat storage system includes molten salt, the concrete and steam systems followed.3,4 Molten salt and steam systems belong to latent heat storage technology, the concrete system belongs to the sensible heat storage system. The heat storage technology can be divided into three types according to the physicochemical phenomena involved in the process: latent heat storage, sensible heat storage, and thermochemical energy storage (TCES). Compared with sensible heat storage and latent heat storage, thermochemical energy storage presents advantages of longer transportation distance of energy, no attenuation, and higher energy storage density.5 The thermochemical energy storage system can be further divided into hydrides, hydroxides, carbonates, and metal oxide systems. Due to the advantages of no need of gas storage, air can be used as heat transfer fluid and reactant, fast kinetics, and easily tenable composition for metal oxide TCES system, it had attracted wide attention recent years.6 For TCES process, the thermal energy is stored during the endothermic reaction step and released in a subsequent exothermic reaction. Taking Mn2O3/Mn3O4 system as an example, Mn2O3 is heated above 950 °C in the charging step, triggering the endothermic reaction, and the heat is used to dissociate Mn2O3 to products Mn3O4 and O2. In the discharging step, the reduced Mn3O4 is oxidized to Mn2O3 in the exothermic reaction when the temperature is below 840 °C, releasing heat corresponding to the reaction enthalpy. The reversible reaction of the manganese oxide system used for thermochemical energy storage is as follows (eqn (1)):| Mn2O3 ↔ M3O4 + O2, ΔH = 202 kJ kg−1 | (1) |
The materials used in thermochemical energy storage mainly include redox oxides, hydroxides, hydrides, and carbonates, which can be applied under different applied temperature ranges and scenarios regarding the cost, the energy storage density, the reversible reactions occurring at the operational temperature of the CSP plant and the feasibility in chemical modification to attain the thermochemical redox properties. The system based on metal oxides presents the advantages of utilizing ambient air simultaneously as the carrier of the reaction gas O2 and heat transfer fluid (HTF) which generally operated at the temperature range of 800–1200 °C at ambient pressure. Meanwhile, the direct contact heat transfer between the gas (air) and the solid storage material (metal oxide) is very convenient, and the additional high-temperature heat exchanger is therefore not necessary. In metal oxide systems, the most attractive are those based on CoO/Co3O4, Mn2O3/Mn3O4, Fe2O3/Fe3O4, CuO/Cu2O, and perovskite oxides. Among them, the manganese oxide system is kind of relatively more researched TCES material system. Manganese oxide mainly consists of four kinds of metal oxides depending on the valence of manganese: MnO2, Mn2O3, Mn3O4, and MnO. Among them, MnO2 and Mn2O3 are irreversibly converted at ambient pressure while Mn3O4 can only be converted to MnO at about the temperature above 1700 °C. The transformation between Mn2O3 and Mn3O4 is reversible at about 500–1050 °C, which is highly in accordance with the temperature range of the high-temperature thermochemical energy storage used for the concentrated solar plants.7 Moreover, because the abundance of manganese in nature, less toxicity to human health in contrast to cobalt oxide, lower price, and its relative mature technology. The Mn2O3/Mn3O4 TCES system was regarded as the most promising TCES material system at present. Even though Mn2O3/Mn3O4 system exhibited a lower energy storage density (∼202 kJ kg−1) compared with other material systems, it still has twice or more energy storage density compared with other energy storage systems.3,8
However, pure manganese oxide presents the obvious disadvantage of the slow reoxidation kinetics of the Mn3O4. So, further modifications of manganese oxide are always needed for the usability of the Mn2O3/Mn3O4 couple. These modification methods can be mainly divided into four aspects: the regulation of the physical properties of Mn-based oxide powders, the incorporation of other transition metals, the adjustment of the reaction gas atmosphere, and shaping the oxide powders into honeycomb or pellets.3,5,7,9 Carrillo et al.10 explored the influence of the initial particle size of manganese oxide on its redox reaction. It was found that the degradation of the redox behaviour was greatly affected by particle size. The decrease in the size led to a shift of oxidation temperature to lower values and slowed down the reduction/oxidation reactions. Furthermore, particles followed different sintering mechanisms, which is depended on the particle size. During the sintering process, the particles with small size tended to densify while large particles were mainly affected by coarsening. Finally, smaller particles suffered more from a higher degree of densification, which hindered the transfer of oxygen and caused a total loss of cyclability. However, there is still no effective method to solve the problem of the reoxidation process from point of view of manganese oxide itself. Müller et al.11 found that Mn3O4 can be completely oxidized to Mn2O3 in a pure oxygen atmosphere. However, the conversion rate can only reach 72.8% in the air atmosphere. Shaped pelleting refers to pressing the powders into bodies with a specific structure, such as globule and extruded honeycomb, or depositing the powders on the surface of cordierite directly.7 Compared with oxide powders, the Mn-based material with specific shape and structure can effectively reduce the flow pressure drop. Besides, the reaction process further is enhanced due to the improved thermal conductivity of the structured body.9 However, there was still no obvious improvement in the reoxidation process by using both of the above methods.
The chemical modifications based on the incorporation of second cations into manganese oxide have aroused great interest in the field of the improvement of materials during the reoxidation process for thermochemical energy storage (TCES). In this way, higher reoxidation rates, better long-term cycling stability, and narrowed thermal hysteresis of the redox Mn2O3/Mn3O4 couple can be obtained.5 For example, Fe-doped manganese oxide had been widely reported to present increased performance of reoxidation in comparison to the corresponding transition from pure Mn3O4 to Mn2O3. The improved kinetic characteristics are attributed to an enlargement of Mn–O lengths of Mn2+ cations induced by the formation of Mn–Fe spinel, which thus enhances the transport of oxygen species through the lattice during oxidation.12,13 However, the Mn–Fe system still has the problem of degradation of performance after several cycles. Therefore, the introduction of TiO2, ZrO2, CeO2, and copper nitrate into the Mn–Fe system are applied to obtain a lower sintering degree, narrower thermal hysteresis, and maintain the better TCES capacity after multiple cycling tests.14–16 In addition to Fe doping, some other Mn-based thermochemical energy storage materials also have been studied. For example, Bielsaa et al.17 and Yilmaz et al.18 found that doping SiO2 to manganese oxide also can form a kind of oxygen carrier to improve the performance of reoxidation. Beyond that, Bielsaa et al.17 found that because of a higher chemical valence of Si4+ and smaller size of SiO2 doping Mn2O3 system, the sintering of materials system could be inhibited from the point of view of solid-phase sintering and liquid-phase sintering. Solid-phase sintering can be divided into densification and grain growth, both of which depend on the mass transport rate on the grain boundary. Doping SiO2 can reduce the mass transport rate on the grain boundary to retard the solid-phase sintering; liquid phase sintering is caused by the incomplete transformation of Mn2O3 to Mn3O4. When the temperature exceeds the melting point of Mn2O3 (around 1080 °C), some Mn2O3 turned into the liquid phase. The addition of SiO2 will promote the transport of oxygen species in the system and improve conversion efficiency, thus inhibiting the occurrence of liquid phase sintering. Unfortunately, although this method can inhibit sintering, it cannot be completely avoided. In addition to examining the effects of different types of dopants, Carrillo et al.19 further investigated the effect of the doping ratio of Cr on the manganese oxide TCES system. The optimal doping amount of 5% was found while the addition of more than 10% was reported to have a negative effect in the temperature range of 600–1000 °C because of the formation of Mn–Cr spinel. Carrillo et al. also found that 20.8% of doping content of Fe2O3 into Mn2O3 is the optimum doping ratio, and the temperature difference between reduction and oxidation could decline to 113 °C.20 Therefore, the doping ratio of the dopant also should be considered. In addition to the doping systems mentioned above, the doping of TiO2 whose chemical valence of Ti4+ was higher than Mn3+ used for the chemical looping processes was studied by Abad et al.21 The author tested the oxygen transport capacity of the Mn–Ti system at 850 °C and 940 °C. As the MnTiO3 (pyrophanite) is going to be generated at a high temperature which has excellent oxygen transport capacity.22 Therefore, doping TiO2 could improve the oxygen transport performance of the system, and they thought the best performance of oxygen transfer can be reached at the weight ratio between 0.15 and 0.2. Combining it with the previous researches about Mn2O3/Mn3O4 TCES system, doping TiO2 to manganese oxide TCES system may also have an effect on improving the performance of reoxidation and avoid the problems of sintering like that in the Mn–Si system after multiple cycles under TCES process. Therefore, we further explored the reactivity and cyclic performance of the Mn–Ti system in this paper. Considering the results of previous research, the effect of different doping ratios of TiO2 also was investigated. Specially, we further explored the influence of nanoscale of the dopants and the morphology of Mn2O3 on the TCES process which was not mentioned in the previous research.
Expect for simple comparisons of performance, we also performed kinetic calculations to further reveal the difference in reactivity among different samples. Generally, the reaction process of TCES is a gas–solid non-catalytic reaction. In the field of the TCES system, the activation energy of the reaction could exhibit the energy barrier of the reaction, higher activation energy means that the reaction could happen at a higher temperature. The addition of the dopant could change the activation. For example, Carrillo et al. found that the activation energy during reduction would increase after adding Cr in the material, and Na Shao found that the activation energy during oxidation reaction will decrease dramatically with the deepening of the reaction degree.21,23 Therefore, we also did similar research about the activation energy during the oxidation reaction of the Mn–Ti TCES system.
The studies regarding the mechanisms of the gas–solid non-catalytic reactions of metal oxides redox systems are still not clear. Therefore, the empirical models are generally applied to describe the reaction process. The widely used model of the non-catalytic reaction rate can be written by eqn (2).24
| r = kf(α) | (2) |
In the TCES process, k(T) is represented by a rate constant, which is empirically described based on the Arrhenius formula in general. f(α) is related to the extent of the conversion and the applied partial pressure of the reaction gas (pO2). It has been widely reported that thermogravimetric measurements analysis can provide the basis for the kinetic analysis of the redox reaction.25–27 In this way, the multiple rate scanning method is generally applied to obtain the reaction activation energy directly while the solution of the reaction mechanism function is not necessary. Thus, the error effect from the assumed mechanism function is avoided.26,27
By now, the redox Mn2O3/Mn3O4 couple has been widely studied in the thermochemical energy storage system. A variety of approaches have also been investigated to improve the kinetic characteristics and cycle performance. However, there was still no solution to balance the oxidation performance with the cyclic performance. Abad et al. have done a comprehensive job of adding TiO2 to Mn2O3 to improve its oxygen transport performance during chemical looping processes.21 Based on their results, we further investigated the reoxidation performance and cyclic performance of the Mn–Ti system during the TCES process in this paper. Additonally, we further researched the influence of different morphology of dopant and manganese oxide on TCES process, and the relevant kinetic analysis was also made. This work can provide helpful information for further investigating the material behaviour of the Mn2O3/Mn3O4 couple.
2. Experiment
2.1. Materials preparation
Mn2O3 powder was taken as our raw material which was synthesized by the modified Pechini method (PCMn).28 The raw materials of PCMn were Mn(NO3)2·4H2O (Damas-beta, 99%), citric acid (General-reagent, 99.5%), and ethylene glycol (Damas-beta, 99%). The molar ratio of Mn(NO3)2·4H2O![[thin space (1/6-em)]](https://www.rsc.org/images/entities/char_2009.gif) :
:![[thin space (1/6-em)]](https://www.rsc.org/images/entities/char_2009.gif) citric acid
citric acid![[thin space (1/6-em)]](https://www.rsc.org/images/entities/char_2009.gif) :
:![[thin space (1/6-em)]](https://www.rsc.org/images/entities/char_2009.gif) ethylene glycol was 3
ethylene glycol was 3![[thin space (1/6-em)]](https://www.rsc.org/images/entities/char_2009.gif) :
:![[thin space (1/6-em)]](https://www.rsc.org/images/entities/char_2009.gif) 15
15![[thin space (1/6-em)]](https://www.rsc.org/images/entities/char_2009.gif) :
:![[thin space (1/6-em)]](https://www.rsc.org/images/entities/char_2009.gif) 10. The three ingredients were dissolved in deionized water firstly, then the solution was stirred and dried in a magnetically heated blender at 80 °C to form a sol. And then the sol was put into the drying oven under 100 °C for 12 hours to get the gel. Finally, the gel was calcined at 450 °C and 700 °C for 4 hours respectively to get the powder. For comparison, the manganese oxide powder from the commercial source was also used (Damas-beta, 98%). The as-received TiO2 nanoparticles of 25 nm and 100 nm (99.8%, Sigma Aldrich) were used as doping agents. The doped samples were prepared by mixing the TiO2 nanoparticles and Mn2O3 powders mechanically with the Ti
10. The three ingredients were dissolved in deionized water firstly, then the solution was stirred and dried in a magnetically heated blender at 80 °C to form a sol. And then the sol was put into the drying oven under 100 °C for 12 hours to get the gel. Finally, the gel was calcined at 450 °C and 700 °C for 4 hours respectively to get the powder. For comparison, the manganese oxide powder from the commercial source was also used (Damas-beta, 98%). The as-received TiO2 nanoparticles of 25 nm and 100 nm (99.8%, Sigma Aldrich) were used as doping agents. The doped samples were prepared by mixing the TiO2 nanoparticles and Mn2O3 powders mechanically with the Ti![[thin space (1/6-em)]](https://www.rsc.org/images/entities/char_2009.gif) :
:![[thin space (1/6-em)]](https://www.rsc.org/images/entities/char_2009.gif) (Ti + Mn) molar ratios of 0.05, 0.1, 0.15, 0.2, and 0.25, respectively. To obtain a homogeneous mixture, the mixing process lasted 30 min. The composition and Ti/(Ti + Mn) molar ratios of the doped samples are listed in Table 1.
(Ti + Mn) molar ratios of 0.05, 0.1, 0.15, 0.2, and 0.25, respectively. To obtain a homogeneous mixture, the mixing process lasted 30 min. The composition and Ti/(Ti + Mn) molar ratios of the doped samples are listed in Table 1.
| Sample | Materials | Ti/(Ti + Mn) molar ratio |
|---|---|---|
| PCMn0 | PCMn | 0 |
| 25PCMn0.1 | PCMn + 25Ti | 0.1 |
| 25PCMn0.05 | PCMn + 25Ti | 0.05 |
| 25PCMn0.15 | PCMn + 25Ti | 0.15 |
| 25PCMn0.2 | PCMn + 25Ti | 0.2 |
| 25PCMn0.25 | PCMn + 25Ti | 0.25 |
| Mn0 | Mn | 0 |
| 100PCMn0.05 | PCMn + 100Ti | 0.05 |
| 100PCMn0.1 | PCMn + 100Ti | 0.1 |
| 100PCMn0.15 | PCMn + 100Ti | 0.15 |
| 100PCMn0.2 | PCMn + 100Ti | 0.2 |
| 100PCMn0.2 | PCMn + 100Ti | 0.2 |
| 100PCMn0.25 | PCMn + 100Ti | 0.25 |
| 25Mn0.05 | Mn + 25Ti | 0.05 |
2.2 Materials performance and oxidation kinetics studies
The performance tests of samples were performed in a thermogravimetric analyzer (Shanghai Innuo, Q-TGA-1250C) with a Sartorius thermobalance in the air atmosphere of 100 ml min−1. The redox reversible reaction of the manganese oxide involved two steps: reduction and reoxidation. In the endothermic reduction step, the Mn2O3 sample was reduced to Mn3O4 and the temperature was increased from 600 °C to 1000 °C at a heating rate of 10 °C min−1. Then in the following exothermic reoxidation step, the reduced sample was oxidized when the temperature was decreased to 600 °C at a cooling rate of 10 °C min−1. The temperature was maintained at 600 °C for 30 min to complete the oxidation step.The reoxidation kinetics was studied by thermogravimetric analysis using multiple scanning methods.19,23 In this paper, the characteristics of reaction kinetics of the material system were considered only in the air atmosphere. The multiple heating and cooling rate scanning method was used for thermal analysis kinetics. Arrhenius type law was used to describe the non-isothermal chemical process in this paper,29,30 shown as:
 | (3) |
 | (4) |
For the Ozawa method,
 | (5) |
For the Friedman method,
 | (6) |
During cyclic performance tests which are without the thermostatic phase, the upper and lower temperatures were 600 °C and 1000 °C respectively. The rate of temperature rising and cooling was 10 °C min−1. A total of 30 cycles was performed. The weight gain ratio of the last cycle was used as the comprehensive performance evaluation standard.
To avoid the effects of zero drift of dynamic balance (0.1 mg each 2 hours) and thermogravimetric noise, especially for the samples which has a low weight change ratio, around 200 mg of materials was placed in the crucible and the height of the material was controlled within 5 mm during the performance tests.
2.3 Materials characterization
The structural analysis of the powders was characterized by X-ray powder diffraction (XRD) using a Siemens™ D5000 X-ray diffractometer using Cu-Kα radiation (λ = 1.5406 Å) at the scanning rate of 0.2° s−1 and the 2-theta range was 10–80°. Transmission Electron Microscope (TEM) images were taken using a JEOL JEM-2100F microscope operated at 200 kV. Before the measurement, samples were previously dispersed in ethanol and sonicated for 5 min. Then the solution was transferred onto a holy carbon film fixed on a 3 mm copper grid.3. Results and discussion
3.1 Reactive performance of the TiO2 doped samples
The morphologies of PCMn and commercial Mn2O3 powder obtained by the Transmission Electron Microscopy are shown in Fig. 1. It can be seen that the manganese oxide obtained by the modified Pechini method has the microporous structure. Therefore, the doping agent may cannot equally distribute in the porous structure, especially for the larger dopant powder. This may cause that the optimal doping amount deviates from the theoretical value. Therefore, two kinds of dopants (25 nm, 100 nm) were investigated in this paper. The name and composition of the selected experimental samples as Table 1 shows. The XRD patterns of 25PCMn0.1, 100PCMn0.1, 25Mn0.05 before and after the reactivity test are shown in Fig. 2. It can be confirmed that manganese oxide powder was synthesized by the Pechini method used in this paper. The obvious diffraction peaks of TiO2 were detected in three samples before the test, which means that no other phases were formd between Mn2O3 and TiO2. After the test, diffraction peaks of Mn2O3, Mn3O4, and TiO2 were detected in the materials. The formation of Mn3O4 in the tested material was due to the incomplete reaction of Mn3O4 during the oxidation stage. It was important to emphasize that TiO2 was still detected in the tested materials, and there was no obvious diffraction perk of MnTiO3 or some similar phases (e.g., Mn2TiO4). However, it can be found that the oxidation process was significantly enhanced as the TG results shown in Fig. 3. Therefore, the reason for enhancing the reoxidation process by adding TiO2 into Mn2O3 may be different from the chemical looping process which explored by the previous research,20 and we will further explore this by TEM in Section 3.3.33 In this paper, Mn3O4 absorbed heat by being oxidized and thus plays the effect of releasing energy. Its percentage of weight gain was closely related to the heat release. Therefore, the change of the weight gain ratio in the reoxidation process indicates the change of the density of energy storage as the previous research did.17,18 The energy storage density which was represented as the heat absorb of materials was calculated from the theoretical enthalpy according to the proportion of weight gain in this paper.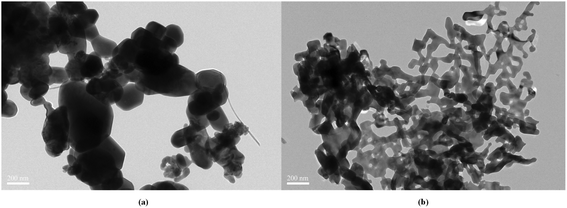 | ||
| Fig. 1 Morphologies of Mn2O3 powders. (a) TEM images of commercial Mn2O3 powder. (b) TEM images of Mn2O3 powder synthesized by modified Pechini method. | ||
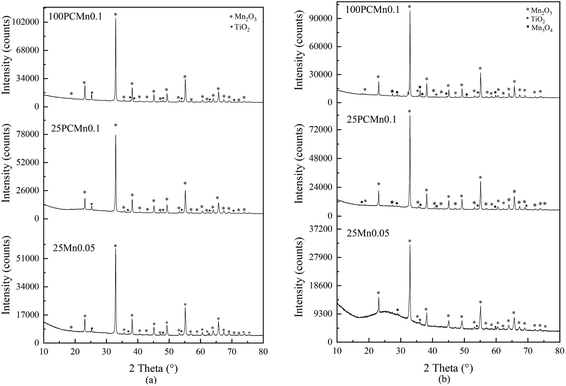 | ||
| Fig. 2 XRD patterns of 100PCMn0.1, 25PCMn0.1, and 25Mn0.05. (a) The samples before the test of reactive performance. (b) The samples after the test of reactive performance. | ||
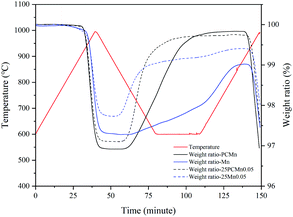
Fig. 3 exhibits the TGA curves of materials under TCES process among PCMn0, Mn0, 25PCMn0.05, and 25Mn0.05. Table 2 exhibits the percentage of weight gain, the corresponding theoretical energy storage density of the samples during reoxidation, and onset temperatures during reduction and reoxidation processes. It could be seen that the PCMn exhibits a good reaction rate and higher percentage of weight gain than commercial Mn2O3 whether the TiO2 was added or not during reoxidation process. However, the commercial Mn2O3 system exhibited a lower attenuation than the PCMn system after adding TiO2 during reoxidation process. Furthermore, whether adding TiO2 or not had almost no effect on the onset temperature during reduction process. But adding TiO2 will make the onset temperature of the oxidation process rise significantly, especially for the 25Mn0.05. Its temperature range of redox was narrowed from 156.1 °C to 71 °C. In addition, as the oxidation temperatures of 25Mn0.05 and Mn were higher, the reoxidation of PCMn0 and 25PCMn0.05 could be finished at 600 °C, and that of the Mn0 and 25Mn0.05 was finished after the temperature rised again. This meant that there is difference in the optimum oxidation temperatures between PCMn and Mn.
| Sample | Percentage of weight gain | Theoretical energy storage density (J g−1) | Oxidation-onset temperature (°C) | Reduction-onset temperature (°C) | Sample | Percentage of weight gain | Theoretical energy storage density (J g−1) | Oxidation-onset temperature (°C) | Reduction-onset temperature (°C) |
|---|---|---|---|---|---|---|---|---|---|
| Mn0 | 1.74 | 104.5 | 772.3 | 928.4 | PCMn0 | 2.91 | 174.7 | 809.8 | 903.8 |
| 25Mn0.05 | 1.67 | 100.3 | 855 | 926 | 25PCMn0.05 | 2.63 | 157.9 | 816 | 904.7 |
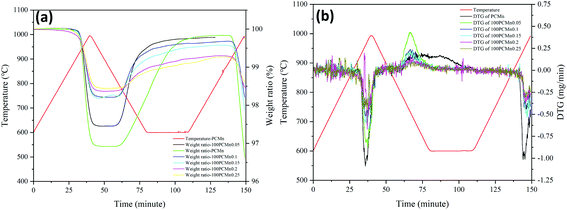
Fig. 4 shows the change rule of DTG (Fig. 4(b)) and TGA (Fig. 4(a)) data of five experiment groups of PCMn doped with TiO2 of 25 nm (25Ti) powder. For TGA curves, the maximum ratio of weight gain and weight loss which is corresponding to the heat release and heat storage respectively. DTG curves could indicate the reaction rate during the reaction process and the temperature corresponding to the maximum reaction rate. The temperature which is corresponding to the maximum reaction rate from DTG curves was recognized as the optimal temperature of the reaction. Table 3 shows the maximum percentage of weight gain, corresponding theoretical enthalpies, and the optimal temperature during reoxidation. The optimum temperature is the temperature corresponding to the maximum rate of mass change. It was found that the optimal temperature and onset temperature were increased and the peak intensity corresponding to the optimal temperature also was enhanced after adding TiO2. Furthermore, the optimal and onset temperatures showed a uptrend first and then a downtrend with the increasing the content of TiO2. The change of the temperatures can also reflect the change of reaction kinetic to some extent during reoxidation process. The specific analysis about it would be discussed in Section 3.2. According to the previous study,19 the range of the doping weight ratio which was concerning for the best performance of oxygen transport was between 0.15 and 0.2 under chemical looping process. However, when the molar ratio was arrived to 0.05, the materials system had revealed a good reaction rate and the best amount of weight gain during TCES reoxidation process in this paper. With further addition of TiO2, the energy storage density would decrease enormously and periodically when the ratio of TiO2 exceeded 0.05 and 0.15 respectively. This kind of period decrease also was reflected in Fig. 5(b). Moreover, the reaction rate decreased obviously when doping ratio exceeded 0.15. Therefore, the optimal ratio of doping Mn2O3/Mn3O4 system with 25Ti is 0.05.
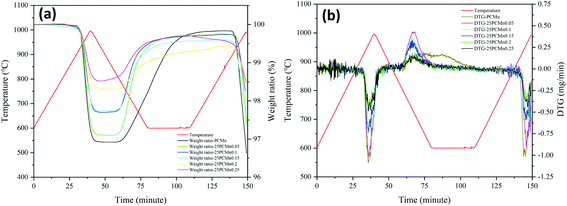 | ||
| Fig. 4 Thermogravimetric curves of the doped 25PCMn samples in a redox cycle. (a) TGA curve; (b) DTG curve. | ||
| Sample | Percentage of weight gain (%) | Theoretical energy storage density (J g−1) | Optimum temperature (°C) | Onset temperature (°C) | Sample | Percentage of weight gain (%) | Theoretical energy storage density (J g−1) | Optimum temperature (°C) | Onset temperature (°C) |
|---|---|---|---|---|---|---|---|---|---|
| PCMn0 | 2.91 | 174.7 | 697 | 809.8 | 25PCMn0.15 | 1.84 | 110.5 | 738 | 821 |
| 25PCMn0.05 | 2.63 | 157.9 | 735 | 816 | 25PCMn0.2 | 1.15 | 69.0 | 721 | 800.7 |
| 25PCMn0.1 | 2.03 | 121.9 | 743 | 827.4 | 25PCMn0.25 | 1.07 | 64.2 | 720 | 804.5 |
 | ||
| Fig. 5 Thermogravimetric curves of the doped 100PCMn samples in a redox cycle. (a) TGA curve; (b) DTG curve. | ||
Fig. 5 exhibits the TGA (Fig. 5(a)) and DTG (Fig. 5(b)) data of PCMn doped with TiO2 of 100 nm (100Ti) powder. Table 4 indicates the relevant data during reoxidation process. It could be seen that the samples doped with 25Ti has a higher energy storage density corresponding to the same molar ratio of TiO2 compared with the sample doped with 100Ti from Fig. 4 and 5, especially for the molar ratio of 0.1 and 0.15. The maldistribution of 100Ti in the system may cause a decline of performance in some particular regions of the reaction. Moreover, both two groups revealed a good reaction rate after adding TiO2 during reoxidation process as DTG cures shows. When the mole ratio of the doping agent was 0.05, the optimal energy storage density also is reached. As DTG curves shows, only 100PCMn0.05 exhibited an appreciable peak during reoxidation process, and the intensity of peaks of 100PCMn0.1 and 100PCMn0.15 was not high which were adjacent with 100PCMn0.2 and 100PCMn0.25. As Table 4 shows, the optimum temperature also was increased after adding TiO2, and the optimum temperature was decreasing with the further addition of 100Ti. Beyond that, the energy storage density also shows a periodic decline trend with the increase of doping ratio which is same as the samples doped with 25Ti. Moreover, this also meant that this particular trend is not caused by the size of the doping agent.
| Sample | Percentage of weight gain (%) | Theoretical energy storage density (J g−1) | Optimum temperature (°C) | Onset temperature (°C) | Sample | Percentage of weight gain (%) | Theoretical energy storage density (J g−1) | Optimum temperature (°C) | Onset temperature (°C) |
|---|---|---|---|---|---|---|---|---|---|
| PCMn0 | 2.91 | 174.7 | 697 | 809.8 | 100PCMn0.15 | 1.38 | 82.8 | 720 | 798 |
| 100PCMn0.05 | 2.33 | 139.9 | 737 | 827 | 100PCMn0.2 | 0.93 | 55.8 | 710 | 790.1 |
| 100PCMn0.1 | 1.47 | 88.3 | 736 | 810 | 100PCMn0.25 | 0.83 | 49.8 | 709 | 785.7 |
Above all, PCMn exhibited better performance than Mn whether adding TiO2 or not during reoxidation process. Comparing the TGA and DTG data between sample groups doped with 25Ti and 100Ti respectively, the size dimension of TiO2 and the amount of doping agent affected the performance of TCES obviously during reoxidation process. It was clear that the molar ratio of 0.05 (weight ratio of 0.025) exhibits the best density of energy storage and good reaction rate for both of two doping agents during reoxidation process. Moreover, adding 25Ti can bring higher density of energy storage than adding 100Ti, and there was little difference of reaction rate between adding 25Ti and 100Ti from the DTG curves. Beyond that, the energy storage density of Mn–Ti system exhibit a periodic downward trend with the increase of doping ratio, and this is not caused by the size of the doping agents. From the TGA tests, different samples exhibit different reaction kinetics during reoxidation process. Moreover, because there was no obvious diffraction peak of new phase which was deemed to the reason for a higher oxygen transport capacity of the Mn–Ti system, we will further explore whether there is new phase formation in the material system in Section 3.3.
3.2 Kinetic analysis
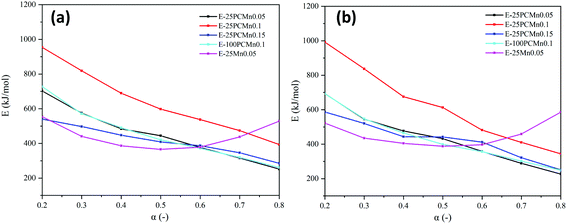
In Section 3.1, it can be seen that different experimental groups have different thermodynamic behaviors. Therefore, to further explore the difference among each sample on thermodynamic behaviors, the kinetics calculation was conducted to show the change in activation energy (Ea) after adding the TiO2 powder under different conversion rates in this section, which can help us to find a more suitable redox temperature range. Because the sample groups of the 25PCMn had better energy storage density and 25Mn0.05 exhibited a narrow temperature range of redox. So, in this section, 25PCMn0.05, 25PCMn0.1, 25PCMn0.15 were chosen to explore the influence of the molar ratio of TiO2 on activation energy. 100PCMn0.1 was selected to analyze the effects of different morphology scales of the dopant on activation energy. Furthermore, 25Mn0.05 was explored to comparing the difference between commercial Mn2O3 and Mn2O3 synthesized by the Pechini method on activation energy (Ea). As the reduction process of Mn2O3/Mn3O4 was mainly controlled by heat transfer,10 and the addition of TiO2 did not affect the onset temperature of reduction process in Section 3.1.21 Therefore, we only analyzed the change of activation energy during oxidation reaction with adding TiO2 in this paper.The multiple rate sweep method was used to calculate activation energy during reoxidation process. Ozawa method, as an integration method, has the advantages of avoiding the error caused by reaction mechanism function (G(α)) to solve the E compared with other methods. In the Ozawa method, the Ea could be solved by the linear relationship between lg![[thin space (1/6-em)]](https://www.rsc.org/images/entities/char_2009.gif) βi and 1/Tpi. The activation energies of oxidation reactions for different samples were solved by the Ozawa method as Table 5 shows. According to the previous study, Friedman method which is a differential method can give more accurate values of activation energy than Ozawa method.32 Therefore, Friedman method was used to verify the accuracy of the calculation. The Ea was solved by the liner relationship between ln(βdα/dT) and 1/T. To avoid the measurement error at the beginning and the end of the reaction, the conversion rate (α) range was between 0.2 and 0.8, the step size is 0.1.
βi and 1/Tpi. The activation energies of oxidation reactions for different samples were solved by the Ozawa method as Table 5 shows. According to the previous study, Friedman method which is a differential method can give more accurate values of activation energy than Ozawa method.32 Therefore, Friedman method was used to verify the accuracy of the calculation. The Ea was solved by the liner relationship between ln(βdα/dT) and 1/T. To avoid the measurement error at the beginning and the end of the reaction, the conversion rate (α) range was between 0.2 and 0.8, the step size is 0.1.
| Sample | Activation energy | R2 |
|---|---|---|
| 25PCMn0.05 | 450.18 | 0.9957 |
| 25PCMn0.1 | 637.76 | 0.9749 |
| 25PCMn0.15 | 416.09 | 0.9814 |
| 100PCMn0.1 | 451.94 | 0.9521 |
| 25Mn0.05 | 441.78 | 0.9829 |
As Tables 5 and 6 show, the activation energy solved by Ozawa and Friedman methods demonstrated an acceptable R2, and the difference between Ea solved by Ozawa and Friedman methods is very small which proving the accuracy of the calculation. Tables 5 and 6 indicate that activation energy was increased with the rising of the molar ratio of TiO2 from 0.05 to 0.1 during the whole reaction process. However, the activation energy was decreased when the molar ratio of TiO2 arrived at 0.15. Beyond that, activation energy of 100PCMn0.1 was lower than 25PCMn0.1 which means that the reoxidation reaction of the 25PCMn0.1 can be excited at a higher temperature. Beyond that, the apparent activation energy of 25Mn0.05 was similar to 25PCMn0.05.
| Sample | Activation energy | R2 |
|---|---|---|
| 25PCMn0.05 | 431.57 | 0.9916 |
| 25PCMn0.1 | 621.97 | 0.9586 |
| 25PCMn0.15 | 425.41 | 0.9555 |
| 100PCMn0.1 | 430.13 | 0.9632 |
| 25Mn0.05 | 456.11 | 0.9894 |
Fig. 6 exhibits the activation energy changed as the reaction goes deepen. It indicates that the activation energy continues to decline as oxidation reaction goes deepen for 25PCMn0.05, 25PCMn0.1, 25PCMn0.15, and 100PCMn0.1 whose trend is similar to the result from the previous research,22 and the activation energy at the end of the reaction was less than half what it was at the beginning. For the samples basing on the PCMn, activation energy of 25PCMn0.1 was larger than other samples on the whole reaction process, especially at the beginning. This meant that the oxidation reaction of 25PCMn0.1 can be excited at a higher temperature, but the activation energy of it at the conversion rate of 0.8 was still very low. Furthermore, it was found the change of activation energy over conversion rate of 25Mn0.05 is different from that of other samples. It shows that its activation energy decreases first and then increases, and the activation energy of 25Mn0.05 at the conversion of 0.8 is significantly higher than other samples, which means the oxidation reaction of 25Mn0.05 needs to be finished at a higher temperature than other samples. This also could be recognized from the TGA curves in Fig. 3. The similar phenomenon also could be found in the cyclic tests which will be discussed in Section 3.3.
 | ||
| Fig. 6 The change of activation energy (Ea) at different conversion rates (α). (a) Ozawa method. (b) Friedman method. | ||
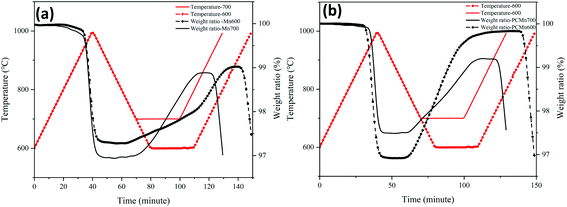
Fig. 7 indicates the TGA curves of PCMn and Mn at two different oxidation temperatures (600 °C, 700 °C). It could be seen that the weight gain ratio and reaction rate of PCMn at the oxidation temperature of 600 °C are higher than that at the oxidation temperature of 700 °C. On the other hand, Mn showed a completely opposite rule to PCMn at the oxidation temperature of 600 °C and 700 °C respectively. Therefore, to get the best reoxidation performance, the oxidation temperature of PCMn was higher than that of Mn.
 | ||
| Fig. 7 The TGA curves of Mn and PCMn under different isothermal conditions (600, 700). (a) Mn. (b) PCMn. | ||
To sum up, the doping amount of TiO2 will significantly affect the reaction kinetics of the materials system, and the two main materials have completely different reaction kinetics trends with the deepening of the reaction. Although 25PCMn0.05 exhibits the best TCES performance in Section 3.1, the reoxidation reaction of 25PCMn0.1 can be excited at a higher temperature than that of 25PCMn0.05. Moreover, the samples based on the Mn was more suitable to be used under higher temperature.
3.3 Cyclic performance test
According to the current research and reports on large-scale thermochemical energy storage reactor, the form of TCES reactors was mainly packed bed.34,35 Hence, due to the high-temperature condition of the TCES process and accumulation of materials in the packed bed, sintering was very serious which would degrade the TCES performance. Inhibition of sintering by doping the additive is a common method. Bagherisereshki added an inert diluent into the SrO/SrCO3 TCES system and Bielsaa used SiO2 as the dopant in the Mn2O3/Mn3O4 TCES system to inhibit the sintering of the particle to ensure the energy storage performance of the material in a long-time operation.17,36 Therefore, in this section, we mainly analyzed the effect of adding titanium dioxide on the anti-sintering property from the TGA data of different samples under a test of 10 cycles and the TEM images. In our research, tests were conducted by the TGA analyzer and the highest temperature operating condition is 1000 °C. Therefore, we thought solid-phase sintering dominated the sintering process. According to the previous research, solid-phase sintering of Mn2O3 is mainly manifested as coarsening and densification. Moreover, the ability to resist sintering is also increasing in the process of sintering. This is because the sintering atmosphere in the closed void is gradually compressed, and this pressure finally makes the pore stable, thus preventing further densification.10,37According to analysis in Section 3.1. Doping 25Ti shows a higher energy storage density than doping 100Ti, and the optimal doping ratio is 0.05. Furthermore, 25Mn0.05 exhibited a different characteristic of reaction kinetic compared with 25PCMn0.05. Therefore, we selected 25PCMn0.05, 25PCMn0.1, 25PCMn0.15, 100PCMn0.1, and 25Mn0.05 to compare their difference in cyclic performance. In this section, 10 cycles were conducted totally for all samples, the temperature range was between 600 °C and 1000 °C with a cooling and heating rate of 10 °C min−1.
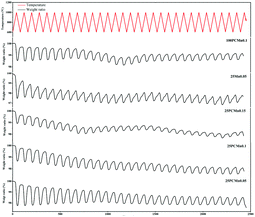
Fig. 8 indicates the TGA data of five samples obtained from the test of 30 cycles. Table 7 reveals the percentage of weight gain of the material in the last cycle and the degree of attenuation of the percentage of weight gain during the cyclic test. It could be seen that the performance of materials was gradually degraded and became more and more stable as the cyclic tests continue, the reason for this is that the ability to resist coarsening of materials is increasing in the process of sintering. In the sample based on PCMn, it indicated that 25PCMn0.05 exhibits the best performance. Moreover, the attenuation of the performance of the materials exhibited little difference with the increase of the molar ratio of 25Ti, which meaning that the addition of TiO2 has little effect on the performance of resist sintering. Comparing 25PCMn0.1 and 100PCMn0.1, doping 25Ti in the material demonstrate similar performance at the end of the cyclic test, and the attenuation between the 100PCMn0.1 and 25PCMn0.1 is similar. As for 25Mn0.05, as the activation energy of it increased at the later stage of the reaction, an obvious step was shown in the reoxidation process of the TGA curve in Fig. 8. This phenomenon further verified the conclusion made in Section 3.2. Moreover, 25Mn0.05 exhibits a lower attenuation and higher weight gain ratio than that of 25PCMn0.05. So, although the 25PCMn0.05 had higher energy storage density in Section 3.1, the 25Mn0.05 has better stability and it can maintain a higher energy storage density after a long-time operation.
| Sample | Ratio of weight gain (%) | Attenuation (%) | Sample | Ratio of weight gain (%) | Attenuation (%) |
|---|---|---|---|---|---|
| 25PCMn0.05 | 0.70 | 62.8 | 100PCMn0.1 | 0.54 | 53.7 |
| 25PCMn0.1 | 0.51 | 53.8 | 25PCMn0.15 | 0.32 | 56.0 |
| 25Mn0.05 | 0.82 | 53.3 |
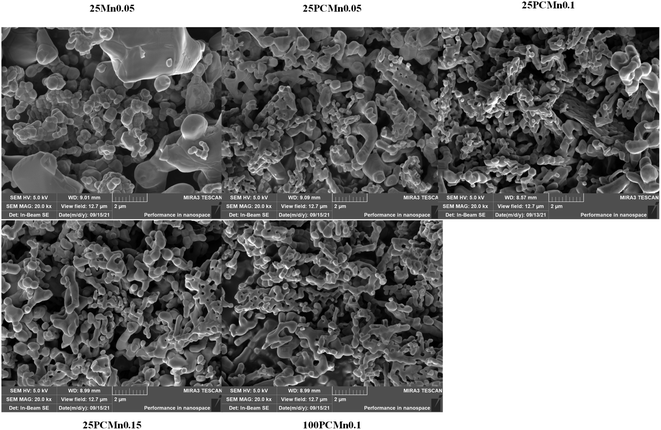
Fig. 9 shows the SEM images of each samples after 30 cycles. It can be seen that each sample displayed a similar phenomenon of sintering. The samples based on PCMn exhibits a macroporous structure, the 25Mn0.05 exhibits an obvious agglomeration. However, although the 25Mn0.05 has worse performance in single complete redox process and serious agglomeration after 30 cycles, it exhibits a better performance under long-time operation.
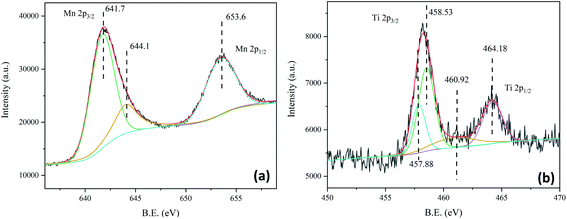
Because the XRD test did not identify the new phase formation in the material system in Section 3.1. Therefore, the phase composition of the used 25PCMn0.05 was discussed by XPS and TEM in this section. Fig. 10 indicates the XPS spectrum of used 25PCMn0.05. As Fig. 10(a) shows, the Mn 2p2/3 XPS peaks can be divided into two peaks, the peak at 641.7 eV represented Mn3+, and the peak at 644.1 eV corresponded to the satellite peak of manganese. The Mn 2p1/2 XPS peak only consists of one peak at 653.6 eV which indicates the exist of Mn2+.38,39 Fig. 10(b) display the XPS spectrum of Ti, a total of 4 peaks were detected. The peak at 464.13 eV represented the Ti4+, and the peaks at 458.53, 460.92, and 457.88 represented Ti3+.40 Therefore, because the new Ti3+ was detected in the materials which existing in TiO2 as Ti4+ originally, there should has a new phase formed.
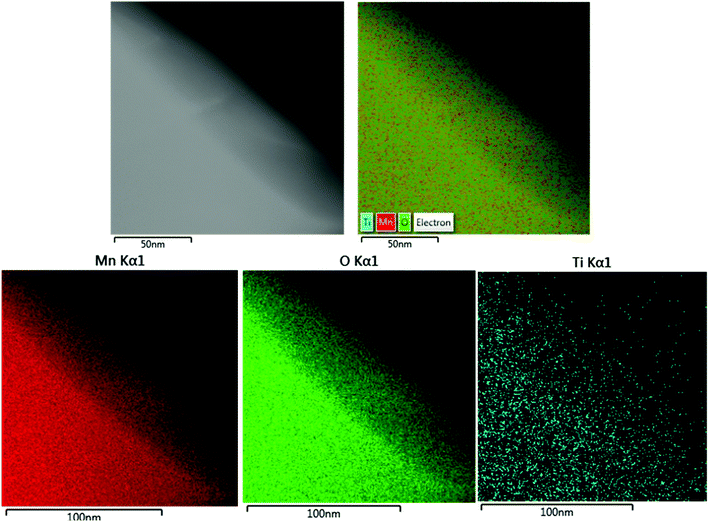
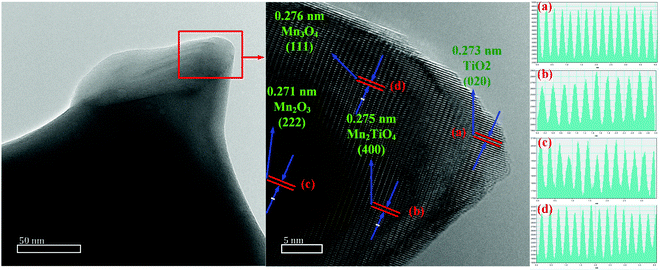
The lattice fringes of particles were further identified by TEM images for 25PCMn0.05 after the cyclic test so as to explore the phase composition in the system. The HRTEM images for 25PCMn0.05 after 10 and 30 cycles were used to investigate the formation process of the new phase. Fig. 11 shows the HRTEM images of 25PCMn0.05 after 10 cycles. Fig. 11(c)–(e) present the 5 nm scale picture of the material, the black area in the figures is Mn2O3. TiO2 (002) was detected according to the lattice fringes in Fig. 11(d), the corresponding number of the PDF and diffraction width are 76-1935 and 2.584 nm respectively. Besides that, the Mn2TiO4 spinel on the boundary between TiO2 and Mn2O3 which is wrapped by Mn2O3 and TiO2 was detected in Fig. 11(e) and (c), thus it is hard to be detected by XRD test. The variable temperature condition of the TCES process which leads to the incomplete formation of the Mn–Ti–O phase may be the reason for this phenomenon. The detected crystal faces were 104 and 211 of Mn2TiO4, the corresponding diffraction widths are 2.167 nm and 2.638 nm respectively. The reference PDF number was 73-0521. Fig. 12 indicates the HRTEM images of 25PCMn0.05 after 30 cycles. There were obvious crystal faces of TiO2, Mn2O3, Mn2TiO4, and Mn3O4. It shows that the TiO2 only was observed at the edges of the particles, and it can be known from the distribution of the lattice fringes that more Mn2TiO4 was formed. Fig. 13 shows the elements distribution of Mn, Ti, and O in 25PCMn0.05 after 30 cycles where new phases are formed. It can be seen that the Mn, Ti element were staggered. Because the TiO2 is introduced into the material system by means of mechanical mixing, this can demonstrate that the Mn and Ti were fully merged to form the new Mn–Ti–O phase. To sum up, the Mn–Ti–O phase will only exist at the boundary between Mn2O3 and TiO2 at first, and more Mn2TiO4 phase will be formed with the extension of operating time. Beyond that, the formation of Mn2TiO4 phase in Mn–Ti TCES system can be attributed to the reason of why the reoxidation process was enhanced.
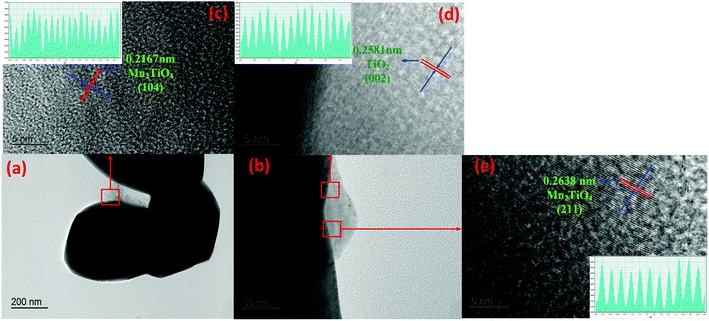 | ||
| Fig. 11 TEM images of the 25PCMn0.05 after test of 10 cycles. (a and b) The boundary between Mn2O3 and TiO2. (c–e) High resolution TEM images for the specified locations. | ||
 | ||
| Fig. 12 TEM images of the 25PCMn0.05 after test of 30 cycles. (a and b) The boundary between Mn2O3 and TiO2. (c and d) High resolution TEM images for the specified locations. | ||
4. Conclusions
The modified Pechini method was used to get the porous Mn2O3 as our one kind of raw material. In this paper, the difference in TCES performance between commercial Mn2O3 and PCMn was compared. Then, the different effects on TCES performance on doping 25Ti and 100Ti into the both materials systems were investigated.Doping TiO2 into the Mn2O3/Mn3O4 system can improve the performance of reoxidation process and increase the onset temperature of oxidation obviously. Due to the different structure of materials, PCMn showed higher density of energy storage than Mn weather doped with TiO2 or not, but Mn exhibited a narrow temperature range of redox after adding TiO2 in the case of only one complete redox process. Moreover, doping 25Ti into the manganese oxide system can bring higher density of energy storage than 100Ti during first complete reoxidation process. The better dispersion of smaller size of TiO2 in the porous Mn2O3 system might be the reason for this phenomenon. The optimal doping ratio is 0.05 for both doping agents. With the increase of doping amount, the energy storage density decreased in stages, and this is not affected by the size of doping agents. PCMn and commercial Mn2O3 exhibit different characteristics of reaction kinetic. Compared with 25PCMn0.05, the Ea of 25Mn0.05 decreased firstly and then increased in the later stage of the reaction. By synthesizing the TGA curves of PCMn and Mn under different oxidation temperatures, 25Mn0.05 is more suitable for operating conditions of a higher reoxidation temperature. The data of the test of the cyclic performance also verified this. According to the analysis of kinetics for the 25PCMn samples group, the addition of TiO2 could improve the activation energy when the molar ratio of TiO2 improved from 0.05 to 0.1, but it declined when the molar ratio of TiO2 arrived at 0.15. Moreover, the reoxidation reaction of 25PCMn0.1 can be excited at higher temperature. Nevertheless, the activation energy was decreased dramatically as the reaction went deepen for all samples basing on the PCMn. For cyclic test, 30 cycles were conducted in this paper. It does not improve the phenomenon that the properties of the material decline with the extension of use time after adding TiO2 into the materials. After cyclic test, all samples had similar sintering phenomenon, and the structure of PCMn changed from microporous structure to macroporous structure. As for samples based on commercial Mn2O3, the obvious densification was observed after 30 cycles. Although the agglomeration of 25Mn0.05 was serious, but it still shows a better performance after 30 cycles. The phase of Mn2TiO4 spinel was identified at the boundary between Mn2O3 and TiO2 in 25PCMn0.05 after 10 cycles, the variable temperature condition of TCES process may lead to the incomplete information of Mn–Ti–O phase. With the increase of the number of cycles, more Mn2TiO4 phase was formed. The formation of Mn2TiO4 spinel can be attributed to the reason for the improvement of Mn–Ti TCES performance.
To sum up, 25PCMn0.05 exhibited the best TCES performance under single redox process; the reoxidation reaction of 25PCMn0.1 can be excited at higher temperature; 25Mn0.05 is more suitable for higher oxidation temperature and had better performance after a long-term operation; Mn2TiO4 phase will be formed at the boundary between Mn2O3 and TiO2, and more Mn2TiO4 will be formed with the extension of operating time. Therefore, the operating temperature, morphology of the Mn2O3 and the doping agents, the doping ratio, and the change of phase with the extension of use time should be considered totally when doping TiO2 into the Mn2O3/Mn3O4 TCES system to improve its performance. Moreover, these experiences obtained for Mn–Ti systems are worthy of attention in other similar systems, such as Mn–Fe, Mn–Si, Mn–Cr, etc.
Author contributions
Boyan Wang: conceptualization, data curation, formal analysis, methodology, writing – original draft, writing – review & editing; Zhiyuan Wang: funding acquisition, conceptualization, resources, supervision, writing – review & editing, project administration; Binlin Dou: funding acquisition, conceptualization, resources, conceptualization; Yan Ma: investigation, supervision; Yijing Liang: investigation, visualization.Conflicts of interest
There are no conflicts to declare.Acknowledgements
This work was supported by National Natural Science Foundation of China (grant no. 21706159).References
- I. Hanif, S. M. F. Raza, P. Gago-de-Santos and Q. Abbas, Fossil fuels. Foreign direct investment, and economic growth have triggered CO2 emissions in emerging Asian economies: Some empirical evidence, Energy, 2019, 171, 493–501 CrossRef.
- Q. H. Ling and S. M. Wei, Discussion on Concentrated Solar Power Generation (CSP) Technology, Sci. Technol. Innovation, 2020, 23, 73–75 Search PubMed.
- A. Palacios, C. Barreneche, M. E. Navarro and Y. Ding, Thermal energy storage technologies for concentrated solar power - A review from a materials perspective, Renewable Energy, 2020, 156, 1244–1265 CrossRef CAS.
- A. J. Carrillo, J. Gonzalez-Aguilar, M. Romero and J. M. Coronado, Solar Energy on Demand: A Review on High Temperature Thermochemical Heat Storage Systems and Materials, Chem. Rev., 2019, 119, 4777–4816 CrossRef CAS PubMed.
- Y. L. Yan, K. Wang, P. T. Clough and E. J. Anthony, Developments in calcium/chemical looping and metal oxide redox cycles for high-temperature thermochemical energy storage: A review, Fuel Process. Technol., 2020, 199, 106280 CrossRef CAS.
- A. Bayon, R. Bader, M. Jafarian, L. Fedunik-Hofmanm, Y. P. Sun, J. Hinkley, S. Miller and W. Lipinski, Techno-economic assessment of solid-gas thermochemical energy storage systems for solar thermal power applications, Energy, 2018, 149, 473–484 CrossRef CAS.
- M. I. Zaki, Thermochemistry of manganese oxides in reactive gas atmospheres: probing redox compositions in the decomposition course MnO2 → MnO, Thermochim. Acta, 1997, 303, 171–181 CrossRef CAS.
- S. K. Wu, C. Zhou, E. Doroodchi, R. Nellore and B. Moghtaderi, A review on high-temperature thermochemical energy storage based on metal oxides redox cycle, Energy Convers. Manage., 2018, 168, 421–453 CrossRef CAS.
- G. Karagiannakis, C. Pagkouraa, A. Zygogiannia, S. Lorentzoua and A. G. Konstandopoulos, Monolithic ceramic redox materials for thermochemical heat storage applications in CSP plants, Energy Procedia, 2014, 49, 820–829 CrossRef CAS.
- A. J. Carrillo, D. P. Serrano, P. Pizarro and J. M. Coronado, Thermochemical heat storage based on the Mn2O3/Mn3O4 redox couple: influence of the initial particle size on the morphological evolution and cyclability, J. Mater. Chem. A, 2014, 2, 19435 RSC.
- D. Müller, C. Knoll, A. Werner, M. Harasek, C. Gierl-Mayer, J. M. Welch, A. Werner and P. Weinberger, Combining in situ X-ray diffraction with thermogravimetry and differential scanning calorimetry – An investigation of Co3O4, MnO2 and PbO2 for thermochemical energy storage, Sol. Energy, 2017, 153, 11–24 CrossRef.
- C. Agrafifiotis, M. Roe and C. Sattler, Exploitation of thermochemical cycles based on solid oxide redox systems for thermochemical storage of solar heat. Part 4: Screening of oxides for use in cascaded thermochemical storage concepts, Sol. Energy, 2016, 139, 695–710 CrossRef.
- M. Wokon, T. Block, S. Nicolai, M. Linder and M. Schmücker, Thermodynamic and kinetic investigation of a technical grade manganese-iron binary oxide for thermochemical energy storage, Sol. Energy, 2017, 153, 471–485 CrossRef CAS.
- N. C. Preisner, T. Block, M. Linder and H. Leion, Stabilizing particles of manganese-iron oxide with additives for thermochemical energy storage, Energy Technol., 2018, 6(11), 2154–2165 CrossRef CAS.
- A. J. Carrillo, D. P. Serrano, P. Pizarro and J. M. Coronado, Thermochemical heat storage at high temperatures using Mn2O3/Mn3O4 system: narrowing the redox hysteresis by metal co-doping, Energy Procedia, 2015, 73, 263–271 CrossRef CAS.
- A. J. Carrillo, D. P. Serrano, P. Pizarro and J. M. Coronado, Manganese oxide-based thermochemical energy storage: Modulating temperatures of redox cycles by Fe–Cu co-doping, J. Energy. Storage, 2016, 5, 169–176 CrossRef.
- D. Bielsaa, A. Zakia, P. L. Arias and A. Faik, Improving the redox performance of Mn2O3/Mn3O4 pair by Si doping to be used as thermochemical energy storage for concentrated solar power plants, Sol. Energy, 2020, 204, 144–154 CrossRef.
- D. Yilmaz, E. Darwish and H. Leion, Investigation of the combined Mn-Si oxide system for thermochemical energy storage applications, J. Energy. Storage, 2020, 28, 101180 CrossRef.
- A. J. Carrillo, P. Pizarro and J. M. Coronado, Assessing Cr incorporation in Mn2O3/Mn3O4 redox materials for thermochemical heat storage applications, J. Energy. Storage, 2021, 33, 102028–102036 CrossRef.
- A. J. Carrillo, D. P. Serrano and P. Pizarro, Improving the thermochemical energy storage performance of the Mn2O3/Mn3O4 redox couple by the incorporation of iron, ChemSusChem, 2015, 8, 1947–1954 CrossRef CAS PubMed.
- A. Abad, T. Mendiara, M. T. Izquierdo, L. F. de Diego, F. García-Labiano, P. Gayán and J. Adánez, Evaluation of the redox capability of manganese-titanium mixed oxides for thermochemical energy storage and chemical looping processes, Fuel Process. Technol., 2021, 211, 106579 CrossRef CAS.
- S. K. Panda, P. Hudon and I. Jung, Coupled experimental study and thermodynamic modeling of the MnO-Mn2O3-Ti2O3-TiO2 system, CALPHAD: Comput. Coupling Phase Diagrams Thermochem., 2019, 66, 101639 CrossRef CAS.
- N. Shao, Research on Physical and Chemical Characteristics of Solar Energy Storage Materials based on Mn2O3/Mn3O4 System, Zhejiang University, 2019 Search PubMed.
- W. Song, Kinetic models of gas-solid non-catalytic reactions, Chem. React. Eng. Technol., 1986, 4, 29–37 Search PubMed.
- J. Yu, J. R. Yue, W. Z. Liu, G. Y. Zhang and G. W. Xu, Thermal analysis approach and instrument for non-catalytic reactions, Chin. J. Anal. Chem., 2011, 39, 1549–1554 CrossRef CAS.
- W. C. Yu, B. G. Liu, L. B. Zhang, W. W. Qu and Y. L. Jiang, Analysis of Kinetic Parameters of Molybdenite Oxidation Roasting Based on the Multiple Scanning Rate Method, Chem. React. Eng. Technol., 2018, 34, 359–364 CAS.
- T. Pan, Y. Cheng, L. Wang and X. Li, Thermal decomposition kinetics of ammonium sulfate studied with multiple scanning methods, J. Chem. Eng. Chin. Univ., 2019, 33, 1086–1091 CAS.
- P. Jana, V. A. de la Pena O'Shea, J. M. Coronado and D. P. Serrano, Cobalt based catalysts prepared by Pechini method for CO2-free hydrogen production by methane decomposition, Int. J. Hydrogen Energy, 2010, 35, 10285–10294 CrossRef CAS.
- S. Vyazovkin, A. K. Burnham, J. M. Criado, L. A. Pérez-Maqueda, C. Popescu and N. Sbirrazzuoli, ICTAC Kinetics Committee recommendations for performing kinetic computations on thermal analysis data, Thermochim. Acta, 2011, 520, 1–19 CrossRef CAS.
- A. Khawam and D. R. Flanagan, Solid-state kinetic models: basics and mathematical fundamentals, J. Phys. Chem. B, 2006, 110, 17315–17328 CrossRef CAS PubMed.
- T. Ozawa, A New Method of Analyzing Thermogravimetric Data, Bull. Chem. Soc. Jpn., 1965, 38, 1881–1886 CrossRef CAS.
- J. M. Criado, P. E. Sánchez-Jiménez and L. A. Pérez-Maqueda, Critical study of the isoconversional methods of kinetic analysis, J. Therm. Anal. Calorim., 2008, 92, 199–203 CrossRef CAS.
- C. Q. Luo, B. L. Dou, H. Zhang, D. S. Liu, L. F. Zhao, H. S. Chen and Y. J. Xu, Co-production of hydrogen and syngas from chemical looping water splitting coupled with decomposition of glycerol using Fe-Ce-Ni based oxygen carriers, Energy Convers. Manage., 2021, 238, 114166 CrossRef CAS.
- S. Tescari, A. Singh, C. Agrafifiotis, L. de Oliveira, S. Breuer, B. Schlögl-Knothe, M. Roeb and C. Sattler, Experimental evaluation of a pilot-scale thermochemical storage system for a concentrated solar power plant, Appl. Energy, 2017, 89, 66–75 CrossRef.
- J. E. Miller, High-performance reduction/oxidation metal oxides for thermochemical energy storage (promotes), in ASME 2016 International Conference on Energy Sustainability Collocated with the ASME 2016 Power Conference and the ASME 2016 International Conference on Fuel Cell Science, Engineering and Technology, 2016 Search PubMed.
- E. Bagherisereshki, J. Tran, F. Lei and N. AuYeung, Investigation into SrO/SrCO3 for high temperature thermochemical energy storage, Sol. Energy, 2018, 160, 85–93 CrossRef CAS.
- R. M. German, Coarsening in Sintering: Grain Shape Distribution, Grain Size Distribution, and Grain Growth Kinetics in Solid-Pore Systems, Crit. Rev. Solid State Mater. Sci., 2010, 35, 263–305 CrossRef CAS.
- Y. T. Li, D. L. Ma, H. Y. Liu, P. P. Jing, Y. L. Gong, Z. Ayaz, F. J. Jing, X. Jiang and Y. X. Leng, Biocompatibility of Ti-Mn-N films with different manganese contents, Surf. Coat. Technol., 2020, 403, 126354 CrossRef CAS.
- H. Liu, X. Li, Q. G. Dai, H. L. Zhao, G. T. Chai, Y. L. Guo, Y. Guo, L. Wang and W. C. Zhan, Catalytic oxidation of chlorinated volatile organic compounds over Mn-Ti composite oxides catalysts: Elucidating the influence of surface acidity, Appl. Catal., B, 2021, 282, 119577 CrossRef CAS.
- E. M. Ibrahim, M. M. Hasan, A. A. Saleh and N. K. Allam, Structural engineering of Ti-Mn bimetallic phosphide nanotubes for efficient photoelectrochemical water splitting, Int. J. Hydrogen Energy, 2021, 46, 3605–3614 CrossRef CAS.
| This journal is © The Royal Society of Chemistry 2021 |

