
 Open Access Article
 This Open Access Article is licensed under a Creative Commons Attribution-Non Commercial 3.0 Unported Licence
Luminescence properties of [Ir(C^N)2(N^N)]+ complexes: relations between DFT computation results and emission band-shape analysis data
Andrzej Kapturkiewicz * and
Anna Kamecka
* and
Anna Kamecka
Institute of Chemical Sciences, Siedlce University of Natural Sciences and Humanities, 3 Maja 54, 08-110 Siedlce, Poland. E-mail: andrzej.kapturkiewicz@uph.edu.pl; Tel: +48-25-643-10-97
First published on 1st September 2021
Abstract
Luminescence properties of two series of [Ir(C^N)2(N^N)]+ complexes bearing deprotonated 1-phenyl-1H-pyrazole or 1-(2,4-difluorophenyl)-1H-pyrazole as cyclometalating C^N ligands and different α-diimines (2,2′-bipyridine, 1,10-phenanthroline and their derivatives) as ancillary N^N ligands have been studied in acetonitrile solutions at room temperature and in 77 K methanol/ethanol (1![[thin space (1/6-em)]](https://www.rsc.org/images/entities/char_2009.gif) :1) matrices. Ligand and temperature induced changes in the nature of the emissive 3*[Ir(C^N)2(N^N)]+ species result in well-pronounced changes in their emission properties like emission wavelength, emission quantum yields and emission lifetimes. Depending on the nature of the coordinated C^N and N^N ligands and/or the measurement temperature, the investigated luminophores exhibit emissions arising from the intraligand transitions localized within the N^N ligand or from the metal-to-ligand charge-transfer transitions involving the Ir(C^N)2+ and N^N moieties as confirmed by means of the DFT computations. The computed DFT energies of the excited 3*[Ir(C^N)2(N^N)]+ states and outer/inner reorganization energies associated with the S0 ← 3*[Ir(C^N)2(N^N)]+ transitions remain in nice agreement with those available from the performed emission band-shape analyses. The observed agreement implies ordinary DFT computations at the B3LYP/LANL2DZ/6-31G(d,p) level of theory, even performed neglecting the spin–orbit phenomena, as enough accurate in the quantitative prediction of the most important parameters characterizing the investigated [Ir(C^N)2(N^N)]+ luminophores.
:1) matrices. Ligand and temperature induced changes in the nature of the emissive 3*[Ir(C^N)2(N^N)]+ species result in well-pronounced changes in their emission properties like emission wavelength, emission quantum yields and emission lifetimes. Depending on the nature of the coordinated C^N and N^N ligands and/or the measurement temperature, the investigated luminophores exhibit emissions arising from the intraligand transitions localized within the N^N ligand or from the metal-to-ligand charge-transfer transitions involving the Ir(C^N)2+ and N^N moieties as confirmed by means of the DFT computations. The computed DFT energies of the excited 3*[Ir(C^N)2(N^N)]+ states and outer/inner reorganization energies associated with the S0 ← 3*[Ir(C^N)2(N^N)]+ transitions remain in nice agreement with those available from the performed emission band-shape analyses. The observed agreement implies ordinary DFT computations at the B3LYP/LANL2DZ/6-31G(d,p) level of theory, even performed neglecting the spin–orbit phenomena, as enough accurate in the quantitative prediction of the most important parameters characterizing the investigated [Ir(C^N)2(N^N)]+ luminophores.
Introduction
Phosphorescent transition metal complexes1–5 belong to one of the most important classes of molecular luminophores. They have attracted long-standing research interest due to their possible practical applications like analytical and bioanalytical probes,6–11 sensitizers for dye solar cell,12–15 materials for light-emitting devices,16–21 and photocatalysts.22–27 Particularly, complexes containing second- and third-row transition metal ions and coordinating organic ligands are targets of many extensive studies, mostly due to their exceptional luminescence properties. Photophysical properties of such luminophores arise from the presence of metal-based and ligand-based orbitals involved in the electronic transitions and intense spin–orbit couplings caused by the presence of heavy metal ions. The latter gives rise to singlet–triplet state mixing allowing in many cases well-pronounced radiative relaxations of their triplet states as well. Thus, due to the presence of heavy metal ion, the organometallic luminophores are typically quite different from pure organic ones. Their photophysical properties arise from the relative energetic position and the interplay of the closely lying excited states of different characters. Consequently, the spectroscopic and photophysical properties of transition metal complexes of the given ion may be quite different, even for very similar ligands present in their structures. This makes phosphorescent transition metal complexes particularly interesting also from the “pure academic” point of view.Innumerable studies, performed for different metal–ligands architectures, reported the application oriented as well as fundamental investigations of the relationships between structure and luminescence properties. Typically, such studies present results from the synthetic, structural and spectroscopic investigations accompanied (at least in the last decade) by more or less advanced quantum-mechanical computations. In most cases, the performed computations were done by means of the Density Functional Theory – DFT implemented in very popular Gaussian software package.28–32 Usually the performed computations involve optimization of the ground S0 and the lowest excited T1 states. Then, the computed DFT quantities like shapes and energies of the frontiers orbitals, charge and spin redistribution, changes in the dipole moments, changes in the bond lengths in the optimized ground S0 and the lowest excited T1 states are used in further discussion of the T1 nature. Correspondingly, the interpretation of the UV-Vis spectra uses results from the time-dependent DFT (TD-DFT) computation, optionally performed within the framework of Tamm–Dancoff (TDA-DFT) approximation.33–36 Generally, one can emphasize quite good agreement between theory and experiment, even if the computations are performed neglecting the spin–orbit coupling phenomena at all.
Considering the found agreement between DFT/TD-DFT computations and experiment, one can underscore the relevance of these theoretical tools in the robust prediction of other quantities relevant for emission from organometallic emitters. These include the emission quantum yields as well as the emission colours. The latter in the terms of the Commission Internationale de l'Eclairage (CIE 1931) chromaticity coordinates. However, there are rather challenging tasks requiring, as compared to “ordinary” DFT calculation, much more computing effort. This is because proper simulation of the luminescence spectra requires the inclusion of the vibrational contributions in addition to the electronic transitions,37–39 whereas the accurate description of the spin–orbit coupling is necessary to compute the radiative and non-radiative decay rate constants.40–44
To some extent, however, one can overcome the above raised difficulties, at least for the organometallic emitters displaying the metal-to-ligand charge-transfer (MLCT) emissions. This anticipation arises from distinct analogy between the non-radiative and radiative transitions (the thermal and optical charge-transfer) occurring in so-called inverted Marcus region.45–47 For both processes, the same set of energetic parameters, i.e., the inner (solute) and outer (solvent) reorganization energies, determine the Franck–Condon factors governing the non-radiative and radiative transitions. Moreover, both processes, involving two electronic states with energy gap ΔE and the difference in their dipole moments Δμ, are closely related one to another because, according to the Mullikan–Hush relationship,48–51 the transition dipole moments M for the optical electron transfer are directly linked with the electronic coupling element V for the thermal electron transfer
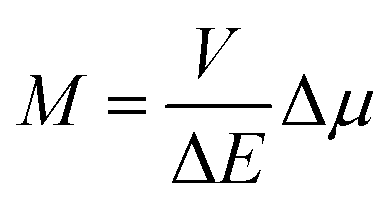 | (1) |
The close connection between the optical and thermal charge-transfer allows discussion of the radiative and non-radiative deactivation of the excited charge-transfer states within the same approach. One can obtain some intrinsic information about these processes by means of the comparative analysis of the absorption/emission bands exemplifying the radiative charge separation/recombination and from the kinetics of the radiative and non-radiative transitions, i.e., from the rate constants of radiative and non-radiative processes kr and knr, respectively. Relatively simple estimation of the quantities determining the Franck–Condon factors associated with the excited charge-transfer state deactivation is possible from the band-shape analysis of the emission spectra. Correspondingly, the experimentally available Mem values (i.e., transitions dipole moments of emission) allow, according to eqn (1), estimation of the V terms required for prediction of the rate constants knr of the non-radiative transitions. Thus, when no other processes are operative in the excited state deactivation, one can expect agreement with the experimentally available knr values with those predicted from the spectroscopic data analyses. This was indeed observed for the “pure” organic inter-molecular and intra-molecular electron transfer systems52–57 as well as for the transition metal complexes exhibiting the MLCT emission.58–62
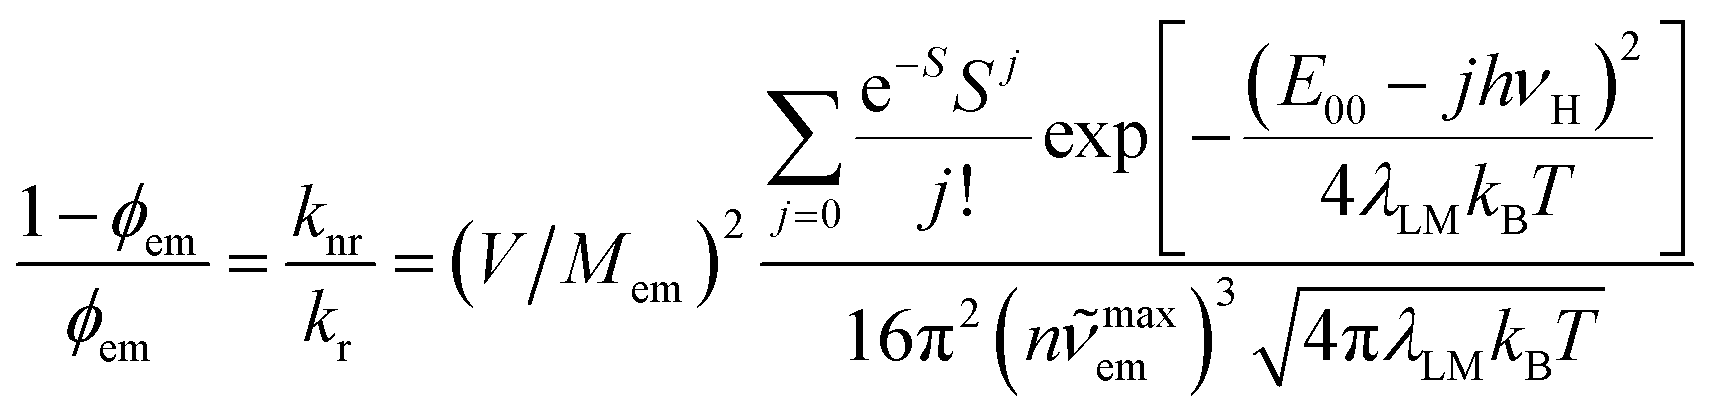
The above, briefly introduced approach is based on two fundamental equations related to the radiative and non-radiative charge-transfer processes, respectively. In the case of radiative one, one can express the relationship between the emission intensity I(![[small nu, Greek, tilde]](https://www.rsc.org/images/entities/i_char_e0e1.gif) em) (in photons per second per unit of spectral energy) and the emitted photon energy hcem as follows63–67
em) (in photons per second per unit of spectral energy) and the emitted photon energy hcem as follows63–67
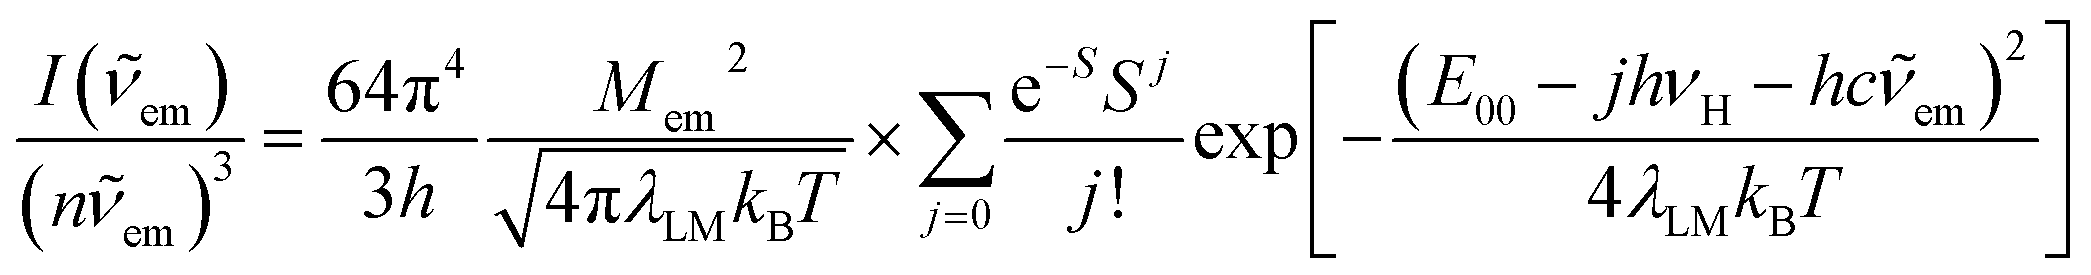 | (2) |
| λLM = λS + λL + λM(hνM/2kBT)coth(hνM/2kBT) | (3) |
Within the same level of theory, the values of knr rate constants are predictable from the following expression70–73
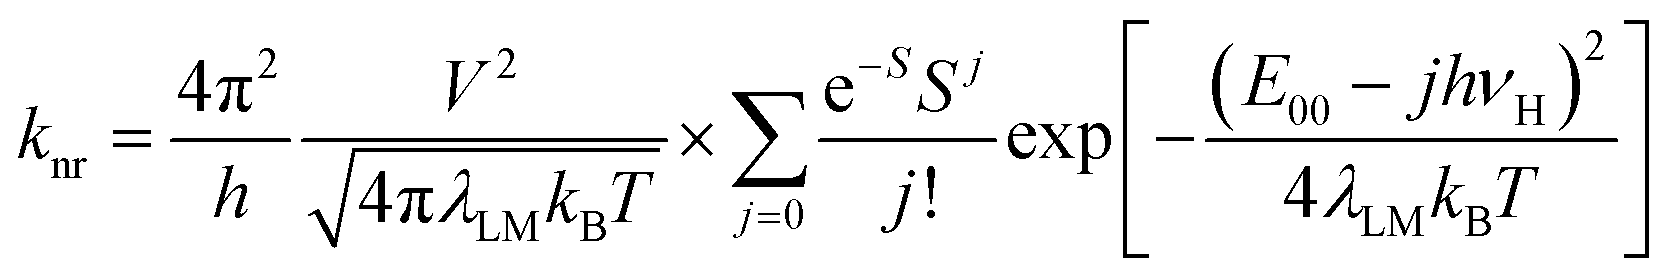 | (4) |
Within the framework of the presented approach, one can also estimate the complementary kr rate constant. Integration of the eqn (1) over whole range of the hcem results in the expression relating the kr value to the transition dipole moment Mem and the emission maximum maxem (connected with the Ees energy by the Ees = hcmaxem + λS + λL + λM + λH relationship)
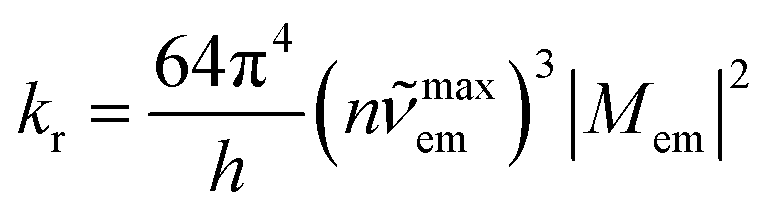 | (5) |
Since the kr/knr ratios determine values of the emission quantum yields ϕem, these are also predictable with the same set of parameters as applied in simulation of the emission spectrum. This is possible even without detailed knowledge of the Mem and V parameters because, in accordance to eqn (1), one can simply relate the Mem/V to Δμ/hcmaxem.
Due to its intuitive character, one can regard the opportunity hypothesised above as simple tool useful in the design of novel organometallic luminophores. Despite relatively large numbers of the required parameters, this is quite possible. This is because one can expect some of them (hνM and hνH frequencies) to be rather independent of the metal/ligands system whereas the remaining ones (Ees and reorganization energies) are quantum-mechanically computable. Geometry optimizations performed for the ground (singlet) and excited (triplet) states provide values of the Ees and Δμ quantities. Computing energies of the singlet state at the triplet geometry one can obtain the energy of the Franck–Condon state reached in the emission. In an analogous way, the computations performed for the triplet state at the singlet geometry result in the energy of the Franck–Condon state populated in the absorption. Thus, the results, obtained from the restricted and unrestricted DFT geometries provide the information about intra-molecular reorganization energies (i.e., the λL + λM + λH sum) associated with transitions between the ground and excited states (cf. Fig. 1). Correspondingly, the computations, done explicitly introducing the non-equilibrium solvation phenomena, provide the Franck–Condon energies that contain additional λS contributions from the solvent shell reorganization (i.e., the λL + λM + λH + λS sum). Any practical use of the computation outcomes requires further separation of the computed λL + λM + λH sum into the individual λH and λL + λM (the high-temperature limit) or even into three independent components (the low-temperature limit). This is rather challenging task, rather hardly to realize without further much more sophisticated computations. On the other hand, at least in zero order approximation within the high-temperature limit under consideration, one can assume relatively small (20–30%) λL + λM contribution to the overall intra-molecular reorganization energy.
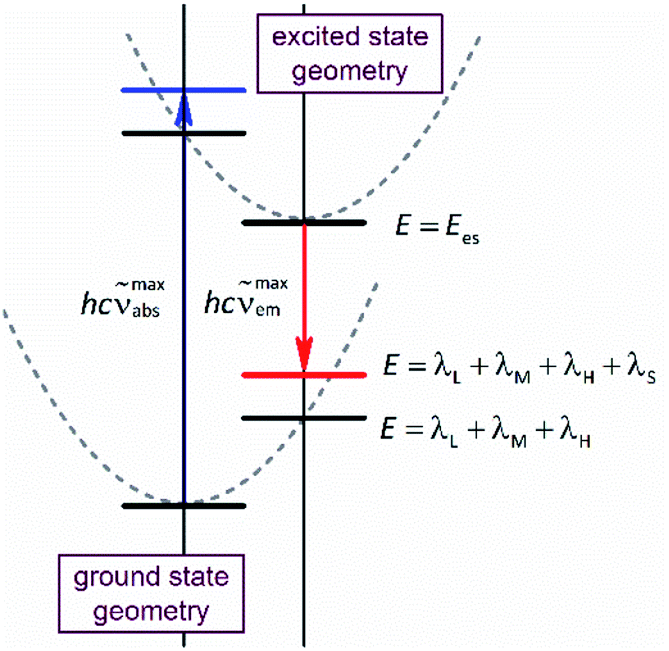 | ||
| Fig. 1 Potential energy curves of the ground and excited states and electronic transitions between them, blue and red vertical arrows for the absorption and emission processes. Horizontal bars represent energies show the equilibrated (black) and non-equilibrated (blue and red) solvent polarization. The latter corresponds to the Franck–Condon states reached in the absorption and emission, respectively. | ||
Taking into account potential utility of the approach presented above, we have decided to test its applicability in a more systematic way. Among the huge amount of luminescent metal/ligands combinations that one could applied as a model system, we focus our attention on the cyclometalated Ir3+ complexes. Due to their unprecedented luminescence properties, particularly high photoluminescence quantum yields with tuneable emission wavelengths, there are objectives of many expressive studies performed on the homoleptic and heteroleptic Ir3+ chelates.74–79 From the latter class, these containing the cyclometalated C^N and ancillary α-diimine N^N ligands attached to the Ir3+ core, can be regarded as particularly interesting. The wide-ranging combinations of C^N and N^N ligands, easily attachable using the well-known Nonoyama synthetic strategy,80,81 allow tuning the emissive properties of the [Ir(C^N)2(N^N)]+ complexes in very simple way. Depending on the nature of the coordinated C^N and N^N ligands, one can change the nature of the excited 3*[Ir(C^N)2(N^N)]+ states as well. The above is particularly true for the Ir3+ chelates containing the C^N and N^N ligands as depicted in Fig. 2. Some of these chelates have been already tested as potential materials for OLED devices and their luminescence were reported in the literature.82–89 Whereas the [Ir(ppz)2(N^N)]+ complexes82–86 exhibit typically the MLCT emission, their [Ir(dfppz)2(N^N)]+ counterparts87–89 display, for some of the N^N ligands, the 3*N^N ligand centred LC emission. From this point of view, one can regard the mentioned Ir3+ chelates as particularly well designed model systems allowing testing the raised hypothesis for similar as well as different enough emitters. Here we present results from the more systematic luminescence studies of these two complex series together with the comparative analysis of the result obtained by means of the emission band-shape analysis and DFT computation.
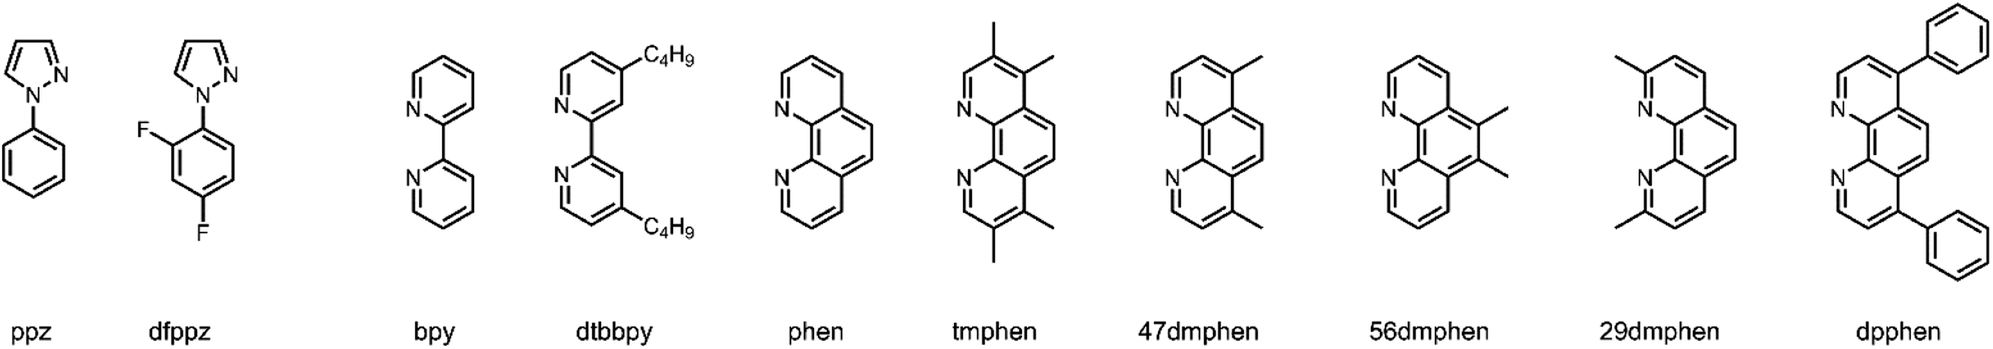 | ||
| Fig. 2 Structures of cyclometalating C^N and α-diimine N^N ligands employed. Acronyms used for C^N ligands: 1-phenyl-1H-pyrazole – ppz and 1-(2,4-difluorophenyl)-1H-pyrazole – dfppz. Acronyms used for N^N ligands: 2,2′-bipyridine – bpy, 4,4′-di-t-butyl-2,2′-bipyridine – dtbbpy, 1,10-phenanthroline – phen, 3,4,7,8-tetramethyl-1,10-phenanthroline – tmphen, 4,7-dimethyl-1,10-phenathroline – 47dmphen, 5,6-dimethyl-1,10-phenanthroline – 56dmphen, 2,9-dimethyl-1,10-phenanthroline – 29dmphen, and 4,7-diphenyl-1,10-phenathroline – dpphen. | ||
Results and discussion
UV-Vis absorption and emission
In nice agreement with the literature data,82–89 the presence of different C^N and N^N ligands in the [Ir(C^N)2(N^N)]+ structures differentiates to some extent their UV-Vis absorption spectra. The effects, however, are relatively small as it can be clearly seen in the representative examples depicted in Fig. 3 and 4, for the [Ir(C^N)2(tmphen)]+ and [Ir(C^N)2(bpy)]+ pairs. The recorded spectra exhibit strong absorption at high energies (at wavelengths shorter than 330 nm) and broad low-energy bands (within the 350–450 nm range) of rather low intensities.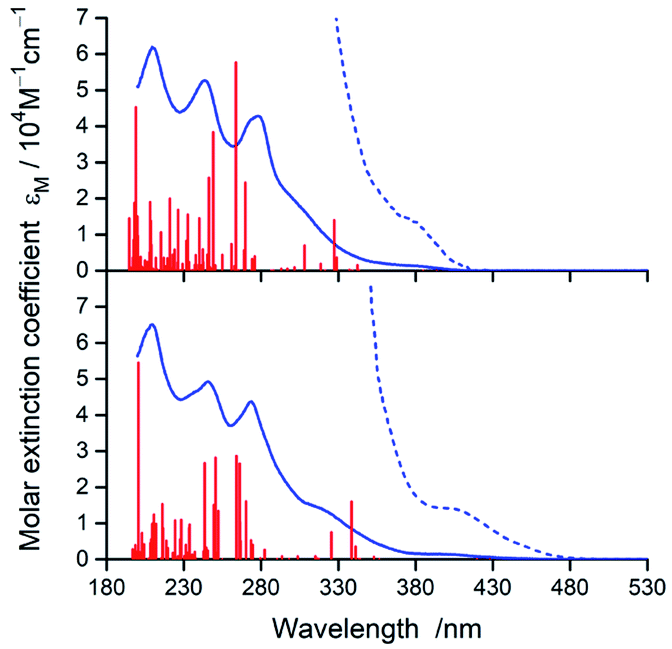 | ||
| Fig. 3 UV-Vis absorption spectra of [Ir(dfppz)2(tmphen)]+ (top) and [Ir(ppz)2(tmphen)]+ (bottom) complexes in acetonitrile solutions. Red vertical bars denote positions and relative intensities of the electronic transitions from TDA-DFT computations whereas dotted lines present expanded (by a factor 10) low energy part of the spectra. From the computed 100 S0 → Sn transitions, only these with oscillator strange f > 0.005 are depicted. | ||
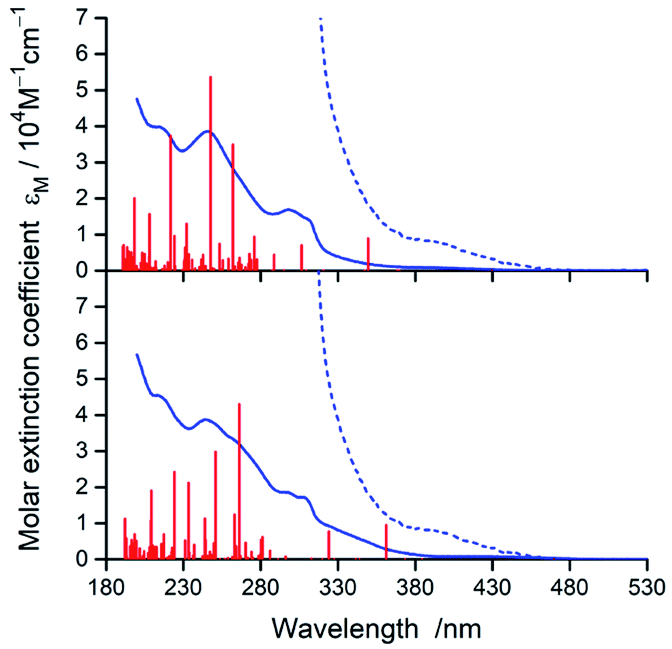 | ||
| Fig. 4 UV-Vis absorption spectra of [Ir(dfppz)2(bpy)]+ (top) and [Ir(ppz)2(bpy)]+ (bottom) complexes in acetonitrile solutions. Red vertical bars denote positions and relative intensities of the electronic transitions from TDA-DFT computations whereas dotted lines present expanded (by a factor 10) low energy part of the spectra. From the computed 100 S0 → Sn transitions, only these with oscillator strange f > 0.005 are depicted. | ||
Taking into account shapes, positions and intensities of the absorption bands observed at short wavelengths one can assign them as a superposition of the π → π* and/or n → π* intra-ligand transitions while the low energy part of the UV-Vis spectra reflects the presence of the spin-allowed MLCT transitions. Due to the spin–orbit coupling effects, caused by the presence of heavy metal ion, the low intensity absorption tail may contain some contribution of the nominally spin-forbidden MLCT and LC transitions as well. Such tentative assignment, based on the analogy with other similar Ir3+ complexes, remains in reasonable agreement with the results from TD-DFT and TDA-DFT computation performed for the optimized ground state geometries of the complexes under study. Although both computation approaches gave very similar results, the transition energies are somewhat better reproducible when the TDA approximation is applied. For all complexes under study, the computation results point to the presence of series of the singlet and triplet transitions in the low energy part of the UV-Vis absorption spectra. Some of them are MLCT (or MLL'CT) in nature, whereas others are the intra-ligand S0 → 3*LC transitions. Whereas the low-energy singlet transitions are the MLCT type, some from the triplet manifold correspond evidently to the LC ones. Depending on the C^N and N^N ligand combination, one can assign the lowest triplet state populated in the vertical S0 → T1 transitions as MLCT or LC, respectively.
According to the performed computations, the lowest energy singlet transitions have very low oscillator strength (f < 10−3), which might explain the low intensity absorption tail. However, comparing the overall intensities of the low energy bands, one can conclude that computed f values are too small to explain the molar extinction coefficient εM as high as 103 M−1 cm−1. Most likely, this discrepancy appears because the performed computations neglect the spin–orbit effects that results in f = 0 for all S0 → Tn transitions. The estimated, relatively high values (up to ca. 0.4 D) of the transition dipole moments of the S0 ← T1 emissions (vide infra) allow concluding important contributions from the S0 → Tn transitions to the absorption in the 380–480 nm part of the UV-Vis spectra.
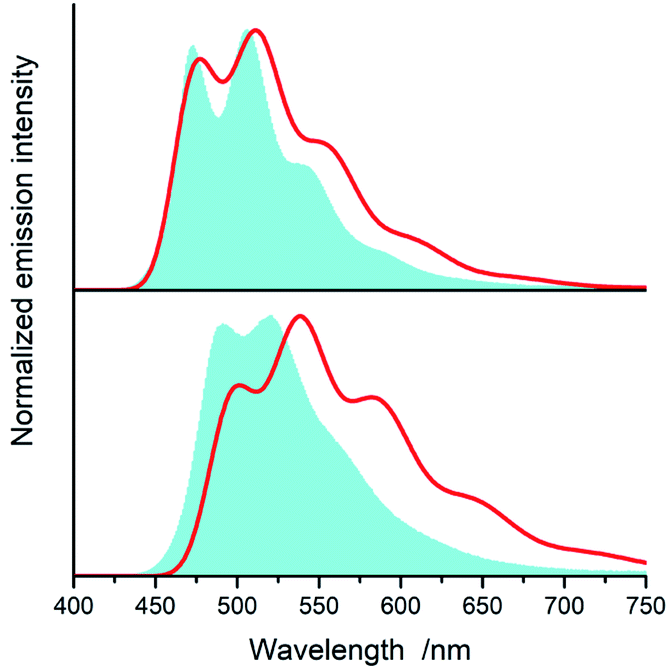
All of the complexes under study are luminescent both at room temperature and at 77 K. The spectral positions and shapes of their emission bands depend essentially on the nature of the C^N and N^N present in the [Ir(ppz)2(N^N)]+ and [Ir(dfppz)2(N^N)]+ series (cf. Fig. 5 and 6). Whereas the room temperature emissions of the [Ir(ppz)2(N^N)]+ complexes are typically broad, one can clearly see more or less structured bands for some of the [Ir(dfppz)2(N^N)]+ chelates. Compared the 298 K emissions with those recorded at 77 K, one can see further intrinsic features. The lowering the measurements temperature results in well-pronounced prolonging emission lifetimes associated with significant changes in the emission profiles. In this temperature regime, nearly all investigated complexes display structured emissions with their positions and shapes resembling the isolated N^N ligands.90–92 Only some of the investigated luminophores, namely [Ir(ppz)2(phen)]+, [Ir(ppz)2(dtbbpy)]+, and [Ir(ppz)2(bpy)]+, keep their room temperature character. The observed behaviour can be rationalized taking into account rigidochromic effects caused by hindered solvent/solute relaxation caused by the extreme viscosity of the low temperature glasses.93–95
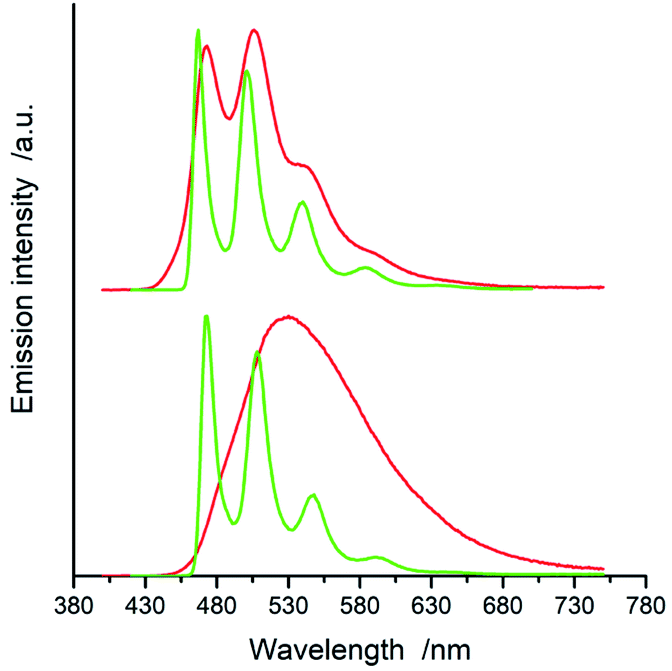 | ||
| Fig. 5 Emission spectra of [Ir(dfppz)2(tmphen)]+ (top) and [Ir(ppz)2(tmphen)]+ (bottom) complexes recorded in the room temperature acetonitrile solutions (red lines) and the 77 K CH3OH/C2H5OH (1:1) matrices (green lines). | ||
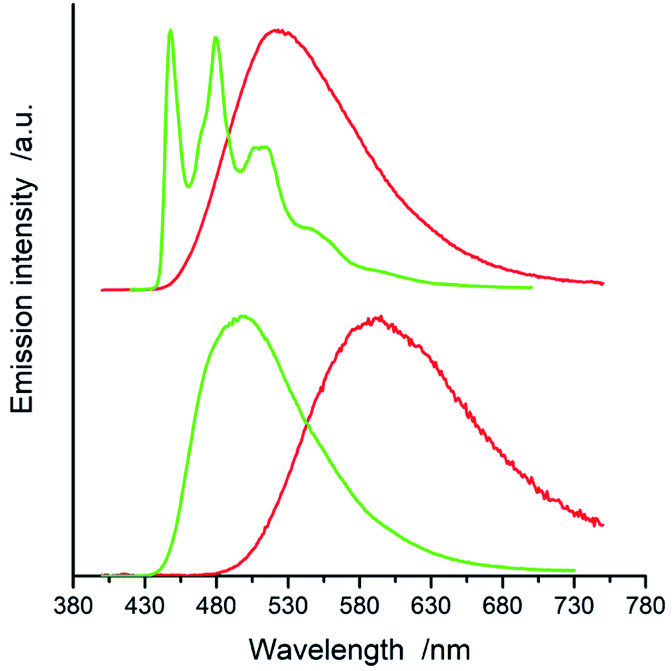 | ||
| Fig. 6 Emission spectra of [Ir(dfppz)2(bpy)]+ (top) and [Ir(ppz)2(bpy)]+ (bottom) complexes recorded in the room temperature acetonitrile solutions (red lines) and the 77 K CH3OH/C2H5OH (1:1) matrices (green lines). | ||
Additionally to changes in the emission shapes, one can reflect different nature of the emissive species to their lifetimes (cf. data in Table 1). The complexes with broad and structureless emission at 298 K exhibit also short (<5 μs) emission lifetimes. In contrary to that, those with long τem display structured spectra. This coincidence allows tentative assigning the emissive species as the MLCT or LC emitters, respectively. Such assignment seems to be doubtless for the most of the studied complexes, only two of them, [Ir(dfppz)2(29dmphen)]+ and [Ir(dfppz)2(dpphen)]+, may raise some reservations due to their relatively long lifetimes (10 and 20 μs) associated with unstructured emissions. Their emission shapes are, however, significantly different from those of their [Ir(ppz)2(29dmphen)]+ and [Ir(ppz)2(dpphen)]+ analogues. Thus, one can hardly classify both dubious items taking into account only their photophysical parameters. Results from the performed DFT computation and emission band-shape analysis (vide infra) allow, however, assigning them to the LC category.
:1) matrices at 77 K. Emission maxima (maxem), emission lifetimes (τem) with normalized amplitudes for bi-exponential decay, and emission quantum yields (ϕem)
| Complex | 298 K | 77 K | |||
|---|---|---|---|---|---|
| maxem/cm−1 |
τem/μs | ϕem | maxem/cm−1 |
τem/μs | |
| [Ir(dfppz)2(tmphen)]+ | 21150, 19720, 18450 |
87 | 0.55 | 21500, 19950, 18500, 17100, 15700 |
220 |
| [Ir(dfppz)2(47dmphen)]+ | 21050, 19720, 18600 |
36 | 0.75 | 21500, 20100, 18620, 17270, 15780 |
215 |
| [Ir(dfppz)2(56dmphen)]+ | 20350, 19200 |
98 | 0.64 | 20750, 19350, 18000, 16650 |
315 |
| [Ir(dfppz)2(29dmphen)]+ | 19900 |
10 | 0.52 | 22000, 20530, 19150, 17800 |
35 |
| [Ir(dfppz)2(dpphen)]+ | 18700 |
20 | 0.72 | 20500, 19120, 17750, 16300 |
32 |
| [Ir(dfppz)2(phen)]+ | 19280 |
2.6 | 0.70 | 21920, 20450, 19050, 17600 |
14 (0.71), 55 (0.29) |
| [Ir(dfppz)2(dtbbpy)]+ | 19350 |
1.2 | 0.80 | 23050, 21500, 20080, 18730 |
4.0 |
| [Ir(dfppz)2(bpy)]+ | 18980 |
1.1 | 0.67 | 22320, 20830, 19420, 18280 |
4.0 |
| [Ir(ppz)2(tmphen)]+ | 18650 |
3.8 | 0.79 | 21170, 19700, 18250, 16900, 15500 |
19 (0.41), 62 (0.59) |
| [Ir(ppz)2(47dmphen)]+ | 19850 |
1.3 | 0.59 | 21240, 19750, 18380, 16980 |
10 (0.41), 41 (0.59) |
| [Ir(ppz)2(56dmphen)]+ | 17100 |
0.91 | 0.43 | 20620, 19250, 17900 |
8.0 (0.75), 54 (0.22) |
| [Ir(ppz)2(29dmphen)]+ | 18550 |
2.4 | 0.65 | 20830, 19530, |
8.8 |
| [Ir(ppz)2(dpphen)]+ | 16600 |
0.95 | 0.44 | 19700, 18550 |
6.8 |
| [Ir(ppz)2(phen)]+ | 16950 |
0.78 | 0.37 | 19350 |
7.1 |
| [Ir(ppz)2(dtbbpy)]+ | 17100 |
0.61 | 0.34 | 19750 |
4.4 |
| [Ir(ppz)2(bpy)]+ | 16600 |
0.35 | 0.18 | 19100 |
5.0 |
Nature of the emissive 3*[Ir(C^N)2(N^N)]+ states
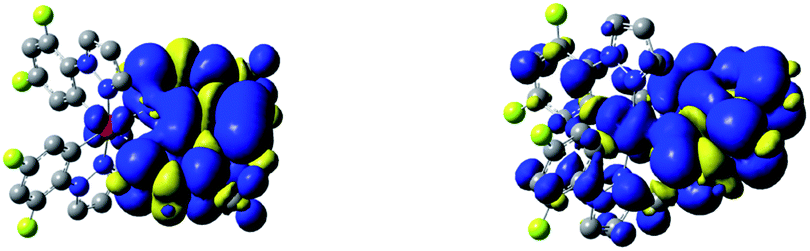
The performed DFT and TD(A)-DFT computations confirm the nature of the excited 3*[Ir(C^N)2(N^N)]+ states anticipated for the discussed complexes analysing their emission features. For all [Ir(ppz)2(N^N)]+ complexes classified tentatively as the MLCT emitters, the electronic S0 → T1 transitions computed for the optimized T1 geometries involve the LUMO and HOMO orbitals (cf. Fig. 7 and 8 for some representative examples) localized on the N^N and Ir(ppz)2+ or Ir(dfppz)2+ fragments, respectively. The same is also characteristic for the [Ir(dfppz)2(N^N)]+ complexes bearing bpy, dtbbpy, and phen ligands. In all of these emitters, the electron transfer from the Ir(C^N)2+ donor to the N^N acceptor corresponds to their excited triplet states with the spin redistribution over whole molecules. Summing the spin densities on the individual atoms, one can attach one of the unpaired electron to the N^N ligand, whereas the second one is localized on the Ir(C^N)2+ core. The computed spin density redistributions ratios, ranging from 1.13:0.87 for [Ir(ppz)2(29dmphen)]+ to 1.08:0.92 for [Ir(dfppz)2(phen)]+ are approaching the theoretical 1:1 symmetry expected for “pure” MLCT excitation. It should be noted, however, that the spin density on the Ir(C^N)2+ core is quite uniformly redistributed. Thus, one should consider these luminophores as the MLL'CT ones. Analyses of the charge redistribution in their S0 and T1 states confirm intrinsic changes in the overall Mulliken charges located on the N^N and C^N ligands. During their S0 → T1 excitation, the N^N ligands become more negatively charged by 0.6–0.7 e− whereas each of the C^N ones more positively by 0.2–0.3 e−, respectively. Such changes are not present in the LC emitters what is fully reasonable.
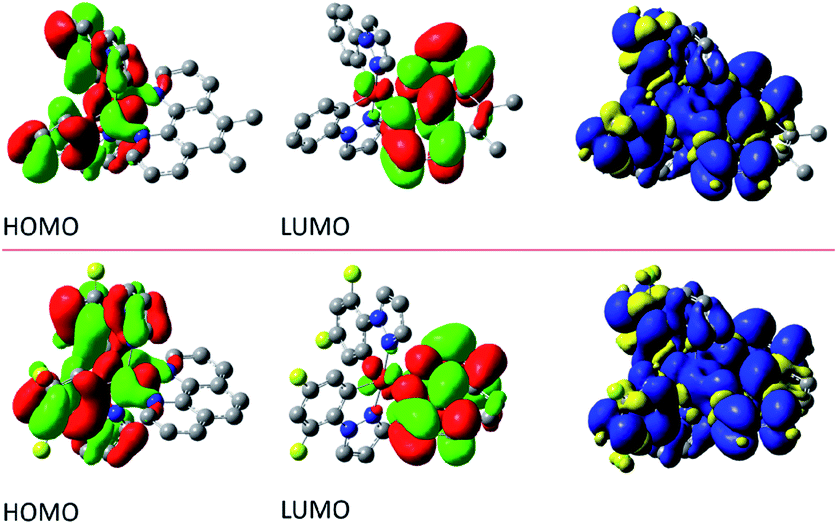 | ||
| Fig. 7 Shapes of the molecular orbitals involved into the S0 → T1 transition and the spin redistribution in the excited T1 state. Data for the [Ir(ppz)2(56dmphen)]+ (top) and [Ir(dfppz)2(phen)]+ (bottom) complexes at their T1 state geometries in acetonitrile solutions. | ||
 | ||
| Fig. 8 Shapes of the molecular orbitals involved into the S0 → T1 transition and the spin redistribution in the excited T1 state. Data for the [Ir(dfppz)2(56dmphen)]+ (top) and [Ir(dfppz)2(tmphen)]+ (bottom) complexes at their T1 state geometries in acetonitrile solutions. | ||
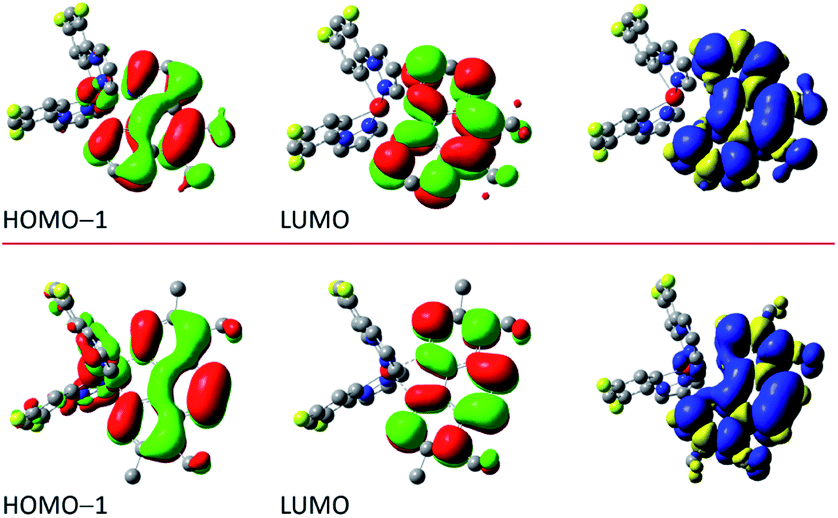
The situation is different for the remaining five chelates under study. Results from the performed computation point to multi-determinantal mixtures of one-electron excitation determining the S0 → T1 transitions. In the case of [Ir(dfppz)2(tmphen)]+, [Ir(dfppz)2(dpphen)]+ as well as [Ir(dfppz)2(56dmphen)]+ complexes, one can, however, ascribe the S0 → T1 transitions to almost pure HOMO−1 → LUMO transitions with 78, 86 and 92% contributions, respectively. Since the HOMO−1 and LUMO orbitals in these complexes are mainly localized on the N^N ligands, their lowest excited 3*[Ir(C^N)2(N^N)]+ states possess evident LC character. Such assignment remains in agreement with the localization of two unpaired electrons mainly on the N^N ligands with only very small amount, smaller than 2%, on the Ir(dfppz)2+ cores. For the last two complexes, namely [Ir(dfppz)2(47dmphen)]+ and [Ir(dfppz)2(29dmphen)]+, more multifaceted compositions of one-electron excitation (three or five) determine their S0 → T1 transitions, without, however, any distinctly dominant component. Nevertheless, analysing the spin density redistribution within their excited 3*[Ir(dfppz)2(47dmphen)]+ and 3*[Ir(dfppz)2(29dmphen)]+ states (cf. Fig. 9), one can assign both of them as the LC type luminophores. More correctly, however, one can better classify the latter one as the mixed LC/MLCT emitter.
 | ||
| Fig. 9 Spin density redistribution in the excited T1 state. Data for the [Ir(dfppz)2(47dmphen)]+ (left) and [Ir(dfppz)2(29mphen)]+ (right) complexes at their T1 state geometries in acetonitrile solutions. | ||
Comparative analysis of the dipole moments computed for the investigated molecules in their ground ![[small mu, Greek, vector]](https://www.rsc.org/images/entities/i_char_e0e9.gif) GS and excited ES states supports additionally the above conclusions. For the most emitters classified as the LC type luminophores, only marginal changes in the dipole moments are characteristic. Only in the case of the [Ir(dfppz)2(29dmphen)]+ complex somewhat larger difference in the GS and ES values (3.6 D) suggests some charge-transfer contribution to the wave function to its T1 state. This remains in agreement with postulated LC/MLCT nature of this particular emitter.
GS and excited ES states supports additionally the above conclusions. For the most emitters classified as the LC type luminophores, only marginal changes in the dipole moments are characteristic. Only in the case of the [Ir(dfppz)2(29dmphen)]+ complex somewhat larger difference in the GS and ES values (3.6 D) suggests some charge-transfer contribution to the wave function to its T1 state. This remains in agreement with postulated LC/MLCT nature of this particular emitter.
In contrary to the LC type emitters, distinctly larger GS − ES differences (Δ = 13.9–18.2 D) characterize the investigated MLCT ones. Such large Δ values correspond to shift of one e− charge over 0.28–0.36 nm that could be roughly related to the Ir(C^N)2+/N^N distance. The smallest Δ value (13.9 D) found for the [Ir(ppz)2(29dmphen)]+ chelate allows concluding the 29dmphen complexes as somewhat different from other ones comprising the studied [Ir(ppz)2(N^N)]+ and [Ir(dfppz)2(N^N)]+ series. Most likely the observed difference arises from the more pronounced mixing of “pure” MLCT and LC states in the excited 3*[Ir(C^N)2(29dmphen)]+ species. Finally one should also note the opposite direction of GS and ES vectors as typical for the MLCT emitters under study (cf. Fig. 10). For the MLCT emitters from the [Ir(dfppz)2(N^N)]+ family their |GS| values are distinctly larger than the |ES| ones that precludes solvent induced increase of the EES energies. The effect is rather small, according to the results from the DFT computations performed in the absence (EvacES) and in the presence (EsolvES) of the solvent, smaller than 0.1 eV. Due to comparable GS and ES values, still smaller differences in the computed EvacES and EsolvES energies are characteristic for the [Ir(ppz)2(N^N)]+ complexes. The same holds for the excited 3*[Ir(dfppz)2(N^N)]+ states with the LC character because in such cases the ES and GS dipole moments are also close one to another.
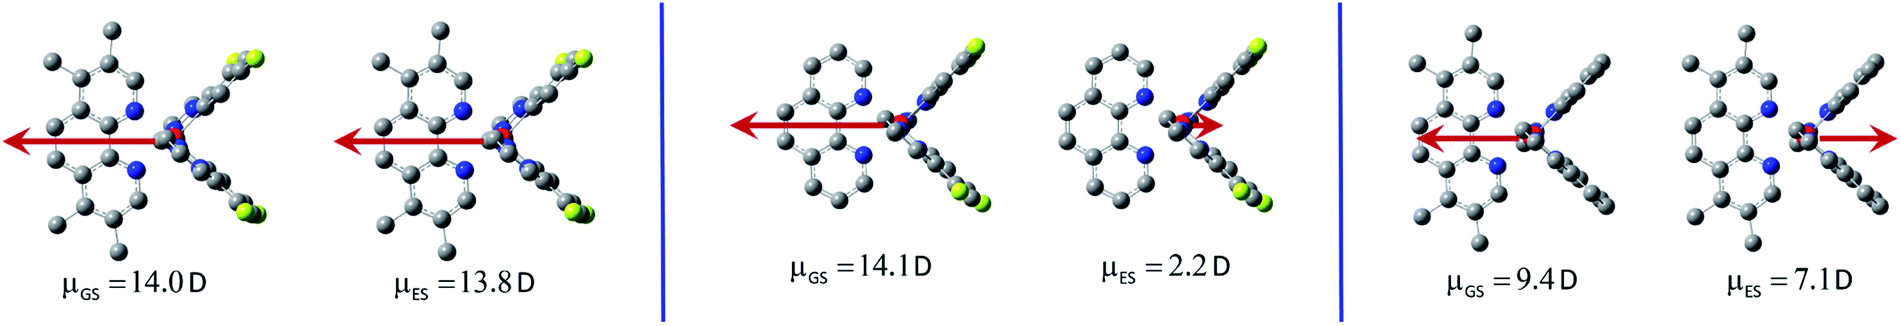 | ||
| Fig. 10 Directions and values of the ground state μGS and excited state μES dipole moments. Data for the [Ir(dfppz)2(tmphen)]+ (left) and [Ir(dfppz)2(phen)]+ (middle) and [Ir(ppz)2(tmphen)]+ (right) complexes at their optimized S0 and T1 geometries in acetonitrile solutions. | ||
Energetics of the S0 ← 3*[Ir(C^N)2(N^N)]+ transitions
In the view of results discussed above one can emphasize that the DFT outcomes reflect nicely the nature of the excited 3*[Ir(C^N)2(N^N)]+ species. Thus, one could expect similar agreement between other parameters describing their properties. Among them, the T1 energies and reorganization energies associated with the S0 ← T1 emissions are the most interesting ones because these quantities are computable and experimentally available as well. Experimental values of these quantities (collected in Table 2) can be accessed performing analyses of the S0 ← T1 emission bands. The applied fitting procedure assumes that only emission from the excited T1 state is responsible for the recorded emission spectra. This is justified in the view of the obtained TD-DFT and/or TDA-DFT results. Computations done for both, S0 and T1 geometries in acetonitrile solutions point to the energy gaps between the lowest excited T1 state and higher energetically lying triplets enough large to prevent any thermally activated emission from the triplet states other than the lowest T1 one. On the other hand, one can neglect any eventual contributions from the thermally activated emissions from low-lying singlet states due to their extremely low oscillator strengths. The reported values were estimated fitting the 298 K emission bands according to eqn (2) with the E00, λLM, λH, and hνH quantities varied as free fit parameters. Representative examples of the numerical fits (presented in Fig. 11 and 12) show that, although using only a one-mode approximation, one can adequately reproduce the experimental emission profiles. It should be noted, however, that the fitted quantities turn out to be somewhat correlated, leading to a numerical uncertainty (±0.02 eV) of their values. Because of the applied model approximations, however, the real uncertainty may be somewhat larger.| Complex | Emission band-shape analysis data | DFT data | |||||
|---|---|---|---|---|---|---|---|
| E00 | λLM | λH | hνH | EES | λin | λS | |
| [Ir(dfppz)2(tmphen)]+ | 2.62 | 0.07 | 0.25 | 0.17 | 2.71 | 0.41 | 0.01 |
| [Ir(dfppz)2(47dmphen)]+ | 2.60 | 0.09 | 0.26 | 0.17 | 2.73 | 0.41 | 0.01 |
| [Ir(dfppz)2(56dmphen)]+ | 2.53 | 0.11 | 0.24 | 0.17 | 2.59 | 0.48 | 0.01 |
| [Ir(dfppz)2(29dmphen)]+ | 2.62 | 0.13 | 0.26 | 0.17 | 2.76 | 0.40 | 0.03 |
| [Ir(dfppz)2(dpphen)]+ | 2.43 | 0.16 | 0.24 | 0.17 | 2.63 | 0.41 | 0.01 |
| [Ir(dfppz)2(phen)]+ | 2.41 | 0.39 | 0.17 | 0.21 | 2.78 | 0.26 | 0.26 |
| [Ir(dfppz)2(dtbbpy)]+ | 2.44 | 0.41 | 0.18 | 0.22 | 2.85 | 0.30 | 0.24 |
| [Ir(dfppz)2(bpy)]+ | 2.38 | 0.39 | 0.19 | 0.22 | 2.71 | 0.29 | 0.25 |
| [Ir(ppz)2(tmphen)]+ | 2.37 | 0.34 | 0.20 | 0.19 | 2.72 | 0.27 | 0.24 |
| [Ir(ppz)2(47dmphen)]+ | 2.31 | 0.29 | 0.25 | 0.16 | 2.65 | 0.27 | 0.26 |
| [Ir(ppz)2(56dmphen)]+ | 2.19 | 0.37 | 0.20 | 0.19 | 2.54 | 0.26 | 0.25 |
| [Ir(ppz)2(29dmphen)]+ | 2.37 | 0.27 | 0.21 | 0.19 | 2.64 | 0.26 | 0.18 |
| [Ir(ppz)2(dpphen)]+ | 2.15 | 0.34 | 0.21 | 0.16 | 2.47 | 0.25 | 0.24 |
| [Ir(ppz)2(phen)]+ | 2.19 | 0.34 | 0.22 | 0.16 | 2.52 | 0.26 | 0.26 |
| [Ir(ppz)2(dtbbpy)]+ | 2.26 | 0.30 | 0.27 | 0.16 | 2.59 | 0.30 | 0.25 |
| [Ir(ppz)2(bpy)]+ | 2.15 | 0.36 | 0.20 | 0.19 | 2.45 | 0.29 | 0.26 |
 | ||
| Fig. 11 Room temperature luminescence spectra of [Ir(dfppz)2(56dmphen)]+ (top) and [Ir(ppz)2(56dmphen)]+ (bottom) in acetonitrile solutions and the corresponding numerical fits (dashed lines). Dotted lines show contributions from the individual vibronic transitions. Vibronic transitions (0 → 0, 0 → 1, 0 → 2, etc.) have been taken into account applying the fitting procedure. Only five of them, however, can be seen in the presented Figures because of very low, marginal contribution from the vibronic transitions with j > 5. | ||
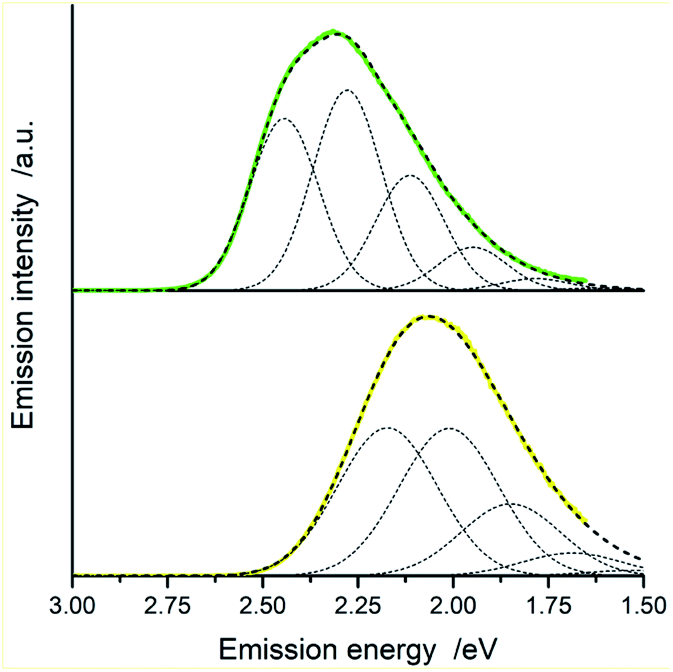 | ||
| Fig. 12 Room temperature luminescence spectra of [Ir(dfppz)2(dpphen)]+ (top) and [Ir(ppz)2(dpphen)]+ (bottom) in acetonitrile solutions and the corresponding numerical fits (dashed lines). Dotted lines show contributions from the individual vibronic transitions. Vibronic transitions (0 → 0, 0 → 1, 0 → 2, etc.) have been taken into account applying the fitting procedure. Only five of them, however, can be seen in the presented figures because of very low, marginal contribution from the vibronic transitions with j > 5. | ||
Despite all approximation of the model, one can draw some conclusions based on the obtained data. Taking into account different character of the LC and MLCT excitation one can straightforwardly explain the observed trends in the λLM values. Due to contributions of the solvent shell reorganization, the assessed λLM energies for the MLCT emitters are distinctly larger than found for the LC ones. Considering relatively small λLM values (0.07–0.16 eV) found for the LC emitters, one can ascribe them to the low- and medium-frequency intramolecular reorganization energies of the N^N ligand. This conclusion arises from negligibly small Δ values characterizing these emitters. In contrary to that, distinctly larger λLM values (0.29–0.39 eV) found for the MLCT emitters must contain intrinsic contributions from the solvent reorganization λS energies, reasonably connected with large Δ differences distinguishing these emitters. For the studied emitters the average quantum spacing, hνH = 0.17–0.22 eV corresponds quite well with the computed IR spectra showing the skeleton vibrations of the N^N and dfppz or ppz ligands in the 1200–1650 cm−1 region. Comparing the estimated λH values one can see the λH values characterizing the LC emitters somewhat larger (by ca. 0.05 eV) than those found for the MLCT emitters. Most probably the observed effect reflects differences in the N^N → 3*N^N electronic excitation and the simultaneous N^N → N^N− and C^N− → C^N charge-transfer (or charge-shift) processes, both of the latter are accompanying the MLCT excitation.
According to the E00 ≃ EES − λLM relationship, the excited 3*[Ir(C^N)2(N^N)]+ state energies are directly affordable from the respective E00 and λLM quantities. The resulted EES energies for the investigated LC emitters resemble the ELC characterizing the isolated N^N ligands. For the MLCT emitters, the resulted EES values depend also on the N^N ligand nature in an expected way. The presence of the electron donating (methyl or t-butyl) groups attached to parent N^N kernels increase the EES energies whereas the electron accepting phenyl substituents results in the opposite effect. Moreover, the EES values for the dfppz and ppz complexes with the same N^N ligand are larger for the former ones. Since energies of the LUMO orbitals (localized on the given N^N ligand) are expected to remain unaffected, one can attribute the observed EES shifts (ca. 0.3 eV) to lowering the LUMO energies, caused by the presence of two fluorine atoms in dfppz ligand. Such large shift turns energetic sequence of the 3*MLCT and 3LC states in most of the investigated [Ir(dfppz)2(N^N)]+ complexes resulting in their LC emissions observed already at 298 K.
Comparing the experimentally accessed EES energies with those obtained by means of DFT computation one can see good agreement (±0.06 eV) between both sets of the data (cf. Fig. 13). Taking into account uncertainties in the fitted E00 and λLM values, one can regard the found coincidence as more than satisfactory. In a similar way, the overall reorganization λ ≃ λLM + λH energies correspond well with the respective DFT λ = λin + λS outcomes. For most of the emitters under study, the experimental and theoretical λ values differ by less than 0.06 eV, only for the [Ir(dfppz)2(56dmphen)]+ chelate the observed difference (0.14 eV) is somewhat larger. The obtained consistency of the DFT computation results and band-shape analysis data allows concluding adequacy of eqn (2) in description of the emission profiles for both types of emitters. Although the applied formalism describes much better the MLCT bands, one can analyse the LC emissions in the same manner.
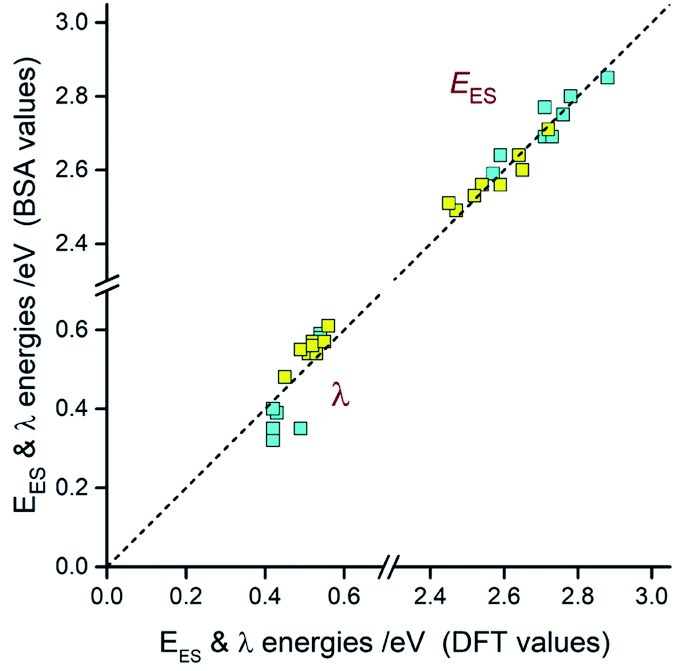 | ||
| Fig. 13 Relations between EES and λ energies resulted from the DFT computations and the emission band shape analyses (BSA). Data for [Ir(dfppz)2(N^N)]+ (blue symbols) and [Ir(ppz)2(N^N)]+ (yellow symbols) complexes in acetonitrile solutions at 298 K. | ||
Taking into account the found agreement between both sets of the EES and λ data one can assume that the DFT results correctly reproduce energetic quantities associated with the S0 ← 3*[Ir(C^N)2(N^N)]+ transitions. Thus, considering the DFT values of EES and λS energies, one can divide the investigated emitters into three classes as schematically illustrated in Fig. 14. The first one (class A), comprising emitters with the very small values of the ELC − EES energy gaps and λS ∼ 0, exhibits the LC localized emissions at 298 and 77 K. The emitters complying with the 0 < ELC − EES < λS condition (class B) should change its emission nature from MLCT (at 298 K) to LC (at 77 K). This is because the temperature lowering hinders the solvent shell relaxation that results in the excited state destabilization with the expected shift in the EES energy close to the λS value. When the ELC − EES > λS inequality holds for the given emitter (class C), one could expect the MLCT emission at both temperature regimes. This is because the excited state in not enough destabilized. Among the investigated complexes, all of them follow the proposed classifications. This fact confirms additionally correctness of the energetic parameters provided by DFT computations.
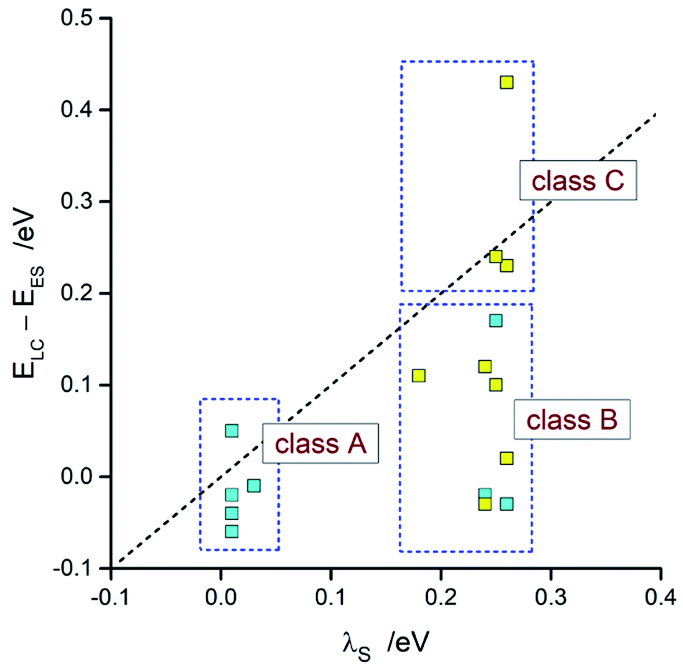 | ||
| Fig. 14 Comparison of the DFT values of λS with ELC − EES energies. Data for [Ir(dfppz)2(N^N)]+ (blue symbols) and [Ir(ppz)2(N^N)]+ (yellow symbols) complexes in acetonitrile solutions at 298 K. | ||
Taking into account accuracy of DFT outcomes one can apply them in another predictions as well. Since one can relate the emission maxima hcmaxem ≃ Eem − λin − λS to computable parameters, the expected position of emission band becomes easy affordable. To some extent, this allows appraising the emission colour but in very approximate way only. Any more adequate attempt requires additional information about the emission band shape, a factor determining the real emission colour. Nominally, one can predict the band shape using eqn (2) but such approach requires separation of the computed λin energies into individual λH and λL + λM components. Unfortunately, this is only hardly possible without any arbitrary assumptions or much more advanced DFT computations.
In the case of studied LC emitters, the experimental λLM values point to the λL + λM terms in the range 0.07–0.16 eV. Situation is still more complicated in the case of the MLCT emitters. Tentatively one can extract respective λL + λM values comparing the DFT values of λin and λS terms with the fitted λH and λLM quantities according to following relationships
| λL + λM ≃ λin − λH | (6) |
| λL + λM ≃ λLM − λS | (7) |
Principally, both attempts should give the same values but the applied equations result in different sets of the λL + λM quantities with divergences up to 0.06 eV. Moreover, the obtained values exhibit counterintuitive scattering over the 0.03–0.17 eV range. One should note, however, that any more acceptable coincidence would be possible only when errors in the parameters going into calculations are small, distinctly smaller as compared to the λL + λM values. Most probably, this is not a case. Taking into account the found discrepancies (±0.06 eV) between two sets of EES and λ data, one can expect similar errors in the λL + λM estimates. Since their accurate values are not accessible, an averaged λL + λM term 0.10 eV (with 0.07 eV accuracy) remains only possible option for further considerations. Then, using available DFT data, one can approximate the quantities (values in eV) necessary to simulate the emission band E00 ≃ EES − λS − 0.1, λLM = λS + 0.1, and λH = λin − 0.1. For the further simplification of simulation procedure one can also assume an averaged hνH = 0.19 eV value as enough adequate. Due to larger uncertainties in other parameters going into simulation, this seems to be justified.
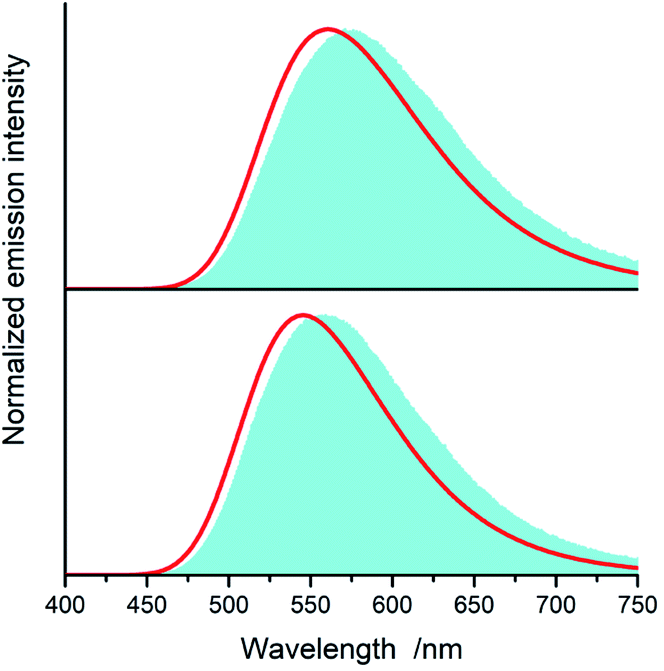
Fig. 15 and 16 show some results from performed simulations. The presented examples show results for these complexes where the λL + λM terms, estimated with use of eqn (6) and (7), deviate largely from assumed 0.1 eV value. Considering intrinsic overlap of the simulated and recorded emission spectra, one can consider agreement between them as satisfactory in the most cases. Quite small deviations results in nice agreement between the XCIE and YCIE chromaticity values characterizing the experimental and simulated emissions. Particularly for the MLCT emitters, the differences in the XCIE and YCIE as small as 0.02–0.03 allow quite precise predictions of their emission colours (cf. Fig. 17). In the case of the LC emitters, the XCIE and YCIE discrepancies (0.05–0.07) are somewhat larger but still acceptable, at least for semi-quantitative predictions. In the worst case, however, the predicted XCIE and YCIE values allow only crude speculation about the real colour of the S0 ← 3*[Ir(dfppz)2(56dmphen)]+ emission. In this particular case, the observed incompatibility arises from too large λH value applied in the simulation. Using the DFT data and λH = λin − 0.1 relationship one obtains relatively large λH value of 0.38 eV, distinctly larger than 0.24 eV obtained by means of the emission shape analysis. The DFT λin value of 0.48 eV is distinctly larger than 0.40–0.41 eV obtained for other studied LC emitter. Thus, the DFT computation errors are very likely responsible for the occurring inconsistency. Nevertheless, the proposed approach results in the predictions of the XCIE and YCIE chromaticity coordinates with accuracy similar to that obtained by much more advanced DFT computing.96–100
 | ||
| Fig. 15 Experimental (blue shapes) and simulated (red lines) emission spectra of [Ir(dfppz)2(56dmphen)]+ (bottom) and [Ir(dfppz)2(tmphen)]+ (top) complexes. Experimental and predicted (data in parentheses) values of the XCIE and YCIE coordinates are 0.26 and 0.52 (0.37 and 0.54) for [Ir(dfppz)2(56dmphen)]+ and 0.20 and 0.42 (0.27 and 0.46) for [Ir(dfppz)2(tmphen)]+. Data for acetonitrile solutions at 298 K. | ||
 | ||
| Fig. 16 Experimental (blue shapes) and simulated (red lines) emission spectra of [Ir(ppz)2(47dmphen)]+ (bottom) and [Ir(ppz)2(dtbbpy)]+ (top) complexes. Experimental and predicted (data in parentheses) values of the XCIE and YCIE coordinates are 0.43 and 0.53 (0.40 and 0.55) for [Ir(ppz)2(47dmphen)]+ and 0.48 and 0.51 (0.45 and 0.53) for [Ir(ppz)2(dtbbpy)]+. Data for acetonitrile solutions at 298 K. | ||
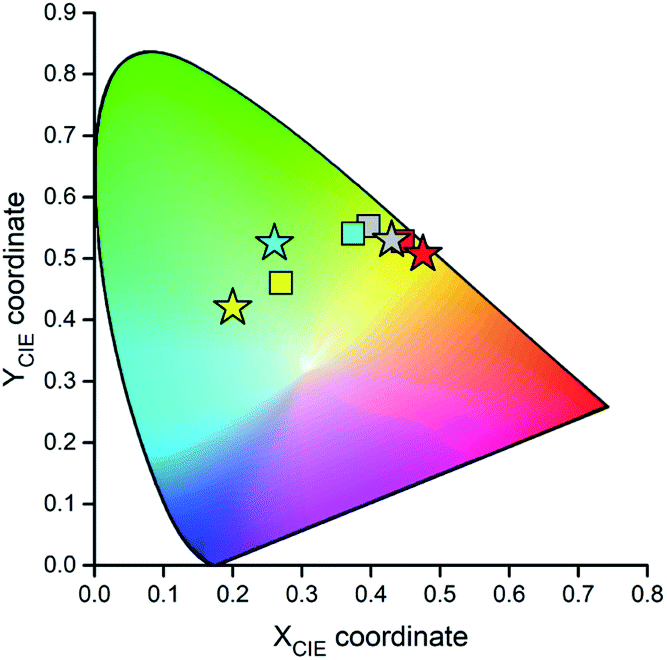 | ||
| Fig. 17 Relation between the experimental (stars) and predicted (squares) XCIE and YCIE chromaticity values for the [Ir(dfppz)2(tmphen)]+ (yellow symbols), [Ir(dfppz)2(56dmphen)]+ (cyan symbols), [Ir(ppz)2(47dmphen)]+ (grey symbols), and [Ir(ppz)2(dtbbpy)]+ (red symbols) complexes. Data for acetonitrile solutions at 298 K. | ||
Kinetics of the S0 ← 3*[Ir(C^N)2(N^N)]+ transitions
Experimentally available ϕem and τem data allow simple assessing of the radiative kr and non-radiative knr rate constants governing the S0 ← T1 emissions. Following close analogy between the radiative and non-radiative transitions in the inverted Marcus region, one can use eqn (4) for calculation of the knr values. Nearly all necessary quantities are derivable from the band-shape analysis of the emission spectra whereas the reaming one, an “effective” V value, is affordable from eqn (1). Approximating the energy gap between the states involved in the S0 ← T1 transitions as ΔE = hcmaxem, one can estimate the V terms using the Mem derived from the experimental kr = ϕem/τem values according to eqn (5). Principally, the applied formalism is valid only for “pure” (or nearly “pure”) charge-transfer emissions, but one can use eqn (5) for the LC emitters if the MLCT admixture (cMLCT) to their wave functions is sufficiently large. Most likely, however, this is not a case of the LC emitters under study where the spin redistributions in their T1 states point to negligibly small (or not enough large) cMLCT coefficients. Despite that, to check the limit of eqn (5) applicability, all complexes under study were analysed in the same way.
The respective calculations, done with an averaged Δμ = 15 D, led to the V values and resulting knr rate constants collected in Table 3. The observed discrepancies are for the MLCT emitters smaller than one order of magnitude (cf. Fig. 18). Thus, taking into account the number parameters going into eqn (4) and their ca. 0.02–0.03 eV uncertainties, one can regard the obtained agreement as more than satisfactory. For the LC emitters, however, one can see the significant discrepancies (as large as several orders of magnitude) between the calculated and experimentally found knr = (1 − ϕem)/τem values. Similar deviations, observed for the previously reported [Re(CO)3(triphenylphosphine)(N^N)]+ complexes,62 suggest this as a more general rule. Among many possible explanations of such behaviour, the presence of an additional channel contributing to the non-radiative transitions may be a plausible option.101–104 Then the experimental knr values contain additional terms, not accounted in the performed calculations. More likely, however, the ordinary and ungrounded extrapolation of the eqn (5) for description of the LC emitters fail in their description. Perhaps an appropriate extension of eqn (5), with correctly introduced contribution of the MLCT character to the wave function of these emitters, will result in any more correct prediction of their non-radiative rate constants. At the present stage of investigations, however, this remains only very promising possibility requiring further systematic studies of any other complex series exhibiting changes in their emissive states nature in a way similar to that found for the [Ir(dfppz)2(N^N)]+ chelates.
| Complex | Experiment | DFT prediction | |||||
|---|---|---|---|---|---|---|---|
| kr/s−1 | Mem/D | V/eV | knr/s−1 (exp.) | knr/s−1 (calc.) | knr/kr | ϕem | |
| [Ir(dfppz)2(tmphen)]+ | 6.3 × 10³ | 0.033 | 0.005 | 5.2 × 10³ | 4.8 × 101 | ||
| [Ir(dfppz)2(47dmphen)]+ | 2.1 × 10⁴ | 0.060 | 0.010 | 6.9 × 10³ | 4.5 × 10² | ||
| [Ir(dfppz)2(56dmphen)]+ | 6.5 × 10³ | 0.035 | 0.006 | 3.7 × 10³ | 1.5 × 10² | ||
| [Ir(dfppz)2(29dmphen)]+ | 5.2 × 10⁴ | 0.094 | 0.015 | 4.8 × 10⁴ | 8.8 × 10² | ||
| [Ir(dfppz)2(dpphen)]+ | 3.6 × 10⁴ | 0.085 | 0.013 | 1.4 × 10⁴ | 1.1 × 10³ | ||
| [Ir(dfppz)2(phen)]+ | 2.7 × 10⁵ | 0.22 | 0.036 | 1.2 × 10⁵ | 8.6 × 10⁴ | 0.08 | 0.93 |
| [Ir(dfppz)2(dtbbpy)]+ | 6.7 × 10⁵ | 0.35 | 0.056 | 1.7 × 10⁵ | 5.5 × 10⁵ | 0.15 | 0.87 |
| [Ir(dfppz)2(bpy)]+ | 6.1 × 10⁵ | 0.34 | 0.054 | 3.0 × 10⁵ | 1.6 × 10⁶ | 1.24 | 0.45 |
| [Ir(ppz)2(tmphen)]+ | 2.1 × 10⁵ | 0.21 | 0.032 | 5.5 × 10⁴ | 9.3 × 10⁴ | 0.25 | 0.80 |
| [Ir(ppz)2(47dmphen)]+ | 4.5 × 10⁵ | 0.28 | 0.046 | 3.2 × 10⁵ | 2.4 × 10⁵ | 0.71 | 0.58 |
| [Ir(ppz)2(56dmphen)]+ | 4.7 × 10⁵ | 0.35 | 0.049 | 6.3 × 10⁵ | 2.3 × 10⁶ | 1.2 | 0.45 |
| [Ir(ppz)2(29dmphen)]+ | 2.7 × 10⁵ | 0.24 | 0.037 | 1.5 × 10⁵ | 1.5 × 10⁵ | 0.38 | 0.73 |
| [Ir(ppz)2(dpphen)]+ | 4.6 × 10⁵ | 0.37 | 0.051 | 5.9 × 10⁵ | 4.9 × 10⁵ | 1.1 | 0.49 |
| [Ir(ppz)2(phen)]+ | 4.7 × 10⁵ | 0.36 | 0.050 | 8.1 × 10⁵ | 4.4 × 10⁵ | 2.0 | 0.33 |
| [Ir(ppz)2(dtbbpy)]+ | 5.6 × 10⁵ | 0.38 | 0.050 | 1.1 × 10⁶ | 1.4 × 10⁶ | 5.2 | 0.16 |
| [Ir(ppz)2(bpy)]+ | 5.1 × 10⁵ | 0.39 | 0.053 | 2.3 × 10⁶ | 3.2 × 10⁶ | 23.7 | 0.04 |
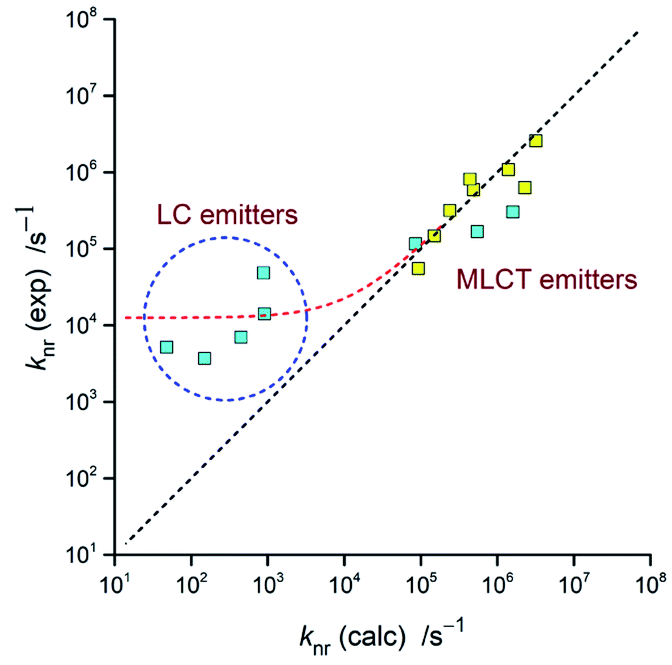 | ||
| Fig. 18 Relation between the calculated and experimental knr rate constants for the investigated [Ir(dfppz)2(N^N)]+ (blue symbols) and [Ir(ppz)2(N^N)]+ (yellow symbols) complexes. Data for acetonitrile solutions at 298 K. | ||
Concerning adequacy of the DFT results in prediction of the emission band-shapes, one can expect applicability of the DFT data in prediction of the knr rate constants as well. Respective calculations, done with the estimated V values and with the same parameters as applied in the simulations of the emission bands, led to values very close to the experimental ones. Thus, the applied approach should allow prediction of the emission quantum yields at least for the MLCT emitters. As already mentioned in the Introduction this is even possible without detailed knowledge of the Mem and V quantities. Combining eqn (4) and (5) one can obtain following expression
 | (8) |
Since the Mem and V quantities are, according to eqn (1), connected one to another, their V/Mem ratio may be accessed as follows
|
V/Mem = hcmaxem/Δμ = (EES − λin − λS)/Δμ
| (9) |
Thus, all parameters going into eqn (7) are available from DFT computations. Respective calculations, done for the investigated MLCT emitters with the Δμ values provided by DFT computations, lead to the results summarized in Table 3. As one can show in Fig. 19, the predicted ϕem values nicely follow the experimental trend. Calculations performed with an averaged Δμ value (15 D) gave similar coincidence. Although the observed agreement could be somewhat better, any further improvement may be rather difficult due to limited accuracy of the applied approach. Nevertheless, taking into account the model simplicity and low computing costs, one can emphasise its potential utility in the design of novel MLCT luminophores. As usually, however, this promising opportunity needs further testing.
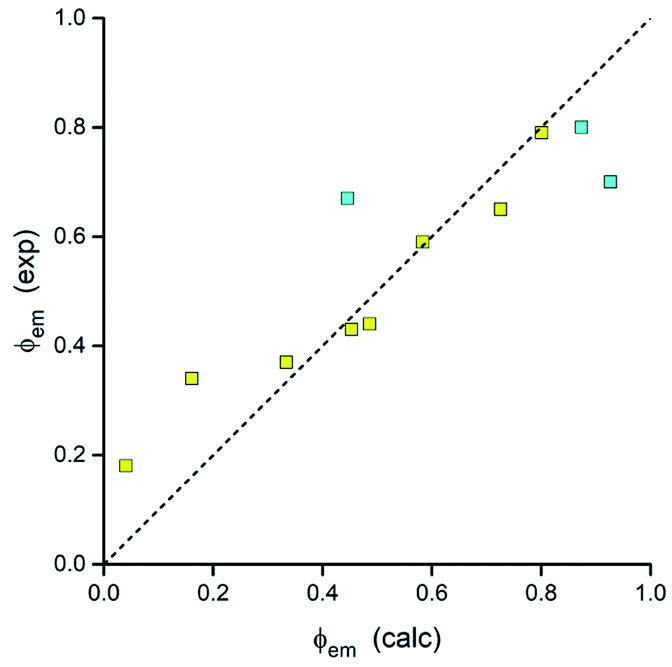 | ||
| Fig. 19 Relation between the DFT predicted and experimental values of the emission quantum yields ϕem for the investigated [Ir(dfppz)2(N^N)]+ (blue symbols) and [Ir(ppz)2(N^N)]+ (yellow symbols) complexes. Data for acetonitrile solutions at 298 K. | ||
Conclusions
Depending on the cyclometalated C^N and ancillary α-diimine N^N ligands as well as on the measurement temperature, the investigated [Ir(C^N)2(N^N)]+ complexes display different nature of their lowest excited triplet state. The observed S0 ← 3*[Ir(C^N)2(N^N)]+ emission can be either attributed to the intra-ligand LC or the metal-to-ligand charger transfer MLCT character of the excited 3*[Ir(C^N)2(N^N)]+ species. Whereas the LC excitations are localized on the N^N ligands, the MLCT ones involve charge-transfer from the HOMO orbital to the LUMO orbital localized on the Ir(C^N)2+ core and the N^N ligand, respectively. Different nature of the excited 3*[Ir(C^N)2(N^N)]+ states, deduced from the experimentally observed changes in their emission parameters, was further confirmed by means of DFT computations. The computed spin redistribution in the lowest excited triplet states confirms the LC or MLCT nature of the excited species. In a similar way, the computed differences in the dipole moments associated with the S0 → T1 excitations reflect nicely their LC or MLCT character. For many of the studied complexes, the temperature lowering from 298 to 77 K results in changes of their emission from MLCT to LC. Taking into account the DFT results one can also rationalize this finding.Results from the performed DFT computations allow also characterizing the emissive T1 states in considerably quantitative way. The computed energies of the excited 3*[Ir(C^N)2(N^N)]+ states as well as the reorganization energies associated with their S0 ← 3*[Ir(C^N)2(N^N)]+ transitions remain in a quite satisfactory agreement with those obtained analysing the emission band shapes. Well congruent results obtained from both applied approaches shown that the data from band shape analyses are applicable in testing the DFT results, and vice versa. The observed agreement allows concluding applicability of the DFT outcomes in the quantitative simulation of the emission band shapes. Consequently, the emission colours are predictable in an acceptable accuracy as well.
According to close analogy with the radiative and non-radiative transitions in the inverted Marcus region, one can quantitatively interpret the experimentally determined knr rate constants of the non-radiative deactivations of the excited 3*MLCT species. Using results from the performed band shape analyses of the S0 ← 3*MLCT emissions, one can obtain knr values remaining in nice agreement with those found experimentally. Due to the found consistency of the band-shape analysis results with those provided by performed DFT computations, the latter are applicable in the prediction of the Franck–Condon factors governing the knr values. With the knowledge of these factors, one can estimate the knr/kr ratios. This is possible because close relationship between the radiative knr and non-radiative knr rate constants allows prediction their knr/kr ratio using only parameters available from the performed DFT computations. Since the knr/kr terms govern the emission quantum yields, their values are easy affordable. The predicted ϕem values agree nicely with the experimentally observed trend.
Results presented in this work show that ordinary DFT computations, even performed without taking into account the spin–orbit coupling caused by presence of the heavy metal, allow interpreting and predicting the most important parameters connected with the S0 ← 3*[Ir(C^N)2(N^N)]+ emissions when the given emission exhibits distinct MLCT character. Thus, the approach presented in this work seems to be useful in the design of new organometallic MLCT emitters. This promising opportunity needs, however, further testing on already known systems.
To some extent, the approach discussed in this work is also applicable in the case of the LC emitters. Nearly all parameters characterizing their emissions are affordable from the performed DFT computations. Intrinsic deviations between calculated and experimental knr values are, however, typical for these emitters. The observed discrepancies, as high as several order of magnitude, make any quantitative prediction of their ϕem values only hardly possible. On the other hand, the occurring issue may be potentially solvable through further systematic studies of any other complex series containing both, MLCT and LC types emitters. In both cases, more or less pronounced contributions from the “pure” MLCT configuration to their wave functions is most likely responsible for their emissive properties. Thus, the emissive properties of the LC emitters might be also accessible with improved accuracy if the role of the MLCT contribution will be quantitatively determined.
Experimental and computational details
Materials and instrumentation
Both series of the investigated [Ir(dfppz)2(N^N)]+ and [Ir(ppz)2(N^N)]+ complexes have been synthesized in the form of PF6− salts according to literature procedures.82–89 The obtained reaction products were further purified by means of column chromatography on (silica gel with CH2Cl2 as the eluent, changing next to acetone:CH2Cl2 1:30 or 1:10 v/v). The recorded 1H and 31P NMR spectra, acquired for CD3CN solutions using VARIAN 400-MR spectrometer, confirmed without any doubts the chemical nature of all synthesized complexes. The comparative analysis of the 1H NMR spectra of the [Ir(ppz)2(N^N)]+ or [Ir(dfppz)2(N^N)]+ cations with those for the corresponding [(ppz)2Ir-μ-Cl]2 or [(dfppz)2Ir-μ-Cl]2 dimers enabled the precise assignment of all 1H NMR signals observed.89
UV-Vis absorption, corrected steady-state luminescence spectra and emission decays were recorded with a Shimadzu UV-3100 spectrophotometer, a Gilden Photonics FluoroSense, and a FluoroSense-P fluorimeters, respectively. As a quantum yield standard, a solution of quinine sulphate in 0.1 N H2SO4 (ϕem = 0.51)105 was used. The emission decay curves were analysed using the reference convolution based on the Marquardt algorithm.106 Emission spectra were fitted by means of a least-square method using OriginPro 2016 software (Origin Lab Corp.) with user-defined functions.
All spectroscopic measurements were performed using the spectral grade solvents (Sigma-Aldrich). In the case of emission studies at 298 K, the investigated CH3CN solutions, placed in fluorimeter quartz cuvettes (1 × 1 cm), were carefully deaerated by bubbling with preliminary purified and dried argon. For the 77 K measurements the samples were put in quartz tubes (3 mm diameter) and inserted into a special quartz Dewar flask filled with liquid nitrogen.
DFT computations
DFT computation done within this work were performed using the Gaussian 09 software supported by the GaussView 5.0.107 The calculations on the electronic ground and lowest excited triplet states of the investigated complexes were carried out by using B3LYP108,109 functional at the spin-restricted and spin-unrestricted B3LYP level with a spin multiplicity of 1 and 3, respectively. A “double-ζ” basis set consisting of the Hay and Wadt effective core potentials (LANL2DZ)110 and 6-31G(d,p)111,112 basis set were employed for the iridium and light atoms, respectively. Gas-phase geometries were accounted, states without imposing any symmetry restriction, by a full optimization for each stationary structure in the ground S0 and the lowest triplet T1 electronic. These geometries were further used for optimization performed in CH3CN solutions with accounting the solvation effects by means of the polarizable continuum solvation model (PCM).113 Calculation of the vertical electronic transitions have been performed at the optimized S0 and T1 geometries using the time-dependent generalization of the density functional theory114,115 with the solvent effect introduced by means of the polarizable continuum solvation model.Author contributions
A. K. and A. K. contributed equally to this study.Conflicts of interest
There are no conflicts to declare.Acknowledgements
We gratefully acknowledge the Siedlce University of Natural Sciences and Humanities for financial support this work as a part of the research project no. 24/20/B.Notes and references
- Photochemistry and Photophysics of Coordination Compounds I, ed. S. Balzani and V. Campagna, Springer-Verlag, Berlin Heidelberg, 2007 Search PubMed.
- Photochemistry and Photophysics of Coordination Compounds II, ed. S. Balzani and V. Campagna, Springer-Verlag, Berlin Heidelberg, 2007 Search PubMed.
- Photofunctional Transition Metal Complexes, ed. V. W.-W. Yam, Springer-Verlag, Berlin Heidelberg, 2007 Search PubMed.
- V. W.-W. Yam and K. M.-C. Wong, Chem. Commun., 2011, 47, 11579 RSC.
- Y. Y. Chia and M. G. Tay, Dalton Trans., 2014, 43, 13159 RSC.
- Q. Zhao, F. Li and C. Huang, Chem. Soc. Rev., 2010, 39, 3007 RSC.
- K. K.-W. Lo, Acc. Chem. Res., 2015, 48, 2985 CrossRef CAS PubMed.
- V. Fernandez-Moreira, F. L. Thorp-Greenwood and M. P. Coogan, Chem. Commun., 2010, 46, 186 RSC.
- M. Strianese and C. Pellecchia, Coord. Chem. Rev., 2016, 318, 16 CrossRef CAS.
- K. K.-W. Lo, A. W.-T. Choi and W. H.-T. Law, Dalton Trans., 2012, 41, 6021 RSC.
- D. -L. Ma, H. -Z. He, K. -H. Leung, D. S. -H. Chan and C. -H. Leung, Angew. Chem., Int. Ed., 2013, 52, 7666 CrossRef CAS PubMed.
- C. A. Bignozzi, R. Argazzi, R. Boaretto, E. Busatto, S. Carli, F. Ronconia and S. Caramori, Coord. Chem. Rev., 2013, 257, 1472 CrossRef CAS.
- B. Basheera, D. Mathew, B. K. George and C. P. Reghunadhan Nairb, Sol. Energy, 2014, 108, 479 CrossRef.
- A. S. Polo, M. Kayoko Itokazu and N. Y. Murakami Iha, Coord. Chem. Rev., 2004, 248, 1343 CrossRef CAS.
- A. Hagfeldt, G. Boschloo, L. Sun, L. Kloo and H. Pettersson, Chem. Rev., 2010, 110, 6595 CrossRef CAS PubMed.
- H. Yersin, A. F. Rausch, R. Czerwieniec, T. Hofbeck and T. Fischer, Coord. Chem. Rev., 2011, 255, 2622 CrossRef CAS.
- C. Bizzarri, E. Spuling, D. M. Knoll, D. Volz and S. Bräse, Coord. Chem. Rev., 2018, 373, 49 CrossRef CAS.
- C. Bizzarri, F. Hundemer, J. Busch and S. Bräse, Polyhedron, 2018, 140, 51 CrossRef CAS.
- Q.-C. Zhang, H. Xiao, X. Zhang, L.-J. Xu and Z.-N. Chen, Coord. Chem. Rev., 2019, 378, 121 CrossRef CAS.
- H. Xu, R. Chen, Q. Sun, W. Lai, Q. Su, W. Huang and X. Liu, Chem. Soc. Rev., 2014, 43, 3259 RSC.
- I. N. Mills, J. A. Porras and S. Bernhard, Acc. Chem. Res., 2018, 51, 352 CrossRef CAS PubMed.
- J. Twilton, C. Le, P. Zhang, M. H. Shaw, R. W. Evans and D. W. C. MacMillan, Nat. Rev. Chem., 2017, 1, 0052 CrossRef CAS.
- A. J. Morris, G. J. Meyer and E. Fujita, Acc. Chem. Res., 2009, 42, 1983 CrossRef CAS PubMed.
- H. Takeda and O. Ishitani, Coord. Chem. Rev., 2010, 254, 346 CrossRef CAS.
- C. K. Prier, D. A. Rankic and D. W. C. MacMillan, Chem. Rev., 2013, 113, 5322 CrossRef CAS PubMed.
- J. M. R. Narayanam and C. R. J. Stephenson, Chem. Soc. Rev., 2011, 40, 102 RSC.
- C. D. Windle and R. N. Perutz, Coord. Chem. Rev., 2012, 256, 2562 CrossRef CAS.
- T. A. Niehaus, T. Hofbeck and H. Yersin, RSC Adv., 2015, 5, 63318 RSC.
- C. J. Cramer and D. G. Truhlar, Phys. Chem. Chem. Phys., 2009, 11, 10757 RSC.
- M. Bühl and H. Kabrede, J. Chem. Theory Comput., 2006, 2, 1282 CrossRef PubMed.
- C. Garino and L. Salassa, Philos. Trans. R. Soc., A, 2013, 371, 20120134 CrossRef PubMed.
- D. Escudero and D. Jacquemin, Dalton Trans., 2015, 44, 8346 RSC.
- I. Tamm, J. Phys., 1945, 9, 449 Search PubMed.
- S. M. Dancoff, Phys. Rev., 1950, 78, 382 CrossRef.
- D. J. Rowe, Rev. Mod. Phys., 1968, 40, 153 CrossRef.
- S. Hirata and M. Head-Gordon, Chem. Phys. Lett., 1999, 314, 291 CrossRef CAS.
- A. Kadari, A. Moncomble, I. Ciofini, M. Brahimi and C. Adamo, J. Phys. Chem. A, 2011, 115, 11861 CrossRef CAS PubMed.
- A. Charaf-Eddin, A. Planchat, B. Mennucci, C. Adamo and D. Jacquemin, J. Chem. Theory Comput., 2013, 9, 2749 CrossRef CAS PubMed.
- R. L. Lord, M. M. Allard, R. A. Thomas, O. S. Odongo, B. Schlegel, Y.-J. Chen and J. F. Endicott, Inorg. Chem., 2013, 52, 1185 CrossRef CAS PubMed.
- K. Mori, T. P. M. Goumans, E. van Lenthe and F. Wang, Phys. Chem. Chem. Phys., 2014, 16, 14523 RSC.
- T. J. Penfold, E. Gindensperger, C. Daniel and C. M. Marian, Chem. Rev., 2018, 118, 6975 CrossRef CAS PubMed.
- G. Baryshnikov, B. Minaev and H. Ågren, Chem. Rev., 2017, 117, 6500 CrossRef CAS PubMed.
- B. J. Powell, Coord. Chem. Rev., 2015, 295, 46 CrossRef CAS.
- M. Babazadeh, P. L. Burn and D. M. Huang, Phys. Chem. Chem. Phys., 2019, 21, 9740 RSC.
- R. A. Marcus, J. Chem. Phys., 1956, 24, 1261 Search PubMed.
- R. A. Marcus, Annu. Rev. Phys. Chem., 1964, 15, 155 CrossRef CAS.
- R. A. Marcus and N. Sutin, Biochim. Biophys. Acta, 1985, 811, 265 CrossRef CAS.
- R. S. Mulliken, J. Am. Chem. Soc., 1952, 74, 811 CrossRef CAS.
- R. S. Mulliken, J. Phys. Chem., 1952, 56, 801 CrossRef CAS.
- N. S. Hush, Prog. Inorg. Chem., 1967, 8, 391 CAS.
- N. S. Hush, Electrochim. Acta, 1968, 13, 1005 CrossRef CAS.
- I. R. Gould, D. Ege, S. L. Mattes and S. Farid, J. Am. Chem. Soc., 1987, 109, 3794 CrossRef CAS.
- I. R. Gould, R. Moody and S. Farid, J. Am. Chem. Soc., 1988, 110, 7242 CrossRef CAS.
- I. R. Gould, R. H. Young, L. J. Mueller, A. C. Albrecht and S. Farid, J. Am. Chem. Soc., 1994, 116, 8188 CrossRef CAS.
- A. Kapturkiewicz, J. Herbich, J. Karpiuk and J. Nowacki, J. Phys. Chem. A, 1997, 101, 2332 CrossRef CAS.
- P. Borowicz, J. Herbich, A. Kapturkiewicz, M. Opallo and J. Nowacki, Chem. Phys., 1999, 249, 49 CrossRef CAS.
- A. Kapturkiewicz and J. Nowacki, J. Phys. Chem. A, 1999, 103, 8145 CrossRef CAS.
- A. Kamecka and A. Kapturkiewicz, Phys. Chem. Chem. Phys., 2015, 17, 23332 RSC.
- A. Woźna and A. Kapturkiewicz, Phys. Chem. Chem. Phys., 2015, 17, 30468 RSC.
- A. Kamecka, K. Suwińska and A. Kapturkiewicz, Phys. Chem. Chem. Phys., 2016, 17, 28982 RSC.
- A. Kamecka, K. Prachnio and A. Kapturkiewicz, J. Lumin., 2018, 203, 409 CrossRef CAS.
- A. Kapturkiewicz, A. Kamecka and O. Grochowska, RSC Adv., 2020, 10, 29462 RSC.
- A. Ito and T. J. Meyer, Phys. Chem. Chem. Phys., 2012, 14, 13731 RSC.
- B. S. Brunschwig, S. Ehrenson and N. Sutin, J. Phys. Chem., 1987, 91, 4714 CrossRef CAS.
- R. A. Marcus, J. Phys. Chem., 1989, 93, 3078 CrossRef CAS.
- J. T. Hupp, G. A. Neyhart, T. J. Meyer and E. M. Kober, J. Phys. Chem., 1992, 96, 10820 CrossRef CAS.
- M. D. Newton, Coord. Chem. Rev., 2003, 238–239, 167 CrossRef CAS.
- J. Cortes, H. Heitele and J. Jortner, J. Phys. Chem., 1994, 98, 2527 CrossRef CAS.
- M. Kozik, N. Sutin and J. R. Winkler, Coord. Chem. Rev., 1990, 97, 23 CrossRef CAS.
- S. Efrima and M. Bixon, Chem. Phys. Lett., 1974, 25, 34 CrossRef CAS.
- S. Efrima and M. Bixon, Chem. Phys., 1976, 13, 447 CrossRef CAS.
- J. Jortner, J. Chem. Phys., 1976, 64, 4860 CrossRef CAS.
- M. Bixon and J. Jortner, J. Phys. Chem., 1991, 95, 1941 CrossRef CAS.
- I. M. Dixon, J. P. Collin, J.-P. Sauvage, L. Flamigni, S. Encinas and F. Barigeletti, Chem. Soc. Rev., 2000, 29, 385 RSC.
- M. S. Lowry and S. Bernhard, Chem.–Eur. J., 2006, 12, 7970 CrossRef CAS PubMed.
- C. Ulbricht, B. Beyer, C. Friebe, A. Winter and U. S. Schubert, Adv. Mater., 2009, 21, 4418 CrossRef CAS.
- Y. You and W. Nam, Chem. Soc. Rev., 2012, 41, 7061 RSC.
- K. P. S. Zanoni, R. L. Coppo, R. C. Amaral and N. Y. Murakami Iha, Dalton Trans., 2015, 44, 14559 RSC.
- F. Monti, A. Baschieri, L. Sambri and N. Armaroli, Acc. Chem. Res., 2021, 54, 1492 CrossRef CAS PubMed.
- M. Nonoyama, Bull. Chem. Soc. Jpn., 1974, 47, 767 CrossRef CAS.
- M. Nonoyama, J. Organomet. Chem., 1975, 86, 263 CrossRef CAS.
- A. B. Tamayo, S. Garon, T. Sajoto, P. I. Djurovich, I. M. Tsyba, R. Bau and M. E. Thompson, Inorg. Chem., 2005, 44, 8723 CrossRef CAS PubMed.
- C. D. Sunesh, S. Ok, G. Mathai and Y. Choe, Thin Solid Films, 2013, 531, 530 CrossRef CAS.
- C. D. Sunesh, M. Chandran, G. Mathai and Y. Choe, Opt. Mater., 2013, 35, 407 CrossRef CAS.
- A. J. Howarth, M. B. Majewski, C. M. Brown, F. Lelj, M. O. Wolf and B. O. Patrick, Dalton Trans., 2015, 44, 16272 RSC.
- S. DiLuzio, V. Mdluli, T. U. Connell, J. Lewis, V. VanBenschoten and S. Bernhard, J. Am. Chem. Soc., 2021, 143, 1179 CrossRef CAS PubMed.
- E. Baranoff, H. J. Bolink, E. C. Constable, M. Delgado, D. Häussinger, C. E. Housecroft, M. K. Nazeeruddin, M. Neuburger, E. Ortí, G. E. Schneider, D. Tordera, R. M. Wallisere and J. A. Zampesee, Dalton Trans., 2013, 42, 1073 RSC.
- K. Wongkhan, U. Mahanitipong, M. Srikaew, Y. Tantirunggrotchai, S. Sahasithiwat and R. Jitchati, Acta Phys. Pol., 2015, 127, 1109 CrossRef CAS.
- A. Kamecka, A. Kapturkiewicz and Ł. Pipczyński, Inorg. Chem. Commun., 2021, 131, 108764 CrossRef CAS.
- M. Senoue, T. Iwaki, K. Seki and M. Yagi, J. Photochem. Photobiol., A, 1996, 101, 257 CrossRef CAS.
- M. A. A. Rashid, B. Saad, E.-S. M. Negim and M. I. Saleh, World Appl. Sci. J., 2012, 17, 958 Search PubMed.
- J. Higuchi, K. Suzuki, H. Arai, A. Saitoh and M. Yagi, J. Phys. Chem., 1986, 90, 1270 CrossRef CAS.
- P. Chen and T. J. Meyer, Inorg. Chem., 1996, 35, 5520 CrossRef CAS PubMed.
- R. A. Marcus, J. Phys. Chem., 1990, 94, 4963 CrossRef CAS.
- A. J. Lees, Comments Inorg. Chem., 1995, 17, 319 CrossRef CAS.
- R. Schira and C. Latouche, Dalton Trans., 2021, 50, 746 RSC.
- F. Vazart, C. Latouche, J. Bloino and V. Barone, Inorg. Chem., 2015, 54, 5588 CrossRef CAS PubMed.
- J. Guo, X. Pan, J. Li, W. Wu and J. Zhang, Spectrochim. Acta, Part A, 2019, 216, 179 CrossRef CAS PubMed.
- J. Guo, X. Pan, X. Wang, W. Wu and J. Zhang, Org. Electron., 2018, 61, 125 CrossRef CAS.
- A. Stoliaroff, J. Rio and C. Latouche, New J. Chem., 2019, 49, 11903 RSC.
- A. Islam, N. Ikeda, K. Nozaki, Y. Okamoto, B. Gholamkhass, A. Yoshimura and T. Ohno, Coord. Chem. Rev., 1998, 171, 355 CrossRef CAS.
- T. Sajoto, P. I. Djurovich, A. B. Tamayo, J. Oxgaard, W. A. Goddard III and M. E. Thompson, J. Am. Chem. Soc., 2009, 131, 9813 CrossRef CAS PubMed.
- J. V. Caspar and T. J. Meyer, J. Am. Chem. Soc., 1983, 105, 5583 CrossRef CAS.
- X. Zhou and B. J. Powell, Phys. Chem. Chem. Phys., 2020, 22, 27348 RSC.
- R. A. Velapoldi, in National Bureau of Standards Special Publication 378, Accuracy in Spectrophotometry and Luminescence Measurements. Proc. Conf. NBS, Gaithersburg, MD, 1972, p. 231 Search PubMed.
- D. W. Marquardt, J. Soc. Ind. Appl. Math., 1963, 11, 431 CrossRef.
- M. J. Frisch, G. W. Trucks, H. B. Schlegel, G. E. Scuseria, M. A. Robb, J. R. Cheeseman, G. Scalmani, V. Barone, B. Mennucci, G. A. Petersson, H. Nakatsuji, M. Caricato, X. Li, H. P. Hratchian, A. F. Izmaylov, J. Bloino, G. Zheng, J. L. Sonnenberg, M. Hada, M. Ehara, K. Toyota, R. Fukuda, J. Hasegawa, M. Ishida, T. Nakajima, Y. Honda, O. Kitao, H. Nakai, T. Vreven, J. A. Montgomery Jr, J. E. Peralta, F. Ogliaro, M. Bearpark, J. J. Heyd, E. Brothers, K. N. Kudin, V. N. Staroverov, T. Keith, R. Kobayashi, J. Normand, K. Raghavachari, A. Rendell, J. C. Burant, S. S. Iyengar, J. Tomasi, M. Cossi, N. Rega, J. M. Millam, M. Klene, J. E. Knox, J. B. Cross, V. Bakken, C. Adamo, J. Jaramillo, R. Gomperts, R. E. Stratmann, O. Yazyev, A. J. Austin, R. Cammi, C. Pomelli, J. W. Ochterski, R. L. Martin, K. Morokuma, V. G. Zakrzewski, G. A. Voth, P. Salvador, J. J. Dannenberg, S. Dapprich, A. D. Daniels, O. Farkas, J. B. Foresman, J. V. Ortiz, J. Cioslowski and D. J. Fox, Gaussian 09, Revision D.01, Gaussian, Inc., Wallingford CT, 2013 Search PubMed.
- A. D. Becke, J. Chem. Phys., 1993, 98, 5648 CrossRef CAS.
- J. F. Guillemole, V. Barone, L. Joubert and C. Adamo, J. Phys. Chem. A, 2002, 106, 11354 CrossRef.
- P. J. Hay and W. R. Wadt, J. Chem. Phys., 1985, 82, 299 CrossRef CAS.
- P. Harihara and J. A. Pople, Theor. Chim. Acta, 1973, 28, 213 CrossRef.
- M. M. Francl, W. J. Pietro, W. J. Hehre, J. S. Binkley, M. S. Gordon, D. J. Defrees and J. A. Pople, J. Chem. Phys., 1982, 77, 3654 CrossRef CAS.
- J. Tomasi, B. Mennucci and R. Cammi, Chem. Rev., 2005, 105, 2999 CrossRef CAS PubMed.
- G. Scalmani, M. J. Frisch, B. Mennucci, J. Tomasi, R. Cammi and V. Barone, J. Chem. Phys., 2006, 124, 94107 CrossRef PubMed.
- R. E. Stratmann, G. E. Scuseria and M. J. Frisch, J. Chem. Phys., 1998, 109, 8218 CrossRef CAS.
| This journal is © The Royal Society of Chemistry 2021 |