 Open Access Article
Effect of anisotropic conductivity of Ag2S-modified ZnmIn2S3+m (m = 1, 5) on the photocatalytic properties in solar hydrogen evolution†
Jingyuan Liu *a,
Xinyi Xuea,
Xin Zhoua,
Gang Chen
 a and
Wei Liu*b
aMIIT Key Laboratory of Critical Materials Technology for New Energy Conversion and Storage, School of Chemistry and Chemical Engineering, Harbin Institute of Technology, Harbin, 150001, China. E-mail: liujingyuan10@hit.edu.cn
bDepartment of Optical Engineering, Zhejiang A&F University, Hangzhou, 311300, China. E-mail: weiliu@zafu.edu.cn
First published on 6th August 2021
Abstract
3 wt% Ag2S/Zn5In2S8 (3A/Z5) and 3 wt% Ag2S/ZnIn2S4 (3A/Z1) were prepared by a two-step synthesis method. The first-principles calculations revealed that the anisotropic carrier transport property of Zn5In2S8 (Z5) is much stronger than that of ZnIn2S4 (Z1). Furthermore, unsynchronized electron and hole transport leads to higher bulk carrier separation efficiency in Z5. After accelerating the surface photocatalytic reaction rate by Ag2S modification, the differences between 3A/Z5 and 3A/Z1 in the bulk carrier separation were further enlarged. Photoelectrochemical tests confirmed that the bulk charge separation efficiency of 3A/Z5 is 13.70%, which is 7.4 times higher than 3A/Z1 (1.84%). Because of the high bulk carrier separation efficiency, the 3A/Z5 exhibits a promising photocatalytic hydrogen production rate, reaching 3189 μmol h−1 g−1. Through intuitive evidence, this work proves that material with stronger anisotropic conductivity has higher bulk carrier separation efficiency, thus has the potential to exhibit high photocatalytic hydrogen production performance.
1. Introduction
Photocatalytic water splitting to produce hydrogen is one of the intriguing ways to address the worldwide energy shortfall and environmental issues.1–8 In recent years, researchers have made significant progress in the development of photocatalyst materials such as oxides, sulfides, nitrides, and oxysulfides.9–12 Despite the fact that many photocatalytic materials have visible-light response properties and suitable band edges for redox reactions, sluggish photoinduced carrier separation still leads to low solar energy conversion efficiency. Aiming to eliminate such restrictions, many approaches have been developed to improve the spatial separation and transport efficiency of carriers, such as tailoring surface defects, depositing cocatalysts, and constructing heterostructures.13–24 These approaches have proven to be valid for steering charge flow on the photocatalyst surface, but they rarely affect the recombination in the photocatalyst bulk. Therefore, it is critical to investigate the factors that can influence bulk carrier separation efficiency.25Recently, many studies have predicted through theoretical calculations that photocatalyst materials with anisotropic conductivity property should have high bulk carrier separation efficiency, which could lead to high photocatalytic activity.26–28 Under the influence of this feature, the photogenerated carriers tend to transfer in the direction of higher conductivity. Hence, the photogenerated carrier migration is restricted to two-dimensional or even one-dimensional space, lowering the possibility of bulk carrier recombination. As a result, the surface redox reaction is able to involve more long-lived bulk carriers, which allows the photocatalyst to present high performance. In fact, studies have shown that many materials with strong anisotropic carrier transport properties exhibit long carrier lifetimes and outstanding photocatalytic activity, such as La5Ti2CuS5O7, Bi3O4Cl, SrTiO3, ZnO, etc.29–32 Therefore, it can be concluded that the anisotropic carrier transport characteristic is the key factor affecting the catalytic activity of the photocatalyst. However, since the activity of photocatalytic material is impacted by multiple factors (element composition, morphology, band position, light absorption range, etc.), it is still challenging to conduct in-depth research on the single effect of anisotropic conductivity on photocatalytic activity.
ZnmIn2S3+m (m = 1–5, ZIS) are promising two-dimensional layered photocatalyst semiconductors. The series of materials all have suitable bandwidth for visible light response and proper conduction band edge for hydrogen evolution.33–36 The hexagonal ZIS is composed of the packet stacking of S–(Zn–S)m–In–S–In–S layers along the [001] direction. Spyridelis et al. reported that ZIS exhibit strong anisotropic conductivity, with the conductivity parallel to the hexagonal ZIS (001) basal plane (σ‖) being much stronger than the conductivity perpendicular to the hexagonal ZIS (001) basal plane (σ⊥).37,38 Moreover, despite having similar element compositions and crystal structures, the anisotropic conductivity strengths of ZnIn2S4 (Z1) and Zn5In2S8 (Z5) are dramatically different. Experimental measurements revealed that the ratio of σ‖ to σ⊥ was determined to be 106 in Z5, which is 1000 times higher than in Z1 (103).39,40 Due to the similarities in other properties and the huge difference in anisotropic conductivity, Z1 and Z5 are ideal choices for systematically studying the relationship between anisotropic conductivity and photocatalytic activity.
According to our previous work, the surface catalytic reaction rate of ZIS photocatalysts can be largely enhanced by the deposition of Ag2S as a cocatalyst via a cation exchange reaction.41 Therefore, in this work, we also loaded Ag2S on Z1 and Z5 using a similar method to promote surface electron consumption rate. Various experimental analyses show that, although Z1 and Z5 have similar crystal structures, element compositions, morphologies and band structures, they exhibit quite different photocatalytic activities after deposition of Ag2S. In particular, the photocatalytic H2 evolution rate of 3 wt% Ag2S/Zn5In2S8 (3A/Z5) is 3189 μmol h−1 g−1, which is 5.8 times higher than that of 3 wt% Ag2S/ZnIn2S4 (3A/Z1). First-principles calculations and photoelectrochemical (PEC) tests revealed that the discrepancy is mainly due to the stronger anisotropic conductivity of Z5 than that of Z1, which leads to a higher bulk charge separation rate in Z5. Furthermore, after accelerating the surface photocatalytic reaction rate via Ag2S modification, the bulk carrier separation efficiency of 3A/Z5 was further increased to 13.70%, which is 7.4 times higher than that of 3A/Z1. It is because of the high photogenerated carrier separation and transfer efficiency, the 3A/Z5 possesses the longest carrier lifetime and highest photocatalytic hydrogen production activity. Through intuitive evidence, this work proves that material with stronger anisotropic conductivity has higher bulk carrier separation efficiency, thus has the potential to exhibit high photocatalytic hydrogen production performance.
2. Experimental
2.1 Materials
Zinc chloride (ZnCl2) and sodium sulfate (Na2SO4) were purchased from Tianjin Kemiou Chemical Reagent Co., Ltd. Indium chloride tetrahydrate (InCl3·4H2O) and thioacetamide were purchased from Aladdin Chemical Reagent Co., Ltd. Sodium sulfide (Na2S) was purchased from Xilong Scientific Co., Ltd. Silver nitrate (AgNO3) was purchased from Shanghai Institute of Fine Chemical Materials. Sodium sulfite (Na2SO3) was purchased from Tianjin Keguangfu Science and Technology Development Co., Ltd. All reagents were analytical grade (AR) without further purification.2.2 Preparation of ZIS and Ag2S modified ZIS
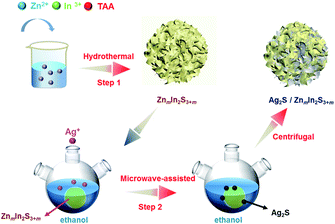
The hydrothermal method was used to prepare ZIS. ZnCl2 (0.4 mmol for Z1; 2.0 mmol for Z5) and InCl3·4H2O (0.8 mmol) were added into 30 mL distilled water with stirring for 30 minutes. The excess thioacetamide was then added to the mixed solution (3.2 mmol for Z1 and 6.4 mmol for Z5) and stirred for 30 minutes. The final solution was transferred into a Teflon-lined stainless steel autoclave with a 45 mL capacity, and the hydrothermal reaction was kept at 453 K for 24 hours. After naturally cooling to room temperature, a yellow precipitate of Z1 or Z5 was obtained. The resulting products were washed with distilled water and ethanol for 3 times by centrifugation before being dried at 333 K in the atmosphere for 12 h.In order to prepare the Ag2S/ZIS heterostructure, the obtained 0.05 g of Z1 or Z5 and a certain amount of AgNO3 were both dispersed into 60 mL of ethanol, ultrasonicated for 10 minutes. The mass ratio of Ag2S to ZnIn2S4 calculated by the added AgNO3 was regulated to be 1, 3, 5, 10 and 15 wt% and the synthesized samples were labeled as 1A, 3A, 5A, 10A and 15A/ZIS, respectively. The solution was then transferred into the three neck flask (100 mL) and heated in the microwave reactor for 15 minutes (400 W, 351 K, MAS-II). After the reaction, the final products were centrifuged and washed with distilled water and ethanol 3 times and then dried at 333 K in the atmosphere for 12 h (Scheme 1). Pure Ag2S was synthesized by a facile hydrothermal method. 0.4 mmol AgNO3 and thioacetamide were added into 30 mL distilled water with stirring for 1 hour. Then the solution was transferred into a Teflon-lined stainless steel autoclave with a 45 mL capacity, and the hydrothermal reaction was kept at 453 K for 24 hours.
The specific characterization methods, photoelectrochemical test, calculation of Density Functional Theory (DFT) and photocatalytic hydrogen performance test are shown in the ESI.†
3. Results and discussion
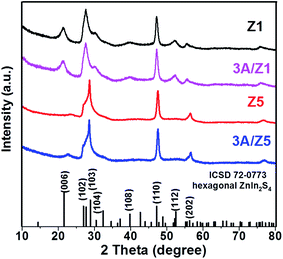
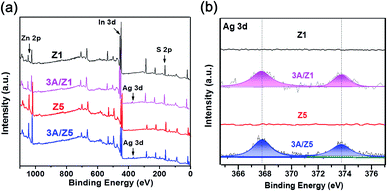
The crystal structures of the as-prepared samples were confirmed using XRD detection. All samples have diffraction peaks at 26.80°, 47.00°, and 55.90°, which can be assigned to the (102), (110), and (202) characteristic peaks of the ZIS hexagonal phase (JCPDS 72-0773) (Fig. 1). Although the crystal structures of Z1 and Z5 are similar, it is worth noting that the intensities of some Z1 and Z5 diffraction peaks are quite different. When compared to Z1, the intensities of the (102), (104), (108) and (112) peaks of Z5 become weak or even undetectable, whereas the intensity of the (103) peak of Z5 becomes substantially stronger. This result is consistent with previous research and can be attributed to the distinction in –(Zn–S)m– layers caused by different m values.34,35 After loading 3 wt% Ag2S to Z1 or Z5, the characteristic peaks of Ag2S can not be found in the XRD patterns of the samples, presumably due to the low loading amount. Nonetheless, when employing a higher loading amount of Ag2S, the characteristic peaks with 2θ degrees of 34.48°, 36.82° and 43.41° can be clearly observed and assigned to the monoclinic Ag2S phase (JCPDS 14-0072), thus confirming the formation of Ag2S (Fig. S1†). X-ray photoelectron spectroscopy (XPS) was used to confirm the chemical composition of 3A/Z5. In survey spectra, the characteristic binding energies of Zn 2p, In 3d and S 2p peaks can be observed in all samples (Fig. 2a). The new characteristic peak of Ag 3d5/2 and Ag 3d3/2 at 367.77 and 373.77 eV can both be found in the 3A/Z1 and 3A/Z5 in comparison to pristine ones (Fig. 2b). Furthermore, as shown in Fig. S2,† the XPS peaks of Zn 2p, In 3d and S 2p in the 3A/Z1 and 3A/Z5 samples all shifted towards lower binding energies compared to the pristine samples. Moreover, when the loaded Ag content is increased from 3 wt% to 10 wt%, the intensity of Ag 3d peaks increases, and the shift of Zn 2p, In 3d, and S 2p peaks becomes more noticeable (Fig. S3†). The Ag 3d XPS spectra in pure Ag2S were also measured (Fig. S4†). The characteristic peaks of Ag 3d5/2 and Ag 3d3/2 in pure Ag2S are located at 367.45 and 373.45 eV, respectively. The XPS peak of Ag 3d in the 3A/Z5 sample shifts to a higher binding energy by about 0.32 eV compared with the pure Ag2S, which reveals that the Ag 3d orbitals lose electrons and the Zn 2p, In 3d, and S 2p orbitals gain electrons. All of these observations suggest that Ag2S and ZIS are forming strong electrical connections.42In order to obtain information about the morphology and detailed structure of the as-prepared samples, scanning electron microscope (SEM) characterization was employed. Fig. 3a reveals that both Z1 and Z5 have the typically flower-like microsphere morphology in the range of 4–5 μm. The microspheres are assembled by nanosheets with a thickness of 20–50 nm (Fig. S5†). The morphologies of the two pristine samples observed from the SEM image are almost indistinguishable. After the modification of Ag2S, the original ZIS had no noticeable changes in size or structure. According to our previous findings, Ag+ can directly replace the positions of Zn2+ and In3+ in ZIS, and bond with S in situ to form Ag2S during the cation exchange reaction.41 Because the newly formed Ag2S is in close atomic contact with ZIS, it is difficult to find any differences from the SEM images after the formation of the heterojunction. The more detailed microstructures of 3A/Z5 were investigated using transmission electron microscopy (TEM) and high resolution transmission electron microscopy (HRTEM). As shown in the TEM images (Fig. 3b), the microsphere assembled by nanosheets can be clearly observed, which is in good agreement with the SEM results. In HRTEM images (Fig. 3c), the lattice fringe spacing of 0.33 nm matches well with the d101 spacing of ZIS, and the interaxial angle of 120° indicates the hexagonal crystal structure of the ZIS (001) basal plane.43 It can be clearly found that another lattice fringe spacing of 0.19 nm exists, which corresponds to the (022) crystal plane of Ag2S. The presence of two types of well-resolved lattice fringes indicates the successful formation of the 3A/Z5 heterostructure. In order to observe the specific morphology of Ag2S more clearly, a higher concentration of silver nitrate (Ag+/Zn5In2S8 = 1![[thin space (1/6-em)]](https://www.rsc.org/images/entities/char_2009.gif) :
:![[thin space (1/6-em)]](https://www.rsc.org/images/entities/char_2009.gif) 1, named as 100A-Z5) was also employed for cation exchange reaction. As shown in Fig. S6,† it can be clearly found that there are Ag2S nanoparticles with a size of 15–30 nm in 100A-Z5. In addition, the element distribution was further investigated by scanning transmission electron microscopy (STEM) energy-dispersive X-ray (EDX) spectroscopy. As shown in Fig. 3d, Zn, In, S and Ag elements are uniformly distributed in the tested area. The results demonstrate that the Ag2S is evenly distributed in ZIS nanosheets, forming an atomic-level intimate contact with ZIS, which is consistent with our previous results. In conclusion, the above XRD, XPS, SEM and TEM results all indicate that there is no significant difference between Z1 and Z5 before or after Ag2S modification.
1, named as 100A-Z5) was also employed for cation exchange reaction. As shown in Fig. S6,† it can be clearly found that there are Ag2S nanoparticles with a size of 15–30 nm in 100A-Z5. In addition, the element distribution was further investigated by scanning transmission electron microscopy (STEM) energy-dispersive X-ray (EDX) spectroscopy. As shown in Fig. 3d, Zn, In, S and Ag elements are uniformly distributed in the tested area. The results demonstrate that the Ag2S is evenly distributed in ZIS nanosheets, forming an atomic-level intimate contact with ZIS, which is consistent with our previous results. In conclusion, the above XRD, XPS, SEM and TEM results all indicate that there is no significant difference between Z1 and Z5 before or after Ag2S modification.
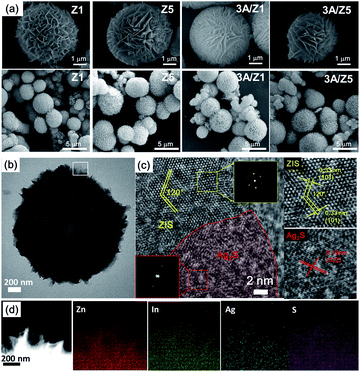 | ||
| Fig. 3 (a) SEM images for Z1, 3A/Z1, Z5 and 3A/Z5. (b) TEM image of the 3A/Z5, (c) HRTEM image of the 3A/Z5. (d) Corresponding EDX elemental mappings of Ag, Zn, In, and S. | ||
A nitrogen adsorption–desorption measurement was carried out to study the Brunauer–Emmett–Teller (BET) surface area and pore structure of the as-synthesized samples. As shown in Fig. S7a,† the curve shape of all samples belonged to typical isotherm type-IV curves, with a well-defined hysteresis loop in the high relative pressure (P/P0) range of 0.45–1.00, confirming the mesoporous structure exists in all samples. The pore size distribution curve (Fig. S7b†) demonstrates that there is no significant difference between the samples before and after Ag2S deposition. The pore diameters of as prepared samples are all in the range of 3–4.2 nm. The BET surface area for Z1, 3A/Z1, Z5 and 3A/Z5 are calculated to be 47.16, 55.82, 41.48 and 70.24 m2 g−1, respectively. Compared with the pure samples, the specific surface areas of the hybrids are slightly increased, which may expose more active sites and improve the photocatalytic activity of materials.
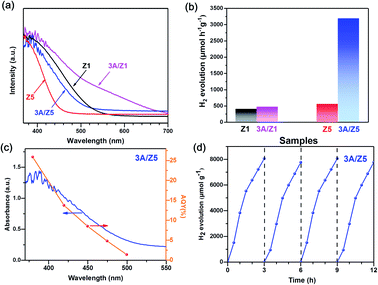
Ag2S is a black-colored narrow bandgap semiconductor. Forming a heterojunction with it could improve the light absorption capability of the ZIS. The UV-vis diffuse reflectance spectra (DRS) of the prepared samples were measured to determine the influence of Ag2S modification on light absorption properties of as-prepared samples. Fig. 4a shows that the absorption edge of Z1 is close to 535 nm, which is longer than that of Z5 (467 nm). After loading the same amount of Ag2S, the onset values for light absorption by 3A/Z1 are up to 710 nm, which is still longer than 3A/Z5 (507 nm). This is due to the fact that the valence band of ZIS is composed of S 3p and Zn 3d hybrid orbitals, whereas the conduction band is composed of In 5s5p and Zn 4s4p hybrid orbitals. When the value of m increases, the absorption range of ZIS shrinks as the Zn/In molar ratio increases.34 As a result, Z1 and 3A/Z1 have wider adsorption ranges than Z5 and 3A/Z5. The band structures of the prepared samples were evaluated using Tauc plots and XPS valence spectra. As shown in Fig. S8,† the band gap (Eg) values of Z1 and Z5 samples are calculated to be 2.57 and 2.75 eV, respectively, while the Eg value of Ag2S is known to be 0.92 eV.41 XPS valence spectra (Fig. S9†) show that the maximum valence bands of Z1, Z5 and Ag2S are 1.53, 1.6 and 0.5 eV, respectively. Taking into account the Eg values, the conduction band (CB) edges of Z1, Z5 and Ag2S are calculated to be −1.04, −1.15 and −0.42 eV, respectively. Based on the data presented above, the energy band diagrams are described in Fig. S10.† The CB edges of Z1 and Z5 are both more negative than that of Ag2S, implying that photogenerated electrons can migrate from the conduction band of Z1 or Z5 to Ag2S through the heterojunction interface. As Ag2S with the unsaturated S atoms on the surface can act as HER active centers,44 the surface photocatalytic reaction rate of Z1 and Z5 should be both accelerated by Ag2S modification.
The photocatalytic performances of the prepared Ag2S/ZIS are evaluated in a closed reaction system using Na2S–Na2SO3 aqueous solution as a sacrificial agent under visible light (λ > 420 nm) irradiation. The result (Fig. S11†) revealed that among varied amounts of Ag2S loadings, 3A/Z5 exhibits the highest photocatalytic activity. Furthermore, as shown in Fig. 4b, the photocatalytic H2 evolution amounts of 3A/Z1 and 3A/Z5 are both improved when compared to the pristine ones. In particular, the average H2 production rates of Z1, Z5, 3A/Z1 and 3A/Z5 are 398, 467, 546, 3189 μmol h−1 g−1, respectively. Among all samples, 3A/Z5 exhibits the highest photocatalytic activity for hydrogen evolution. The apparent quantum yield (AQY) of 3A/Z5 is carried out by employing band-pass filters of 380, 420, 450, 475 and 500 nm. According to Fig. 4c, AQY is consistent with the light response of the 3A/Z5 sample and the specific AQY values at 380 and 420 nm are 25.89% and 13.76%, respectively. A 12 hours photocatalytic hydrogen production experiment was carried out to test the photostability of the 3A/Z5, the evacuation was performed every 3 hours. From the result (Fig. 4d), it can be clearly seen that the photocatalytic hydrogen evolution activity has no obvious deactivation, indicating relatively good stability of 3A/Z5. Compared to other ZIS-based photocatalysts that have been reported (Table S1†), the 3A/Z5 exhibits relatively good photocatalytic H2 evolution activity. The foregoing findings suggest that deposition of Ag2S on the ZIS surface by cation exchange can boost the photocatalytic hydrogen evolution activity of ZIS. However, it is rather appealing that the photocatalytic H2 evolution rate of 3A/Z5 is 5.8 times higher than that of 3A/Z1, despite the similarities in other properties. The primary cause of the difference in activity between the two samples is necessary to be found.
As discussed above, the transportation and separation properties of photogenerated bulk carriers are important factors affecting photocatalytic activity. Since the mobility of bulk carriers is proportional to the reciprocal of their effective mass, first-principles calculations were used to evaluate the relative effective mass of electrons  and holes
  in Z1 and Z5. The structures used in these calculations are shown in Fig. S12.† The calculated effective masses in the unit of a free electron mass (me) and the
  ratio in the Γ–A, Γ–K and Γ–M directions are shown in Table 1. From the results, it can be seen that the
  values along the Γ–K and Γ–M directions are all in the range of 0.36–2.17 me. While in the Γ–A direction, the
  in Z1 and Z5 are both larger than
  reaching 117.51 and 2739.15 me, respectively. The unequal effective masses of holes in different directions demonstrate that holes prefer to migrate along the Γ–K and Γ–M directions rather than in the Γ–A direction, indicating the anisotropic conductivity of Z1 and Z5. In addition, as the effective mass of holes in the Γ–A direction is much higher in Z5, it can be assumed that the anisotropic transport property of photogenerated holes in Z5 is stronger. Next, the
  ratios are used to compare the carrier recombination rate of Z1 and Z5. In general, a higher
  ratio implies a greater difference in charge carrier mobility, which means the transportation of electrons and holes are not synchronized, indicating a low bulk carrier recombination rate in this direction. As shown in Table 1, the
  ratios of Z1 and Z5 along the Γ–K and Γ–M directions are within 1.02–4.92, whereas the
  ratio of Z5 along the Γ–A direction is 7208.29, which is about ∼22 times larger than that of Z1. It can be concluded that the bulk carrier separation rate from Γ to A in Z5 is much higher than that in Z1. This is reasonable because Z5 possesses a stronger anisotropic conductivity for holes, so the migration of holes in the Γ–A direction is more restricted and the possibility of bulk carrier recombination in the Γ–A direction is largely reduced. To summarize, first-principles calculations suggest that the anisotropic bulk carrier transport property of Z5 is much stronger than that of Z1, and the bulk carrier recombination rate of Z5 during photocatalyst bulk transmission is much lower than that of Z1, which is the primary cause of the photocatalytic activity discrepancy.
PEC tests were used to confirm the conclusion of the theoretical calculation. The current–potential curves of the prepared samples are recorded in the electrolyte solution with or without 1 M Na2SO3 as a hole scavenger. The as prepared photoelectrodes all exhibit anodic photocurrents due to their n-type nature. For water oxidation (Fig. S13†), the photocurrent densities of 3A/Z1 and 3A/Z5 electrodes are much higher compared to their pristine ones over the potential range of 0.6–1.4 V vs. RHE. The obtained photocurrent densities obey the eqn (1):
| JH2O = Jabs × ηbulk × ηsurface | (1) |
| JNa2SO3 = Jabs × ηbulk | (2) |
| ηbulk = JNa2SO3/Jabs | (3) |
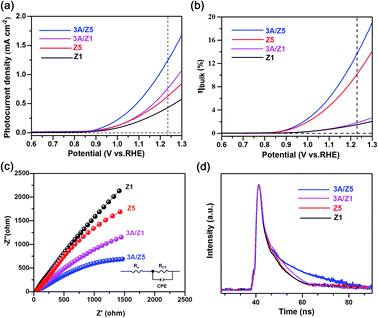
Fig. 5b depicts the calculated ηbulk of Z1, Z5, 3A/Z1 and 3A/Z5 photoelectrodes, which were estimated to be 1.50%, 10.10%, 1.84%, and 13.70% at 1.23 V vs. RHE, respectively. The bulk charge separation efficiency of Z5 is 6.7 times higher than that of Z1, and 3A/Z5 is 7.4 times higher than that of 3A/Z1. The results confirmed the conclusion of the theoretical calculation, which is that the Z5 with stronger anisotropic conductivity exhibits higher bulk carrier separation efficiency. After accelerating the surface photocatalytic reaction rate by Ag2S modification, the difference between 3A/Z5 and 3A/Z1 in the bulk carrier separation was further enlarged. Electrochemical impedance spectroscopy (EIS) results also confirmed the effective transfer of photo-generated charge-holes of 3A/Z5. The EIS data of Z1, Z5, 3A/Z1 and 3A/Z5 are well fitted to the equivalent circuit model, as shown in Fig. 5c. Here, Rs, RCT and CPE represent the series resistance originating from the FTO and semiconductor, the charge resistance and the capacitance at the interface of the electrode/electrolyte, respectively. It appears that hybrid samples all possess a more compressed arc than that of pristine ones, indicating that loading of Ag2S could prompt the charge transfer efficiency of samples (i.e. faster surface reaction rate). Furthermore, 3A/Z5 had a smaller semidiameter than 3A/Z1, implying the highest charge separation efficiency on the surface as well as in the bulk. From the results, it can be concluded that 3A/Z5 possesses the best charge transfer efficiency among all samples. It is obvious that improving the efficiency of charge carrier separation and transportation will lead to a longer carrier lifetime. Photoluminescence (PL) spectra and the time resolved photoluminescence (TRPL) spectra were employed to evaluate the lifetime of photogenerated carriers. As shown in Fig. S15,† Ag2S modified Z1 and Z5 all present a lower PL intensity compared to that of pristine ones, but the peak intensity decreases more significantly in the case of 3A/Z5, implying that the photogenerated carrier recombination rate of 3A/Z5 is the lowest. The TRPL spectra are also consistent with the above results (Fig. 5d and Table S2†), the average decay lifetimes of Z1, 3A/Z1, Z5 and 3A/Z5 calculated by a double-exponential fitting model are 1.84, 3.15, 1.87 and 7.84 ns, respectively. The lifetime of photogenerated carriers of 3A/Z5 is the longest among all samples, which could explain its highest photocatalytic activity. In summary, due to the higher bulk charge separation rate of Z5 and the enhanced charge transfer efficiency by Ag2S modification, more of these long-lived bulk carriers in Z5 can be involved in the surface redox reactions, thus leading to a higher hydrogen evolution reaction (HER) activity of 3A/Z5.
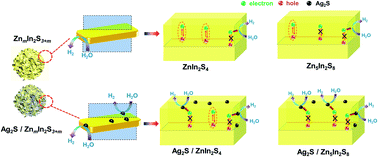
Some important conclusions are proposed based on the preceding discussions. Various experimental analyses revealed that there were no significant differences between Z1 and Z5 in terms of crystal structure, element composition and morphology before or after loading of Ag2S. Despite the many similarities, the photocatalytic hydrogen evolution performance of 3A/Z1 and 3A/Z5 differs significantly, which can be attributed to the discrepancy in anisotropic conductivity. Due to the stronger anisotropic conductivity nature of Z5, the migration of holes in the Γ–A direction is more restricted and the possibility of bulk carrier recombination in the Γ–A direction is largely reduced. The theoretical calculation and PEC test all confirmed that the bulk carrier separation rate of Z5 during photocatalyst bulk transmission is much higher than that of Z1. However, when there are other parameters (e.g., slow surface reactions rate) limiting the ZIS photocatalyst catalytic efficiency at the same time, the photocatalytic hydrogen production rate of Z5 is only slightly higher than that of Z1. After depositing of Ag2S to accelerate the surface photocatalytic reaction rate of both Z1 and Z5, more long-lived bulk carriers in Z5 can be involved in the surface redox reactions, and the difference in photocatalytic hydrogen production activity caused by anisotropic conductivity therefore becomes more obvious (Scheme 2).
4. Conclusions
In this work, 3A/Z1 and 3A/Z5 were prepared by a two-step synthesis method. Although Z1 and Z5 have similar crystal structures, element compositions, morphologies and band structures, they exhibit completely different photocatalytic activities after accelerating the surface photocatalytic reaction rate by Ag2S modification. The photocatalytic H2 evolution rate of 3A/Z5 is 5.8 times higher than that of 3A/Z1, reaching 3189 μmol h−1 g−1. First-principles calculations reveal that the discrepancy is mainly due to the stronger anisotropic conductivity of Z5 than that of Z1, which leads to a higher bulk charge separation rate in Z5. The PEC tests further confirm such a conclusion, the bulk charge separation rate of Z5 is measured to be 6.7 times higher than that of Z1. After accelerating the surface photocatalytic reaction rate by Ag2S modification, the difference between 3A/Z5 and 3A/Z1 in the bulk carrier separation was further enlarged. The bulk carrier separation efficiency of 3A/Z5 was 13.70%, which is 7.4 times higher than that of 3A/Z1. It is because of the high photogenerated carrier separation and transfer efficiency, the 3A/Z5 exhibits the longest carrier lifetime and highest photocatalytic hydrogen production activity. In conclusion, this work determined the rarely observed the relationship between anisotropic conductivity and photocatalytic activity, proves that a material with stronger anisotropic bulk transmission property has higher bulk carrier separation efficiency. Such a novel perspective is expected to assist in the development of high performance photocatalytic materials with high bulk carrier separation efficiency for hydrogen evolution.Conflicts of interest
There are no conflicts to declare.Acknowledgements
This work was financially supported by projects of Natural Science Foundation of Heilongjiang (Grant 20190018) and Natural Science Foundation of China (Grant 22002029 and 11975206).Notes and references
- S. S. Chen, T. Takata and K. Domen, Nat. Rev. Mater., 2017, 2, 17050 CrossRef CAS.
- S. Chandrasekaran, L. Yao, L. B. Deng, C. Bowen, Y. Zhang, S. M. Chen, Z. Q. Lin, F. Peng and P. X. Zhang, Chem. Soc. Rev., 2019, 48, 4178–4280 RSC.
- Z. Wang, C. Li and K. Domen, Chem. Soc. Rev., 2019, 48, 2109–2125 RSC.
- T. Hisatomi, K. Takanabe and K. Domen, Catal. Lett., 2015, 145, 95–108 CrossRef CAS.
- G. Liao, C. Li, X. Li and B. Fang, Cell Rep. Phys. Sci., 2021, 2, 100355 CrossRef CAS.
- Y. Liu, S. Shen, Z. Li, D. Ma, G. Xu and B. Fang, Mater. Charact., 2021, 174, 111031 CrossRef CAS.
- G. Liao, Y. Gong, L. Zhang, H. Gao, G. J. Yang and B. Fang, Energy Environ. Sci., 2019, 12, 2080–2147 RSC.
- G. Liao, J. Fang, Q. Li, S. Li, Z. Xu and B. Fang, Nanoscale, 2019, 11, 7062–7096 RSC.
- V. Kumaravel, S. Mathew, J. Bartlett and S. C. Pillai, Appl. Catal., B, 2019, 244, 1021–1064 CrossRef CAS.
- J. H. Lian, D. Li, Y. Qi, N. C. Yang, R. Zhang, T. F. Xie, N. J. Guan, L. D. Lia and F. X. Zhang, J. Energy Chem., 2021, 55, 444–448 CrossRef.
- L. Cheng, Q. J. Xiang, Y. L. Liao and H. W. Zhang, Energy Environ. Sci., 2018, 11, 1362–1391 RSC.
- J. Liu, T. Hisatomi, M. Katayama, T. Minegishi, J. Kubota and K. Domen, J. Mater. Chem. A, 2016, 4, 4848–4854 RSC.
- J. Xiong, J. Di, J. Xia, W. Zhu and H. Li, Adv. Funct. Mater., 2018, 28, 1801983 CrossRef.
- J. Ran, J. Zhang, J. Yu, M. Jaroniecc and S. Qiao, Chem. Soc. Rev., 2014, 43, 7787–7812 RSC.
- H. Zhao, H. Zhang, G. Cui, Y. Dong, G. Wang, P. Jiang, X. Wu and N. Zhao, Appl. Catal., B, 2018, 225, 284–290 CrossRef CAS.
- M. Bo, J. P. Zhao, Z. H. Ge, Y. Y. Chen and Z. H. Yuan, Sci. China Mater., 2019, 63, 258–266 Search PubMed.
- F. Gao, Y. Zhao, L. Zhang, B. Wang, Y. Wang, X. Huang, K. Wang, W. Feng and P. Liu, J. Mater. Chem. A, 2018, 6, 18979–18986 RSC.
- J. Zhao, B. Fu, X. Li, Z. Ge, B. Ma and Y. Chen, ACS Appl. Energy Mater., 2020, 3, 10910–10919 CrossRef CAS.
- B. Ma, Z. Yang, Y. Chen and Z. Yuan, Nano Res., 2019, 12, 375–380 CrossRef CAS.
- M. Shao, W. Chen, S. Ding, K. H. Lo, X. Zhong, L. Yao, W. F. Ip, B. Xu, X. Wang and H. Pan, ChemSusChem, 2019, 12, 3355–3362 CrossRef CAS PubMed.
- S. J. A. Moniz, S. A. Shevlin, D. J. Martin, Z. Guob and J. Tang, Energy Environ. Sci., 2015, 8, 731–759 RSC.
- G. Suo, D. Li, L. Feng, X. Hou, X. Ye, L. Zhang, Q. Yu, Y. Yang and W. Wang, J. Mater. Sci. Technol., 2020, 55, 167–172 CrossRef.
- D. Li, J. Zhang, S. M. Ahmed, G. Suo, W. Wang, L. Feng, X. Hou, Y. Yang, X. Ye and L. Zhang, J. Colloid Interface Sci., 2020, 574, 174–181 CrossRef CAS PubMed.
- G. Suo, J. Zhang, D. Li, Q. Yu, W. Wang, M. He, L. Feng, X. Hou, Y. Yang, X. Ye and L. Zhang, Chem. Eng. J., 2020, 388, 124396 CrossRef CAS.
- K. Takanabe, ACS Catal., 2017, 7, 8006–8022 CrossRef CAS.
- M. Sun and U. Schwingenschlögl, Chem. Mater., 2020, 32, 4795–4800 CrossRef CAS.
- J. Liu, Y. Shen, X. Gao, L. Lv, Y. Ma, S. Wu, X. Wang and Z. Zhou, Appl. Catal., B, 2020, 279, 119368 CrossRef CAS.
- Y. Xu, K. Xu, C. Ma, Y. Chen, H. Zhang, Y. Liu and Y. Jia, J. Mater. Chem. A, 2020, 8, 19612–19622 RSC.
- Y. Suzuki, R. B. Singh, H. Matsuzaki, A. Furube, G. Ma, T. Hisatomi, K. Domen and K. Seki, Chem. Phys., 2016, 476, 9–16 CrossRef CAS.
- J. Li, L. Cai, J. Shang, Y. Yu and L. Zhang, Adv. Mater., 2016, 28, 4059–4064 CrossRef CAS PubMed.
- G. Li, Z. Yi, H. Wang, C. Jia and W. Zhang, Appl. Catal., B, 2014, 158–159, 280–285 CrossRef CAS.
- P. Zhang, T. Ochi, M. Fujitsuka, Y. Kobori, T. Majima and T. Tachikawa, Angew. Chem., Int. Ed., 2017, 56, 5299–5303 CrossRef CAS PubMed.
- X. Li, Y. Cheng, Q. Wu, J. Xu and Y. Wang, Appl. Catal., B, 2019, 240, 270–276 CrossRef CAS.
- Y. Wu, H. Wang, W. Tu, S. Wu and J. W. Chew, Appl. Catal., B, 2019, 256, 117810–117820 CrossRef CAS.
- S. H. Shen, L. Zhao and L. J. Guo, Int. J. Hydrogen Energy, 2010, 35, 10148–10154 CrossRef CAS.
- H. She, Y. Wang, H. Zhou, Y. Li, L. Wang, J. Huang and Q. Wang, ChemCatChem, 2019, 23, 753–759 CrossRef.
- Y. J. Zhang, H. M. Tang and S. P. Gao, Phys. Status Solidi, 2020, 257, 1900485 CrossRef CAS.
- N. Frangis and C. Manolikas, Phys. Status Solidi, 1988, 107, 589–595 CrossRef CAS.
- A. N. Anagnostopoulos, C. Manolikas, D. Papadopoulos and J. Spyridelis, Phys. Status Solidi, 1982, 72, 731–736 CrossRef CAS.
- J. A. Kalomiros, A. N. Anagnostopoulos and J. Spyridelis, Mater. Res. Bull., 1987, 22, 1307–1314 CrossRef CAS.
- J. Liu, G. Chen and J. Sun, ACS Appl. Nano Mater., 2020, 3, 11017–11024 CrossRef CAS.
- Z. Zhang, L. Huang, J. Zhang, F. Wang, Y. Xie, X. Shang, Y. Gu, H. Zhao and X. Wang, Appl. Catal., B, 2018, 233, 112–119 CrossRef CAS.
- X. Shi, L. Mao, C. Dai, P. Yang, J. Zhang, F. Dong, L. Zheng, M. Fujitsuka and H. Zheng, J. Mater. Chem. A, 2020, 8, 13376–13384 RSC.
- J. Xue, J. Liu, Y. Liu, H. Li, Y. Wang, D. Sun, W. Wang, L. Huang and J. Tang, J. Mater. Chem. C, 2019, 7, 3988–4003 RSC.
- X. Chang, T. Wang, P. Zhang, J. Zhang, A. Li and J. Gong, J. Am. Chem. Soc., 2015, 137, 8356–8359 CrossRef CAS.
Footnote |
| † Electronic supplementary information (ESI) available. See DOI: 10.1039/d1ra05413a |
| This journal is © The Royal Society of Chemistry 2021 |

