 Open Access Article
Diffusivity and free anion concentration of ionic liquid composite polybenzimidazole membranes
Arturo Barjola a,
Jorge Escorihuela
 *b,
Abel García-Bernabéc,
Óscar Sahuquilloa,
Enrique Giméneza and
Vicente Compañ
 *c
*c
aInstituto de Tecnología de Materiales, Universitat Politècnica de València, Camino de Vera s/n, 46022 Valencia, Spain
bDepartamento de Química Orgánica, Universitat de València, Av. Vicente Andrés Estellés s/n, Burjassot, 46100 Valencia, Spain. E-mail: Jorge.escorihuela@uv.es
cDepartamento de Termodinámica Aplicada, Universitat Politècnica de València, Camino de Vera, s/n, 46022 Valencia, Spain. E-mail: vicommo@ter.upv.es
First published on 2nd August 2021
Abstract
In this article, PBI composite membranes containing the ionic liquid (IL) 1-butyl-3-methylimidazolium bis(trifluoromethylsulfonyl)imide (BMIM-NTf2) at 1, 5, 10, 20 and 50 wt% (named PBI-IL-x) have been prepared by a casting method. The internal morphology of the membranes was analyzed by scanning electron microscopy (SEM), revealing that the incorporation of IL promotes the formation of porous channels. Thermal and mechanical stability was confirmed by thermogravimetric analysis (TGA) and tensile test measurements. The ionic transport through membranes was analysed by means of electrochemical impedance spectroscopy (EIS), showing a dependence on the IL loading, reaching a highest conductivity value of 1.8 × 10⁻² S cm−1 for the PBI-IL-50 membrane at 160 °C. The experimental results showed a Vogel–Fulcher–Tammann (VFT) type relation for the ionic conductivity with temperature and the calculated activation energies suggest that ionic conduction in the films can occur by both hopping and vehicle-type mechanisms. Eyring's absolute rate theory was also used to obtain activation enthalpy and entropy from the temperature dependence of the conductivity. Diffusivity and free ion number density were obtained by means of electrode polarization analysis to obtain more insight into the conduction in these composite membranes. Finally, the Debye length was calculated and related to both transport parameters.
Introduction
The development of polymeric membranes suitable to operate as proton exchange membrane fuel cells (PEMFCs) at moderate temperature under anhydrous conditions has drawn great attention in the past years. In this regard, PEMFCs have emerged as alternative and sustainable electrochemical energy conversion devices.1 PEMFCs use a proton conductive polymer membrane as an electrolyte, which ideally should possess high proton conductivity, low fuel permeability, excellent stability at high temperature and mechanical strength.2 The most widely used polymeric membranes are based on perfluorosulfonated polymers, such as Nafion, which have been extensively applied as PEMs due to their excellent proton conductivity and high chemical stability.3,4 However, Nafion membranes suffer a dramatic reduction in proton conductivity above 80 °C, which is associated with the difficulty of maintaining high humidity levels, consequently, hindering their use in large-scale applications at high temperatures.5,6In the continuous search to develop low-cost PEMs with high conductivity at elevated temperatures, the use of non-perfluorinated polymers has experienced a blooming along the past decades.7–13 Among the different non-perfluorinated membranes, polybenzimidazole (PBI) has emerged as an attractive alternative to replace Nafion membranes due to its lower methanol crossover as well as higher thermal and mechanical stability.14 Additionally, when doped with phosphoric acid, PBI membranes have shown conductivities around 0.1–0.2 S cm−1 at elevated temperatures.15 However, the use of phosphoric acid doped membranes has some drawbacks regarding environmental issues associated to acid leaching and degradation at high temperatures, leading to a proton conductivity decrease.16 Consequently, in the last years many efforts have been made on the search of new strategies to improve PBI proton conductivity consequently, in the last years, significant efforts have been based on the use of non-volatile dopants in the range of temperatures over 180 °C. In this regard, the incorporation of inorganic or organic fillers as doping agents such as silica,17 graphene oxide,18 metal organic frameworks,19 cobaltacarborane salts20 and other inorganic fillers21 has been proven to enhance PBI conductivity. Among all the different fillers, the use of ionic liquids in the field of energy storage and conversion has attracted increasing attention.22
Ionic liquids are room temperature molten salts usually composed entirely by ions. Outstanding ILs properties as negligible vapour pressure, high proton conductivity or its excellent chemical and thermal stability, make them suitable candidates as electrolytes in PEM operating at high temperature. Additionally, the high conductivity of ILs make them excellent candidates as electrolytes in PEM operating at high temperature. In the last years, the use of ILs as fillers in polymer-based membranes has been deeply studied in membrane separation processes,23 supramolecular chemistry,24,25 transport agents,26 drug sensing27 and fuel cell technology.28 The role of ILs as plasticizers and structuring agent in the preparing of polymeric membranes with improved proton conductivity have been also studied. Regarding PBI-based membranes, Hooshyari et al. synthetized PBI composite membranes doped with dicationic ionic liquid 1,6-di(3-methylimidazolium) hexane bis(hexafluorophosphate) (PDC6),29 with conductivities 0.078 S cm−1 at 180 °C after doping with phosphoric acid. The enhanced conductivity was associated with the three-dimensional network of ionic channels due to the high number of charge carriers of the dicationic ionic liquid. Alternatively, PBI membranes with a porosity of 65% were synthetized by casting method and subsequently immersed in an NMP/water (50/50) coagulation bath.30 After filling the porous structure with H-3-methylimidazolium bis(trifluoromethanesulfonyl)imide ([h-mim]NTf2), a proton conductivity of 1.86 mS cm−1 at 190 °C was observed. Niu et al. prepared a series of PBI composite membranes with different ionic liquids and different concentrations by casting method.31 Among the different membranes, that containing diethylmethylammonium trifluoromethanesulfonate ([dema][TfO]) exhibited the higher proton conductivity, with a value around 0.109 S cm−1 at 250 °C, as well as elevated stability at high temperatures. Despite several papers based on PBI and ionic liquids have been reported, most of them skip the analysis of proton conduction in terms of mobility and diffusivity of ions, which can give a profound understanding of the transport phenomenon along the membrane.
The study of conduction in polymeric membranes is highly associated to mobility and diffusivity of ions in the membrane. In this regard, different studies have been carried out to determine the ionic mobility and diffusivity under an applied electric field.32–35 In general, the study of the diffusivity and free charge anion density of composite polybenzimidazole membranes is commonly investigated by impedance spectroscopy measurements.36–43 Such studies can be obtained from frequency dependence of dielectric loss ε′′ and loss tan![[thin space (1/6-em)]](https://www.rsc.org/images/entities/char_2009.gif) δ using a different approach.44–53
δ using a different approach.44–53
In this paper, we report the preparation and characterization of PBI composite membranes containing 1-butyl-3-methylimidazolium bis(trifluoromethylsulfonyl)imide (BMIM-NTf2) with different BMIM-NTf2 contents. These composite membranes have been prepared by the casting method and characterized by scanning electron microscopy (SEM), thermogravimetric analysis (TGA), tensile testing and electrochemical impedance spectroscopy (EIS). Furthermore, from the electrode polarization (EP) model, which was previously introduced by Klein el at.,44 we have addressed our study towards the conductivity, diffusivity, and charge carrier's density analysis. Since the EP analysis overestimates the free ionic concentration with respect the total number of ions available from the preparation of the samples, we have recalculated the ionic concentration using the correction proposed by Wang et al.,54 obtaining more accurate values of diffusivity. These new results have been discussed with a correlation between the Debye length and porosity with the free ion density and diffusion coefficients. Finally, the Arrhenius behaviour of the conductivity and the Eyring theory have been used to determine the activation thermodynamics parameters, such as the values of activation enthalpy (ΔH**) and entropy (ΔS**) for all samples under study.
Experimental
Materials
PBI powder with a molecular weight of 51 kDa and purity >99.95% (molecular formula: [C20H12N4]n) was purchased from Danish Power Systems (Dapazol). Lithium chloride (LiCl), N,N-dimethylacetamide (DMAc) 99.8% and 1-butyl-3-methylimidazolium bis(trifluoromethylsulfonyl)imide (BMIM-NTf2) were purchased from Sigma-Aldrich and used without any further purification.Methods
Electron micrographs were obtained using a JEOL JEM-1010 high resolution microscope. Attenuated total reflection Fourier transform infrared (ATR-FTIR) spectra of the membranes were recorded on a Thermo Scientific FT-IR spectrometer Nicolet iS10 with a 4 cm−1 resolution between 400 and 4000 cm−1. Thermogravimetric analysis (TGA) was carried out using a TGA Q50 thermogravimetric analyser TGA Q50. The samples (8 mg) were weighed in a platinum crucible and heated under nitrogen atmosphere (60 mL min−1) from room temperature to 800 °C with a ramp of 10 °C min−1. The tensile properties of the membranes (five samples per membrane) were determined at room temperature using a Universal Testing Machine Shimadzu AGS-X at a crosshead rate of 10 mm min−1. Young's modulus E, tensile stress and strain at break were evaluated from the stress–strain curves. Electrochemical impedance measurements were carried out on composite membranes at temperatures in the range 20 to 200 °C and in the frequency window 10−1 to 107 Hz. The experiments were performed with 100 mV amplitude, using a Novocontrol broadband dielectric spectrometer integrated with an SR 830 lock-in amplifier with an Alpha dielectric interface following a previously described procedure.55,56 For that purpose, membranes of 10 mm diameter were cut and sandwiched between two gold circular electrodes coupled to the impedance spectrometer by co-pressing the made materials in a sandwich cell configuration. The assembly membrane-electrode was annealed in the Novocontrol setup under an inert dry nitrogen atmosphere before starting the measurement. To ensure the measurements reproducibility two temperature cycles were studied. In the first run, the temperature was gradually raised from ambient temperature to 200 °C and then lowered to 20 °C in steps of 20 °C recording the dielectric spectra in each step. In the second cycle of temperature, the dielectric spectra were collected in each step from 20 to 200 °C in steps of 20 °C. During the conductivity measurements, the temperature was kept constant at each measuring step controlled by a nitrogen jet (QUATRO from Novocontrol) with a temperature error of 0.1 °C during every single sweep in frequency.Preparation of the PBI solution
LiCl (0.1 wt%) was used as a stabilizer and was dissolved in DMAc with vigorous stirring (1 h at 50 °C) until affording a homogeneous solution. Next, PBI powder (10 wt%) was dissolved in the LiCl solution (in DMAc) and heated under reflux at 120 °C for 5–6 h, yielding the final 10 wt% PBI solution, which had a viscosity of 0.5 Pa s at 25 °C.Membrane preparation
The corresponding amount of BMIM-NTf2 was totally dissolved in a 10 wt% PBI solution to give a final solution with the corresponding amount (0, 1, 5, 10, 20, 50) wt% of BMIM-NTf2 with respect to PBI. Next, the homogeneous solution was stirred for 4–5 h at 60 °C. Then, the solution was cast onto a glass slide and dried at 80 °C for 10 h, then at 140 °C for 8 h, and finally at 120 °C under vacuum overnight. Membranes were immersed in boiling deionized water to remove any residual solvent (DMAc). Traces of the solvent were finally removed by drying at 160 °C for 16 h.Results and discussion
Membrane preparation and characterization
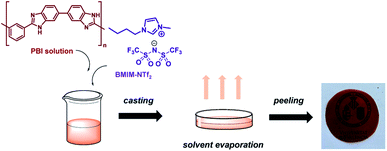
PBI composite membranes containing BMIM-NTf2 were prepared by solvent casting method (Fig. 1). To this end, a PBI solution was initially prepared by dissolving LiCl (0.5 wt%) as a stabilizer in DMAc under vigorous stirring. Next, PBI powder with a molecular weight of 50![[thin space (1/6-em)]](https://www.rsc.org/images/entities/char_2009.gif) 000 (10 wt%) was dissolved in a freshly prepared LiCl solution and heated under reflux at 120 °C for 5–6 h. Next, the corresponding amount (wt%) of BMIM-NTf2 was added to a PBI solution and the mixture was stirred for 4–5 h at 60 °C. Then, the solution was cast onto a glass slide and dried at 80 °C for 10 h, then at 140 °C for 8 h, and finally at 120 °C under vacuum overnight. Membranes were immersed in boiling deionized water to remove residual solvent. Finally, membranes were drying at 160 °C for 16 h to obtain flexible films with a thickness around 150 μm.
000 (10 wt%) was dissolved in a freshly prepared LiCl solution and heated under reflux at 120 °C for 5–6 h. Next, the corresponding amount (wt%) of BMIM-NTf2 was added to a PBI solution and the mixture was stirred for 4–5 h at 60 °C. Then, the solution was cast onto a glass slide and dried at 80 °C for 10 h, then at 140 °C for 8 h, and finally at 120 °C under vacuum overnight. Membranes were immersed in boiling deionized water to remove residual solvent. Finally, membranes were drying at 160 °C for 16 h to obtain flexible films with a thickness around 150 μm.
The internal morphology of different PBI composite membranes was analysed by scanning electron microscopy (SEM). The micrographs of the cross-section of composite membranes, taken at the same magnification to identify key structural features of the doped with BMIM-NTf2, are shown in Fig. 2. SEM micrograph of pure PBI membrane shows a typical brittle fracture surface associated with clear river lines with a smooth area on the fracture surface (Fig. 2a). The addition of BMIM-NTf2 into the PBI matrix highly affected the morphological properties of the material as shown in Fig. 2b–d, which show the SEM micrographs of composite membranes with different content of BMIM-NTf2. As expected, porosity increased with the increasing of the content of BMIM-NTf2, achieving a honeycomb-like porous structure at IL contents of 20 wt%. Fig. 2c reveals that the pore structure is quite homogeneous throughout the membrane, consisting mainly of open and connected pores. This confirms that the use of a relatively large quantity of ionic liquid promotes the formation of porous membranes, especially with changeable morphologies such as porous honeycomb, in accordance with previously reported composite membranes.57
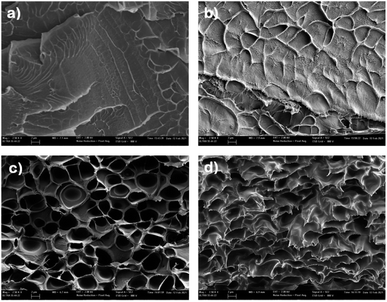 | ||
| Fig. 2 Scanning electron micrographs of the cryofractured cross-section of (a) pure PBI; (b) PBI-IL-10, (c) PBI-IL-20; (d) PBI-IL-50. | ||
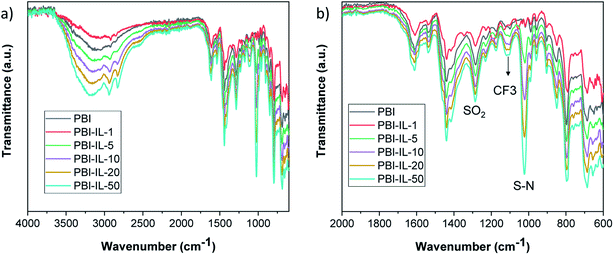
PBI composite membranes were characterized by means of Fourier transform infrared spectroscopy (FT-IR) to confirm the presence of BMIM-NTf2 and the corresponding spectra are shown in Fig. 3. The IR spectrum of pure PBI displayed a broad band associated to the N–H stretching around 3600–3100 cm−1. Additionally, the absorption peak of the imidazolate ring stretching (C–C) was also observed at 1460 cm−1. Characteristic absorption bands previously described for this polymer. The N–H stretching vibrations of the benzimidazole ring were observed at 3500–2800 cm−1, and the bands at 1630 cm−1 and 1605 cm−1 were assigned to C![[double bond, length as m-dash]](https://www.rsc.org/images/entities/char_e001.gif) N and C
N and C![[double bond, length as m-dash]](https://www.rsc.org/images/entities/char_e001.gif) C vibrations, respectively. After incorporation of the IL in the polymer matrix, the presence of 1-butyl-3-methylimidazolium bis(trifluoromethylsulfonyl)imide in the membranes was confirmed by the presence of peaks of the anion (NTf2−) at 1195 cm−1 (CF3 stretching), 1048 cm−1 (S–N stretching) and SO2 asymmetric and symmetric stretching at 1593 and 1167 cm−1, respectively.58
C vibrations, respectively. After incorporation of the IL in the polymer matrix, the presence of 1-butyl-3-methylimidazolium bis(trifluoromethylsulfonyl)imide in the membranes was confirmed by the presence of peaks of the anion (NTf2−) at 1195 cm−1 (CF3 stretching), 1048 cm−1 (S–N stretching) and SO2 asymmetric and symmetric stretching at 1593 and 1167 cm−1, respectively.58
Next, the thermal stability of PBI composite membranes with different loadings was analysed by TGA under a N2 atmosphere (Fig. 4a). For the pristine PBI membrane, an initial decrease around 3% weight occurred between 50 to 250 °C, caused by loss of absorbed molecules of water and residual DMAc. Then a gradual degradation of PBI polymeric main chain was observed at 250 and 630 °C.59 The BMIM-NTf2 ionic liquid is stable up to 400 °C with an almost total decomposition at 500 °C, being considered as a thermal stable IL.60 The presence of BMIM-NTf2 in PBI composites membranes was confirmed by decomposition in the range of temperature from 350 to 500 °C, being this weight loss more significant with the increase of BMIM-NTf2 loading in PBI composite membranes. The thermal degradation in this range of temperature occurs simultaneously with the primary polymer decomposition.17 The initial decomposition of PBI membranes with different BMIM-NTf2 contents is about 200 °C. The presence of BMIM-NTf2 in PBI membranes produced a slightly reduction in thermal stability compared to pristine PBI membrane.31 According to these results, it can be concluded that composite PBI membranes with BMIM-NTf2 possess enough thermal stability and are suitable for high temperature membranes applications. Stability and durability of polymer electrolyte membranes remains a major milestone to commercialization of PEMFC and its application in the industry. From a practical point of view, the oxidative stability of the composite membranes constitutes a critical parameter for their future applicability as PEMFCs. During the fuel cell performance, degradation of the membrane can occur by radical oxidation processes due to oxygenated radicals generated during the operation. Thus, the oxidative stability of the membranes was evaluated by Fenton's test, in which the weight loss of the membranes at different times are analysed after immersion in an oxidative 3% H2O2 aqueous solution containing 3 ppm Fe2+ at 80 °C (Fig. 4b). When compared with the pristine PBI membrane, composite membranes with lower BMIM-NTf2 loading (1 and 5 wt%) exhibited similar stability to radical oxidation. For higher IL loadings, the oxidative stability decreased and in the case of composite membrane with 50 wt% of IL, a very low stability in Fenton's solution was observed and the membrane broke after 12 h.
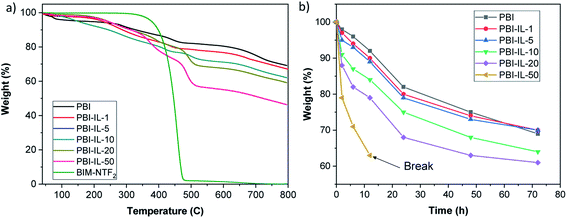 | ||
| Fig. 4 (a) TGA curves PBI composite membranes containing different loading of BMIM-NTf2 (wt%) under a N2 atmosphere. (b) Weight loss of the different PBI composite membranes after Fenton test. | ||
The addition of BMIM-NTf2 into the polymer matrix modified the mechanical behaviour of the membranes. With the intention to analyse the effect of different amounts of BMIM-NTf2 on the mechanical properties, tensile tests were performed and the corresponding values of the Young's modulus, tensile stress and strain at break are given in Table 1. The addition of BMIM-NTf2 at loadings higher than 5 wt% has a plasticizing effect on the polymer matrix, significantly reducing the elastic modulus of the PBI, as previously reported for other PBI composite membranes.61,62 Similarly, the tensile stress decreases almost 70% when a 50 wt% of is added into PBI. Moreover, the strain at break increasing with the content of BMIM-NTf2 observing an improvement on the toughness of the composite membranes, due to the plasticization effect of BMIM-NTf2. On the contrary, for composite membranes with low IL contents (<5 wt%), a slight increase in mechanical strength is observed in PBI composites, because of the interactions between the polymer matrix and the absorbed IL, as also reported by Chen et al. for cross-linked PBI composite membranes doped with polymeric ionic liquids (PILs).63
| Membrane | Young's modulus (MPa) | Tensile stress (MPa) | Strain at break (%) |
|---|---|---|---|
| PBI | 2728 ± 134 | 140 ± 6 | 14 ± 1 |
| PBI-IL-1 | 3171 ± 113 | 153 ± 2 | 11 ± 2 |
| PBI-IL-5 | 2866 ± 92 | 150 ± 1 | 10 ± 1 |
| PBI-IL-10 | 2325 ± 167 | 142 ± 4 | 12 ± 3 |
| PBI-IL-20 | 1363 ± 44 | 70 ± 3 | 27 ± 3 |
| PBI-IL-50 | 746 ± 33 | 46 ± 1 | 29 ± 2 |
Ionic conductivity
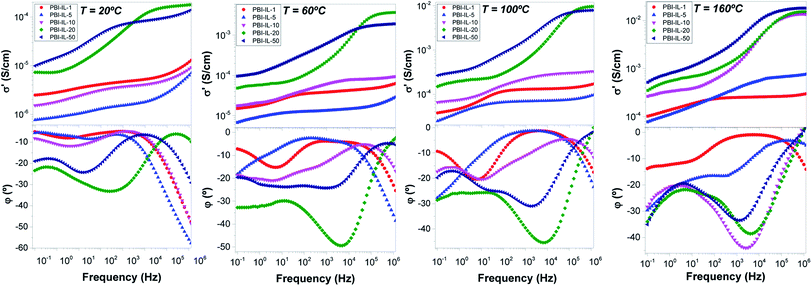
The conductivity through the membranes (i.e., in the transversal direction) was measured in the temperature range between 20 and 200 °C by electrochemical impedance spectroscopy in the frequency interval of 1 MHz to 0.1 Hz. Data for the real part of the conductivity in dry conditions were analysed in terms of the corresponding Bode diagrams in which the conductivity (in S cm−1) versus frequency (in Hz) for all ranges of temperatures (Fig. 5). The inspection of Fig. 5 (top) shows the variation of the real part of the conductivity versus frequency for the membranes at 20, 60, 100 and 160 °C, respectively. On the other hand, Fig. 5 (bottom) shows the variation of the phase angle (φ) versus frequency at the same temperatures. A closer inspection of both figures reveals that conductivity tends to a constant value (plateau) when the phase angle (φ) tends to zero or to a maximum. A transition zone was also observed in the range of 104 to 101 Hz, depending on the BMIM-NTf2 loading. Finally, a section where the conductivity decreases when the frequency decreases was observed. The first process is directly related with the resistance/stability of the membrane and the second process is related with the diffusion (mass transfer) due to the mobility of the NTf2− anions. The reported values of the conductivity were obtained from the plateau at the frequency where the phase angle was practically zero. For example, the conductivity values obtained at 80 °C were 4.7 × 10⁻⁶, 1.4 × 10⁻⁵, 1.7 × 10⁻⁴, 6.5 × 10⁻³, 4.5 × 10⁻³ and 1.5 × 10⁻³ S cm−1, for the composite membranes containing amounts of BMIM-NTf2 of 1, 5, 10, 20 and 50 wt%, respectively.The frequency range for the highest values of the conductivity was 104 to 106 Hz in the sample with higher BMIM-NTf2 content (PBI-IL-50). Furthermore, the conductivity in that frequency range is practically constant and this behaviour is related with a good interaction of the polymer matrix with the IL. On the other hand, the conductivity of pristine PBI at 160 °C was around of 2.4 × 10⁻¹² S cm−1, being significantly lower than the conductivities of the composite membranes. The variation in conductivity with the IL loading can be rationalized considering the concentration of the mobile anions and their mobility associated with the strength of the intermolecular interactions between the species present in the composite membrane. On the other hand, the values reported in this work are higher than those of phosphoric acid doped PBI composite membranes containing a 5 wt% of BMIM with different counter anions.64
The behaviour of the membranes is different at low temperatures than at high temperatures. At low temperatures, for example at 60 °C, the conductivity values followed the trend σ′ (PBI-IL-20) > σ′ (PBI-IL-50) > σ′ (PBI-IL-10) > σ′ (PBI-IL-5) > σ′ (PBI-IL-1). The conductivities at 60 °C were 1.9 × 10⁻³, 1.2 × 10⁻³, 8.1 × 10⁻⁵, 1.3 × 10⁻⁵ and 3.8 × 10⁻⁵ S cm−1; while at 160 °C, increased to 1.9 × 10⁻², 1.5 × 10⁻², 1.3 × 10⁻³, 5.9 × 10⁻⁴ and 2.5 × 10⁻⁴ S cm−1 for PBI-IL-50, PBI-IL-20, PBI-IL-10, PBI-IL-5 and PBI-IL-1, respectively. The different values of conductivity indicate a deep synergistic effect between the doping agent, i.e., the IL, and the polymer. It is noteworthy that these conductivities were obtained without the use of acidic doping agents such as phosphoric acid or other acids, which typically help to increase proton conductivity in PBI-based membranes.65 In this regard, no acid leaching problems can be associated to the use of these composite membranes. In line with this, no leaching of BMIM-NTf2 was monitored in a long-term stability test of these composite membranes, whose conductivity remained constant after 96 h.
These values of conductivity at elevated temperatures are higher than the values found for mixtures of zwitterionic ionic liquids and LiNTf2 even with a large amount of NTf2, or even for polymer composite materials prepared with such mixtures (PILs), where the conductivity was around 10−2 S cm−1 above 100 °C,66 and also in case in which ionic liquids were absorbed on a crosslinked polymeric ionic-like liquids (SILLPs) based on styrenic monomer containing imidazolium fragments mixed with VBIM[NTf2], BMIN[NTf2] and BMIM[Cl], whose conductivities were 5 × 10⁻⁷, 5.4 × 10⁻⁵ and 0.17 × 10⁻³ S cm−1 for the samples VBIM[NTf2], BMIN[NTf2] and BMIM[Cl], respectively.39
The conductivity σ′ is characterized by a plateau, which is independent of the frequency and its value is a practically constant in a widely interval of frequencies. This value corresponds to direct-current conductivity (σdc) of the sample. Finally, we have observed a deviation from σdc in the spectrum of the conductivity in the range of low frequencies due to the electrode polarization (EP) effect resulting from the blocking electrodes, which means that the EP is great in those materials. Fig. 6 shows the conductivity values for all samples as a function of wt% of BMIM-NTf2 at 60 and 160 °C. As observed, conductivity at 60 °C increases with the loading of BMIM-NTf2 up to a 20 wt%, where the conductivity shows the highest value of 3.71 × 10⁻³ S cm−1. On the other hand, conductivity values at 160 °C indicate that the conductivity of the samples increases when wt% of ionic liquid content increases, reaching a value of 1.9 × 10⁻² S cm−1 for 50 wt% of BMIM-NTf2. Note that this value is quasi the limit value corresponding to the IL conductivity, whose conductivity was 3.4 × 10⁻² S cm−1. Probably, due to the viscosity reduction of the ionic liquid as the temperature increases, its plasticizing effect on the membrane is stronger, facilitating segmental chains motion and promoting the mobility of the charge carriers through the membrane via Grotthuss mechanism.
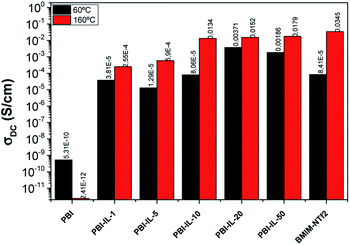 | ||
| Fig. 6 Variation of the conductivity of PBI-IL-x (x = 1, 5, 10, 20, and 50 wt%) membranes at 60 and 160 °C, respectively. | ||
Fig. 7 shows the variation of the conductivity with temperature in PBI-IL-x, where the experimental values of conductivity have been fitted using the expression:
 | (1) |
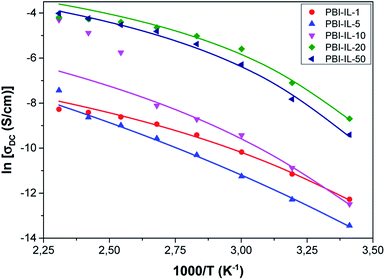 | ||
| Fig. 7 Temperature dependence of the conductivity for PBI-IL-x. Symbols represent to the experimental values and the lines the fit to a Vogel–Fulcher–Tammann behaviour. | ||
From Fig. 7, a Vogel–Fulcher–Tammann behaviour can be observed, as shown by the lines of the fitting of the experimental data. Accordingly, the values of the parameters, σ∞, B and T0 for a Vogel–Fulcher–Tammann fit were determined and are listed in Table 2.
| Sample | ΔH** (kJ mol−1) | ΔS** (J mol−1 K−1) |
|---|---|---|
| PBI | 31 ± 2 | −38 ± 3 |
| PBI-IL-1 | 39 ± 3 | −18 ± 2 |
| PBI-IL-5 | 42 ± 3 | −17 ± 2 |
| PBI-IL-10 | 53 ± 4 | 29 ± 3 |
| PBI-IL-20 | 52 ± 4 | 58 ± 5 |
| PBI-IL-50 | 56 ± 4 | 67 ± 7 |
| BMIM-NTf2 | 29 ± 2 | −39 ± 3 |
From the values of parameter B, we have calculated the thermal activation energy. The obtained values followed the trend Eact (PBI) = 20.4 kJ mol−1 or 0.21 eV > Eact (PBI-IL-1) = 17.7 kJ mol−1 or 0.18 eV > Eact (PBI-IL-5) = 16.0 kJ mol−1 (or 0.166 eV) > Eact (PBI-IL-10) = 7.9 kJ mol−1 (or 0.082 eV) > Eact (PBI-IL-50) = 7.8 kJ mol−1 (or 0.08 eV) > Eact (PBI-IL-20) = 4.2 kJ mol−1 (or 0.044 eV), considering all the range of temperatures, and showing that the conduction process is more favourable for the sample PBI-IL-20. This low activation energy values are in accordance with the observed excellent ion mobility reported by Wang and co-workers,67 where their superprotonic conduction through one-dimensional ordered alkali metal ion chains in a lanthanide-organic framework with conductivities in the order of 10−2 S cm−1 (at 90 °C and 90% RH) and ultra-low activation energies of 0.1 eV. On the other hand, our results are comparable with the observed protonic conductivity in a family of hexacyanocobaltates with divalent transition metals(II), M3[Co(CN)6]2·H2O (M = Ni, Co, Fe, Mn and Cd) with cubic crystal structures. These results confirm that the prepared composite membranes containing BMIM-NTf2 can be used as mixed matrix membranes (MMMs), providing excellent conductivity and diffusivity when the polymeric matrix contains mobile ions.
The conduction study also shows that all PBI-IL-x composite membranes display activation energy values lower than Nafion membranes (10.5 kJ mol−1)68 and significantly smaller than the previous values reported for polycrystalline salts of CsH2PO4 and of CsH2PO4/silica composite, which values are around 0.4–0.5 eV (38.6–48.2 kJ mol−1) in the same range of temperatures.69 Similar results are found when we compare our compounds with different ortho-phosphates, based on the partial substitution of Cs+ by Rb+ and Ba2+, to give Cs1−x RbxH2PO4 and Cs1−x Ba0.5xH2PO4.38 On the other hand, the calculated activation energies are quite similar to those of membranes prepared with powder material of Na[COSANE], Li[COSANE] and H[COSANE], whose values are 7.8, 7.9 and 5.6 kJ mol−1, respectively.37 In summary, it can be concluded that the ionic transport of this type of IL-based membranes might have occurred by both the Grotthuss as well as the vehicular mechanism, but predominantly by the Grotthuss mechanism.
To proceed with the analysis of the differences observed from conductivity between the samples PBI-IL-x and the activation energy calculated, the temperature dependence of conductivity can be better expressed in terms of Eyring's absolute rates theory as:
 | (2) |
In this regard, eqn (2) constitutes an Arrhenius law in which ΔG** = ΔH** − TΔS** has been taken into account, where, C is the pre-factor only dependent of the frequency, ΔG** is the activation Gibbs free energy of the microscopic conduction process in the sample, ΔS** is related with the thermodynamic excess of entropy associated with the macroscopic structural changes of the material that give rise to entropic restrictions during the motion of the charges carrier, ΔH** is the enthalpy change associated to the conduction process, T the absolute temperature and R the gas constant.
Since the charge transport is thermally activated, the energy ΔG** involves the formation of the activated complex linked to ion hopping. The values of ΔH** and ΔS** can be obtained from the slope and the T-intercept of the plot ln(σ/T) vs. 1000/T, respectively (see Fig. 8). The values of activation enthalpy (ΔH**) and entropy (ΔS**) for all samples studied are shown in Table 3. For these data, it can be observed that for most samples, ΔH** and ΔS** increases with the amount of BMIM-NTf2 in the polymeric matrix.
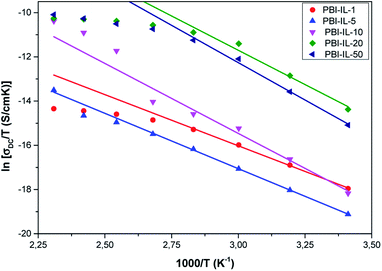 | ||
| Fig. 8 Temperature dependence of the dc-conductivity (σdc) for all the samples studied in all the range of temperatures. | ||
| Membrane | ln[σ∞ (S cm−1)] | B (K) | T0 (K) | χ2 |
|---|---|---|---|---|
| PBI | −0.41 | 2454 | 72 | 0.00424 |
| PBI-IL-1 | −4.71 | 2134 | 191 | 0.0205 |
| PBI-IL-5 | −1.77 | 1922 | 129 | 0.0328 |
| PBI-IL-10 | −2.54 | 950 | 198 | 0.0331 |
| PBI-IL-30 | −1.39 | 442 | 233 | 0.0958 |
| PBI-IL-50 | −1.43 | 503 | 231 | 0.157 |
Diffusivity and free anion concentration
Next, the ionic charge density and ion mobility were obtained from the analysis of tan![[thin space (1/6-em)]](https://www.rsc.org/images/entities/char_2009.gif) δ. Considering that cation and anion have approximately the same mobility (μ) and neglecting ion–ion interactions, the conductivity, σdc, can be expressed in terms of the ion concentration and ionic mobility according to eqn (3):
δ. Considering that cation and anion have approximately the same mobility (μ) and neglecting ion–ion interactions, the conductivity, σdc, can be expressed in terms of the ion concentration and ionic mobility according to eqn (3):| σdc = nq|Z|μ | (3) |
In binary systems such as salt/polymer solutions, both anions, cations and charged aggregates can act as mobile species. Therefore, calculating the concentration of mobile charges involved on conductivity is not trivial. Given the values reported in this work for pristine PBI membrane (5.3 × 10⁻¹⁰ S cm−1 and 2.4 × 10⁻¹² S cm−1 at 60° and 160 °C, respectively), we believe that the PBI matrix does not provide mobile species and the contribution to the total density of charge carriers can be neglected. Moreover, we consider that NTf2− anions are the main mobile species in these membranes.71 Basic sites on the PBI structure interact with BMIM+ cations so the mobility is reduced when compared to that of NTf2− anions, which are mainly responsibly of the charge transport across the membrane by both Grotthuss mechanism among the network stablished between BMIM+ and the polymeric matrix or vehicular mechanism. Therefore, following the polarization of electrodes model (EP) described by Trukhan70 and later developed by Sørensen and Compañ,49 the diffusion coefficient of the free charge mobiles can be estimated analysing the dielectric spectra of electrode polarization following the simple Debye relaxation model from the maximum of loss tangent. Considering the NTf2− anions as a main contribution to the mobility of charges trough the polymeric matrix, the effective diffusion coefficient D can be estimated as72
 | (4) |
![[thin space (1/6-em)]](https://www.rsc.org/images/entities/char_2009.gif) δ), L is the sample thickness and (tan
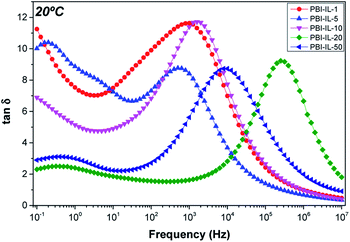
δ), L is the sample thickness and (tan![[thin space (1/6-em)]](https://www.rsc.org/images/entities/char_2009.gif) δ)max the value of loss tangent when the spectrum reaches a maximum at the frequency ω. Fig. 9 shows the values of loss tangent as a function of frequency for the composite membranes PBI-IL-x at 20 °C. Similar curves have been observed for the other temperatures under study. A close inspection of Fig. 9 shows a defined maximum at different frequencies for loss tangent. This maximum varies depending on temperature. The same phenomena were observed for the other samples whose maximum in loss tangent was dependent on the BMIM-NTF2 loading. The position of this peak is dependent of the temperature for each sample.
δ)max the value of loss tangent when the spectrum reaches a maximum at the frequency ω. Fig. 9 shows the values of loss tangent as a function of frequency for the composite membranes PBI-IL-x at 20 °C. Similar curves have been observed for the other temperatures under study. A close inspection of Fig. 9 shows a defined maximum at different frequencies for loss tangent. This maximum varies depending on temperature. The same phenomena were observed for the other samples whose maximum in loss tangent was dependent on the BMIM-NTF2 loading. The position of this peak is dependent of the temperature for each sample.
The diffusivity values (D) obtained using eqn (4) are shown in Fig. 10a as a function of temperature. From this figure, a diffusivity effect similar to that observed in conductivity (see VFT plot in Fig. 7) can be observed. From the analysis of our results, it can be concluded that diffusivity is affected by different structural parameters of the films. We notice that diffusivity of the pure BMIM-NTF2 is higher than that of the composite membranes, and a strong change in diffusivity with temperature is clearly observed for all the composite membranes, where the corresponding diffusion coefficients have an anomalous temperature variation, particularly in the range below 100 °C. This abnormal variation is possibly due to the free charge density variations probably due to both the anion binding energies and stabilization energy. A closer inspection of diffusion coefficients variation shows that a decrease in the coefficient of diffusion is observed for PBI-IL-1 and PBI-IL-20 composite membranes.
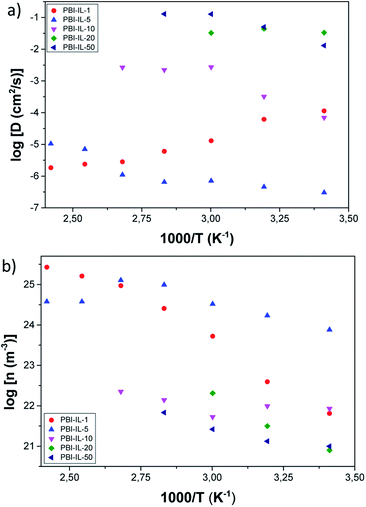 | ||
| Fig. 10 (a) Temperature dependence of diffusion coefficient of PBI-IL-x composite membranes. (b) Temperature dependence of the free ionic charge density of PBI-IL-x composite membranes. | ||
The ionic charge density was obtained from conductivity and diffusivity values as:
 | (5) |
A clear correlation is shown between diffusivity and diffusion coefficient, where a reciprocal variation between free anionic charge density and diffusivity with the temperature is clearly observed, at least in the interval comprised between 20 and 120 °C. On the other hand, the values of the mobile ion concentration are higher than those from stoichiometric calculations, which provide a total concentration of anions (ntotal), at room temperature as
 | (6) |
Thus, since the analysis based on electrode polarization in case of composite membranes with ILs produces an overestimation of the diffusivity and an underestimation of the charge carriers density. It is necessary to correct the diffusivity by a factor  obtaining a corrected diffusivity value as:
 | (7) |
 | (8) |
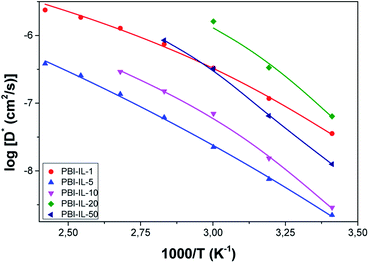 | ||
| Fig. 11 Temperature dependence of the corrected diffusion coefficient of PBI-IL-x composite membranes. | ||
If L/LD ≫ 1 the electrode polarization can be represented by a single Debye relaxation, where the complex dielectric permittivity is given as
 | (9) |
 , and τEP the electrode polarization relaxation time. When σdc is lower and frequency of the maximum peak in loss tangent is higher than 1000 Hz, as occurred with these membranes in the range of temperatures under study. Then, the loss tangent obtained from eqn (9), where the real and imaginary parts have been previously separated, can be expressed in terms of:
 | (10) |
Therefore, as previously described,44,72 the frequency at the peak of tan![[thin space (1/6-em)]](https://www.rsc.org/images/entities/char_2009.gif) δ in Fig. 9 can be obtained from the fit of loss tangent by the expression:
δ in Fig. 9 can be obtained from the fit of loss tangent by the expression:
 | (11) |
![[thin space (1/6-em)]](https://www.rsc.org/images/entities/char_2009.gif) dmax) can be expressed as:
dmax) can be expressed as:
 | (12) |
 | (13) |
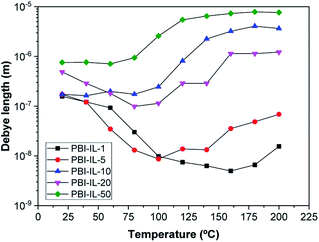
The values of the Debye length calculated from eqn (13) are displayed in Fig. 12. It should be noted that the trend for the calculated Debye length is: LD (1%) < LD (5%) < LD (20%) < LD (10%) < LD (50%), indicating that conductivity and diffusivity are in correlation with the thickness of Debye length. In this regard, polymeric membranes PBI-IL-x displayed LD values in the range between 5–1000 nm. As could be expected, the Debye layer thickness varies with the temperature and reciprocally with the free charge density embedded into the membranes.
Conclusions
In conclusion, PBI composite membranes containing 1-butyl-3-methylimidazolium bis(trifluoromethylsulfonyl)imide as an organic filler at different loadings have been prepared by casting method. These membranes displayed thermal, mechanical, and chemical stability to be used as polymer electrolyte membranes, reaching conductivities up to 0.018 S cm−1 at 160 °C. Based on experimental measurements of dielectric permittivity and conductivity from EIS, the ionic diffusion coefficient and free charge density of BMIM-NTf2 in composite PBI membranes has been determined using a single Debye model relaxation. In addition, the Debye length of the system were calculated. The studied composite PBI membranes containing BMIM-NTf2 showed a significant increment of dc-conductivity as temperature raises. The conductivity values were obtained from Bode diagrams. Temperature dependence of the dc-conductivity is well described by a Vogel–Fulcher–Tammann equation, where it could also be observed an increment in conductivity with the amount of free ionic liquid. From the values of activation energies obtained from VFT, it can be postulated that the anionic conduction in the films might occur following two processes, the hopping between the imidazolium units, and a vehicle-type mechanism.From an analysis based on the Eyring's absolute rates theory, it was observed that both the activation of entropy, and the enthalpy change increased with the loading of ILs for all samples. It is worthmentioning that the activation of entropy becomes negative for the membranes containing 1% and 5% of BMIM-NTf2. It was interpreted that such values could be related with a decrease in the free volume, as the amount of free IL increases. Debye length was calculated from the parameters of the tan![[thin space (1/6-em)]](https://www.rsc.org/images/entities/char_2009.gif) δ fitting and the behaviour of LD was correlated with diffusivity and charge carrier's density. The results reported in this paper could contributed to a suitable determination of transport properties in electrochemical system, from dielectric spectroscopy measurements, and to relate several aspects of the characterization and behaviour of the material to the Debye length in the system.
δ fitting and the behaviour of LD was correlated with diffusivity and charge carrier's density. The results reported in this paper could contributed to a suitable determination of transport properties in electrochemical system, from dielectric spectroscopy measurements, and to relate several aspects of the characterization and behaviour of the material to the Debye length in the system.
Conflicts of interest
The authors declare no competing interests or other interests that might be perceived to influence the results and discussion reported in this paper.Acknowledgements
This work was sponsored by the Ministerio de Economia y Competitividad (MINECO) under the project ENE/2015-69203-R. The authors acknowledge the Electron Microscopy Service from Universitat Politècnica de València for the use of instruments and staff assistance.Notes and references
- T. Sata, Ion exchange membranes: preparation, characterization, modification and application, RSC, Cambridge, United Kingdom, 2004 Search PubMed.
- K. D. Kreuer, J. Membr. Sci., 2001, 185, 29–39 CrossRef CAS.
- Y. Shao, G. Yin, Z. Wang and Y. Gao, J. Power Sources, 2007, 167, 235–242 CrossRef CAS.
- G. Alberti and M. Casciola, Solid State Ionics, 2001, 145, 3–16 CrossRef CAS.
- Q. F. Li, R. H. He, J. O. Jensen and N. J. Bjerrum, Chem. Mater., 2003, 15, 4896–4915 CrossRef CAS.
- G. Alberti and M. Casciola, Annu. Rev. Mater. Res., 2003, 33, 129–154 CrossRef CAS.
- T. Kim, Y. W. Choi, C. S. Kim, T. H. Yanga and M. N. Kim, J. Mater. Chem., 2011, 21, 7612–7621 RSC.
- K. Matsumoto, T. Higashihara and M. Ueda, Macromolecules, 2009, 42, 1161–1166 CrossRef CAS.
- T. Ko, K. Kim, B. K. Jung, S. H. Cha, S. K. Kim and J. C. Lee, Macromolecules, 2015, 48, 1104–1114 CrossRef CAS.
- Y. P. Zhang, M. Z. Yue and Y. Chen, Adv. Mater. Res., 2011, 239–242, 3032–3038 CAS.
- H. R. Allcock and R. M. Wood, J. Polym. Sci., Part B: Polym. Phys., 2006, 44, 2358–2368 CrossRef CAS.
- Z. Li, W. Dai, L. Yu, J. Xi, X. Qiu and L. Chen, J. Power Sources, 2014, 57, 221–229 CrossRef.
- R. Haider, Y. Wen, Z.-F. Ma, D. P. Wilkinson, L. Zhang, Xi. Yuan, S. Song and J. Zhang, Chem. Soc. Rev., 2021, 50, 1138–1187 RSC.
- S. S. Araya, F. Zhou, V. Liso, S. L. Sahlin, J. R. Vang, S. Thomas, X. Gao, C. Jeppesen and S. K. Kaer, Int. J. Hydrogen Energy, 2016, 41, 21310–21344 CrossRef CAS.
- K. A. Perry, K. L. More, E. A. Payzant, R. A. Meisner, B. G. Sumpter and B. C. Benicewicz, J. Polym. Sci., Part B: Polym. Phys., 2014, 52, 26–35 CrossRef CAS.
- F. Mack, K. Aniol, C. Ellwein, J. Kerres and R. Zeis, J. Mater. Chem. A, 2015, 3, 10864–10874 RSC.
- J. Escorihuela, A. García-Bernabé, A. Montero, A. Andrio, O. Sahuquillo, E. Giménez and V. Compañ, Polymers, 2019, 11, 1182 CrossRef CAS.
- J. Kim, K. Kim, T. Ko, J. Han and J. C. Lee, Int. J. Hydrogen Energy, 2021, 46, 12254–12262 CrossRef CAS.
- I. Fuentes, A. Andrio, A. Garcia-Bernabé, J. Escorihuela, C. Viñas, F. Teixidor and V. Compañ, Phys. Chem. Chem. Phys., 2018, 20, 10173–10184 RSC.
- J. Escorihuela, Ó. Sahuquillo, A. García-Bernabé, E. Giménez and V. Compañ, Nanomaterials, 2018, 8, 775 CrossRef PubMed.
- J. Escorihuela, J. Olvera-Mancilla, L. Alexandrova, L. F. del Castillo and V. Compañ, Polymers, 2020, 12, 1861 CrossRef CAS PubMed.
- T. Yamamoto, R. Matsubara and T. Nohira, J. Chem. Eng. Data, 2021, 66, 1081–1088 CrossRef CAS.
- Y. Tu, H. Yu, W. He, Z. Zhou, W. Liu, F. Zhang, Y. Qu and Z. Ren, Sep. Purif. Technol., 2021, 266, 118596 CrossRef CAS.
- L. González-Mendoza, J. Escorihuela, B. Altava, M. I. Burguete and S. V. Luis, Org. Biomol. Chem., 2015, 13, 5450–5459 RSC.
- A. Valls, B. Altava, M. I. Burguete, J. Escorihuela, V. Martí-Centelles and S. V. Luis, Org. Chem. Front., 2019, 6, 1214–1225 RSC.
- L. González-Mendoza, B. Altava, M. I. Burguete, J. Escorihuela, E. Hernando, S. V. Luis, R. Quesada and C. Vicent, RSC Adv., 2015, 5, 34415–34423 RSC.
- S. Afshar, H. A. Zamani and H. Karimi-Maleh, J. Pharm. Biomed. Anal., 2020, 188, 113393 CrossRef CAS PubMed.
- S. Rogalsky, J. F. Bardeau, S. Makhno, O. Tarasyuk, N. Babkina, T. Cherniavska, M. Filonenko and K. Fatyeyeva, Mater. Today Chem., 2021, 20, 100453 CrossRef.
- K. Hooshyari, M. Javanbakht and M. Adibi, Int. J. Hydrogen Energy, 2016, 41, 10870–10883 CrossRef CAS.
- E. van de Ven, A. Chairuna, G. Merle, S. P. Benito, Z. Borneman and K. Nijmeijer, J. Power Sources, 2013, 222, 202–209 CrossRef CAS.
- B. Niu, S. Luo, C. Lu, W. Yi, J. Liang, S. Guo, D. Wang, F. Zeng, S. Duan, Y. Liu, L. Zhang and B. Xu, Solid State Ionics, 2021, 361, 11556 CrossRef.
- P. R. Sorensen and T. Jacobsen, Electrochim. Acta, 1982, 27, 1671–1675 CrossRef.
- M. Watanabe, K. Sanui and N. Ogata, J. Appl. Phys., 1985, 57, 123 CrossRef CAS.
- M. Watanabe, S. Nagano, K. Sanui and N. Ogata, Solid State Ionics, 1988, 28–30, 911–917 CrossRef.
- H. Schütt, Solid State Ionics, 1994, 70–71, 505–510 CrossRef.
- V. Compañ, S. Mollá, E. García-Verdugo, S. V. Luis and M. I. Burguete, J. Non-Cryst. Solids, 2012, 358, 1228–1237 CrossRef.
- I. Fuentes, A. Andrio, F. Teixidor, C. Viñas and V. Compañ, Phys. Chem. Chem. Phys., 2017, 19, 15177–15186 RSC.
- A. Andrio, S. I. Hernández, C. García-Alcántara, L. F. del Castillo, V. Compañ and I. Santamaría-Holek, Phys. Chem. Chem. Phys., 2019, 21, 12948–12960 RSC.
- B. Altava, V. Compañ, A. Andrio, L. F. del Castillo, S. Mollá, M. I. Burguete, E. García-Verdugo and S. V. Luis, Polymer, 2015, 72, 69–81 CrossRef CAS.
- A. García-Bernabé, A. Rivera, A. Granados, S. V. Luis and V. Compañ, Electrochim. Acta, 2016, 213, 887–897 CrossRef.
- A. García-Bernabé, V. Compañ, M. I. Burguete, E. García-Verdugo, N. Karbass, S. V. Luis and E. Riande, J. Phys. Chem. C, 2010, 114, 7030–7037 CrossRef.
- A. Munar, A. Andrio, R. Iserte and V. Compañ, J. Non-Cryst. Solids, 2011, 357, 3064–3069 CrossRef CAS.
- J. Vega, A. Andrio, A. A. Lemus, L. F. Del Castillo and V. Compañ, Electrochim. Acta, 2017, 258, 153–166 CrossRef CAS.
- R. J. Klein, S. Zhang, S. Duo, B. H. Jones, R. H. Colby and J. Runt, J. Chem. Phys., 2006, 124, 144903 CrossRef PubMed.
- T. M. W. J. Bandara, M. A. K. L. Dissanayake, I. Albinsson and B. E. Mellander, Solid State Ionics, 2011, 189, 63–68 CrossRef CAS.
- J. R. Macdonald, Phys. Rev., 1953, 92, 4–17 CrossRef CAS.
- R. Coelho, Rev. Phys. Appl., 1983, 18, 137–146 CrossRef.
- T. S. Sørensen and V. Compañ, J. Chem. Soc., Faraday Trans., 1995, 91, 4235–4250 RSC.
- V. Compañ, T. S. Sørensen, R. Diaz-Calleja and E. Riande, J. Appl. Phys., 1996, 79, 403–411 CrossRef.
- A. K. Jonscher, Nature, 1977, 267, 673–679 CrossRef CAS.
- A. K. Jonscher, Dielectric Relaxation in Solids, Chelsea Dielectric Press Limited, London, United Kingdom, 1983 Search PubMed.
- I. Fuentes, A. Andrio, A. Garcia-Bernabé, J. Escorihuela, C. Viñas, F. Teixidor and V. Compañ, Phys. Chem. Chem. Phys., 2018, 20, 10173–10184 RSC.
- A. Barjola, J. Escorihuela, A. Andrio, E. Giménez and V. Compañ, Nanomaterials, 2018, 8, 1042 CrossRef PubMed.
- Y. Wang, F. Fan, A. L. Agapov, T. Saito, J. Yang, X. Yu, K. Hong, J. Mays and A. P. Sokolov, Polymer, 2014, 55, 4067–4076 CrossRef CAS.
- J. Olvera-Mancilla, J. Escorihuela, L. Alexandrova, A. Andrio, A. García-Bernabé, L. F. del Castillo and V. Compañ, Soft Matter, 2020, 16, 7624–7635 RSC.
- S. Saber, B. Marí, A. Andrio, J. Escorihuela, N. Khattab, A. Eid, A. E. Nahrawy, M. Abo Aly and V. Compañ, Nanomaterials, 2021, 11, 1093 CrossRef CAS PubMed.
- S. H. Kim, J. W. Seo and U. S. Shin, Bull. Korean Chem. Soc., 2015, 36, 643–649 CAS.
- K. Hanke, M. Kaufmann, G. Schwaab, M. Havenith, C. T. Wolke, O. Gorlova, M. A. Johnson, B. Prasad Kar, W. Sander and E. Sanchez-Garcia, Phys. Chem. Chem. Phys., 2015, 17, 8518–8529 RSC.
- S. Wang, C. J. Zhao, W. J. Ma, G. Zang, Z. G. Liu, J. Ni, M. Y. Li, N. Zang and H. Na, J. Membr. Sci., 2012, 411, 54–63 CrossRef.
- Y. Cao and M. T. Tiancheng, Ind. Eng. Chem. Res., 2014, 53, 8651–8664 CrossRef CAS.
- R. Mejri, J. C. Dias, A. C. Lopes, S. Bebes-Hentati, M. M. Silva, G. Botelho, A. Mao de Ferro, J. M. M. S. Esparança, A. Maceiras, J. L. Lazas, J. L. Vilas, L. M. León and S. Lanceros-Mendez, Eur. Polym. J., 2015, 71, 304–313 CrossRef CAS.
- X. Song, L. Ding, L. Wang, M. He and X. Han, Electrochim. Acta, 2019, 295, 1034–1043 CrossRef CAS.
- H. Chen, S. Wang, J. Li and F. Liu, J. Taiwan Inst. Chem. Eng., 2019, 95, 185–194 CrossRef CAS.
- J. Escorihuela, A. García-Bernabé, Á. Montero, Ó. Sahuquillo, E. Giménez and V. Compañ, Polymers, 2019, 11, 732 CrossRef CAS PubMed.
- J. Escorihuela, A. García-Bernabé and V. Compañ, Polymers, 2020, 12, 1374 CrossRef CAS PubMed.
- D. Valverde, A. García-Bernabé, A. Andrio, E. García-Verdugo, S. V. Luis and V. Compañ, Phys. Chem. Chem. Phys., 2019, 21, 17923–17932 RSC.
- X. Wang, Y. Wang, M. A. Silver, D. Gui, Z. Bai, Y. Wang, W. Liu, L. Chen, J. Diwu, Z. Chaia and S. Wang, Chem. Commun., 2018, 54, 4429–4432 RSC.
- K. P. Devproshad, R. McCreery and K. Karanb, J. Electrochem. Soc., 2014, 161, F1395–F1402 CrossRef.
- J. Otomo, L. Minagawa, C. J. Wen, K. Eguchi and H. Takahashi, Solid State Ionics, 2003, 156, 357–369 CrossRef CAS.
- E. M. Trukhan, Phys. Solid State, 1963, 4, 2560–2570 Search PubMed.
- V. Compañ, J. Escorihuela, J. Olvera, A. García-Bernabé and A. Andrio, Electrochim. Acta, 2020, 354, 136666 CrossRef.
- T. S. Sørensen, V. Compañ and R. Diaz-Calleja, J. Chem. Soc., Faraday Trans., 1996, 92, 1947–1957 RSC.
| This journal is © The Royal Society of Chemistry 2021 |

