
 Open Access Article
 This Open Access Article is licensed under a Creative Commons Attribution-Non Commercial 3.0 Unported Licence
Fabrication of a hybrid ultrafiltration membrane based on MoS2 modified with dopamine and polyethyleneimine
Xin Wen a,
Can He*b,
Yuyan Haib,
Xiaofan Liub,
Rui Mab,
Jianyu Sunb,
Xue Yangb,
Yunlong Qib,
Jingyun Chenb and
Hui Weib
a,
Can He*b,
Yuyan Haib,
Xiaofan Liub,
Rui Mab,
Jianyu Sunb,
Xue Yangb,
Yunlong Qib,
Jingyun Chenb and
Hui Weib
aCollege of Geology and Environment, Xi'an University of Science and Technology, Xi'an 710054, China
bNational Institute of Clean-and-Low-Carbon Energy, Beijing 102211, China. E-mail: can.he.a@chnenergy.com.cn
First published on 2nd August 2021
Abstract
The hydrophobicity of ultrafiltration membranes is the main cause of membrane fouling and reduced permeability, so it is necessary to improve the hydrophilicity and anti-fouling performance of ultrafiltration membrane materials. MoS2 nanoparticles that were modified with polydopamine (PDA) and polyethyleneimine (PEI), named MoS2-PDA-PEI, were added to fabricate a polyethersulfone ultrafiltration membrane (PES/MoS2-PDA-PEI) for the first time. The effects of modified MoS2 nanoparticles on membrane performance were clarified. The results indicated that the permeability, rejection, and anti-fouling capability of the hybrid PES/MoS2-PDA-PEI membrane have been improved compared with the pristine PES membrane. When the content of MoS2-PDA-PEI nanoparticles in the membrane is 0.5%, the pure water flux of the hybrid membrane reaches 364.03 L m−2 h−1, and the rejection rate of bovine serum albumin (BSA) and humic acid (HA) is 96.5% and 93.2% respectively. The flux recovery rate of HA reached 97.06%. As expected, the addition of MoS2-PDA-PEI nanoparticles promotes the formation of the porous structure and improves the hydrophilicity of the membrane, thereby improving its antifouling performance.
1. Introduction
The water crisis has become a globally challenging issue that severely threatens human development and will continue to escalate in the next few centuries.1 Natural organic matter (NOM) is considered as a complex of organic substances found in natural surface water sources. NOM is the main source of organic matter in the water and soil environment. It affects the color, smell, taste, and other properties of raw water, and is the precursor of many disinfection by-products. Therefore, the removal of NOM from natural surface water and wastewater is of great interest to avoid the production of disinfection by-products and to provide safe drinking water.2–7 Compared with traditional water treatment processes, membrane technology has several advantages: good separation effect, no phase change, small footprint, low pollution, and easy integration. Humic acid (HA) and bovine serum albumin (BSA) were used as the model foulants, representative of DOM (dissolved organic matter) and protein organic pollutants, which are considered to be the main substances causing ultrafiltration membrane fouling due to their strong adsorption.8,9As the core of membrane separation technology, membrane material plays a vital role in its separation performance. Polyethersulfone (PES) has good chemical, mechanical and thermodynamic properties, so it is widely used as a membrane material.
However, the hydrophobicity of PES membranes is the main reason for membrane fouling and permeability degradation. Therefore, improving the hydrophilicity of PES membrane materials is one of the research hotspots of the majority of scholars.
With the development of nanotechnology, hydrophilic nanomaterials have been widely introduced into ultrafiltration membrane material because of the simple operation and significant effects.10–14 The effects of mixing nanoparticles during the phase invasion process include: (1) the addition of nanomaterials can greatly accelerate the exchange rate of solvent and non-solvent in the phase separation process and form the porous structure; (2) small nano-gaps can be generated between the inorganic nanomaterials and the organic membrane matrix, which will also contribute to the formation of porous structures and enhance the interpenetration of pores; (3) hydrophilic nanomaterials will spontaneously migrate to the surface of the membrane and accumulate on it during the process of phase separation and membrane formation which improves the hydrophilicity of the membrane.15–18 Accordingly, the porosity and hydrophilicity of the ultrafiltration membrane determine the membrane performance, such as water flux and antifouling.
In recent years, two-dimensional nanomaterials such as graphene oxide (GO), transition metal carbon/nitrides (MXene), graphitic carbonitrides (represented by g-C3N4) and transition metal sulfides (represented by molybdenum disulfide), which has unique atomic-level thickness and micron-level lateral dimensions, the unique properties of its internal pores and nano-scale interlayer channels create good conditions for the construction of high-performance separation membranes. However, the expansion of GO in aqueous solution will cause irreversible degradation of the membrane, which greatly limits its screening performance.15,16 MXene is easily degraded in aqueous solutions, mild oxidants, and higher temperatures, it will lead the lamellar structure to disintegration and limiting its application in water treatment.17,18 The g-C3N4 with the interlayer spacing 0.32 nm is not conducive to the rapid penetration of the membrane, resulting in very low membrane permeability.19 Transition metal sulfides, represented by molybdenum disulfide (MoS2) nanosheets, have great application potential in the field of membrane separation due to their advantages of high stiffness, fewer defects, and low hydraulic resistance.20,21
Molybdenum disulfide (MoS2) has a hexagonal layered structure that is composed of vertically stacked single layers, as shown in Fig. 1. There are strong covalent Mo–S bonds in the monolayers and weak van der Waals forces between each adjacent monolayer with a 0.62 nm interlayer distance.22,23 The MoS2 monolayer is a sandwich structure composed of one Mo atomic layer and two S atomic layers. One Mo atom is connected to six S atoms, and S atoms are separated by Mo atoms on two hexagonal planes. So, there is a good balance of van der Waals attraction and hydration repulsion between adjacent MoS2 nanosheets, which can maintain the zero expansion of the MoS2 film in water.24–27
 | ||
| Fig. 1 The structure of MoS2. | ||
In addition, due to the absence of functional groups, MoS2 nanosheets can construct relatively smooth and rigid interlayer nano channels, reduce frictional resistance with water molecules, and increase the water permeability.28 At the same time, MoS2 nanosheets have no conjugated structure, which can avoid the common fouling and organic pollution problems caused by the interaction of cation–π and π–π. Alam et al.29 used a quartz crystal microbalance to compare the anti-pollution ability of MoS2 and GO two-dimensional nanosheets against humic acid and found that MoS2 has better anti-pollution ability than GO. Alam et al.30 coat the PES surfaces with GO, rGO, and MoS2 to enhance the filtration and antifouling performance in a facile vacuum filtration method, they found that the 2D materials were tested, MoS2-laminated PES membranes demonstrated superior antifouling performance while still maintaining high water permeability.
However, the agglomeration of nanoparticles has always been one of the problems in the membrane preparation process, this study envisages coating the molybdenum disulfide nanoparticles with high molecular weight polymers to improve their dispersibility, and to gain the hybrid membrane with evenly dispersed and stable performance.
In the natural biological world, mussels can easily attach to the surface of any substance because their mucus can form a strong interaction force with other substances' surface in seawater. Mussel adhesion protein is the main component of its mucus.31,32 The mussel protein has a high proportion of lysine and 1-3,4 phenylalanine (L-DOPA). They contain a large amount of free amino groups and catechol groups that contribute to the strong adhesion.33–36 As a derivative of L-DOPA, dopamine has been proven to be a bio-inspired surface coating material with strong adhesion properties so that it can bond with various nanomaterials and form a shell structure. In particular, the surface of PDA shell can be further modified to improve the stability and functionality of the material.37
As shown in Fig. 2, during the process of modifying MoS2 with PDA, the catechol and amine functional groups of dopamine will self-polymerize in the tris-buffer solution (PH = 8.5) to form a PDA film on the surface of MoS2. During the process of oxidation and cyclization, dopamine generates 5,6-dihydroxyindole that is covalently attached via aryl–aryl linkages to form a continuous polymer layer.38–40 In addition, the catechol functional group in PDA can react with the amine and amino group of PEI via Michael addition and Schiff base reaction under weak alkaline conditions to form a highly stable cross-linked layer. Based on the high surface rigidity of MoS2 and its hydrophilic cross-linked layer, MoS2 that is modified by dopamine and PEI can be added into the membrane to improve its anti-pollution performance and stability in an aqueous environment.41–45
 | ||
| Fig. 2 Mechanism of the reaction process between PDA and PEI. | ||
In this study, a new type of crosslinking MoS2 nanoparticles, named MoS2-PDA-PEI, was prepared, and used as a nanofiller to fabricate the hybrid ultrafiltration membranes in a blending method. MoS2-PDA-PEI is prepared by introducing hydrophilic PEI during the self-polymerization of dopamine for co-deposition. PEI can increase the specific surface area of the MoS2 coating and improve its effectiveness in the polymer matrix. This modification enhances the hydrophilicity of the membrane and improves its anti-fouling performance.
2. Materials and methods
2.1 Materials
Polyethersulfone (PES) E6020P was provided by BASF and dried in an oven at 70 °C for 24 hours before use. N,N-Dimethylacetamide (DMAc) was purchased from Aladdin. MoS2 nanoparticles were purchased from Hunan Huajing Powder Materials Co., Ltd. Dopamine hydrochloride, polyethyleneimine (PEI, Mw = 10![[thin space (1/6-em)]](https://www.rsc.org/images/entities/char_2009.gif) 000), polyethylene glycol (PEG, Mw = 2000) and tris(hydroxymethyl) aminomethane (Tris) were obtained from Macklin.
000), polyethylene glycol (PEG, Mw = 2000) and tris(hydroxymethyl) aminomethane (Tris) were obtained from Macklin.
2.2 Synthesis of MoS2-PDA and MoS2-PDA-PEI
To prepare the MoS2-PDA, 1 g MoS2 nanoparticles were distributed into the Tris–HCl buffer solution (pH = 8.5) firstly to form a uniform dispersion by sonication. 2 g dopamine hydrochloride was added to the dispersion, and the reaction was conducted at 25 °C for 24 hours. The product, MoS2-PDA, was collected by centrifugation at 120 rpm min−1. Subsequently, the precipitate was washed by water and ethanol. Finally, the product was fully dried in an oven at 40 °C for 24 hours. Coating PDA and PEI on MoS2 was conducted by similar steps except that 0.8 g dopamine hydrochloride and 1.2 g PEI were added simultaneously in the second step.2.3 Preparation of the hybrid membrane
The membranes were prepared via the non-solvent induced phase separation method. First, the MoS2 nanomaterials were distributed uniformly in DMAc by sonication. PES and PEG-2000 were added to the above dispersion and magnetically stirred at 70 °C for 6 h. After standing for 12 h, the casting solution was spread evenly on a clean glass plate using a scraper with 200 μm gap. The glass plate with the casted membrane was immersed in deionized water at 27 °C for 24 hours to remove residual pore-forming agent and solvent. The composition of the casting solution was shown in Table 1.| Membrane | PES | PEG2000 | DMAc | MoS2 | MoS2-PDA | MoS2-PDA-PEI |
|---|---|---|---|---|---|---|
| M0 | 18% | 5% | 77% | — | — | — |
| M1 | 18% | 5% | 76.5% | 0.5% | — | — |
| M2 | 18% | 5% | 76.5% | — | 0.5% | — |
| M3 | 18% | 5% | 76.7% | — | — | 0.3% |
| M4 | 18% | 5% | 76.5% | — | — | 0.5% |
| M5 | 18% | 5% | 76.2% | — | — | 0.8% |
2.4 Analytical method
Fourier transform infrared spectrophotometer (FTIR, Nicolet Impact 410) was used in the scope of 400–4000 cm−1 to analyze the chemical functional groups of nanoparticles. X-ray photoelectron spectroscopy (XPS analysis) was conducted on an ESCALAB 250 spectrometer. Thermogravimetric analysis (TGA) was conducted with a Perkin Elmer Pyris 1 analyzer at 800 °C under air atmosphere. The morphology of the molybdenum disulfide (MoS2) nanoparticles and the hybrid membranes were characterized by the Transmission electron microscope (TEM, JEM-1400, JEOL). The surface roughness of the membrane was measured by the atomic force microscope (AFM, Bruker Dimension ICON). The hydrophilicity of the membrane was evaluated by a water contact angle device (Drop Shape Analysis System DSA-30).2.5 The evaluation methods of membrane performance
 | (1) |
The porosity (ε) is calculated by the eqn (2):
 | (2) |
The average pore radius (rm, nm) of the membrane was determined via Guerout–Elford–Ferry eqn (3):
 | (3) |
 | (4) |
HA and BSA (500 mg L−1) were used to measure the rejection rate (R) of the membrane. The rejection rate (R) was calculated by eqn (5):
 | (5) |
 | (6) |
 | (7) |
 | (8) |
 | (9) |
3. Results and discussion
3.1 Characterization of the MoS2, MoS2-PDA and MoS2-PDA-PEI
The TEM images of MoS2, MoS2-PDA, and MoS2-PDA-PEI are shown in Fig. 3. Compared with MoS2, the surface of MoS2-PDA and MoS2-PDA-PEI are covered by polymer. The surface coating of MoS2-PDA-PEI is thinner than that of MoS2-PDA, indicating a large amount of amino functional groups destroy the non-public valence interaction during the self-polymerization of dopamine due to the addition of PEI, which reducing the size of PDA aggregates and resulting in a thinner coating.46–48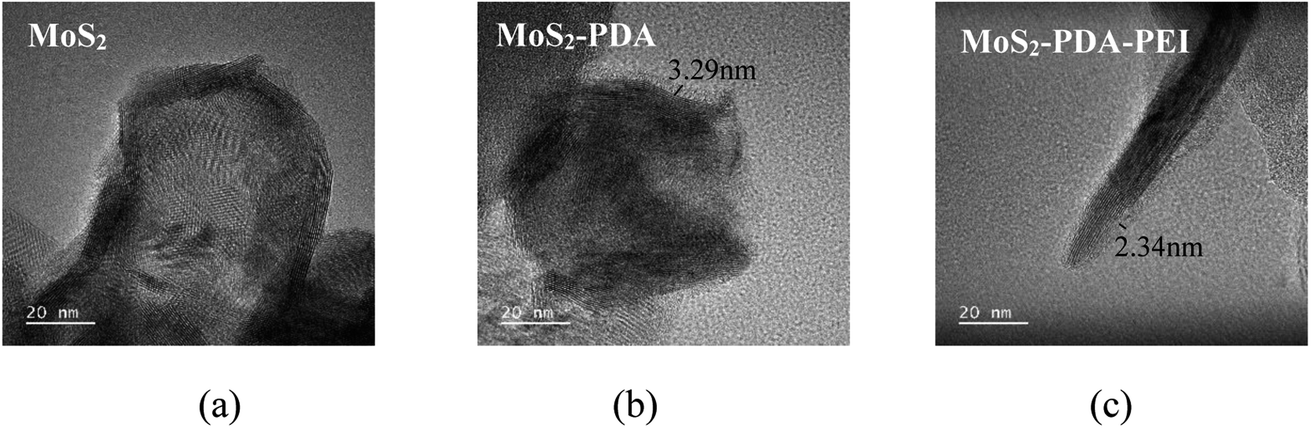 | ||
| Fig. 3 The TEM image of the MoS2, MoS2-PDA and MoS2-PDA-PEI. | ||
The IR spectra of the MoS2, MoS2-PDA, and MoS2-PDA-PEI are shown in Fig. 4(a). The absorption peak at 476 cm−1 is the stretching vibration of the Mo–S bond. The new peaks at 931 cm−1 and 1305 cm−1 represent the stretching vibrations of C–N and C–O in dopamine molecules that coated on MoS2.49 The new peak appeared at 1697 cm−1 is due to the stretching vibration of C![[double bond, length as m-dash]](https://www.rsc.org/images/entities/char_e001.gif) O. Combined with the Fig. 3, it is confirmed that partial PDA was oxidized and successfully coated on MoS2 nanoparticles.50 New peaks of CO and –NH2 appeared at 1543 cm−1 and 1666 cm−1 due to the interaction between the catechol group of PDA and amine group of PEI, respectively. It is also confirmed that PEI and PDA were successfully cross-linked on MoS2, and Michael addition reaction and Schiff base reaction occurred.
O. Combined with the Fig. 3, it is confirmed that partial PDA was oxidized and successfully coated on MoS2 nanoparticles.50 New peaks of CO and –NH2 appeared at 1543 cm−1 and 1666 cm−1 due to the interaction between the catechol group of PDA and amine group of PEI, respectively. It is also confirmed that PEI and PDA were successfully cross-linked on MoS2, and Michael addition reaction and Schiff base reaction occurred.
 | ||
| Fig. 4 (a) The Infrared spectra (b) TGA curves of the modified MoS2. | ||
The TGA curves of MoS2, MoS2-PDA, and MoS2-PDA-PEI are shown in Fig. 4(b). Compared with MoS2, about 64.96% excess weight loss can be observed in MoS2-PDA due to the decomposition of PDA. However, when PEI was added to proceed the co-deposition reaction, the weight loss of MoS2-PDA-PEI was only 42.42% more than that of MoS2. It is confirmed that the addition of PEI can reduce the size of PDA aggregates and result in a thinner coating, which is consistent with the conclusion of the TEM images.
The XPS scan spectra of MoS2, MoS2-PDA, and MoS2-PDA-PEI are shown in Fig. 5. Compared with MoS2, the spectrum of MoS2-PDA shows a new N 1s energy peak at 400.15 eV which comes from PDA that coating on MoS2 surface. Compared with MoS2-PDA, the S signal and Mo signal of MoS2-PDA-PEI are relatively stronger because the coating of MoS2-PDA-PEI nanoparticles is thinner than that of MoS2-PDA. The C 1s peak fitting of MoS2-PDA shows that there are C–C (284 eV), C–O (285.92 eV), C–N (287.29 eV), CO (288.54 eV) peaks respectively, and π–π satellite peak (290.54 eV) appears because the benzene ring has a strong conjugate bond. The peak fitting of S 2p show that there are peaks at 161.51 eV and 162.67 eV which correspond to the S 2p3/2 and S 2p1/2 respectively, reflecting the spin splitting of the p orbital. Among them, the ratio of S2+/SO42− is 0.9/0.7, it shows that part of the MoS2 nanoparticles is oxidized during the modification process of PDA. CO (531.16 eV) and C–O (532.81 eV) appeared after performing peak fitting on O 1s. They belong to the characteristic group of dopamine and prove the success of dopamine modification. At the same time, the ratio of CO/C–O is 6.37/15.62, combined with Fig. 2, it is proved that a small part of PDA is oxidized, and a large part is not oxidized during the self-polymerization process.
 | ||
| Fig. 5 (a) XPS scan spectra (b–g) Peak fitting of C 1s, S 2p and O 1s of MoS2-PDA and MoS2-PDA-PEI. | ||
For MoS2-PDA-PEI, perform peak fitting for S, it can be seen that the ratio of S2+/SO42+ is 11.24/2.48, which also shows that the MoS2 nanoparticles are oxidized while being modified by PDA-PEI. Comparing the C peak, it can be seen that the π–π satellite peak is not detected in the MoS2-PDA-PEI, indicating that no benzene ring is detected. This indicates that the Michael addition reaction occurred during the modification by PDA-PEI. Perform peak fitting on O, it can be seen that the ratio of CO/C–O is 13.97/2.88, CO is the characteristic group of Schiff base reaction, C–O is the characteristic group of Michael addition reaction. Therefore, it proves that two reactions occurred in the modification process, and the Schiff base reaction occurred more than the Michael addition reaction.
3.2 Characterization of the membrane
 | ||
| Fig. 6 The EDS of the prepared membrane (a) M0 (b) M1 (c) M5. | ||
 | ||
| Fig. 7 The SEM and AFM images of the membrane. | ||
The surface layer has a decisive effect on the removal rate of the membrane, and the porous supporting layer acts as a mechanical support.51 The structure of PDA-PEI is mainly formed due to the high mutual diffusivity of water and DMAc. When the casting solution is immersed into the water, the PES chain will immediately solidify and the skin layer will be formed. The DMAc in the membrane will continuously diffuse to form irregular micropores.52,53
The surface of M0–M5 can be observed in Fig. 7. There are no obvious defects on the membrane surface, indicating the integrity of the membranes. Agglomerated MoS2 nanoparticles were found on the surface of M1, which is due to the poor dispersion of unmodified MoS2 nanoparticles. It can be seen that the nanomaterials in M3–M5 are well dispersed.
The SEM images of the membrane cross-section are shown as Fig. 7, compared with M0, the irregular micropores in M1–M5 are much wider. This indicates that during the phase inversion process, the MoS2 nanoparticles increase the mass transfer rate between the solvent and the non-solvent to form larger pores. The finger-like micropores of M1–M5 are elongated, and the pores are wider and open, which is beneficial to increase the flux. In addition, it can be seen that there are large cavities in the cross-sectional structure of the M4–M6. This is the result of the addition of super-hydrophilic nanoparticles MoS2-PDA-PEI which can accelerate the phase transition mass transfer rate of the process.54,55
The roughness of the membrane surface was analyzed with AFM. It can be seen from the Table 2, with the addition of MoS2 nanoparticles into the membrane matrix, the roughness of M1 is increased compared to other membrane. The average roughness Ra reaches 20.8 nm, and Rmax reaches 280 nm. Increased roughness of the membrane is caused by the poor dispersion performance of unmodified MoS2 nanoparticles and a large amount of MoS2 agglomerates during the phase inversion process. It can also be seen from that a large number of nanoparticles agglomerated on the surface. On the contrary, the modified nanoparticles have enhanced compatibility with the membrane matrix due to their hydrophilicity and dispersibility. In the phase inversion process, modification improves the affinity with the PES molecular chain, so the roughness is reduced and the anti-pollution performance is improved. Compared M2 with M4, the Ra of M4 is slightly higher than that of M2. This is because the MoS2-PDA nanoparticles added in M2 are slightly less hydrophilic than MoS2-PDA-PEI added in M4. During the phase inversion process, the hydrophilic nanoparticles have a relatively higher open porosity at the same content. Therefore, the Ra of M4 is slightly higher than that of M2, but the of M4 is much lower than that of M2, indicating M4 has lower roughness and stronger anti-pollution ability than M2.
| Membrane | Water uptake (φ) | Porosity (ε) | Average pore size (nm) | Contact angle (θ) | Ra (nm) | Rmax (nm) | Tensile strength (Mpa) |
|---|---|---|---|---|---|---|---|
| M0 | 73.68 | 52.37 | 3.3 | 82.49 | 6.58 | 76.9 | 1.48 |
| M1 | 74.19 | 59.27 | 6.7 | 80.24 | 20.8 | 280 | 2.11 |
| M2 | 76.31 | 63.59 | 6.17 | 66.85 | 6.80 | 86.3 | 2.27 |
| M3 | 75.53 | 62.34 | 5.9 | 63.83 | 6.99 | 84.1 | 2.35 |
| M4 | 76.47 | 73.56 | 5.68 | 62.87 | 7.42 | 75.1 | 2.89 |
| M5 | 77.38 | 72.31 | 5.13 | 56.85 | 8.77 | 84.1 | 3.57 |
Water uptake and porosity of the membrane play a decisive role in the transport mechanism and stability. In principle, a high water uptake may cause the decreasing of membrane durability.56 Therefore, maintaining proper water uptake and swelling levels can ensure membrane efficiency.
With the addition of hydrophilic MoS2 nanoparticles, the porosity of the membrane is also improved since the hydrophilic effect of the modified nanoparticles increases the exchange rate of solvent and non-solvent during the phase inversion process.
It can be seen from Table 2 that the contact angle of the membrane becomes smaller due to the addition of modified MoS2 nanoparticles. This is because the hydrophilic functional groups of the nanoparticles have a strong attraction to water molecules and form a hydration shell on the membrane.57–59 The mechanical strength of the membrane can be seen from the Table 2, the mechanical strength of the MoS2-PDA-PEI/PES is more stable than the PES. The mechanical strength of the MoS2-PDA-PEI/PES increases with the content of MoS2-PDA-PEI increasing. This is mainly because the MoS2-PDA-PEI improves the affinity with the PES molecular chain, thereby enhancing the mechanical strength of the membrane.
3.3 The performance of the membrane
 | ||
| Fig. 8 Flux-time curves with HA as model contaminants of all the membranes. | ||
It can be seen from Fig. 9(a) that with both pure water and HA solution, the fluxes of M1–M5 were improved compared with the flux of M0 because hydrophilic nanoparticles changed the membrane structure. The flux of M1 is higher than that of M0 since MoS2 nanoparticles significantly increase the porosity and the flux of the membrane. The flux of M4 is significantly higher than that of other membranes due to the combined effect of good hydrophilicity and higher open porosity. For M5, its water flux is slightly lower than that of M4. The possible reason for the slightly low water flux is the increasing concentration of the nanoparticles produces a high viscosity of the casting solution. During the phase separation process, the diffusion rates of the solvent (DMAc) and non-solvent (H2O) are reduced, resulting in a dense structure and a relatively lower flux. The formation of a thick skin layer reduces its flux, but its flux is still twice that of M0.
 | ||
| Fig. 9 (a) The fluxes and (b) rejection rates of all the prepared membranes. | ||
The Fig. 9(b) shows the rejection of the membrane to the pollutant solution. The rejection rate is mostly determined by the surface pore size. The low rejection rate of M1 is due to the poor compatibility between MoS2 and the membrane matrix, resulting in the formation of non-selective pores and defects. This phenomenon can also be seen from the SEM image and the AFM image.
 | ||
| Fig. 10 The fluxes-time of M0 and M4 in three cycles of UF experiment (I, III, V, VII: Pure water stage; II, IV, VI: scaling stage). | ||
 | ||
| Fig. 11 The FRR of all the prepared membranes in the first cycle. | ||
The summary fouling rate (Rt), reversible fouling rate (Rr), and irreversible fouling rate (Rir) of the membrane are shown in Fig. 12. It can be seen from Fig. 12 that M4 has a lower summary fouling rate (Rt) and irreversible fouling rate (Rir). This can be attributed to higher hydrophilicity and smoothness of M4, which makes it easy to form a hydration shell on the membrane. The presence of the hydration shell will inhibit the adhesion and deposition of pollutants and help to clean the pollutants. At the same time, the irreversible fouling rate (Rir) of M1 is even higher than that of M0, this can be attributed to a higher roughness of its surface which causes “valley clogging”.
 | ||
| Fig. 12 The Rt of all the prepared membranes in the first cycle. | ||
Compared with some previously reported hybrid UF membranes, the water permeability, rejection (HA) is given in Table 3.
| Membrane | Foulant composition | Conditions | PWP (LMH/bar) | Rejection (%) | Reference |
|---|---|---|---|---|---|
| PSF/Fe3O4-GO | 20 ppm HA | Dead end, 1 bar | 156.99 | 84 | 60 |
| PES/GO | 50 ppm HA | Dead end, 1 bar | 340 | 94.5 | 61 |
| PVDF/PFSA-g-GO | 500 ppm HA | Dead end, 1 bar | 587.4 | 79.6 | 62 |
| PSF/GFG | 200 ppm BSA | Cross-flow, 1 bar | 217 | 95.2 | 63 |
| PVDF/TiO2-GO | 1000 ppm BSA | Cross-flow, 1 bar | 199.97 | 91.38 | 64 |
| PSF/isocyanate-GO | 1000 ppm BSA | Cross-flow, 1 bar | 135 | 95 | 65 |
| PES/MoS2-PDA-PEI | 500 ppm HA | Cross-flow, 1 bar | 364 | RHA = 93.2 | This work |
| 500 ppm BSA | RBSA = 96.55 |
4. Conclusion
In this study, MoS2 nanoparticles were modified by PDA-PEI and the modified nanoparticles were added into PES to fabricate a new type of hybrid ultrafiltration membrane. We can draw the following conclusions:(1) DA and PEI can be co-crosslinked on MoS2 nanoparticles through Schiff base reaction and Michael addition reaction, which increases the hydrophilicity of MoS2 nanoparticles.
(2) The addition of modified MoS2 can improves the hydrophilicity and roughness of the membrane, and increased the separation performance and anti-pollution performance of the membrane.
(3) The consistent ultrafiltration performance of the M4 proves the excellent long-term usability of MoS2-PDA-PEI nanoparticles, and that it can be used for future water treatment.
Author contributions
Xin Wen: conceptualization, validation, formal analysis, investigation, data curation, writing – original draft, writing-review & editing, visualization. Can He: validation, writing-review & editing, formal analysis. Yuyan Hai: methodology, funding acquisition, writing-review & editing. Xiaofan Liu: software, validation, writing-review & editing Rui Ma: conceptualization, methodology. Jianyu Sun: project administration, visualization, Xue Yang: conceptualization, methodology, Yunlong Qi: validation, resources, Jingyun Chen: visualization, data curation, Hui Wei: visualization, data curation.Conflicts of interest
There are no conflicts to declare.Acknowledgements
We are really grateful for the financial support from the China Energy Foundation (GJNY-21-76), China Energy Foundation (GJNY-21-90).References
- M. Catley-Carlson, Nature, 2019, 565, 426–427 CrossRef CAS.
- H. R. Mian, G. Hu, K. Hewage, M. J. Rodriguez and R. Sadiq, Water Research, 2018, 147(15), 112–131 CrossRef CAS PubMed.
- K. Szymański, A. W. Morawski and S. Mozia, Chem. Eng. J., 2016, 305, 19–27 CrossRef.
- B. A. G. de Melo, Mater. Sci. Eng. Carbon, 2016, 62, 967–974 CrossRef CAS PubMed.
- B. A. G. de Melo, F. L. Motta and M. H. A. Santana, Mater. Sci. Eng., C, 2016, 62, 967–974 CrossRef CAS PubMed.
- R. Zhang, L. Braeken and P. Luis, J. Membr. Sci., 2013, 437, 179–188 CrossRef CAS.
- Y. Feng, Q. Liu and X. Lin, et al., ACS Appl. Mater. Interfaces, 2014, 6, 19161–19167 CrossRef CAS PubMed.
- Z. Xu, S. Ye and G. Zhang, et al., J. Membr. Sci., 2016, 509, 83–89 CrossRef CAS.
- H. Yu, Y. Zhang and X. Sun, et al., Chem. Eng. J., 2014, 237, 322–328 CrossRef CAS.
- L. Bai, H. Liang and J. Crittenden, et al., J. Membr. Sci., 2015, 492, 400–411 CrossRef CAS.
- I. Alsohaimi, M. Kumar and M. Algamdi, et al., Chem. Eng. J., 2017, 316, 573–583 CrossRef CAS.
- Z. Wang, H. Wang and J. Liu, et al., Desalination, 2014, 344, 313–320 CrossRef CAS.
- R. Zambare, K. Dhopte and A. Patwardhan, et al., Desalination, 2016, 403, 24–35 CrossRef.
- B. Tripathi, N. Dubey and R. Subair, RSC Adv., 2016, 6, 4448–4457 RSC.
- S. Zhao, W. Yan and M. Shi, J. Membr. Sci., 2015, 478, 105–116 CrossRef CAS.
- W. Miao, Z. Li and X. Yan, et al., Chem. Eng. J., 2017, 317, 901–912 CrossRef CAS.
- M. Ghanbari, D. Emadzadeh and W. Lau, et al., RSC Adv., 2015, 5, 21268–21276 RSC.
- S. Zinadini and A. Zinatizadeh, Desalination, 2014, 349, 145–154 CrossRef CAS.
- J. Garcia-Ivars, M. Iborra-Clar and M. Alcaina-Miranda, Chem. Eng. J., 2016, 283, 231–242 CrossRef CAS.
- M. Ghanbari, D. Emadzadeh and W. Lau, et al., Desalination, 2016, 377, 152–162 CrossRef CAS.
- Y. Wang, J. Zhu and G. Dong, et al., Sep. Purif. Technol., 2015, 150, 243–251 CrossRef CAS.
- S. Ayyaru and Y. Ahn, J. Membr. Sci., 2016, 525, 210–219 CrossRef.
- H. Ma, C. Burger and B. Hsiao, et al., ACS Macro Lett., 2012, 1, 723–726 CrossRef CAS.
- X. Wang, T. Yeh and Z. Wang, et al., Polymer, 2014, 55, 1358–1366 CrossRef CAS.
- X. Lin, K. Wang and Y. Feng, et al., J. Membr. Sci., 2015, 482, 67–75 CrossRef CAS.
- J. Ran, P. Zhang and C. Chu, Mater. Interfaces, 2018, 10, 7541–7561 CrossRef PubMed.
- H. Lee, S. M. Dellatore, W. M. Miller and P. B. Messersmith, Science, 2007, 318, 426–430 CrossRef CAS PubMed.
- R. Batul, T. Tamanna, A. Khaliq and A. Yu, Biomater. Sci., 2017, 5, 1204–1229 RSC.
- I. Alam, L. M. Guiney and M. C. Hersam, Environ. Sci.: Nano, 2018, 5(7), 1628–1639 RSC.
- I. Alam, L. M. Guiney and M. C. Hersam, J. Membr. Sci., 2020, 4(1), 599 Search PubMed.
- L. Garcia-Fernandez, J. Cui, C. Serrano, Z. Shafiq, R. A. Gropeanu, V. S. Miguel and J. I. Ramos, Adv. Mater., 2013, 4, 529–533, DOI:10.1002/adma.201203362.
- Y. Tian, Y. Cao, Y. Wang, W. Yang and J. Feng, Adv. Mater., 2013, 21, 2980–2983, DOI:10.1002/adma.201300118.
- C. Wang, Z. Li, J. Chen, Y. Yin and H. Wu, Appl. Surf. Sci., 2018, 427, 1092–1098, DOI:10.1016/j.apsusc.2017.08.124.
- Y. Liu, H. Meng, S. Konst, R. Sarmiento, R. Rajachar and B. P. Lee, ACS Appl. Mater. Interfaces, 2014, 6, 16982–16992, DOI:10.1021/am504566v(28∼32).
- Y. Yin, H. Wang, L. Cao, Z. Li, Z. Li, M. Gang, C. Wang, H. Wu, Z. Jiang and P. Zhang, Electrochim. Acta, 2016, 203, 178–188 CrossRef CAS.
- H. Lee, S. M. Dellatore, W. M. Miller and P. B. Messersmith, Science, 2007, 318, 426–430 CrossRef CAS PubMed.
- H. Lee, Y. H. Lee, A. R. Statz, J. Rho, T. G. Park and P. B. Messersmith, Adv. Mater., 2008, 20, 1619–1623 CrossRef CAS PubMed.
- F. Pana, H. Jia, S. Qiao, Z. Jiang, J. Wang, B. Wang and Y. Zhong, J. Membr. Sci., 2009, 341, 279–285 CrossRef.
- J. Wang, L. Xiao, Y. Zhao, H. Wu, Z. Jiang and W. Hou, J. Power Sources, 2009, 192, 336–343 CrossRef CAS.
- J. Xiao, W. Lv, Y. Song and Q. Zheng, Chem. Eng. J., 2018, 338, 202–210, DOI:10.1016/j.cej.2017.12.156.
- L. Chen, Y. Du, Y. Huang, F. Wu, H. M. Cheng, B. Fei and J. H. Xin, Composites, Part A, 2016, 88, 123–130, DOI:10.1016/j.compositesa.2016.05.017.
- H. N. Nguyen, E. T. Nadres, B. G. Alamani and D. F. Rodrigues, J. Mater. Chem. B, 2017, 32, 6616–6628, 10.1039/C7TB00722A.
- M. Yongfeng, F. Han, S. Zhang, C. Zhang, N. Lu, J. Luan and G. Wang, J. Colloid Interface Sci., 2020, 572, 48–61 CrossRef PubMed.
- W. He, S. Tao and G. M. Yang, Jiang Xi Hua Gong, 2017, 4, 4–10 Search PubMed.
- H. C. Yang, K. J. Liao, H. Huang, Q. Y. Wu, L. S. Wan and Z. K. Xu, J. Mater. Chem. A, 2014, 2, 10225–10230 RSC.
- C. X. Zhao, F. Zuo, Z. J. Liao, Z. L. Qin, S. N. Du and Z. G. Zhao, Macromol. Rapid Commun., 2015, 36, 909–915 CrossRef CAS PubMed.
- D. Kumar, D. Rana, M. Sundaram, S. A. Saraswathi and A. Nagendran, Polymer, 2019, 26, 255–264 Search PubMed.
- Y. Zhang, S. Chen, J. An, H. Fu, X. Wu, C. Pang and H. Gao, ACS Biomater. Sci. Eng., 2019, 5, 2732–2739 CrossRef CAS PubMed.
- A. P. Wu, Y. Gu and Y. Xie, et al., ACS Appl. Mater. Interfaces, 2019, 29, 25986–25995 CrossRef PubMed.
- L. Benoist, D. Gonbeau and G. Pfister-Guillouzo, et al., Thin Solid Films, 1995, 1–2, 110–114 CrossRef.
- M. A. Baker, R. Gilmore and C. Lenardi, et al., Appl. Surf. Sci., 1999, 1–4, 255–262 CrossRef.
- D. P. Dubal, S. H. Lee and J. G. Kim, et al., J. Mater. Chem., 2012, 22, 3044–3052 RSC.
- H. X. Yu, Y. T. Zhang, X. B. Sun, J. D. Liu and H. Q. Zhang, Chem. Eng. J., 2014, 237, 322–328 CrossRef CAS.
- R. S. Hebbar, A. M. Isloor and K. Ananda, J. Mater. Chem. A, 2016, 4, 764–774 RSC.
- W. Zhang, Y. Zhu and X. Liu, et al., Angew. Chem., Int. Ed. Engl., 2014, 3, 856–860 CrossRef PubMed.
- X. Fang, j. Li and X. Li, et al., J. Membr. Sci., 2015, 476, 216–223 CrossRef CAS.
- J. Yin and P. H.-H. Duong, Sep. Purif. Technol., 2019, 226, 109–116 CrossRef CAS.
- J. Li, S. T. Morthensen and J. Zhu, Sep. Purif. Technol., 2018, 194, 416–424 CrossRef CAS.
- T.-Z. Jia, J.-P. Lua and X.-Y. Cheng, J. Membr. Sci., 2019, 580, 214–223 CrossRef CAS.
- V. Chai, E. Mahmoudi, Y. H. Teow and A. W. Mohammad, Journal of Water Process Engineering, 2017, 15, 83–88 CrossRef.
- S. Algamdi, I. H. Alsohaimi, J. Lawler, H. M. Ali, A. M. Aldawsari and H. M. A. Hassan, Sep. Purif. Technol., 2019, 223, 17–23 CrossRef.
- X. Liu, H. Yuan, C. Wang, S. Zhang, L. Zhang, X. Liu, F. Liu, X. Zhu, S. Rohani, C. Ching and J. Lu, Sep. Purif. Technol., 2020, 233, 116038 CrossRef.
- G. Zhang, M. Zhou, Z. Xu, C. Jiang, C. Shen and Q. Meng, J. Colloid Interface Sci., 2019, 540, 295–305 CrossRef CAS PubMed.
- L. Wu, X. Zhang, T. Wang, C. Du and C. Yang, Chem. Eng. Res. Des., 2019, 141, 492–501 CrossRef CAS.
- H. Zhao, L. Wu, Z. Zhou, L. Zhang and H. Chen, Phys. Chem. Chem. Phys., 2013, 15, 9084–9092 RSC.
| This journal is © The Royal Society of Chemistry 2021 |