 Open Access Article
Comparative study of pyrolytic carbons prepared from printed circuit boards by magnetic and electrostatic separation
Yujiao Kan *,
Fangyuan Zheng and
Ruxin Zhang
College of Safety and Environmental Engineering, Shandong University of Science and Technology, Qingdao 266590, China. E-mail: kanyujiao@163.com
First published on 13th October 2021
Abstract
Physical technology is the main method to separate metal and non-metallic fractions from printed circuit boards (PCBs). The non-metallic fractions from magnetic and electrostatic separation have different ingredients, which enables them to be prepared into pyrolytic carbon with different properties. To discover the influence of separation technologies for PCBs on the preparation, characterization and application of pyrolytic carbon, two kinds of nonmetal fraction from magnetic and electrostatic separation were chosen as the precursors of pyrolytic carbon. The thermogravimetric analysis of non-magnetic fraction and non-conductive fraction at different heating rates was discussed in the paper. The optimal heating rate of 10 °C min−1 was applied in preparing pyrolytic carbons. Pyrolytic carbons prepared from the non-magnetic fraction and non-conductive fraction had visible differences in their morphological and pore structures. Pyrolytic carbons of the non-magnetic fraction exhibited higher BET surface area (313 m2 g−1) and higher adsorption capacities for ciprofloxacin (142.82 mg g−1) than those of pyrolytic carbon of the non-conductive fraction (SBET: 235 m2 g−1, qm: 78.17 mg g−1). Equilibrium data fit better to the Freundlich model than the Langmuir model. According to the calculated thermodynamic parameters, CIP adsorption processes by the two pyrolytic carbons were spontaneous and endothermic. Although the metal recovery from PCBs through electrostatic separation is higher, pyrolytic carbon prepared from the non-magnetic fraction shows better pore characteristics and adsorption properties. This paper might be the first report of the effect of separation technology for PCBs on the preparation of pyrolytic carbons. This paper contributed to the reutilization of non-metallic fractions of PCBs and the development of a cyclic economy.
1. Introduction
In recent years, with the development of network technology, waste electric and electronic equipment (WEEE) has become a serious problem for humans to resolve.1 Printed circuit boards (PCBs), as an important part of WEEE, have attracted attention across the world. Now the recycling of PCBs has become a hot topic because of their potential environmental hazards and rich natural resources.2The main recycling processes for PCBs are physical/mechanical and chemical recycling technique.3 Physical/mechanical process usually uses crusher, classifier and separator to separate metals and nonmetals from PCBs. And it includes magnetic separation, liquid flotation, eddy current, wind separation and electrostatic separation, etc.4 Physical separations have the advantage of high recovery and low cost. Chemical method mainly includes pyrometallurgy and hydrometallurgy. Pyrometallurgy is through incineration to remove plastic and other organic ingredients in PCBs to make the metal enrichment. Hydrometallurgy is through acidic or alkaline leaching method to make metal dissolve in solution, then use solvent extraction, precipitation, filtering and distillation method to make the metal enrichment.5 Either way, the by-products generated from chemical method would cause the secondary pollution. Therefore, researchers have begun to focus on the physical/mechanical recovery methods for PCBs in recent years.
Magnetic and electrostatic separation are two common mechanical separations.6 Magnetic separation is the pretreatment process of electrostatic separation, it can only separate the magnetic fraction (Fe, Ni, Co, etc.) from the non-magnetic fraction (plastic, glass, Al, Cu, etc.). After the magnetic separation, part of the metal is still in the non-magnetic fraction. However, after electrostatic separation, almost all the metals are separated. Therefore, the two kinds of nonmetal fraction from magnetic and electrostatic separation have different ingredients.
Considering the high content of carbon in non-metal fraction, it is also a carbon source for preparing activated carbon.7 In our previous study, H3PO4,8,9 NaOH,7 KOH10 and steam11 were used as activating agents to prepare activated carbons of PCBs. However, the pyrolysis of PCBs without any activating agent has not been studied. Different ingredients of two kinds of nonmetal fractions from magnetic and electrostatic separation may affect the properties of pyrolytic carbons. Therefore, the effect of separation technology for PCBs on the preparation of pyrolytic carbons is intend to be researched.
Ciprofloxacin (CIP), as a synthetic antibiotic, has been widely used in the treatment of bacterial infections in human and animals. The presence of CIP in water sources can lead to the development of antibiotic resistant bacteria, which is harmful to the health of the human. Nowadays, all kinds of methods have been used for CIP removal from environmental water system, such as adsorption,12 photo-degradation,13 catalytic oxidation14 and biodegradation15 etc. Among these methods, adsorption method has attracted much attention because of its simple operation, low cost, high efficiency and low impact on the environment.16
In this paper, the influence of separation technologies for PCBs on the preparation, characterization and application of pyrolytic carbon was analyzed. Various properties including BET surface area, pore volume, and pyrolysis mechanism were investigated. The adsorption experiments of CIP were also discussed to compare the performance of two pyrolytic carbons.
2. Materials and methods
2.1 Raw material
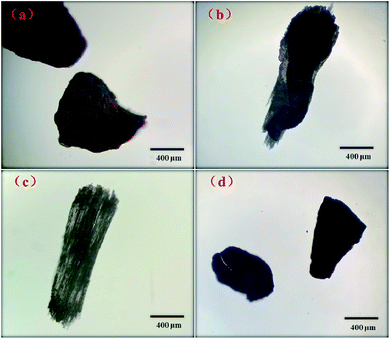
The whole process technology for recycling PCBs is shown in Fig. 1. Firstly, the raw material (PCBs) were crushed and separated through a grinder. Then, the product was separated through magnetic separator to get the magnetic fraction and non-magnetic fraction. Because the magnetic force on the magnetic particle is greater than gravity, magnetic particles were transported on the conveyor, and then carried to collection tank by the rotation of roller and the dividing of strips. While the non-magnetic fractions were unaffected by magnetic force, and they could directly remove to the non-magnetic field area.17 The element analysis of non-magnetic fraction shows as follows: non-metalloid: 75.62%; Cu: 8.58%; Cr: 3.45%; Al: 3.11%; Ni: 2.89%; Sb: 2.36%; Pt: 2.04%; Zn: 1.95%. The particle size of non-magnetic fraction is 1–2 mm. The non-magnetic fraction was separated through electrostatic separator to get the conductive fraction and non-conductive fraction. Corona charge and induction charge are the two charging mechanisms of conductive and non-conductive particles. Due to the difference in the electrical conductivity of the two particles, their movement paths are also different.17 Conductive particles were subjected to electrostatic induction, discharged to the earthed electrode and detached from the rotating roll. However, the non-conductive particles were subjected to corona charge. The charged non-conductive particles are pinned by the electric image force to the rotating roll, and then they will move with the rotating roll, swept by the brush and fall in the tank. The element analysis of non-conductive fraction shows as follows: non-metalloid: 99.21%; Cu: 0.32%; Cr: 0.24%; Ni: 0.23%. The particle size of non-conductive fraction is 0.5–1 mm. The two kinds of nonmetal fraction obtained from magnetic separation and electrostatic separation are named MS and ES, which are the raw materials for preparing pyrolytic carbons. Fig. 2 shows the image captured by the optical microscope. The shape of metal and ES is a plate, and the shape of fiberglass powder and MS is a stripe. MS and ES have different shapes under the same size, which is due to the separation technology.2.2 Pyrolytic carbon
In order to ensure that MS and ES had a uniform particle size, they were milled to 60 mesh (0.25 mm). The sieved samples were heated to 650 °C at a heating rate of 10 °C min−1 and maintained at the temperature for 3 h, the whole preparation process was conducted in a horizontal cylindrical furnace (SKQ-3-10) under N2 atmosphere (0.5 L min−1). After cooling to the room temperature, the pyrolytic carbons were washed with deionized water. Afterwards, the pyrolytic carbons were dried, ground and sieved to 100 mesh (0.15 mm). The pyrolytic carbon prepared from MS and ES were named MSC and ESC, respectively.2.3 Characterization methods
The thermogravimetric analysis of MS and ES were measured by an SDT-simultaneous TGA-DTA model (SHI-MADZU, TGA-50). MS and ES were performed under N2 atmosphere (0.5 L min−1) with the different heating rate of 5, 10 and 15 °C min−1 up to 800 °C. The pore structure and specific surface area of MSC and ESC were determined by a surface area analyzer (JW-BK122W, Beijing JWGB Sci. & Tech. Co., Ltd., China) by N2 adsorption/desorption at 77 K. The element contents of MS and ES were measured by an energy dispersive spectrometer instrument (Elementar Vario EL III, Germany). The surface morphology of activated carbon was obtained by scanning electron microscopy (SEM) (Hitachi S-520, Japan). Products of MS and ES decomposition in the condensed phase were analysed by a gas chromatography-mass spectrometer (GC-MS) (Agilent 7000B, USA). The geometric measurements were performed by optical microscope (DM 500, LEICA, Germany).2.4 Adsorption experiment
In order to study the effect of contact time on the adsorption of CIP. Experiments were carried out in beakers (1000 mL), which were wrapped around tinfoil to prevent photolysis. Solutions were stirred with a magnetic stirrer at a constant speed (175 rpm). Time measurements began when the adsorbent (1 g) was added in the CIP solution (1 L). Samples were taken at different time intervals to be determined. A sets of batch adsorption experiments were conducted in the constant temperature incubator shaker (BPN-25HL) using 100 mL conical flasks at desired condition (shaking speed 175 rpm, 0.05 g carbon/50 mL solution and setting temperature of 20, 25, 30 °C) for 25 h. After equilibration, samples were filtered using a 0.45 μm membrane filter, then CIP concentration of the filtrate was determined by a UV-vis spectrophotometer (UV-754, Shanghai) at the maximum wavelength of 275 nm.The amount of CIP removed at equilibrium, qe (mg g−1), was calculated as follows:
 | (1) |
2.5 Adsorption isotherm models and thermodynamics
The adsorption isotherm describes how the adsorbent interacted with the adsorbate. Two common models, Langmuir18 and Freundlich19 isotherm model, are applied to fit equilibrium data for the adsorption of CIP onto MSC and ESC. Langmuir model presumes monolayer coverage of adsorbent over a homogenous adsorbent surface. Freundlich model is based on a heterogeneous surface, and it has been used for the adsorption process of multilayer adsorption. The non-linear forms of the Langmuir and Freundlich equations can be expressed as:
 | (2) |
 | (3) |
The thermodynamic parameters provide a deeper insight into adsorption mechanism. Enthalpy change (ΔH, kJ mol−1), entropy change (ΔS, kJ (mol K)−1) and Gibbs free energy change (ΔG, kJ mol−1) were determined by the thermodynamic equations.20
3. Results and discussions
3.1 Pyrolysis kinetics
The pyrolytic kinetics curves of MS and ES (heating rate: 5, 10 and 15 °C min−1) are depicted in Fig. 3. Fig. 3a and b show the thermo gravimetric analysis (TGA) curves of MS and ES, Fig. 3c and d show the derivative thermo gravimetric (DTG) of MS and ES. Little mass loss is observed between 100 and 250 °C as a result of the moisture content. The raw materials could be decomposed when the heating temperature is above 250 °C. Large mass loss can be divided into three stages: 250–370 °C, 370–500 °C and 500–800 °C. During the first stage, the mass loss accounts for about 60% of the whole mass loss, which is due to the dehydration-condensation reaction of phenolic groups in the epoxy resin, the water molecules escape in large numbers. Besides, when the temperature is above 300 °C, the ether bridge bonds with low bond energy cleave, volatile organic compounds are generated to escape.21 Therefore, the maximum weight loss rate appears in this stage. During the second stage, the ether bridge bonds continue to cleave, small molecules are generated and volatilize. During the last stage, the mass loss only accounts for 10% of the whole mass loss. The crosslinking structures of epoxy resin were destroyed, the reaction of crosslinking, cyclization and chain transfer in aromatic monomer occurred, little molecules escaped. At last, pyrolytic carbon was formed.22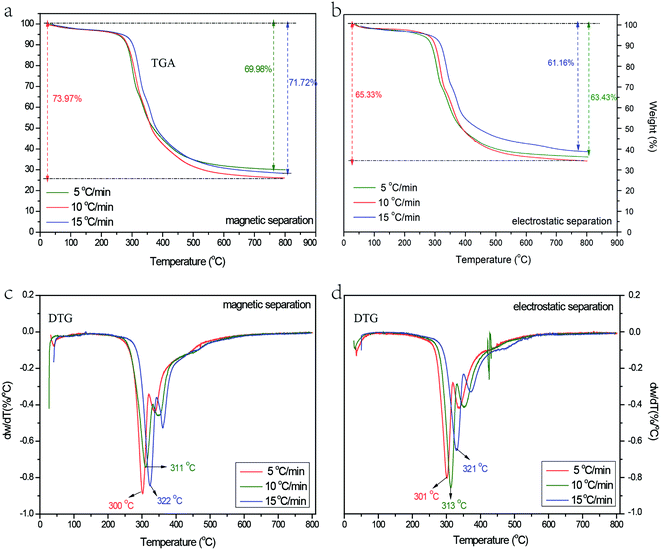 | ||
| Fig. 3 The pyrolytic kinetics curves at 5, 10 and 15 °C min−1 of MS and ES ((a) TGA thermograph of MS; (b)TGA thermograph of ES; (c) DTG curves of MS; (d) DTG curves of ES). | ||
Seen from Fig. 3a and b, the largest mass loss occurs at the heating rate of 10 °C min−1, the TGA curves of 5 °C min−1 are almost coincided with that of 10 °C min−1. Generally, the less heating rate results in better pyrolysis, more ether bridge bond and methylene bond on the side chain of benzene ring break to form free radicals, these free radicals can react with other macromolecules. At last, more volatile gases are generated and less pyrolysis residues are left. The mass loss at the heating rate of 5 °C min−1 is a little less than that of 10 °C min−1, which is probably because the polymer molecules degraded slowly at a low heating rate.23 Similar phenomenon has been reported by Kumari et al.24 and Font et al.25 When the heating rate is 15 °C min−1, the temperature rises fast, many materials are pyrolyzed simultaneously. The pyrolysis reactions become more intense, a large number of unstable unsaturated substances are generated, which inhibits the pyrolysis of stable macromolecular substances.26 Then, bond cleavage and cyclizing polymerization reactions occurred in the unsaturated substances.27,28
Seen from Fig. 3c and d, with the increasing heating rate, the peak temperature of pyrolysis increases and the DTG curves shifts to higher temperatures region. For MS, the peak temperature rise from 300 to 322 °C; for ES, the peak temperature rises from 301 to 321 °C. As the heating rate increases, pyrolytic reaction time decreases at a certain temperature, resulting in the decrease of decomposition amount at the temperature. Therefore, higher temperature is needed for the same organic matter decomposition.29,30
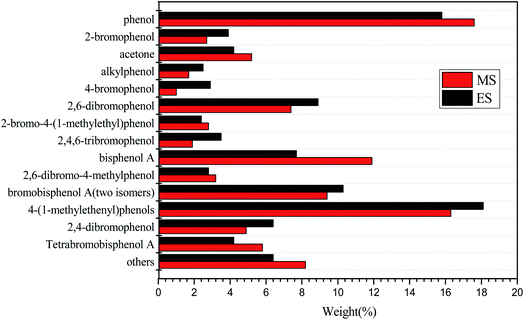
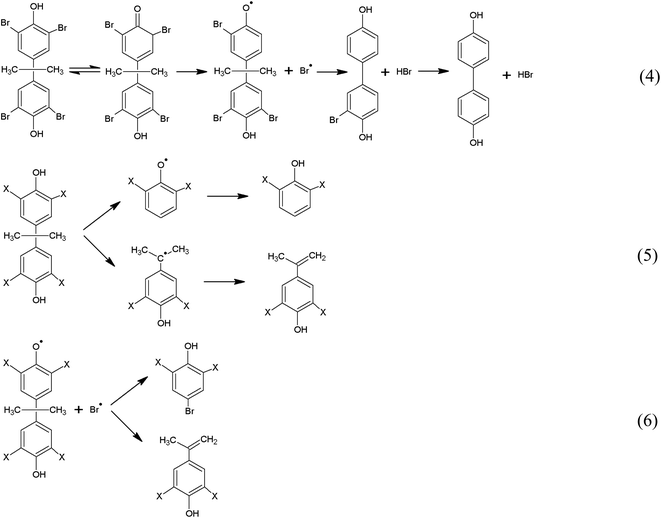
Above all, to ensure that the pyrolysis of MS and ES can be completed, 10 °C min−1 is chosen for the pyrolysis rate. In order to analyze the pyrolysis mechanism of MS and ES, GC/MS analysis was performed. Fig. 4 shows the GC/MS analysis of MS and ES. Results show that the variety of organic matter is coincident in different raw materials, but the content shows diversity. Reactions (Fig. 5) suggested could be concluded from the products. A probable path for the generation of radicals from tetrabromobisphenol A is the formation of an unstable halocyclohexadienone.31 The cleavage of a carbon–bromine bond lead to release bromine radical and generate HBr and tribromobisphenol A (eqn (4)). Tribromobisphenol A also can yield dibromobisphenol A (two isomers).32 While, the cleavage of carbon–carbon bond could generate two radicals (eqn (5)), at the same time, it can generate phenol, 2-bromophenol, 2,6-dibromophenol and 2-bromo-4-(1-methylethenyl)phenol among decomposition products (Fig. 4). A likely pathway for the formation of p-bromo-substituted phenols products is shown in eqn (6). The products of p-bromo-substituted phenols mainly include 4-bromophenol, 2,4-dibromophenol and 2,4,6-tribromophenol.33 GC/MS analysis of MS and ES shows differences, which may be associated with the content of metal elements in MS and ES. Two reactions have been proposed leading to SbBr3 formation, which have been shown in eqn (7) and (8):34
| Sb2O3 + 6HBr → 2SbBr3 + 3H2O | (7) |
| SbOBr + 2HBr → SbBr3 + H2O | (8) |
The formation and evolution of gaseous SbBr3 may occur during the pyrolysis process, which may affect the formation of organic matter.
3.2 Surface morphology characterization
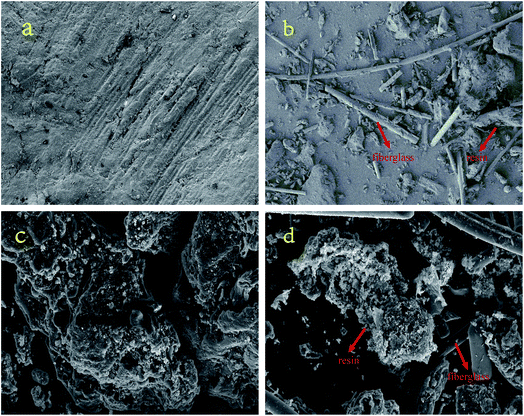
Fig. 6 shows the SEM micrographs of MS, ES, MSC and ESC. Seen from Fig. 6a and b, MS and ES have different shape characteristics. The resin and fiberglass powder are separated completely after the process of electrostatic separation. The resin powder shaped like a plate is from epoxy fiber laminate, and the fiberglass powder shaped like a stripe is from a phenolic paper laminate. After pyrolysis, a few pores were generated on the surface of the resin powder, but the surface of fiberglass was still smooth (Fig. 6c and d). The weak side chains and bridge bond of organic matter in resin powder broke to form free radical, then free radical combined to form gas and escaped from the surface of resin powder. Compared with resin powder, fiberglass has high heat stability, thus no pore was generated on the surface of fiberglass.3.3 Surface area and porosity analysis
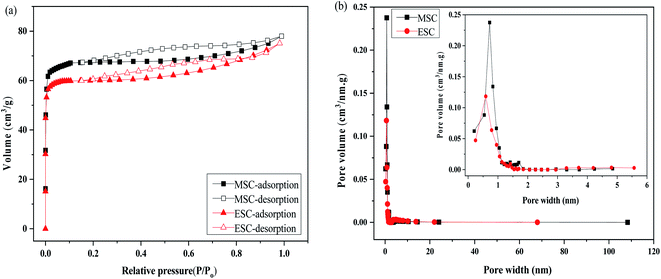
The N2 adsorption/desorption isotherms and pore size distribution of MSC and ESC are shown in Fig. 7. The texture parameters and yield of MSC and ESC are listed in Table 1. The results indicated the development of porosity in the PCBs during the pyrolysis process, both samples showing isotherms of type I, which are characteristic of highly microporosity. But they also showed a hysteresis loop indicating the existence of mesoporous. Most of the pores of both samples fell into the range of micropore and mesopores, only few pores belong to macropore. The greater N2 adsorption capacity results in a larger BET surface area (313 and 235 m2 g−1 for MSC and ESC, respectively). This is a consequence of the higher development of microporosity (95.53% for MSC and 94.89% for ESC). Besides, the content of Sb in MS is higher than that in ES, the form of Sb existing in the printed circuit boards is Sb2O3. Sb2O3 can react with HBr to form SbBr3, the evaporation reaction of SbBr3 results in the pore-creating of MSC.35 Thus, the microporosity, and BET surface area of MSC is larger than that of ESC, the yield of MSC is less than that of ESC.| Pyrolytic carbon | SBET (m2 g−1) | Smic (m2 g−1) | Smic/SBET (%) | Vtot (cm3 g−1) | Vmic (cm3 g−1) | Dp (nm) | Yield (%) |
|---|---|---|---|---|---|---|---|
| MSC | 313 | 299 | 95.53 | 0.121 | 0.103 | 1.833 | 41.8 |
| ESC | 235 | 223 | 94.89 | 0.116 | 0.087 | 1.973 | 43.5 |
3.4 Adsorption experiments
As shown in Fig. 8, symbols represented experimental data, solid and dash line represented the fitted Langmuir and Freundlich model. The isotherm parameters obtained from the two models were given in Table 2. The better-fitting model was determined by the higher R2 value. As shown in Table 2, the R2 values for MSC and ESC obtained from Freundlich model were higher than that obtained from Langmuir model. Freundlich model seemed to be much more applicable than Langmuir isotherm model. Therefore, the surfaces of MSC and ESC were relatively heterogeneous, which was likely caused by heterogeneous interactions of different functional groups on the carbons' surfaces with CIP. For all carbons, the 1/n values are much smaller than 1, which indicated a favorable adsorption. The qm values of the carbons for CIP adsorption at 20 °C followed an order of MSC (142.82 mg g−1) > ESC (78.17 mg g−1). The adsorption of CIP onto MSC and ESC may be attributed to π–π electron donor–acceptor (EDA) interaction between bulk systems on the surface of pyrolytic carbons and molecules.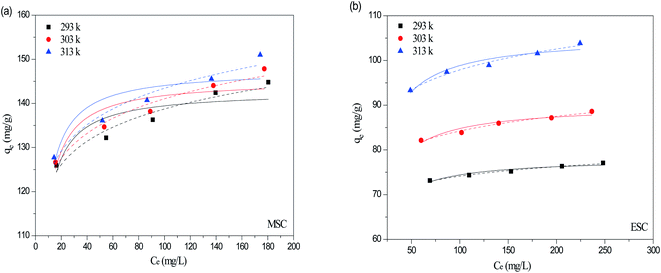 | ||
| Fig. 8 Adsorption isotherms using non-linear method of Langmuir (solid line) and Freundlich model (dash line) for CIP onto MSC (a) and ESC (b). | ||
| Activated carbon | T (°C) | Langmuir | Freundlich | ||||
|---|---|---|---|---|---|---|---|
| qm | kL | R2 | kF | 1/n | R2 | ||
| MSC | 20 | 142.82 | 0.4134 | 0.7133 | 105.61 | 0.0593 | 0.9466 |
| 25 | 145.33 | 0.3985 | 0.7482 | 105.73 | 0.0626 | 0.9601 | |
| 30 | 147.62 | 0.4051 | 0.7338 | 106.29 | 0.0651 | 0.9536 | |
| ESC | 20 | 78.17 | 0.1976 | 0.9084 | 61.42 | 0.0408 | 0.9874 |
| 25 | 90.11 | 0.1588 | 0.8964 | 65.25 | 0.0554 | 0.9805 | |
| 30 | 105.50 | 0.1485 | 0.9083 | 71.85 | 0.0672 | 0.9791 | |
Thermodynamic parameters were listed in Table 3. The positive values of ΔH confirmed the endothermic nature of the CIP adsorption process, while the positive values of ΔS suggested the randomness at the solid–solution interface increased. Compared with ESC, the ΔS values of MSC was larger, which indicated the higher affinity of MSC toward CIP. The negative values of ΔG indicated the adsorptive performance of CIP on pyrolytic carbons were feasible and spontaneous. The absolute values of ΔG increased with the increasing temperature, indicating the adsorption was favorable at high temperature.
| Activated carbon | T (K) | ΔG | ΔH | ΔS |
|---|---|---|---|---|
| MSC | 293 | −28.8120 | 27.287 | 0.1914 |
| 298 | −29.7029 | |||
| 303 | −30.7259 | |||
| ESC | 293 | −27.0138 | 5.2934 | 0.1101 |
| 298 | −27.3851 | |||
| 303 | −28.1144 |
The maximum adsorption capacities of CIP on different adsorbents were given in Table 4. No activating agent was used in the preparation process, so the specific surface area of pyrolytic carbon is small, but its adsorption performance is good. The comparison showed that MSC and ESC are promising adsorbents to remove CIP from aqueous solutions.
| Adsorbents | Activating agent | Specific surface area (m2 g−1) | Adsorption capacity (mg g−1) | Reference |
|---|---|---|---|---|
| Arundo donax Linn | H4P2O7 | 1568 | 329 | 36 |
| Bamboo | H3PO4 + K2CO3 | 2237 | 613 | 37 |
| Prosopis juliflora | H3PO4 | 946 | 370 | 38 |
| Rice husk | Steam | 1019.9 | 314.8 | 39 |
| Folium cycas | K2CO3 | 721.67 | 204.08 | 40 |
| Carbon xerogel | Steam + HNO3 | 786 | 284 | 41 |
| Enteromorpha | H4P2O7 | 1124 | 216.55 | 42 |
| Lignin | H3PO4 | 931.53 | 418.6 | 43 |
| Bamboo | H3PO4 | 767 | 281.47 | 44 |
| Multiwalled carbon nanotube | KMnO4 + H2SO4 | 708.16 | 150 | 45 |
| Magnetic carbon composite | Fe(NO3)3 + FeCl3 | 79.02 | 90.1 | 46 |
| Palm leaflet | H2SO4 | 24.4 | 133.3 | 47 |
| Magnetic N-doped porous carbon | ZnO + Co(OH)2 | 171.29 | 1563.7 | 48 |
| Potato leaves and steams | FeCl3 + NaCl | 26.28 | 11.5 | 16 |
| Bio graphene | KOH | 493.54 | 172.6 | 49 |
| MSC | — | 313 | 142.82 | This study |
| ESC | — | 235 | 78.17 | This study |
4. Conclusion
MSC and ESC are two kinds of pyrolytic carbon, and they were respectively synthesized from nonmetal fraction of PCBs through magnetic separation and electrostatic separation. The nonmetal fractions through different separations have distinct composition and morphology, which lead to the diversity of MSC and ESC. MSC exhibited higher BET surface area (313 m2 g−1) and total pore volume (0.121 cm3 g−1) than those of ESC (235 m2 g−1 and 0.116 cm3 g−1). And the CIP adsorption capacity of MSC was also larger than that of ESC. Although more metal can be recycled from PCBs through electrostatic separation, pyrolytic carbon prepared from the nonmetal fraction through magnetic separation shows better pore characteristics.Conflicts of interest
There are no conflicts to declare.References
- C. Zhou, et al., Liberation characteristics after cryogenic modification and air table separation of discarded printed circuit boards, J. Hazard. Mater., 2016, 311, 203–209 CrossRef CAS.
- M. Kavousi, et al., Selective separation of copper over solder alloy from waste printed circuit boards leach solution, Waste Manag., 2017, 60, 636–642 CrossRef CAS PubMed.
- L. H. Yamane, et al., Recycling of WEEE: Characterization of spent printed circuit boards from mobile phones and computers, Waste Manag., 2011, 31(12), 2553–2558 CrossRef CAS PubMed.
- J.-M. Yoo, et al., Enrichment of the metallic components from waste printed circuit boards by a mechanical separation process using a stamp mill, Waste Manag., 2009, 29(3), 1132–1137 CrossRef CAS PubMed.
- I. Birloaga and F. Vegliò, Study of multi-step hydrometallurgical methods to extract the valuable content of gold, silver and copper from waste printed circuit boards, J. Environ. Chem. Eng., 2016, 4(1), 20–29 CrossRef CAS.
- J. Li, B. Gao and Z. Xu, New technology for separating resin powder and fiberglass powder from fiberglass-resin powder of waste printed circuit boards, Environ. Sci. Technol., 2014, 48(9), 5171–5178 CrossRef CAS PubMed.
- Y. Kan, et al., Comparative study of dry-mixing and wet-mixing activated carbons prepared from waste printed circuit boards by NaOH activation, RSC Adv., 2015, 5(128), 105943–105951 RSC.
- Y. Kan, et al., Effects of Cu and CuO on the preparation of activated carbon from waste circuit boards by H3PO4 activation, Chem. Eng. J., 2018, 331, 93–101 CrossRef CAS.
- Y. Kan, et al., The application of activated carbon produced from waste printed circuit boards (PCBs) by H3PO4 and steam activation for the removal of malachite green, Chem. Eng. J., 2015, 260, 541–549 CrossRef CAS.
- Y. Kan, et al., Comparison of activated carbons from epoxy resin of waste printed circuit boards with KOH activation by conventional and microwave heating methods, J. Taiwan Inst. Chem. Eng., 2016, 68, 440–445 CrossRef CAS.
- Y. Kan, et al., Preparation of epoxy resin-based activated carbons from waste printed circuit boards by steam activation, Mater. Lett., 2015, 159, 443–446 CrossRef CAS.
- W. Duan, et al., Ciprofloxacin adsorption onto different micro-structured tourmaline, halloysite and biotite, J. Mol. Liq., 2018, 269, 874–881 CrossRef CAS.
- Z. Xie, et al., Construction of carbon dots modified MoO3/g-C3N4 Z-scheme photocatalyst with enhanced visible-light photocatalytic activity for the degradation of tetracycline, Appl. Catal., B, 2018, 229, 96–104 CrossRef CAS.
- J. Chen, et al., Oxidative degradation of triclosan by potassium permanganate: Kinetics, degradation products, reaction mechanism, and toxicity evaluation, Water Res., 2016, 103, 215–223 CrossRef CAS PubMed.
- V. R. A. Ferreira, et al., Fluoroquinolones biosorption onto microbial biomass: activated sludge and aerobic granular sludge, Int. Biodeterior. Biodegrad., 2016, 110, 53–60 CrossRef CAS.
- J. Zhao, et al., Coating magnetic biochar with humic acid for high efficient removal of fluoroquinolone antibiotics in water, Sci. Total Environ., 2019, 688, 1205–1215 CrossRef CAS PubMed.
- J. Ruan and Z. Xu, Constructing environment-friendly return road of metals from e-waste: Combination of physical separation technologies, Renewable Sustainable Energy Rev., 2016, 54, 745–760 CrossRef.
- R. I. Yousef, B. El-Eswed and A. a. H. Al-Muhtaseb, Adsorption characteristics of natural zeolites as solid adsorbents for phenol removal from aqueous solutions: Kinetics, mechanism, and thermodynamics studies, Chem. Eng. J., 2011, 171(3), 1143–1149 CrossRef CAS.
- S. Nethaji, et al., Adsorption of Malachite Green dye onto activated carbon derived from Borassus aethiopum flower biomass, J. Hazard. Mater., 2010, 181(1), 271–280 CrossRef CAS PubMed.
- A. Rathinam, et al., Biosorption of cadmium metal ion from simulated wastewaters using Hypnea valentiae biomass: A kinetic and thermodynamic study, Bioresour. Technol., 2010, 101(5), 1466–1470 CrossRef CAS PubMed.
- N. Ortuño, et al., Thermogravimetric study of the decomposition of printed circuit boards from mobile phones, J. Anal. Appl. Pyrolysis, 2013, 103, 189–200 CrossRef.
- P. Evangelopoulos, E. Kantarelis and W. Yang, Investigation of the thermal decomposition of printed circuit boards (PCBs) via thermogravimetric analysis (TGA) and analytical pyrolysis (Py–GC/MS), J. Anal. Appl. Pyrolysis, 2015, 115, 337–343 CrossRef CAS.
- R. A. Alenezi and F. M. Al-Fadhli, Thermal degradation kinetics of waste printed circuit boards, Chem. Eng. Res. Des., 2018, 130, 87–94 CrossRef CAS.
- A. Kumari, et al., Investigation of the influence of inert and oxidizing atmospheres on the efficiency of decomposition of waste printed circuit boards (WPCBs), Heat Mass Transfer, 2016, 53(4), 1247–1255 CrossRef.
- R. Font, et al., Thermogravimetric kinetic analysis and pollutant evolution during the pyrolysis and combustion of mobile phone case, Chemosphere, 2011, 85(3), 516–524 CrossRef CAS PubMed.
- M. Blazsó, Z. Czégény and C. Csoma, Pyrolysis and debromination of flame retarded polymers of electronic scrap studied by analytical pyrolysis, J. Anal. Appl. Pyrolysis, 2002, 64(2), 249–261 CrossRef.
- M. P. Luda, A. I. Balabanovich and M. Zanetti, Pyrolysis of fire retardant anhydride-cured epoxy resins, J. Anal. Appl. Pyrolysis, 2010, 88(1), 39–52 CrossRef CAS.
- O. Hutzinger, et al., PBDD and PBDF from brominated flame retardants: Combustion equipment, analytical methodology and synthesis of standards, Chemosphere, 1989, 18(1), 1235–1242 CrossRef.
- C. Quan, A. Li and N. Gao, Research on pyrolysis of PCB waste with TG-FTIR and Py-GC/MS, J. Therm. Anal. Calorim., 2012, 110(3), 1463–1470 CrossRef CAS.
- S.-i. Sakai, et al., Combustion of brominated flame retardants and behavior of its byproducts, Chemosphere, 2001, 42(5), 519–531 CrossRef CAS.
- H. Thoma and O. Hutzinger, Pyrolysis and GC/MS-analysis of brominated flame retardants in on-line operation, Chemosphere, 1987, 16(6), 1353–1360 CrossRef CAS.
- H. Wichmann, F. T. Dettmer and M. Bahadir, Thermal formation of PBDD/F from tetrabromobisphenol A––a comparison of polymer linked TBBP A with its additive incorporation in thermoplastics, Chemosphere, 2002, 47(4), 349–355 CrossRef CAS.
- M. Webb, P. M. Last and C. Breen, Synergic chemical analysis – the coupling of TG with FTIR, MS and GC-MS: 1. The determination of the gases released during the thermal oxidation of a printed circuit board, Thermochim. Acta, 1999, 326(1), 151–158 CrossRef CAS.
- M. Rzyman, et al., Studies on bromination and evaporation of antimony oxide during thermal treatment of tetrabromobisphenol A (TBBPA), J. Anal. Appl. Pyrolysis, 2010, 88(1), 14–21 CrossRef CAS.
- X. Yang, et al., Pyrolysis and dehalogenation of plastics from waste electrical and electronic equipment (WEEE): A review, Waste Manag., 2013, 33(2), 462–473 CrossRef CAS PubMed.
- Y. Sun, et al., Adsorption and cosorption of ciprofloxacin and Ni(II) on activated carbon-mechanism study, J. Taiwan Inst. Chem. Eng., 2014, 45(2), 681–688 CrossRef CAS.
- Y. X. Wang, H. H. Ngo and W. S. Guo, Preparation of a specific bamboo based activated carbon and its application for ciprofloxacin removal, Sci. Total Environ., 2015, 533, 32–39 CrossRef CAS PubMed.
- A. Chandrasekaran, et al., Adsorptive removal of Ciprofloxacin and Amoxicillin from single and binary aqueous systems using acid-activated carbon from Prosopis juliflora, Environ. Res., 2020, 188, 109825 CrossRef CAS PubMed.
- B. Zhang, et al., Response surface methodology approach for optimization of ciprofloxacin adsorption using activated carbon derived from the residue of desilicated rice husk, J. Mol. Liq., 2017, 238, 316–325 CrossRef CAS.
- J. Kong, et al., Synthesis and comparison studies of activated carbons based folium cycas for ciprofloxacin adsorption, Colloids Surf., A, 2020, 606, 125519 CrossRef CAS.
- S. A. Carabineiro, et al., Adsorption of ciprofloxacin on surface-modified carbon materials, Water Res., 2011, 45(15), 4583–4591 CrossRef CAS PubMed.
- Y. Gao, et al., Optimization preparation of activated carbon fromEnteromorpha prolifrausing response surface methodology and its adsorption studies of fluoroquinolone antibiotics, Desalin. Water Treat., 2014, 55(3), 624–636 CrossRef.
- L. Huang, et al., Adsorption of tetracycline and ciprofloxacin on activated carbon prepared from lignin with H3PO4 activation, Desalin. Water Treat., 2013, 52(13–15), 2678–2687 Search PubMed.
- X. Peng, et al., Adsorption behavior and mechanisms of ciprofloxacin from aqueous solution by ordered mesoporous carbon and bamboo-based carbon, J. Colloid Interface Sci., 2015, 460, 349–360 CrossRef CAS PubMed.
- N. Sharifpour, et al., Evaluation of the activated carbon coated with multiwalled carbon nanotubes in removal of ciprofloxacin from aqueous solutions, Appl. Water Sci., 2020, 10(6), 1–17 Search PubMed.
- H. Mao, et al., Modification of a magnetic carbon composite for ciprofloxacin adsorption, J. Environ. Sci., 2016, 49, 179–188 CrossRef CAS PubMed.
- E.-S. I. El-Shafey, H. Al-Lawati and A. S. Al-Sumri, Ciprofloxacin adsorption from aqueous solution onto chemically prepared carbon from date palm leaflets, J. Environ. Sci., 2012, 24(9), 1579–1586 CrossRef CAS.
- Y. Tang, et al., Engineering magnetic N-doped porous carbon with super-high ciprofloxacin adsorption capacity and wide pH adaptability, J. Hazard. Mater., 2020, 388, 122059 CrossRef CAS PubMed.
- S. K. Ghadiri, et al., Valorization of biomass into amine- functionalized bio graphene for efficient ciprofloxacin adsorption in water-modeling and optimization study, PLoS One, 2020, 15(4), e0231045 CrossRef CAS PubMed.
| This journal is © The Royal Society of Chemistry 2021 |


