
 Open Access Article
 This Open Access Article is licensed under a Creative Commons Attribution-Non Commercial 3.0 Unported Licence
Phyto-inspired Cu/Bi oxide-based nanocomposites: synthesis, characterization, and energy relevant investigation
Sundus Azhara,
Khuram Shahzad Ahmad *a,
Isaac Abrahamsb,
Wang Linc,
Ram K. Guptac,
Muhammad Mazhard and
Daoud Alie
*a,
Isaac Abrahamsb,
Wang Linc,
Ram K. Guptac,
Muhammad Mazhard and
Daoud Alie
aDepartment of Environmental Sciences, Fatima Jinnah Women University, Rawalpindi, Pakistan. E-mail: chemist.phd33@yahoo.com
bSchool of Biological and Chemical Sciences, Queen Mary University of London, London, UK
cDepartment of Chemistry, Pittsburg State University, Pittsburg, KS 66762, USA
dDepartment of Chemistry, School of Natural Sciences, National University of Sciences and Technology, H12, Islamabad, Pakistan
eDepartment of Zoology, College of Science, King Saud University, PO Box 2455, Riyadh 11451, Saudi Arabia
First published on 14th September 2021
Abstract
A modified and sustainable approach is reported in this research for the synthesis of a spherical-shaped CuO–Bi2O3 electrode material for electrochemical studies. Aqueous extract derived from the plant Amaranthus viridis L. (Amaranthaceae) (AVL) was used as a reducing agent for morphological control of the synthesis of CuO–Bi2O3 nanocomposites. The modified nanomaterial revealed an average crystal size of 49 ± 2 nm, which matches very well with scanning electron microscopy (SEM) findings. Furthermore, the synthesized material was characterized using Fourier-transform infrared spectroscopy, field emission SEM and energy-dispersive spectroscopy. The optical band gap energy of 3.45 eV was calculated using a Tauc plot. Finally, the bioorganic framework-derived CuO–Bi2O3 electrode was tested for energy generating and storage applications and the results revealed a capacitance of 389 F g−1 by cyclic voltammetry, with a maximum energy density of 12 W h kg−1 and power density of 5 kW kg−1. Hydrogen evolution reaction and oxygen evolution reaction studies showed good potential of CuO–Bi2O3 as an electrocatalyst for water splitting, with maximum efficiency of the electrode up to 16.5 hours.
1. Introduction
In the present era, the global population has already exceeded 7 billion and is expected to exceed 9 billion before the middle of this century. Such a large and rapid increase in global population also leads directly to increased demand for energy.1 Thus, the pressure on finite reserves of energy will also increase, leading to their depletion. Before we are faced with such drastic circumstances, the scientific community is required to produce cost effective, efficient, and renewable resources-based energy generation methods. This approach will not only lead us towards consolidation of sustainability, but also reduce the pressure on finite sources of energy. In this respect, both efficient production and storage of energy in the form of novel and efficient materials is highly researched.2,3 In ongoing research, production of hydrogen energy has been explored via the hydrogen evolution reaction (HER) and oxygen evolution reaction (OER). In addition, the storage of renewable forms of energy in different devices, especially supercapacitors, has been highly studied due to their efficient output and performance.4,5Hydrogen represents one of the most abundant elements that is present on earth, in the form of water, hydrocarbons, and carbohydrates. The combustion of hydrogen leads to the production of water and for this reason it is deemed a future candidate for energy production characterized by efficiency and cheaper costs. This can be partly attributed to the fact that hydrogen possesses greater efficiency, in comparison with traditional energy resources, for the production of more energy. However, in a practical sense, there are some challenges associated with the use of hydrogen. For instance, achieving hydrogen production in an efficient manner using some renewable energy resources is highly challenging.6–8 Conventional methods of hydrogen production are becoming obsolete, and other, advanced methods are replacing them. Utilization of high efficiency catalysts/electrocatalysts represents one such advancement. To accomplish efficiency improvement in the hydrogen evolution, several modern approaches have been adopted that include the use of catalysts to effect water splitting. Some other examples include electrocatalytic and photocatalytic procedures, thermochemical cycling, and several enzyme-driven reactions.9,10
Water splitting carried out with the aid of renewable energy using electrocatalysts is a promising strategy. IrO2 or RuO2 represent the two important metal oxides that have been used as efficient catalysts for hydrogen production in terms of the OER and HER. However, both metal oxides are quite costly. As a result of these unfavorable economics, the scientific community is turning its attention to other modes of electrocatalysis and energy storage using novel transition metal oxides.11,12 In addition to water splitting, the role of supercapacitors in the sustainable storage of energy is an integral technology required to achieve goals of sustainability. If the storage potential of a device is questionable, then no matter how much energy is produced with higher efficiency, it will all be wasted without an efficient storage medium. Supercapacitors are cherished because they exhibit an impressive storage potential over a very limited time duration. In addition, they are also known for their good cyclic stability, natural stability, and upper limit round trip efficiency. Such characteristics justify their use in different consumer products.13,14
Supercapacitors are further divided into electrical double layer capacitors (EDLCs), pseudocapacitors and hybrid supercapacitors, depending upon the mechanism of charge storage. EDLCs work on the principle of ion absorption and commonly use carbon-based materials as the electrode. Transition metal oxides and conducting polymers are used as the electrode material in pseudocapacitors, which store electrical charge through surface redox reactions. However, hybrid supercapacitors (SCs) employ the charge storage mechanism of EDLCs as well as those of pseudocapacitors.15–18
Although EDLCs exhibits fast charge and discharge rates, high power density, as well as good cycle stability, their energy storage capacity is lower in magnitude compared to that of batteries. On the other hand, pseudocapacitors can achieve higher capacitance and energy density in comparison with EDLCs due to reversible faradaic redox reactions.19,20 Metal oxides are considered as nano electrode materials due to their efficient and fast redox reactions, which are a result of their adaptable and variable oxidation. Different approaches are being used to enhance the efficiency of transition metal oxides/metal oxides. One such approach is the synthesis of nano-scaled MOx/TMOx.21–23 It is well understood that electrochemical features, such as catalysis, charge storage, and conductivity, are largely dependent on the surface area of the material. Nanoparticles (NPs), nanocomposites, and nanomaterials offer greater surface area for competent electrochemical reactions to enhance the energy storage and energy generation capacities of electrodes. Thus, synthesis of MOx nanomaterials is a topic of great interest among scientists.24–26
A large number of metal oxides have been synthesized to date and used for a myriad of applications. In terms of water splitting and supercapacitance, different metal oxides in the form of isolated oxides, composites, or hybrids have been reported. Such metal oxides are preferred over others as they show good optoelectronic and other properties. There are several physicochemical routes that lead to the synthesis of metal oxides. Metal oxides have also been synthesized through biogenic means by using phyto-constituents present in nature. Biogenic synthesis of metal oxides is preferable to other routes.27 Physical synthesis of metal oxides is marked by requirements for complicated machinery and methods, while chemical methods are associated with the introduction of obnoxious chemicals, which not only harm the environment, but also humans. Unlike these methods, the greener synthetic route does not require any complicated machinery, nor does it use toxic precursors for the reduction and stabilization of the metal salts.28,29 In fact, biogenic synthesis is compliant with all principles of green chemistry. A large number of plants, microbes, and other biological entities have been used for the synthesis of various materials, but plants represent the most beneficial bio-entity due to their availability. Additionally, plant parts are very simple to process, and they do not need to undergo complicated culturing procedures, as with microbes.30
A variety of plant materials have been used for the synthesis of metal oxides. In addition, different metal oxides synthesized via different routes have been used for applications of water splitting and supercapacitance. However, to the best of our knowledge, there are no reports available on Amaranthus viridis-driven CuO–Bi2O3-based oxide nanocomposites and their subsequent utilization for water splitting and energy storage. Therefore, for the first time, we have undertaken the task of using A. viridis for synthesizing the binary metal oxide composite of Cu and Bi. The phytometabolites extracted from A. viridis were used as reducing and stabilizing agents. The current work does not employ any toxic substances or complicated operational parameters. In this regard, the different types of techniques used to characterize the synthesized CuO–Bi2O3 composite were UV-visible spectrophotometry (UV-vis), Fourier-transform infrared spectroscopy (FTIR), X-ray diffraction (XRD), energy-dispersive X-ray spectroscopy (EDX), and field emission scanning electron microscopy (FE-SEM). In addition to these analytical techniques, the electrochemistry of the synthesized material was also studied for water splitting in terms of HER/OER and supercapacitance using cyclic voltammetry (CV) and linear sweep voltammetry (LSV). The current work notes the favorable nature of this plant-driven material for energy applications. Further optimization of such materials and synthesis of other metal oxides can lead to adoption of these materials in our daily lives to fulfil the demand for energy.
2. Experimental
2.1 Materials and methods
Analytical grade metal salts, i.e. copper(II) acetate monohydrate, bismuth(III) acetate, polyvinylidene difluoride (PVDF) [–(C2H2F2)n–], N-methyl pyrrolidinone (NMP) [C5H9NO], potassium hydroxide (KOH), and ethanol (C2H5OH) were purchased from Strem chemicals, Alfa Aesar, and Sigma Aldrich, Germany, respectively, and used without further purification. Acetylene black was obtained from VWR Chemicals BDH, UK. All solutions were prepared in deionized water (DI) and the apparatus was sterilized with ethanol and methanol.2.2 Foliar precursor preparation
The leaves of A. viridis were collected from the village Singola-Rawalakot, Poonch District, State of Kashmir, Pakistan, in the months May–June 2018. They were thoroughly washed with tap water and rinsed with distilled water and dried in a shady room to avoid interaction with sunlight. The drying process took 7–10 days. Dried leaves were ground to a fine powder with the help of a pestle and mortar and sieved to yield a fine powder, which was packed in a sealed plastic bag for further processing. The foliar extract of A. viridis was prepared by dissolving 10 grams of powdered plant leaves in 1000 mL of DI water and was stored at 4 °C for use as a reducing and stabilizing agent for the synthesis of the metal oxide nanocomposite.2.3 Amaranthus viridis-based functionalization electrocatalyst (CuO–Bi2O3) nanocomposite
For the biogenic synthesis of the electrocatalyst (CuO–Bi2O3) nanocomposite using precursor extracted from the plant, 20 mM solutions of copper(II) acetate monohydrate and bismuth(III) acetate were prepared in separate assemblages using 100 mL of DI water. The reaction mixtures containing metal salts in DI water in separate containers were stirred vigorously for 20–30 min without any heat treatment. After complete dissolution of both salts, they were mixed followed by subsequent addition of 10 mL of the foliar extract of A. viridis. Addition of the biological precursor was done in a drop-wise manner. Metal oxide complex containing Cu and Bi was incubated for 2 h and heat treatment of 70 °C was applied. Biogenic synthesis of the mixed metal oxide nanocomposite was visually detectable in the form of more rapid color transformation. The synthesized product was kept under dark conditions at room temperature overnight and then the aged solution was evaporated at 96 °C to obtain the dried powder of each material, which was then calcined at 450 °C for 4 h to obtain the respective oxides, and stored for further use in investigations for characterization and application.An Agilent Cary 100 UV-vis spectrophotometer (Agilent Technologies) was used for understanding optical parameters and a PerkinElmer Spectrum 10/65 FTIR spectrometer was used for investigating organic patterns in the nanocomposite. X-ray powder diffraction (PANalytical Cubi X3 XRD instrument) was used for the phase recognition, while SEM was performed using an FEI Quanta 3d ESEM coupled with EDX to check the morphological patterns and elemental composition of the electrocatalyst (CuO/Bi2O3) nanocomposite.
To investigate the electrochemical behavior and possible role of the electrocatalyst (CuO–Bi2O3) nanocomposite in energy production and storage, different techniques were applied. A CuO–Bi2O3 oxide-based working electrode was formed by the amalgamation of 80% weight of the electrocatalyst (CuO–Bi2O3) nanocomposite with about 10% by weight of acetylene black. To this mixture, PVDF (about 10% by weight) was also added in the presence of NMP. The reaction mixture was homogenized followed by deposition on the Ni foam, which was used as a current collector and mechanical support in the present study and has no contribution to the capacitive behavior of the electrode because of the negligible integrated area of the CV curves.31,32 The prepared electrode was then dried for 12 h inside a vacuum oven at 60 °C and analyzed OER/HER and supercapacitance using different electrochemical techniques, such as CV, galvanostatic charge discharge (GCD), LSV, and electrochemical impedance spectroscopy.
3. Results and discussion
The synthesized binary nanocomposite, CuO–Bi2O3, was subjected to FTIR studies to identify residual organic functional species from the AVL extract. The FTIR analysis is shown in Fig. 1. | ||
| Fig. 1 FTIR analysis of A. viridis-assisted CuO–Bi2O3 nanocomposite. (a) FTIR spectrum of dried material at 95 °C. (b) FTIR spectrum of thermally treated material at 450 °C. | ||
The nanocomposite was initially heated at 95 °C for solvent evaporation to obtain a dried pellet from thermal treatment. The dried pellet was probed by FTIR before calcination and the results obtained are displayed in Fig. 1a and Table 1. Various vibrational frequencies were observed before calcination, as shown in Fig. 1a, while peak intensities reduced after calcination and some peaks disappeared after being calcined at 450 °C. The vibration modes at 3369.53 and 2929.61 cm−1 were found before calcination, while these disappeared after thermal treatment. Similarly, the peaks at 1402.70 cm−1, 1042.20 cm−1, and 1011.12 cm−1 were not observed after calcination either, as shown in Fig. 1b. Nevertheless, minor vibrations, at 1978.77 cm−1, 1115.44 cm−1, and 841.10 cm−1, emerged after being subjected to temperatures of 450 °C, indicating the presence of carboxylic acid and aromatics in the final synthesized material.
| Before calcination (cm−1) | After calcination (cm−1) | Bonds | Functional groups | Ref. |
|---|---|---|---|---|
| 3369.53 | — | OH stretch, H-bond | Phenols | 33 |
| 2929.61 | — | OH stretch | Carboxylic acid | 33 and 34 |
| — | 1978.77 | OH stretch | Carboxylic acid | 35 and 36 |
| 1517.60 | 1507.17 | C–C stretch in ring | Aromatics | 37 and 38 |
| 1402.70 | — | C–C stretch in ring | Aromatics | 35 |
| — | 1115.44 | C–O stretch | Alcohol, carboxylic acid, ester, ether | 35, 36 and 38 |
| 1042.20 | — | C–O stretch | Alcohol, carboxylic acid, ester, ether | 33 and 35 |
| 1011.12 | — | C–O stretch | Alcohol, carboxylic acid, ester, ether | 33 and 34 |
| 841.10 | C–H loop | Aromatics | 35, 36 and 38 | |
| 688.50 | C–H loop | Aromatics | ||
| 610.67 | 604.54 | C–H loop | Aromatics | |
| 557.51 | 580.49 | M–O bond | Metal oxides | 33 and 39 |
| — | 552.23 | M–O bond | Metal oxides | 39 and 40 |
From Table 1, it can be seen that phenols are the major reducing and stabilizing agents present in the dried pellet, as well as in the calcined material. The presence of functional groups of aromatics and carboxylic acid further endorsed the AVL phenolic reducing and stabilizing agents. The vibrations under 500 cm−1 in both spectra in Fig. 1 demonstrate the metal oxide bonds, as described by Irum et al.,39 Zahra et al.,40 and Shume et al.41 Consequently, FTIR illustrated well the presence of organic functional groups from AVL in the synthesized binary oxides. Furthermore, the synthesized binary composite of CuO–Bi2O3 was examined by XRD for phase identification, crystallinity, and crystallite size. The XRD pattern of AVL-synthesized CuO–Bi2O3 is shown in Fig. 2.
 | ||
| Fig. 2 XRD patterns of the AVL-mediated CuO–Bi2O3 nanocomposite. | ||
The XRD pattern shows the Bi2O3 phase, in accordance with the JCPD file (00-041-14490), while prominent peaks of CuO corresponding to JCPD card (00-045-0937) are also present. The most prominent Bi2O3 peaks were found at 2θ = 26.9616, 27.4265, 33.2628, 33.9792, 46.3416, 46.9474, 51.9481, 52.4299, and 58.3274, corresponding to the (111), (120), (200), (022), (041), (−302), (033), (−321), and (231) hkl planes, respectively. The most notable peaks related to CuO were observed at 2θ = 32.7356, 35.4787, 38.7646, 48.6172, 51.7188, 53.0229, and 61.513, corresponding to (−110), (002), (111), (−202), (112), (020), and (−113), respectively. Therefore, XRD identified two the prominent phases of Bi2O3 and CuO. Furthermore, the crystal size of the CuO–Bi2O3 nanocomposite was calculated using eqn (1)
D = (0.9λ)/(β![[thin space (1/6-em)]](https://www.rsc.org/images/entities/char_2009.gif) cosθ) cosθ)
| (1) |
The average crystal size was found to be 49 ± 2 nm for synthesized CuO–Bi2O3 nanocomposite. Chemical investigation was continued using EDX to determine the elemental profile of the synthesized material. EDX spectra and the associated elemental composition are shown in Fig. 3.
 | ||
| Fig. 3 EDX analysis for elemental composition of the CuO–Bi2O3 nanocomposite. | ||
As shown in Fig. 3, Cu, Bi, and O were the only elements detected by EDX. According to the EDX analysis, the speculated formulae of the nanocomposites were CuO and Bi2O3, which is in excellent agreement with the XRD. The synthesized nanocomposite was then investigated by FE-SEM to examine its surface morphology, as shown in Fig. 4.
 | ||
| Fig. 4 FE-SEM images of CuO–Bi2O3 nanocomposites at (a) 5 μm, (b) 3 μm, (c) 1 μm, and (d) 500 nm. | ||
The morphology was examined at different resolutions and magnifications, as shown in Fig. 4a–d. At lower magnifications (Fig. 4a and b) uniformly arranged spongy (porous) nanoparticles were seen. The particles were even more uniformly arranged at higher magnification (Fig. 4c and d) with well-defined spherical nanostructures and particle sizes in the range 62–133 nm. The spherical nanostructures of the CuO–Bi2O3 nanocomposites synthesized using the AVL extract are in accord with those previously reported by Babu and Antony33 and Shaheen et al.39
3.1 UV-visible and optical properties
To evaluate the band gap energy the synthesized CuO–Bi2O3 nanocomposite was subjected to full-scan UV-visible spectroscopy, as depicted in Fig. 5. | ||
| Fig. 5 Tauc plot of the CuO–Bi2O3 nanocomposite: inset (UV-visible spectrum of CuO–Bi2O3). | ||
The absorbance spectrum of the synthesized CuO–Bi2O3 revealed a vibration between 250 and 400 nm, with a maximum at 293.19 nm. The absorbance data were used to calculate the optical band gap energy (direct band gap) using a eqn (2). The resulting band gap is shown in Fig. 5 as a Tauc plot. A direct band gap value of 2.7 eV was obtained. The band gap value obtained differs from that of CuO and Bi2O3 due to the effects of mixed/combined metal oxides.
| (αhν)2 = A1 (hν − Eg)r | (2) |
3.2 Supercapacitor studies
The AVL-synthesized binary nanocomposite was investigated for its supercapacitor behavior by means of CV and GCD, as shown in Fig. 6. The prominent oxidation reduction peaks were obtained from CV in Fig. 6a over a scan rate range from 2 mV to 300 mV. These peaks were due to the redox nature of CuO and Bi2O3. The redox peaks indicate the pseudocapacitive behavior of the investigated electrode, a typical behavior associated with, and reported for, metal oxides.39,42,43 This pseudocapacitive behavior was further illustrated by the GCD in Fig. 6b, where the obvious plateau type shapes of GCD can be observed. The GCD profile was recorded at varying current rates from 0.5 A g−1 to 30 A g−1.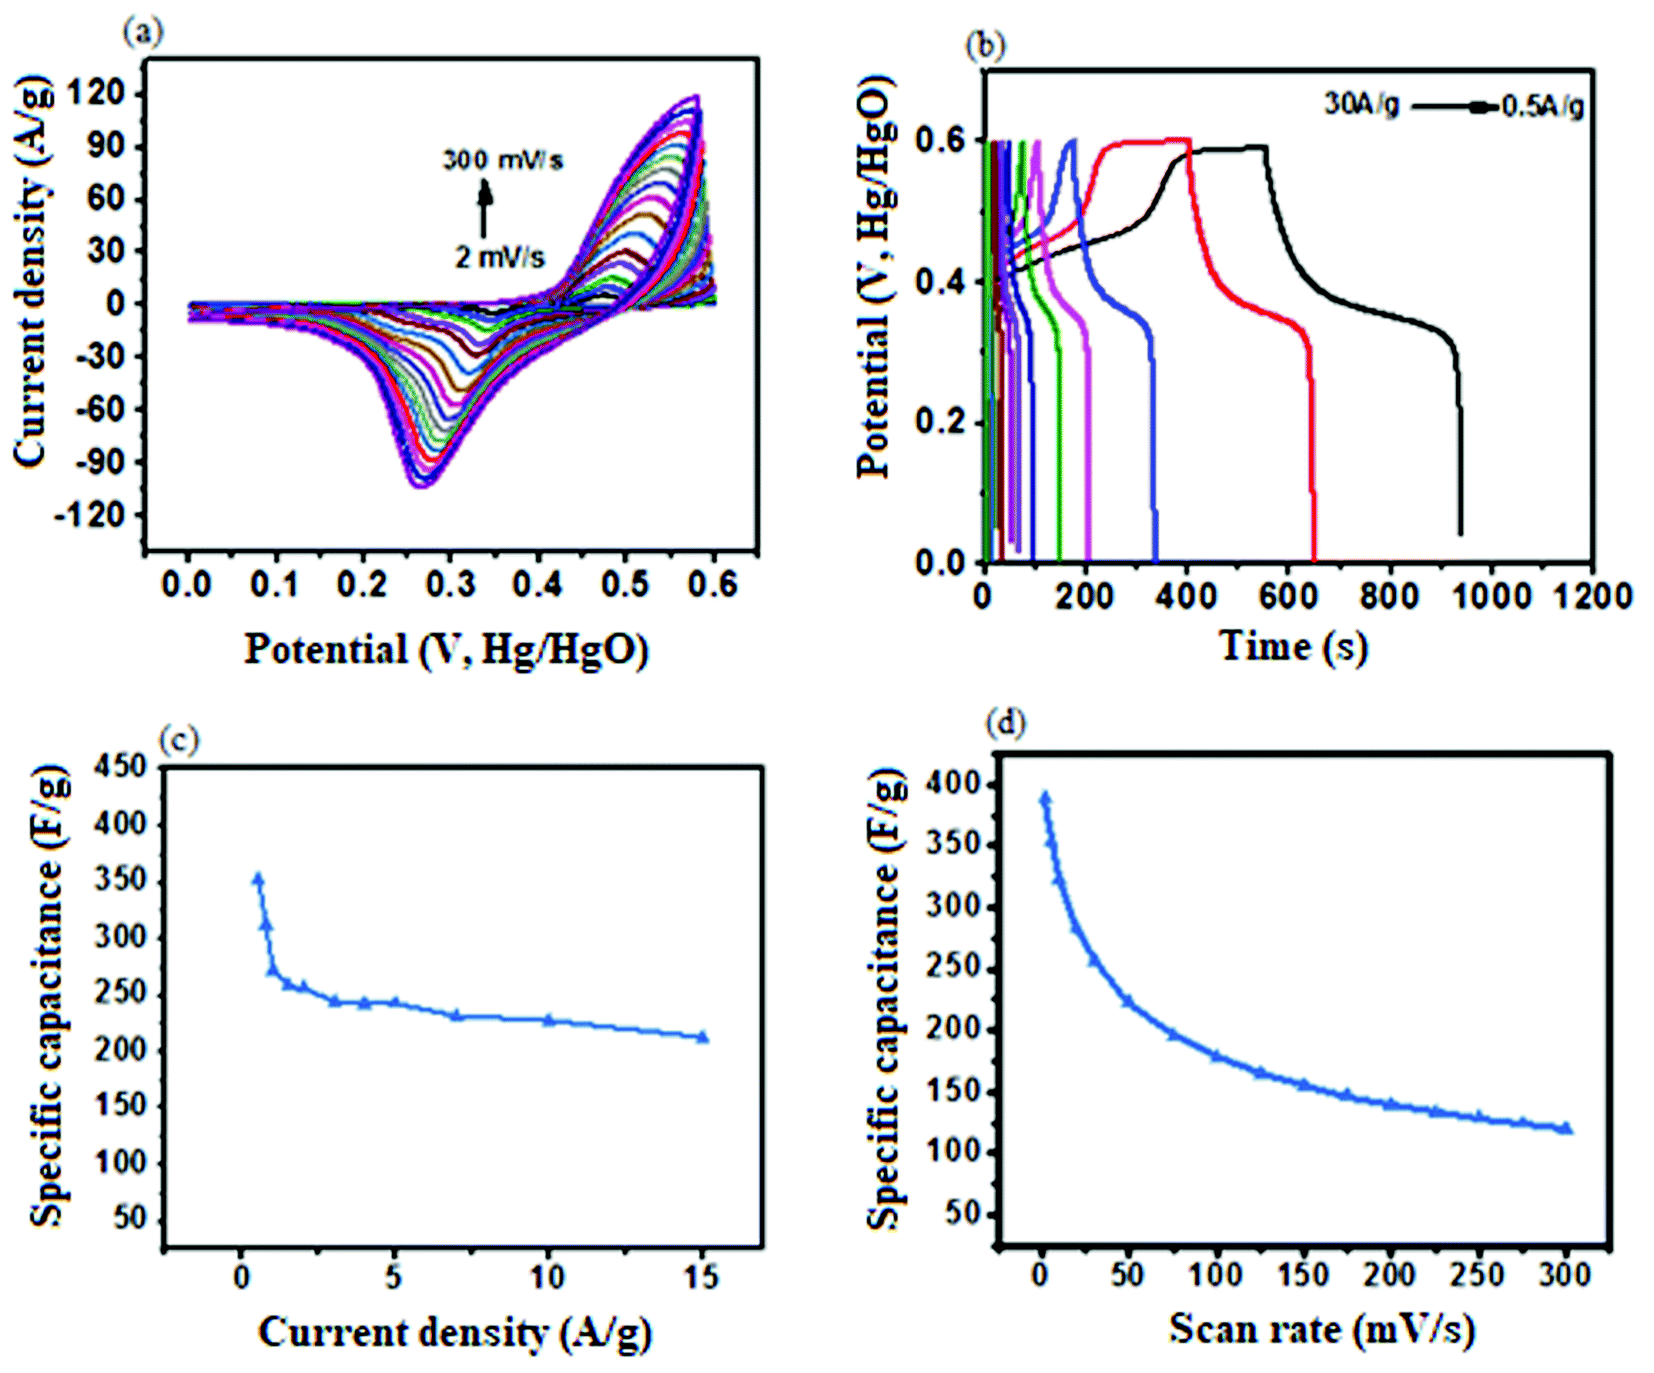 | ||
| Fig. 6 (a) CV profile of CuO–Bi2O3. (b) GCD measurements of CuO–Bi2O3. (c) Calculated specific capacity at different current densities. (d) Calculated specific capacity at different scan rates. | ||
According to Zan et al.,44 the redox (pseudocapacitive) peaks are due to the reversible reactions of Bi and Bi3+ according to the following reactions.
| Bi2O3 + H2O +2e− ⇌ Bi2O2 + 2OH− |
| Bi2O2 + 2H2O + 4e− ⇌ 2Bi + 4OH− |
Furthermore, based on CV data, the specific capacitance was calculated using the following equation.
 | (3) |
 is integral area of the CV curve, v is the scan rate, ΔV is the potential window, and A is the active area of the electrode material on the electrode (or mass of active material on the electrode). The capacitance was calculated at different scan rates and is noted in Fig. 6d. A specific capacitance of 389 F g−1 was obtained in the current study at 2 mV. This value is much higher than that obtained for numerous other fabricated CuO- and Bi2O3-based electrodes, as shown in Table 2.
The specific capacitance was further calculated using GCD data using the following equation:
 | (4) |
An enhanced capacitance of 352 F g−1 was observed at 0.5 A g−1, which is higher than many reported electrodes, as given in Table 3.
Energy density and power density of the CuO–Bi2O3 electrode were calculated using the following equations. The Ragone plot of energy density versus power density is shown in Fig. 7b.
 | (5) |
 | (6) |
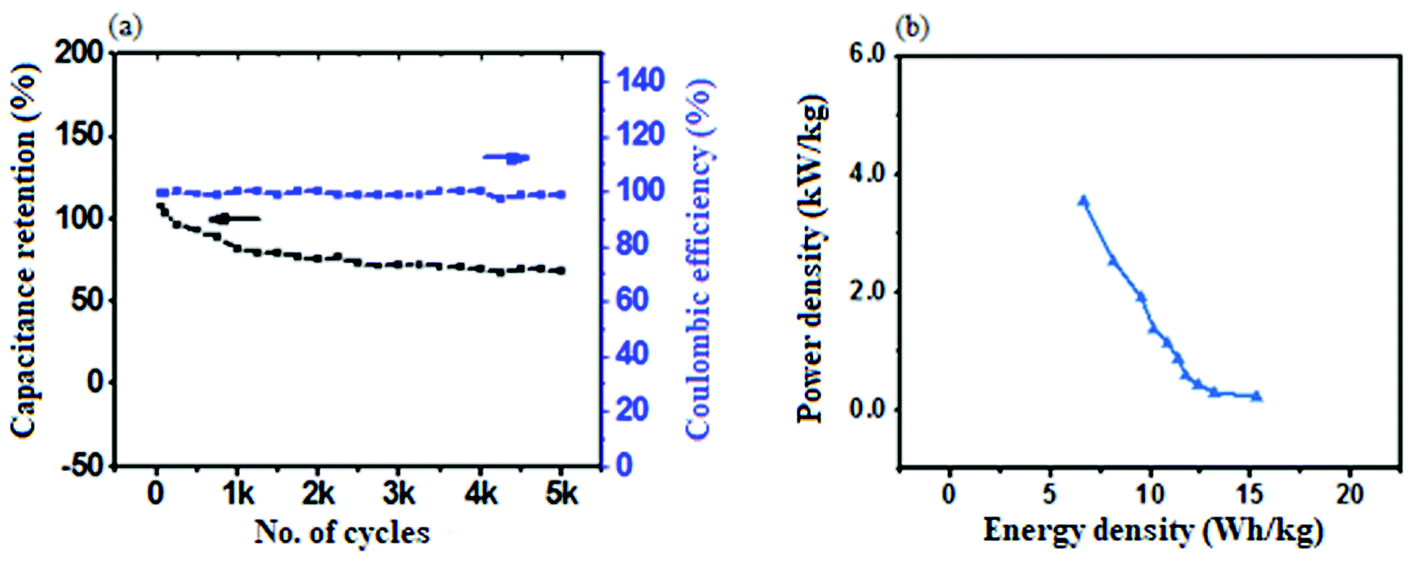 | ||
| Fig. 7 (a) Capacitance retention and coulombic efficiency (%) of the CuO–Bi2O3 electrode, demonstrating the stability of the electrode. (b) Ragone plot of the fabricated CuO–Bi2O3 electrode. | ||
The maximum energy density of 12 W h kg−1 was determined, while the maximum power density of 5 kW kg−1 was calculated as shown in the Ragone plot in Fig. 7b. The energy density is much higher than that reported for previous electrodes39,42,43,45 Subsequently, the stability of the CuO–Bi2O3 electrode was measured for 5000 cycles, as presented in Fig. 7a. A capacitance retention of 75% was revealed, with good stability of the electrode even at 5000 cycles. The coulombic efficiency (%) was measured using eqn (7) and exhibited 100% coulombic efficiency for 5000 cycles.
| η = tD/tC × 100% | (7) |
3.3 HER and OER measurements
The fabricated CuO–Bi2O3 electrode was further investigated for HER and OER measurements. Fig. 8 demonstrates the HER measurements for the electrode. | ||
| Fig. 8 HER measurements. (a) Cyclic stability of the CuO–Bi2O3 nanocomposite by LSV. (b) Polarization curve of the CuO–Bi2O3 nanocomposite. (c) Tafel slope of the CuO–Bi2O3 nanocomposite. | ||
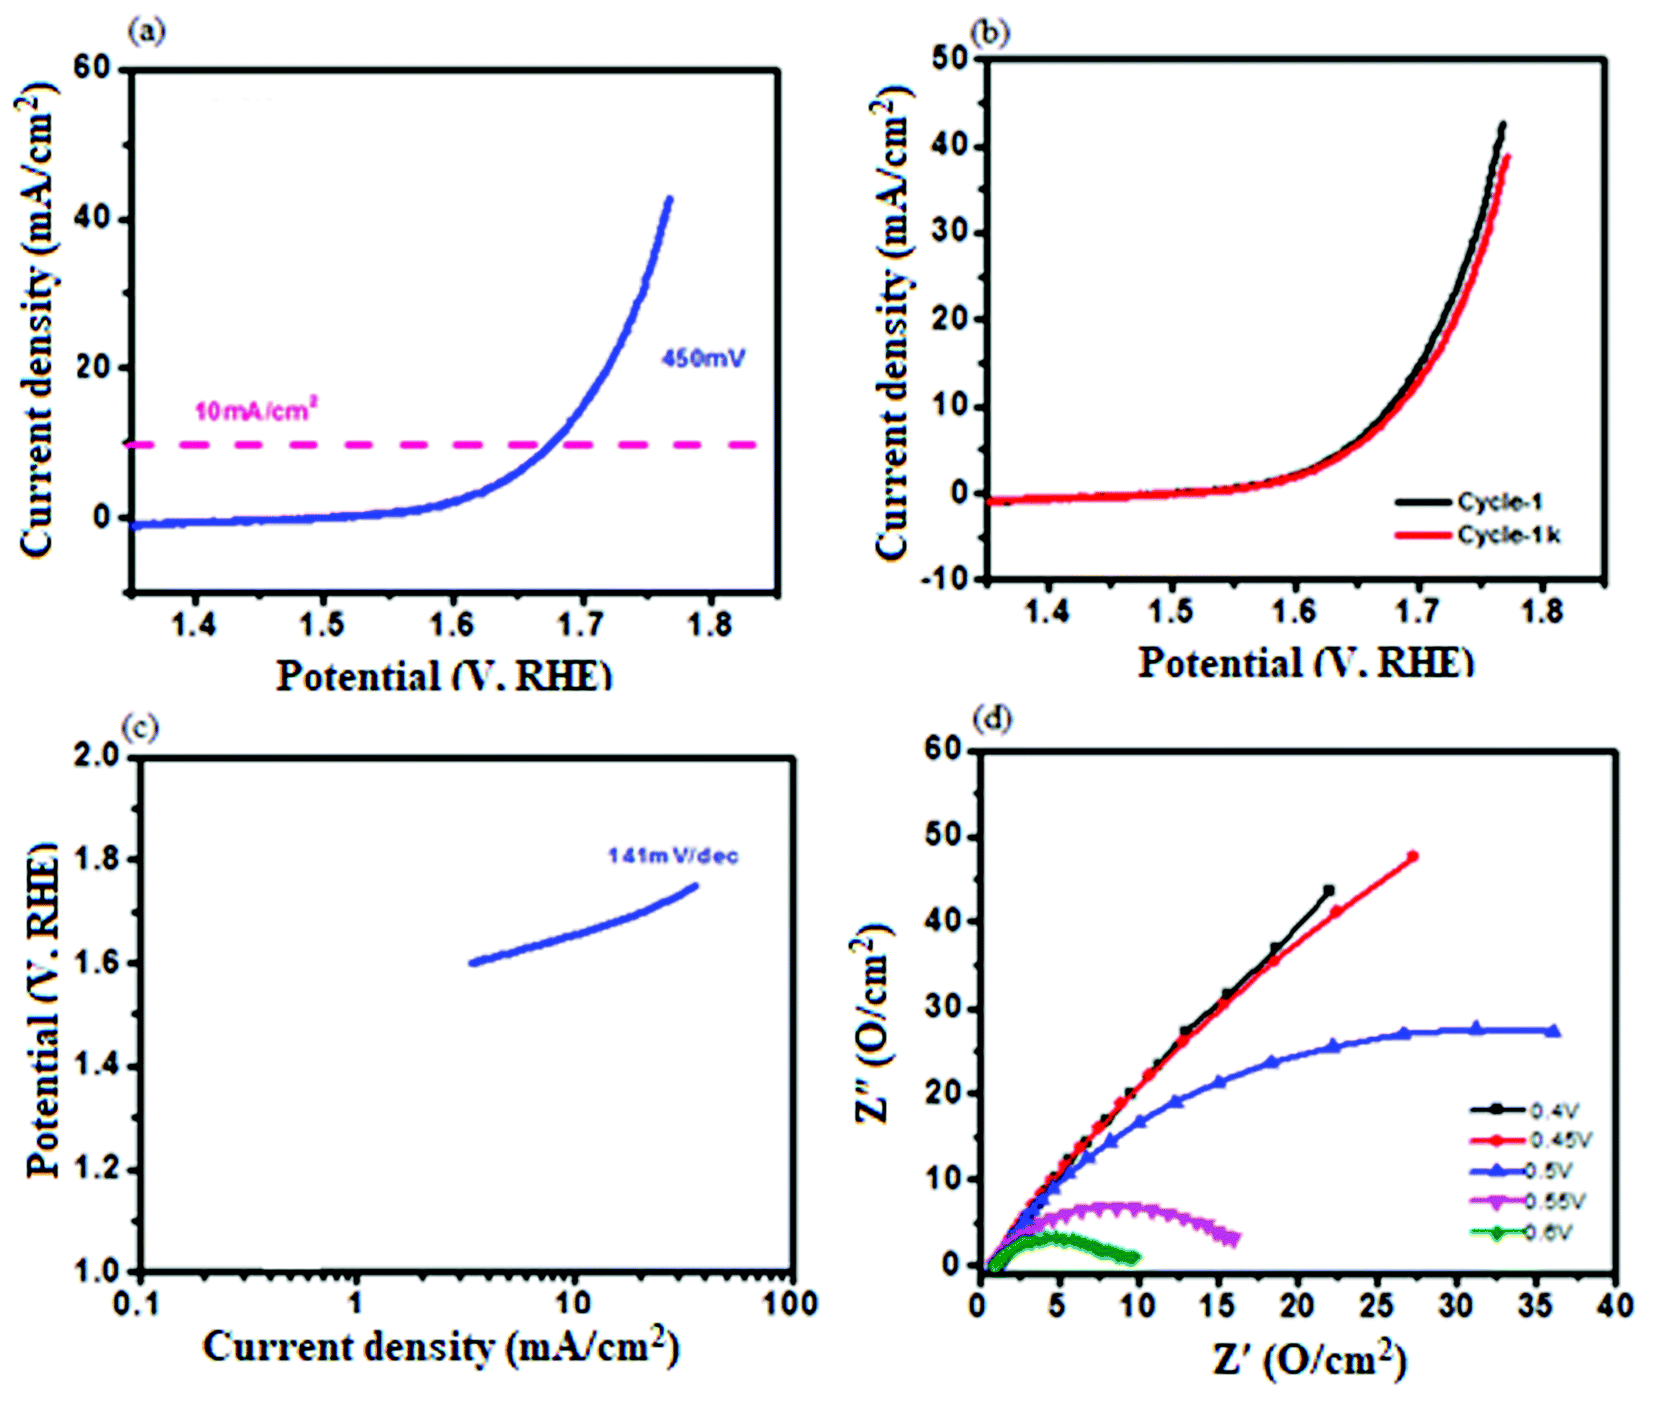
Fig. 8a reveals the cyclic stability of AVL-assisted CuO–Bi2O3. A total of 1000 LSV runs were carried out to investigate its stability. The CuO–Bi2O3 electrode exhibited a similar response up to 1000 cycles, indicating its good LSV-based electrochemical stability. The polarization curve in Fig. 8b shows an overpotential of 201 mV for the fabricated CuO–Bi2O3 electrode, while the HER-based Tafel slope gave 130 mV dec−1 for the CuO–Bi2O3 electrode in Fig. 8c. Furthermore, Fig. 9 demonstrates OER measurements for the investigated electrode.
 | ||
| Fig. 9 OER measurements. (a) Polarization curve. (b) Cycling runs of the CuO–Bi2O3 nanocomposite by LSV. (c) Tafel slope. (d) Variation of impedance as a function of frequency at various overpotentials. | ||
Maintenance of the efficiency of CuO–Bi2O3 for the OER is also well demonstrated in Fig. 9b, which shows negligible change up to 1000 cycles of LSV for CuO–Bi2O3. An overpotential of 450 mV was recorded for the OER as given in Fig. 9a, while a significant value of 141 mV dec−1 was found for the CuO–Bi2O3 nanocomposite by OER measurements, as depicted in Fig. 9c. Furthermore, the impedance behavior of the CuO–Bi2O3 nanocomposite-based electrode was investigated various potentials, as shown in Fig. 9d. It can be seen in Fig. 9d that with increasing potential the semicircle became smaller. At 0.6 V the smallest semicircle was obtained. Finally, the catalytic electrochemical stability of the CuO–Bi2O3 electrode was studied up to 18 h for overall water splitting and this is shown in Fig. 10.
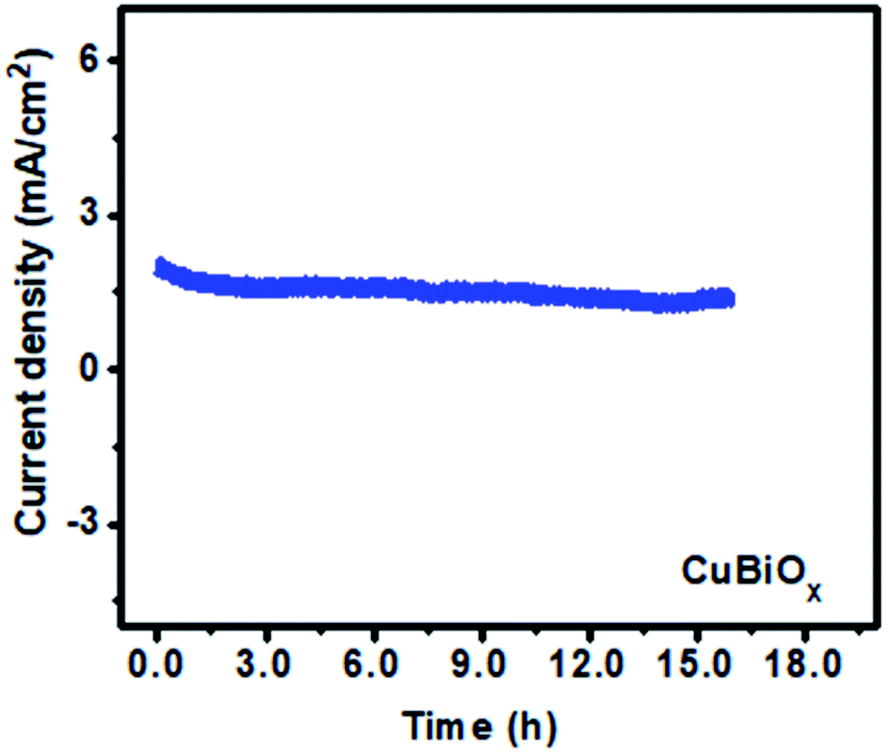 | ||
| Fig. 10 Stability test of CuO–Bi2O3 for overall water splitting. | ||
The maximum efficiency of the electrode was well maintained up to 16.5 h. Consequently, HER and OER studies combined illustrate the good potential of CuO–Bi2O3 as an electrocatalyst for overall water splitting.
4. Conclusions
A spherical-shaped CuO–Bi2O3-based electrode on Ni foam was synthesized successfully using a bioactive compound of A. viridis. An average crystal size of 49 ± 2 nm and particle size range of 62–133 nm was determined for the synthesized CuO–Bi2O3 nanocomposite. The synthesized material demonstrated efficient redox behavior with a specific capacitance of 389 F g−1 in 3 M KOH aqueous solution. An enhanced capacitance of 352 F g−1 was observed at a current density of 0.5 A g−1 and an energy density of 12 W h kg−1 was determined. The 75% capacitance retention was revealed with good stability of the electrode even at 5000 cycles. HER and OER studies showed good potential of CuO–Bi2O3 as an electrocatalyst for water splitting, with maximum efficiency of the electrode up to 16.5 hours, and enhanced electrochemical behavior of the CuO–Bi2O3-fabricated electrode was observed for supercapacitor applications.Conflicts of interest
The authors declare no conflict of interest.Acknowledgements
KSA, SA and MM thank the Higher Education Commission of Pakistan for IRSIP grant #1-8/HEC/HRD/2019/8866 and DNP grant #DNP-8/HRD/2017/03, respectively. The authors also acknowledge the Department of Environmental Sciences, Lab E-21, Fatima Jinnah Women University, Rawalpindi, Pakistan. KSA and SA also extends sincere gratitude to the School of Biological and Chemical Sciences, Queen Mary University of London, United Kingdom for synthesis and characterization. This work was funded by Researchers Supporting Project number (RSP-2021/165), King Saud University, Riyadh, Saudi Arabia. The authors also acknowledge the Department of Chemistry, Pittsburg State University, Pittsburg, KS 66762, USA for electrochemical testing and assistance.References
- G. Semieniuk, L. Taylor, A. Rezai and D. K. Foley, Nat. Clim. Change, 2021, 11(4), 313–318 CrossRef.
- A. Chandrasekar, D. Flynn and E. Syron, Int. J. Hydrogen Energy, 2021, 4, 28900–28911 CrossRef.
- A. Kovač, M. Paranos and D. Marciuš, Int. J. Hydrogen Energy, 2021, 46, 10016–10035 CrossRef.
- N. Sobti, S. Chaguetmi, S. Achour, L. Chaperman, F. Mammeri and S. Ammar-Merah, Solid State Sci., 2021, 113, 106551 CrossRef CAS.
- A. I. M. Albashir, W. Shang, M. K. Hadi, J. Zhang, T. Zhang and F. Ran, J. Energy Storage, 2021, 33, 102041 CrossRef.
- Z. He, Y. Yan, S. Feng, X. Li, R. Fang, Z. Ou and Z. Yang, Int. J. Hydrogen Energy, 2021, 46(5), 4460–4471 CrossRef CAS.
- Z. Li, G. Su and L. Zheng, Int. J. Hydrogen Energy, 2021, 46(24), 12784–12800 CrossRef CAS.
- H. Ishaq, O. Siddiqui, G. Chehade and I. Dincer, Int. J. Hydrogen Energy, 2021, 46(6), 4749–4760 CrossRef CAS.
- I. Shaheen, K. S. Ahmad, S. B. Jaffri and D. Ali, Renewable Energy, 2021, 167, 568–579 CrossRef CAS.
- S. Wu, Y. Xue, Q. Yang, Q. Hu, T. Cui, Q. Su and H. Zhan, Diamond Relat. Mater., 2021, 111, 108187 CrossRef CAS.
- W. Zhang, Y. Wang, H. Zheng, R. Li, Y. Tang, B. Li and K. Zhou, ACS Nano, 2020, 14(2), 1971–1981 CrossRef CAS PubMed.
- J. Prakash, S. Khan, S. Chauhan and A. M. Biradar, J. Mol. Liq., 2020, 297, 112052 CrossRef CAS.
- S. X. Wang, C. C. Jin and W. J. Qian, J. Alloys Compd., 2014, 615, 12–17 CrossRef CAS.
- M. Cossutta, V. Vretenar, T. A. Centeno, P. Kotrusz, J. McKechnie and S. J. Pickering, J. Cleaner Prod., 2020, 242, 118468 CrossRef CAS.
- P. Simon and Y. Gogotsi, Nat. Mater., 2008, 7, 845 CrossRef CAS PubMed.
- C. Liu, F. Li, L. P. Ma and H. M. Cheng, Adv. Mater., 2010, 22, E28–E62 CrossRef CAS PubMed.
- Y. P. Fu, X. Cai, H. W. Wu, Z. B. Lv, S. C. Hou, M. Peng, X. Yu and D. C. Zou, Adv. Mater., 2012, 24, 5713 CrossRef CAS PubMed.
- P. Elumalai and S. Shanmugavel, Polym.-Plast. Technol. Mater., 2021, 1–15, DOI:10.1080/25740881.
- H. P. Cong, X. C. Ren, P. Wang and S. H. Yu, Energy Environ. Sci., 2013, 6, 1185 RSC.
- I. E. Rauda, V. Augustyn, B. Dunn and S. H. Tolbert, Acc. Chem. Res., 2013, 46, 1113 CrossRef CAS PubMed.
- J. Qi, Y. Zhu, J. Zhang and C. Wang, ChemistrySelect, 2020, 5(19), 5657–5664 CrossRef CAS.
- N. R. Chodankar, H. D. Pham, A. K. Nanjundan, J. F. Fernando, K. Jayaramulu, D. Golberg and D. P. Dubal, Small, 2020, 16(37), 2002806 CrossRef CAS PubMed.
- E. Parthiban, N. Kalaivasan and S. Sudarsan, J. Inorg. Organomet. Polym. Mater., 2020, 30, 4677–4690 CrossRef CAS.
- S. A. M. Ealia and M. P. Saravanakumar, IOP Conf. Ser.: Mater. Sci. Eng., 2017, 263, 032019 Search PubMed.
- S. Dąbrowska, T. Chudoba, J. Wojnarowicz and W. Lojkowski, Crystals, 2018, 8(10), 379 CrossRef.
- J. Liang, Q. Liu, T. S. Li, Y. Luo, S. Lu, X. Shi and X. Sun, Green Chem., 2021, 23, 2834–2867 RSC.
- S. B. Jaffri and K. S. Ahmad, Environ. Sci. Pollut. Res., 2020, 27, 9669–9685 CrossRef CAS PubMed.
- D. T. C. Nguyen, H. H. Dang, D. V. N. Vo, L. G. Bach, T. D. Nguyen and T. Van Tran, J. Hazard. Mater., 2021, 404, 124146 CrossRef CAS PubMed.
- A. R. Gul, F. Shaheen, R. Rafique, J. Bal, S. Waseem and T. J. Park, Chem. Eng. J., 2021, 407, 127202 CrossRef CAS.
- A. Jain, S. Wadhawan and S. K. Mehta, Environ. Nanotechnol. Monit. Manag., 2021, 16, 100464 Search PubMed.
- A. Hussain, M. Oves, M. F. Alajmi, I. Hussain, S. Amir, J. Ahmed and I. Ali, RSC Adv., 2019, 9(27), 15357–15369 RSC.
- C. Gervas, M. D. Khan, S. Mlowe, C. Zhang, C. Zhao, R. K. Gupta and N. Revaprasadu, ChemElectroChem, 2019, 6(9), 2560–2569 CrossRef CAS.
- A. T. Babu and R. Antony, J. Environ. Chem. Eng., 2019, 7(1), 102840 CrossRef CAS.
- J. Suresh, G. Pradheesh, V. Alexramani, M. Sundrarajan and S. I. Hong, Adv. Nat. Sci.: Nanosci. Nanotechnol., 2018, 9, 015008 Search PubMed.
- T. Yan, W. Bing, M. Xu, Y. Li, Y. Yang, G. Cui and M. Wei, RSC Adv., 2018, 8(9), 4695–4702 RSC.
- N. Justh, B. Berke, K. László, L. P. Bakos, A. Szabó, K. Hernádi and I. M. Szilágyi, Appl. Surf. Sci., 2018, 453, 245–251 CrossRef CAS.
- M. J. Limo, A. Sola-Rabada, E. Boix, V. Thota, Z. C. Westcott, V. Puddu and C. C Perry, Chem. Rev., 2018, 118(22), 11118–11193 CrossRef CAS PubMed.
- M. Ghozali, S. Fahmiati, E. Triwulandari, W. K. Restu, D. Farhan, M. Wulansari and W. Fatriasari, Polym.-Plast. Technol. Mater., 2020, 59(12), 1332–1342 CAS.
- I. Shaheen, K. S. Ahmad, C. Zequine, R. K. Gupta, A. Thomas and M. A. Malik, RSC Adv., 2020, 10(14), 8115–8129 RSC.
- T. Zahra and K. S. Ahmad, Optik, 2020, 205, 164241 CrossRef CAS.
- W. M. Shume, H. C. Murthy and E. A. Zereffa, J. Chem., 2020, 5, 1–15 Search PubMed.
- H. Hwang, J. H. Shin, K. Y. Lee and W. Choi, Appl. Surf. Sci., 2018, 428, 422–431 CrossRef CAS.
- L. Gurusamy, S. Anandan, N. Liu and J. J. Wu, J. Electroanal. Chem., 2020, 856, 113489 CrossRef CAS.
- G. Zan, T. Wu, P. Hu, Y. Zhou, S. Zhao, S. Xu and Q. Wu, Energy Storage Mater., 2020, 28, 82–90 CrossRef.
- D. P. Dubal, G. S. Gund, C. D. Lokhande and R. Holze, Mater. Res. Bull., 2013, 48(2), 923–928 CrossRef CAS.
- I. Y. Bu and R. Huang, Ceram. Int., 2017, 43(1), 45–50 CrossRef CAS.
- P. S. Murphin Kumar., H. H. Kyaw, M. T. Z. Myint, L. Al-Haj, A. A. H. Al-Muhtaseb, M. Al-Abri and V. K. Ponnusamy, Int. J. Energy Res., 2020, 44(13), 10682–10694 CrossRef CAS.
- S. Veeralakshmi, S. Kalaiselvam, R. Murugan, P. Pandurangan, S. Nehru, S. Sakthinathan and T. W. Chiu, J. Mater. Sci.: Mater. Electron., 2020, 31(24), 22417–22426 CrossRef CAS.
| This journal is © The Royal Society of Chemistry 2021 |