 Open Access Article
Influence of coal treatments on the Ni loading mechanism of Ni-loaded lignite char catalysts
Ronnachai Tipo ac,
Chatchawan Chaichanab,
Reiji Nodad and
Suparin Chaiklangmuang
 *cef
*cef
aGraduate Program in Industrial Chemistry, Faculty of Science, Chiang Mai University, Chiang Mai 50200, Thailand
bDepartment of Mechanical Engineering, Faculty of Engineering, Chiang Mai University, Chiang Mai 50200, Thailand
cDepartment of Industrial Chemistry, Faculty of Science, Chiang Mai University, Chiang Mai 50200, Thailand. E-mail: suparin.c@cmu.ac.th
dDepartment of Environmental Engineering Science, Graduate School of Science and Technology, Gumma University, Gunma 376-8515, Japan
eCenter of Excellence in Materials Science and Technology, Faculty of Science, Chiang Mai University, Chiang Mai, 50200, Thailand
fMaterials Science Research Center, Faculty of Science, Chiang Mai University, Chiang Mai 50200, Thailand
First published on 3rd November 2021
Abstract
Many kinds of lignite coals have been used as catalyst supporters for preparing the Ni-loaded lignite char catalyst. However, these coals have different properties; especially ash content. The ash in coal affects the mechanism of Ni-loading on the position of the functional group structures in coal. In catalyst preparation, it is interesting that the difference in coal properties might directly influence the mechanism of Ni loading. To prove this point, the coal sample needed to be treated before the catalyst preparation. MM coal (original coal) was treated with acid (HClMM and AceMM coals), alkali (NaMM coal) and alkali followed by acid treatments (NaHClMM and NaAceMM coals). Then, Ni was loaded on the five treated coals by the ion-exchange technique. The Ni-loaded lignite coals were pyrolyzed at 650 °C under a N2 atmosphere to prepare the Ni-loaded lignite char catalysts. The Ni-loading mechanisms were studied via FTIR, XRD, AAS and SEM-EDS analyses. The results showed that the different treatments affected the ash content and the functional groups in the coals. The decreases in the ash contents of HClMM, AceMM, NaHClMM and NaAceMM coals indicated that the exchangeable metallic species were removed by transforming metal-carboxylates into carboxyl groups. The transformations of metal-carboxylates were confirmed by the increased Δϑ(COO−) value. For acid treatment, the ion exchange of Ni was controlled by carboxyl groups, while in alkali treatment it occurred through hydroxyl and metal-carboxyl groups. In alkali followed by acid treatment, Ni ions were exchanged with hydroxyl and carboxyl groups. The Ni ion forms, Ni(NH3)62+ and/or Ni(H2O)62+, appeared on the modified coals. Through pyrolysis, the Ni ion was reduced to Ni metal that was observed in the XRD patterns of the catalysts. The Ni contents of the catalysts were in the range of 16.51–20.07 wt%. The thermal behaviours of the catalysts were presented via TGA-DTG.
1. Introduction
Lignite has mostly been used as a major fuel in power generation. However, it has caused many environmental problems that are critical global issues, such as climate change, global warming, air pollution and acid rain. Accordingly, several researchers have attempted to find other ways to take advantage of lignite. One of the greatest advantages of lignite is the abundance of oxygen-containing functional groups such as phenolic hydroxyl, carboxyl, ether and carbonyl groups.1 These oxygen-containing functional groups are able to exchange ions with metal ions and disperse them within the coal matrix.2 Therefore, lignite has been used as a catalyst support material to prepare noble metal catalysts, particularly Ni-loaded lignite char catalysts.Several literature reviews report2–6 that many kinds of lignite coals have been used as a catalyst supporter for preparing Ni-loaded lignite catalysts such as Loy Yang coal, Yollourn coal, Eco coal, Mea Moh coal and Shengli coal. The catalysts were prepared from each of these high-performance lignite coals to produce H2 in biomass gasification. However, these coals had different properties; especially ash content. Loy Yang, Yollourn and Eco coals showed low ash content in the range of 0.40–4.20 wt% (ref. 2–4) while, Mea Moh coal and Shengli coal showed high ash content in the range of 6.50–25.12 wt%.5,6 It is well known that the ash content in coal is related to the mineral matter in coal.7 Most mineral matter in low-rank coal is exchangeable metallic species such as Na+, K+, Ca2+ and Mg2+. These exchangeable metallic species are associated with the oxygen-containing functional groups.8
According to the analysis of the coal treatment literature, it was found that the coal treatment had several methods such as acid treatment, alkali treatment and alkali followed by acid treatment. Each of the methods had a different effect on ash removal in coal. Acid treatment demineralized some minerals in coal such as carbonates, Fe2O3, and sulphides; however, it could not leach the clay-bearing minerals.9 For alkali treatment, alkali solutions such as NaOH could dissolve silica and alumina and other silica-alumina clay-bearing minerals in coal and convert them into sodium silicate and sodium aluminate, which were leached out into the solution.10 For the alkali followed by acid treatment, the combination of alkali and acid treatments was one of the great methods for ash removal in coal because the acid treatment could dissolve sodalites and sodium-aluminosilicates that were formed after the alkali treatment. Sometimes, mild acid washing also reduced the extra sodium compounds along with acid-soluble minerals in coal.11
Previous reports on coal treatment also indicated that the types of leaching reagents affected the properties of coal or carbon materials. For instance, Starck et al.12 reported that the coal treatment with HCl and HF acid solution could remove ash and significantly modify the surface chemistry of lignite, which was able to develop the adsorbent properties of lignite. Ren et al.13 found that coal treatment with HCl significantly decreased the content of metal cation associated with the oxygen-containing functional groups. It led to an increase in Ni-loading and improved the characteristics of the Ni-loaded lignite char catalyst. Radenovic and Malina14 reported that acetic acid could modify carbon black to adsorb nickel ions from an aqueous solution because acetic acid contained carboxylic functional groups. The affinity of the carboxylic functional groups for metal ions was high. As a result, the adsorption of Ni on carbon black increased. Shah et al.15 reported that the acetic acid treatment could improve the adsorption capacities and selectivity for dibenzothiophene of activated charcoal due to an increase in the surface area, pore size and pore volume. Mukherjee et al.16 found that coal treatment with NaOH solution could remove the ash in coal and improve the cation exchange capacity of coal due to the accumulation of sodium aluminosilicate. Sodium aluminosilicate could entrap water molecules and soluble salt, and sodium ions in NaOH-treated coal were also exchangeable. Feng et al.17 discovered that the elimination of minerals and organic matter in coal by NaOH treatment caused an increase in the macropore volume, which could increase the adsorbed water content. These literature reviews reflected that coal treatment with different chemical reagents not only removed ash in coal but might also affect coal properties, especially the adsorption and cation exchange capacities. Interestingly, the coal treatment might influence the mechanism of the ion exchange of metal ions to prepare Ni-loaded lignite char catalyst. Consequently, it is one of the points considered worthwhile for discussion in this study.
Our previous publications mainly focused on the usage of a novel Ni/char catalyst via ion exchange in some applications such as catalytic steam gasification6,18 and catalytic hydro-treatment19 on various materials. In terms of catalyst preparation, it is doubtful that the difference in ash content in coal might directly influence the mechanism of the ion exchange of metal ions with oxygen-containing functional groups on coal. A few studies have been conducted on this issue and the results have been unclear.
To prove and understand the influence of the ash content in coal on the mechanism of Ni ion exchange on coal, this work has focused on the influence of coal treatment on the Ni ion-exchange mechanism for the preparation of Ni-loaded lignite char catalyst. Mae Moh coal (MM coal) was represented in this study. MM coal was subjected to acid treatment, alkali treatment and alkali followed by acid treatment; the modified coals were used as catalyst supporters. The leaching reagents, HCl, CH3COOH and NaOH, were applied in the coal treatments. The treated coals were prepared as Ni-loaded lignite coals by an ion-exchange method, then the Ni-loaded lignite coals were made into Ni-loaded lignite catalysts by pyrolysis at 650 °C under N2 atmosphere. The ash contents of untreated coal and treated coals were determined using different analytical techniques. Fourier Transform Infrared Spectroscopy (FTIR) analysis was performed as the major technique for investigating the mechanisms of Ni-loaded lignite char catalysts. Moreover, all catalysts in this work were characterized by X-ray Diffraction (XRD), Atomic Absorption Spectroscopy (AAS), SEM-EDS and TGA-DTG analyses to support the investigations.
2. Materials and methods
2.1 Material
The lignite coal was collected from the Mae Moh Mine of the Electricity Generating Authority of Thailand. The coal sample was sieved to provide a particle size of ≤0.25 mm. The coal sample examinations in terms of the proximate, ultimate, calorific value and total sulphur were analysed according to ASTM E870-82, ASTM D3176, ASTM E711-87 and ASTM D3177, respectively. The main chemical composition of MM coal was analysed by X-ray Fluorescence Spectroscopy (XRF), which was done according to ASTM D 4326-13.2.2 Methods
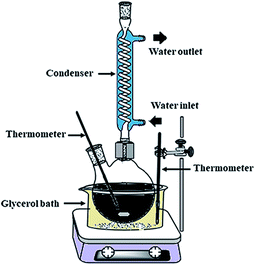
(i) Acid treatment; HCl and CH3COOH solutions were used as leaching agents to treat MM coal. According to our previous research,20 MM coal was mixed with 0.5 M of the acids. The mixtures were refluxed by stirring for 3 h and then the mixtures were cooled and filtered. The residues were washed with hot deionized water and dried at 105 °C overnight. The coals treated with HCl and CH3COOH were labelled HClMM and AceMM, respectively.
(ii) Alkali treatment; the coal sample was mixed with 2.5 M NaOH under reflux for 1 h.10,21,22 The residue was separated, washed and dried. The alkali-treated coal was called NaMM coal.
(iii) Alkali followed by acid treatment; NaMM coal was continuously treated with HCl and CH3COOH solutions at 0.5 M and the procedures were similar to process (i). The treated coals were identified as NaHClMM coal and NaAceMM coal, respectively.
After the treatments, the coals were analysed by proximate analysis and the total sulphur content was determined by using standard methods (ASTM D3174 and ASTM D3177, respectively). The percentages of ash removal in the coal treatments were calculated using eqn (1).
| Ash removal (%) = [(W1 − W2)/(W1)] × 100 | (1) |
The first stage was the preparation of Ni-loaded lignite coal. A basic hexa-amine nickel carbonate solution ((NH3)6NiCO3) was prepared by the mixing of NiCO3·2Ni(OH)2·4H2O (Sigma Aldrich), (NH4)2CO3 (QReC), NH4OH (Carlo Erba) and distilled water. The untreated and treated coals were mixed with (NH3)6NiCO3 solution for 24 h at room temperature for the ion exchange. The ion-exchanged coals were filtered and washed with DI water until neutral. The modified coals were dried for 24 h at 107 °C and the prepared Ni-loaded lignite coal was completed and collected in a desiccator.
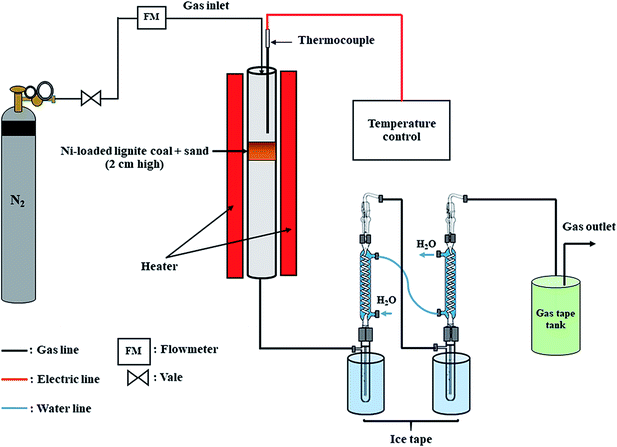
In the second stage of the preparation of the Ni-loaded lignite char catalyst, 1 g of Ni-loaded lignite coals were mixed with 25 g of sand (with a particle size of 1–2 mm) to provide a 2 cm high catalyst bed. The mixture was added into the catalytic reactor and pyrolyzed in a flow of N2 atmosphere at 120 ml min−1 from ambient temperature to 650 °C for 30 min and held for 1 h. The schematic diagram of the experimental setup for the Ni-loaded lignite char catalyst preparation is shown in Fig. 2. The catalyst samples were called Ni/MMchar, Ni/HClMMchar, Ni/AceMMchar, Ni/NaMMchar, Ni/NaHClMMchar and Ni/NaAceMMchar according to the preparations in 2.2.1.
2.3 Analytical methods
The functional groups of the Ni-loaded lignite coal samples and Ni-loaded lignite char catalysts were measured by Attenuated Total Reflectance Fourier Transform Infrared Spectroscopy (ATR-FTIR, PerkinElmer, Frontier). The ATR-FTIR spectra were recorded in the scan range of 500–4000 cm−1 at a resolution of 4 cm−1.The Ni contents in the catalysts were analysed by Atomic Absorption Spectroscopy (PerkinElmer, AAnalyst 100) was done according to ASTM D 3683.
The phase and crystallinity of Ni-loaded lignite catalysts were analysed by X-ray diffraction in the powder mode (Phillips X-'pert) using CuK radiation (20 kV, 20 mA) with a scanning speed of 5° min−1. The data were characterized using the Joint Committee on Powder Diffraction Standards (JCPDS).
The surface morphologies of the catalysts were investigated by field emission scanning electron microscopy and energy-dispersive X-ray spectroscopy (FESEM-EDS, JEOL JSM-6335F).
The thermal behaviours and stabilities of the catalysts were determined by TGA-DTG analysis. Firstly, the samples were dried at 105 °C for 60 min. Then, 10 mg of samples were contained in an Al2O3 pan for testing in a simultaneous thermal analyser (STA, Rigaku, Thermo plus EVO2). The temperature-programmed pyrolysis was conducted under N2 flow from ambient temperature to 1000 °C at 10 °C min−1. The results of thermogravimetry (TG) and derivative thermogravimetry (DTG) were obtained using the software of the analyser.
3. Results and discussion
3.1 Raw material
MM coal was represented as a lignite coal sample in this study because it was the main lignite coal in Thailand. The properties of MM coal are summarized in Table 1. The MM coal had a high ash content (14.00 wt%), low total sulphur content (1.01 wt%) and high oxygen content (23.21 wt%).| Proximate analysis (wt%) | Ultimate analysis (wt%, daf) | St (wt%) | Calorific value (cal g−1) | ||||||
|---|---|---|---|---|---|---|---|---|---|
| Mar | VMd | Ad | FCdb | C | H | N | Ob | ||
| a M: moisture, VM: volatile matter, A: ash content, FC: fixed carbon, St: total sulphur, ar: as received basis, b: by difference, d: dried basis and daf: dried and ash-free basis. | |||||||||
| 19.62 | 41.48 | 14.00 | 44.52 | 69.36 | 4.80 | 2.63 | 23.21 | 1.01 | 3804 |
In Table 2, the properties of the MM coal were compared with the other coals that were used in the preparation of Ni-loaded lignite char catalysts such as Loy Yang coal, Yollourn coal, Eco coal and Shengli coal. MM coal had higher ash content (14.00 wt%) as compared to the other coals, which indicated the high mineral matter. Generally, the mineral matter in coals can be divided into three different types: (i) dissolved salts and other inorganic substances in the coal's pore water, (ii) exchangeable metallic species associated with the organic structure of the coal matrix, and (iii) discrete inorganic particles (crystalline or non-crystalline), representing true mineral components.8,24 For low-rank coal like lignite, most of the mineral matter is usually exchangeable metallic species such as Na+, K+, Ca2+ and Mg2+. These exchangeable metallic species are associated with the oxygen-containing functional groups in the form of carboxylate.8 Possible positions of the exchangeable metallic species in the coal structure are shown in Fig. 3.
| Coal | Properties (wt%) | Ref. | |||
|---|---|---|---|---|---|
| VMd | FCd | Ad | St | ||
| a VM: volatile matter, A: ash content, FC: fixed carbon, St: total sulphur content, d: dried basis. | |||||
| Loy Yang | 54.80 | 44.40 | 0.70 | 0.20 | 2 |
| Yollourn | 53.30 | 45.00 | 1.60 | 0.30 | 3 |
| Eco | 53.40 | 42.70 | 4.20 | 0.10 | 4 |
| Shengli | 43.20 | 50.30 | 6.50 | 0.30 | 5 |
| Mae Moh | 41.48 | 44.52 | 14.00 | 1.00 | This study |
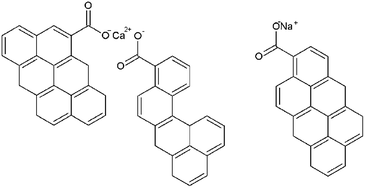 | ||
| Fig. 3 Possible positions of the exchangeable metallic species in the coal structure.8 | ||
Table 3 indicates the major chemical composition of MM coal in weight percentage obtained from XRF analysis in terms of oxide compounds. The large metal elements in MM coal were mainly Ca, Al, Mg, Na and Fe, and the quantities of CaO, Al2O3, MgO, Na2O and Fe2O3 were 20.09, 13.29, 8.64, 6.40 and 5.79 wt%, respectively. Ni in the form of NiO was present in a small amount, 1.19 wt%, in MM coal. Among the main metal elements, Ca and Mg, in particular, might be the exchangeable metallic species. According to Ward,25 one-half of the calcium and most of the magnesium in Mea Moh coal were found in the form of exchangeable metallic species. As a result, it was possible that the difference in ash content might be correlated to the exchangeable metallic species contained in coal and influenced the Ni ion-exchange mechanism of the preparation of Ni-loaded lignite char catalyst. Consequently, MM coal was quite suitable for use as a catalyst supporter in this study. To prove this assumption, MM coal was treated to remove the ash content. However, the coal treatment involved several methods, namely acid treatment, alkali treatment and alkali followed by acid treatment. Each of the coal treatment methods had different effects on the ash removal and the Ni ion-exchange mechanism. Therefore, these treatments were applied in this research and their results are discussed in the next section.
| Fe2O3 | Al2O3 | MgO | SiO2 | CaO | K2O | Na2O | TiO2 | MnO2 | P2O5 | SO3 | NiO | |
|---|---|---|---|---|---|---|---|---|---|---|---|---|
| MM coal | 5.79 | 13.29 | 8.64 | 23.92 | 20.09 | 1.34 | 6.40 | 0.25 | 0.14 | 0.42 | 18.53 | 1.19 |
3.2 Coal treatment
| Coal sample | Properties (wt%) | Ash removal (%) | |||
|---|---|---|---|---|---|
| VMd | Ad | FCd | St | ||
| a VM: volatile matter, A: ash content, FC: fixed carbon, St: total sulphur content, d: dried basis. | |||||
| MM coal | 41.48 | 14.00 | 44.53 | 1.01 | — |
| HClMM coal | 42.29 | 2.75 | 54.95 | 1.04 | 80.43 |
| AceMM coal | 41.93 | 6.29 | 51.78 | 1.04 | 55.14 |
| NaMM coal | 37.96 | 13.07 | 48.98 | 1.01 | 6.64 |
| NaHClMM coal | 42.36 | 3.84 | 53.82 | 1.10 | 72.57 |
| NaAceMM coal | 40.34 | 10.14 | 49.51 | 1.10 | 27.50 |
According to the results in Table 4, it was observed that the various treatment processes affected the coal properties, especially the ash content. Compared with MM coal, the ash contents of HClMM and AceMM coals decreased by 80.43% and 55.14%, respectively. In the case of alkali treatment, the ash content of NaMM coal decreased by 6.64%. This indicated that the NaOH solution had a negligible effect on the ash removal of coal. When NaMM coal was treated with HCl and CH3COOH in the alkali followed by acid treatment, the ash contents of NaHClMM and NaAceMM coals decreased by 72.57 and 27.50%, respectively. The decreases in the ash content could indicate the reduction of the mineral matter content in the modified coals. From the results of coal treatments, the large decrease in the ash content of the MM coal resulted from the coal treatments with acid solutions. Moreover, this research found that the removal of ash from coal depended upon the type of acid solution. The coal treatment with HCl had a greater effect on ash removal than CH3COOH because HCl is a strong acid that was virtually 100% ionised in solution. Thus, the HCl solution diffused and dissolved mineral matters in coal more than CH3COOH, a weak acid. Besides, the difference in ash removal by the various acids could be explained by the ability of the acids to remove different inorganic components. According to the study by Barma et al.,26 HCl could dissolve impurities in coal by converting them into soluble metal salts. Steel et al.27 reported that HCl was able to remove Ca, Fe, Mg, Na and some of Al, K and Ti, which were minerals in coal. Manoj et al.28 discovered that acetic acid solution could remove all calcites and partial aluminium minerals in coal and transform them into calcium acetate and aluminium acetate complexes. Therefore, the changes in the ash content in MM coal are related to the mineral matter in coal, especially exchangeable metallic species that might affect the changes in the functional groups in coal. The results of the influences of coal treatments on the functional groups in coal were studied and are discussed in the following section.
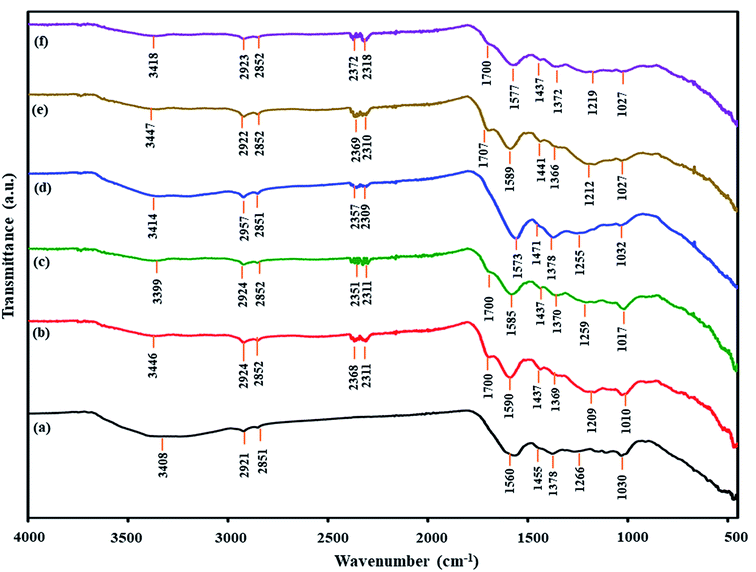 | ||
| Fig. 4 FTIR spectra of untreated and treated coals: (a) MM coal, (b) HClMM coal, (c) AceMM coal, (d) NaMM coal, (e) NaHClMM coal and (f) NaAceMM coal. | ||
| Assignments of band | Wavenumber, ϑ (cm−1) | Ref. | |||||
|---|---|---|---|---|---|---|---|
| MM | HClMM | AceMM | NaMM | NaHClMM | NaAceMM | ||
| a ND: not detected. | |||||||
| –OH stretching vibration of hydrogen bond association, phenols | 3408 | 3446 | 3399 | 3377 | 3414 | 3418 | 29 |
| Non-symmetric vibration of cycloalkane or methylene of aliphatic hydrocarbons | 2921 | 2924 | 2924 | 2923 | 2922 | 2923 | 29 |
| Symmetric vibration cycloalkane or methylene of aliphatic hydrocarbons | 2851 | 2852 | 2852 | 2851 | 2852 | 2852 | 29 |
| –OH stretching vibration of –COOH | ND | 2368 | 2357 | 2357 | 2364 | 2318 | 30 |
C![[double bond, length as m-dash]](https://www.rsc.org/images/entities/char_e001.gif) O stretching of carboxyl groups O stretching of carboxyl groups |
ND | 1707 | 1700 | ND | 1707 | 1700 | 29 |
C![[double bond, length as m-dash]](https://www.rsc.org/images/entities/char_e001.gif) O asymmetric stretching of carboxylate (ϑas(CO2−)) O asymmetric stretching of carboxylate (ϑas(CO2−)) |
1560 | 1590 | 1585 | 1573 | 1589 | 1577 | 31 |
| Stretching vibration of aromatic C–C | 1455 | 1437 | 1437 | 1471 | 1441 | 1437 | 31 |
C![[double bond, length as m-dash]](https://www.rsc.org/images/entities/char_e001.gif) O symmetric stretching of carboxylate (ϑs(CO2−)) O symmetric stretching of carboxylate (ϑs(CO2−)) |
1378 | 1369 | 1370 | 1378 | 1366 | 1372 | 31 |
| C–O stretching | 1031 | 1027 | 1017 | 1012 | 1027 | 1027 | 31 |
In Fig. 4a, the FTIR spectrum shows IR bands of the major functional group characteristics of the MM coal compositions. The IR band at 3408 cm−1 was assigned to phenolic hydroxyl associated hydrogen bonds. The double IR bands at 2921 and 2851 cm−1 were attributed to cycloalkane or methylene of aliphatic hydrocarbons.29 The IR bands at 1560 and 1455 cm−1 were assigned to the aromatic structure.31 The two bands of the metal-carboxylate groups were observed at 1560 and 1378 cm−1.31 The IR band at 1030 cm−1 was ascribed to the C–O stretching.29
For the acid treatment, the FTIR spectra of HClMM and AceMM coals are presented in Fig. 4b and c, respectively. The IR band of HClMM coal appeared in new bands at 2368, 2311 and 1700 cm−1. Likewise, the new bands of AceMM coal were observed at 2351, 2311 and 1700 cm−1. The IR bands at 2780–2350 cm−1 could be assigned to the –OH stretching vibration of –COOH.30 The IR band at 1700 cm−1 could be attributed to the C![[double bond, length as m-dash]](https://www.rsc.org/images/entities/char_e001.gif) O of carboxyl groups.31 The appearances of new bands on the IR spectra of both acid-treated coals indicated that carboxyl groups were formed in both the acid-treated coals. Moreover, the two bands of metal-carboxylate groups were observed at 1610–1550 cm−1 (ϑas(CO2−)) and 1420–1300 cm−1 (ϑs(CO2−)) in the FTIR spectra of HClMM and AceMM coals. From the literature reviews,32,33 the separation of the two bands of metal-carboxylate groups (Δϑ(COO−) = ϑas(CO2−) − ϑs(CO2−)) were indicative of the structure of a given carboxylate. According to Ban et al.,34 the addition of metal ions on coal caused the decrease in the Δϑ(COO−) value due to metal-carboxylate interactions. It was assumed that the metal ions were combined with carboxyl functional groups in coal by ionic configuration. Conversely, this research found that the Δϑ(COO−) values increased when the MM coal was treated with HCl or CH3COOH solutions. In Table 6, the Δϑ(COO−) values of HClMM and AceMM coals increased from 188 cm−1 to 221 cm−1 and 215 cm−1, respectively. Therefore, the increase in Δϑ(COO−) of HClMM and AceMM coals might indicate that the metal ions that interacted with carboxyl functional groups in the form of metal-carboxylate were removed from the coal. From the results, the appearances of new bands of carboxyl groups and the increase in the Δϑ(COO−) values of both acid-treated coals could explain that the acid solution ionised to give protons (H+). Then, the protons of the acid were exchanged with the metal ions of metal-carboxylate (COOM) in coal (eqn (2)). Due to the ion exchange of protons and metal ions, the carboxyl groups were formed in coal. After that, the released metal ions (M+) were exchanged with Cl− for HCl (eqn (3)) and CH3COO− for CH3COOH (eqn (4)) in the form of acid-soluble salts, which resulted in ash removal in coal.
O of carboxyl groups.31 The appearances of new bands on the IR spectra of both acid-treated coals indicated that carboxyl groups were formed in both the acid-treated coals. Moreover, the two bands of metal-carboxylate groups were observed at 1610–1550 cm−1 (ϑas(CO2−)) and 1420–1300 cm−1 (ϑs(CO2−)) in the FTIR spectra of HClMM and AceMM coals. From the literature reviews,32,33 the separation of the two bands of metal-carboxylate groups (Δϑ(COO−) = ϑas(CO2−) − ϑs(CO2−)) were indicative of the structure of a given carboxylate. According to Ban et al.,34 the addition of metal ions on coal caused the decrease in the Δϑ(COO−) value due to metal-carboxylate interactions. It was assumed that the metal ions were combined with carboxyl functional groups in coal by ionic configuration. Conversely, this research found that the Δϑ(COO−) values increased when the MM coal was treated with HCl or CH3COOH solutions. In Table 6, the Δϑ(COO−) values of HClMM and AceMM coals increased from 188 cm−1 to 221 cm−1 and 215 cm−1, respectively. Therefore, the increase in Δϑ(COO−) of HClMM and AceMM coals might indicate that the metal ions that interacted with carboxyl functional groups in the form of metal-carboxylate were removed from the coal. From the results, the appearances of new bands of carboxyl groups and the increase in the Δϑ(COO−) values of both acid-treated coals could explain that the acid solution ionised to give protons (H+). Then, the protons of the acid were exchanged with the metal ions of metal-carboxylate (COOM) in coal (eqn (2)). Due to the ion exchange of protons and metal ions, the carboxyl groups were formed in coal. After that, the released metal ions (M+) were exchanged with Cl− for HCl (eqn (3)) and CH3COO− for CH3COOH (eqn (4)) in the form of acid-soluble salts, which resulted in ash removal in coal.
| COOM + H+ → COOH + M+ | (2) |
| M+ + Cl− → MCl | (3) |
| M+ + CH3COO− → CH3COOM | (4) |
| Coal sample | Untreated and treated coals (before Ni loading) | Untreated and treated coals (after Ni loading) | ||||
|---|---|---|---|---|---|---|
| ϑas(CO2−) (cm−1) | ϑs(CO2−) (cm−1) | Δϑ(COO−) (cm−1) | ϑas(CO2−) (cm−1) | ϑs(CO2−) (cm−1) | Δϑ(COO−) (cm−1) | |
| MM | 1560 | 1372 | 188 | 1548 | 1375 | 173 |
| HClMM | 1590 | 1369 | 221 | 1558 | 1375 | 183 |
| AceMM | 1585 | 1370 | 215 | 1566 | 1375 | 191 |
| NaMM | 1573 | 1378 | 195 | 1547 | 1376 | 171 |
| NaHClMM | 1589 | 1366 | 221 | 1558 | 1375 | 183 |
| NaAceMM | 1577 | 1372 | 205 | 1559 | 1379 | 180 |
In the case of alkali treatment, Fig. 4d shows the FTIR spectrum of NaMM coal. Compared with original coal, the FTIR ranges of NaMM coal changed a little. The new bands of the –OH stretching vibrations of –COOH were observed at 2357 and 2309 cm−1. These occurrences of the new bands might be due to the alkali solution, which could donate hydroxide ions to coal.35 In Table 6, the (COO−) values of NaMM coal slightly increased from 188 cm−1 to 195 cm−1, which indicated that NaOH treatment could hardly remove the metal ions from metal-carboxylate in coal.
For alkali followed by acid treatment, the NaMM coal was treated with HCl and CH3COOH solutions. The FTIR spectrum of NaHClMM coal (Fig. 4e) showed new IR bands at 2369, 2310 and 1707 cm−1. The FTIR spectrum of NaAceMM coal (Fig. 4f) presented the new bands at 2372, 2318 and 1700 cm−1. The appearances of new IR bands of NaHClMM and NaAceMM coals indicated the occurrence of carboxyl groups in coals. In Table 6, the Δϑ(COO−) values of NaHClMM coal and NaAceMM coal increased higher than the NaMM coal. The Δϑ(COO−) values of NaMM and NaHClMM and NaAceMM coals were 195 cm−1, 221 cm−1 and 205 cm−1, respectively. It was indicated that after the NaMM coal was treated with acid solutions, the metal ions of metal-carboxylate groups were removed and were replaced with hydrogen ions from acid solutions. In conclusion, the changing functional groups of NaHClMM and NaAceMM coals were mainly caused by the acid treatments.
3.3 Ni loading on lignite coal
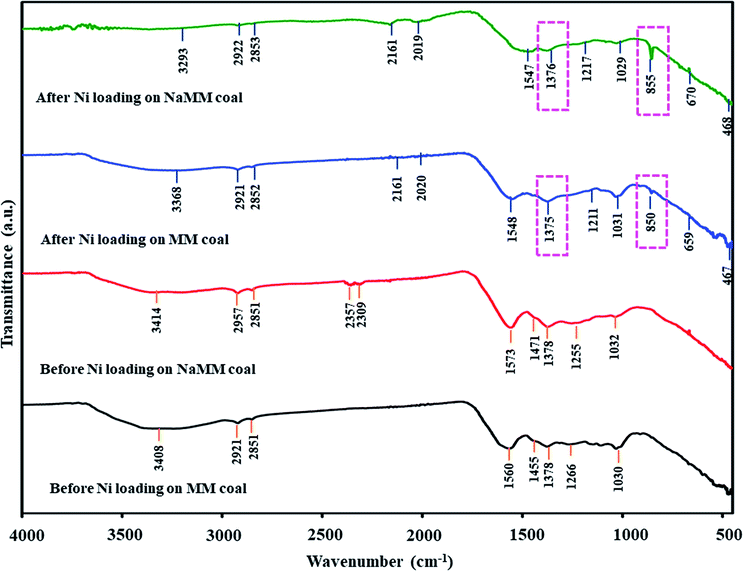
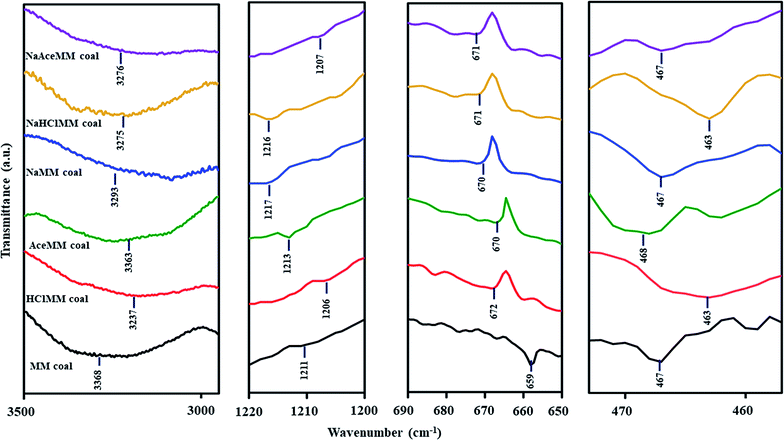
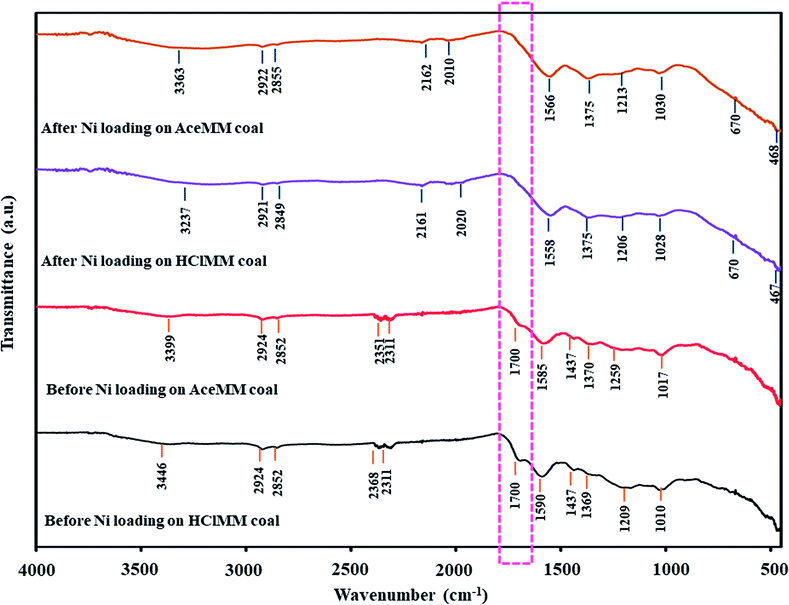
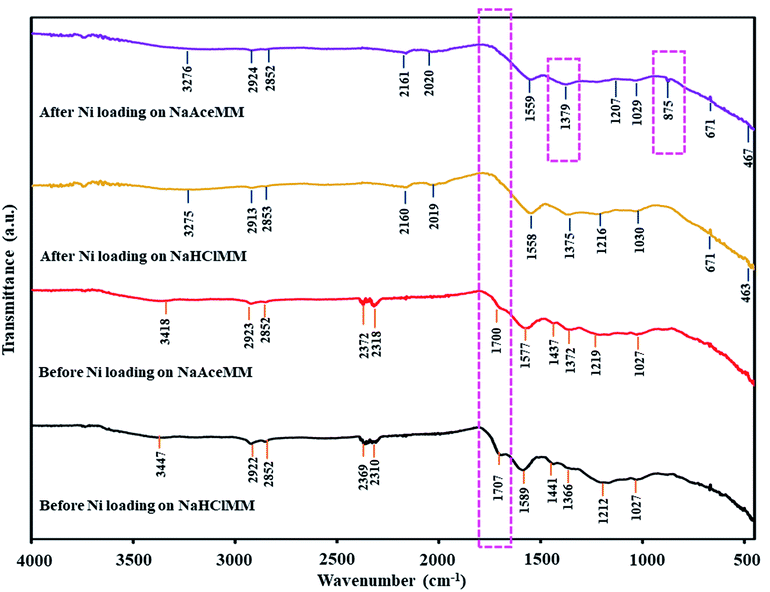
As described earlier, the coal treatments with acid or alkali solutions influenced the functional groups in coal, especially the oxygen-containing functional groups such as hydroxyl and carboxyl groups. These oxygen-containing groups in low-rank coal were cation-exchange sites for exchanging with metal ions on the coal surface. It was noted that treated coals had differences in ash content and functional groups. Thus, the coal treatments might affect the coal properties, including functional groups that might impact the Ni loading mechanisms into coals. To investigate the influence of coal treatments on the Ni loading mechanisms, FTIR spectra of untreated and treated coals before and after Ni loading were studied.Considering the form of Ni ion that was exchanged with the functional groups on MM coal, it was found that Ni ions might be exchanged with the functional groups on MM coal in the form of the Ni(NH3)62+ ion. This was because the FTIR spectrum of MM coal after Ni loading showed the IR bands of Ni(NH3)62+ that consisted of ν(NH3), δs(HNH), ρr(NH3) and ν(M − NH3) in the regions of 3386–3156, 1254–1186, 850–650 and 500–250 cm−1, respectively.38,39 In Fig. 6, the FTIR spectra of MM coal after Ni loading showed the IR bands of Ni(NH3)62+ at 3368, 1211, 659 and 467 cm−1. Moreover, the form of Ni ion after Ni loading on coal could be observed from the pH of the (NH3)6NiCO3 solution after the ion-exchange process. From the literature reviews,40,41 Sharma et al.40 studied the ion exchange of Ni on a meta-acrylic acid type ion exchange resin as the carbon base, and Cao et al.41 loaded Ni on resin char via the ion-exchange method. Both of these reports indicated that the pH of the aqueous ammonia solution used in the ion exchange affected the form of the Ni ion on the resin. The Ni ion was exchanged as the Ni(H2O)62+ ion at pH 8.8, and as the Ni(NH3)6+2 ion at pH 9.4.40 Likewise, the pH value of the (NH3)6NiCO3 solution after Ni loading on MM coal in this study was 9.5 as shown in Table 7. It confirmed that Ni ions in the form of Ni(NH3)62+ ions were exchanged with MM coal. Thus, the mechanism of Ni loading on MM coal can be shown as eqn (5)–(7).
| –OH + Ni(NH3)62+ ↔ O[Ni(NH3)6] + H+ | (5) |
| 2COOM+ + Ni(NH3)62+ ↔ COO[Ni(NH3)6]OOC + 2M+ | (6) |
| M+ + CO32− ↔ M2CO3 | (7) |
| Coal | MM | HClMM | AceMM | NaMM | NaHClMM | NaAceMM |
|---|---|---|---|---|---|---|
| pH of solution | 9.5 | 8.4 | 9.0 | 9.6 | 9.6 | 9.6 |
In comparison with the ion exchange of metal ions on the other lignite (e.g., Yallourn coal and Adaro coal),42,43 it was found that the ion exchange of metal ions on most lignite coals occurred through hydroxyl and carboxyl groups on the coal. This was because the structure of these lignite coals was composed of hydroxyl and carboxyl groups. This contrasted with MM coal, in which carboxyl groups disappeared in the structure of coal, but the FTIR bands of MM coal indicated hydroxyl and metal-carboxylate groups. The metal-carboxylate in the structure of MM coal might result from the abundance of exchangeable metallic species such as Ca, Na and Mg in MM coal, as presented in Table 3. Some researchers reported that the exchangeable metallic species in low-rank coal were usually found in the form of metal-carboxylate groups.8,25 Therefore, the ion exchange of Ni ion in MM coal occurred through hydroxyl and metal-carboxylate groups.
![[double bond, length as m-dash]](https://www.rsc.org/images/entities/char_e001.gif) O of carboxyl groups at 1700 cm−1 decreased in the FTIR patterns of HClMM and AceMM coals after Ni loading. Meanwhile, the new IR bands of transition metal carbonyl complexes at 2200–955 cm−1 were observed in the FTIR patterns of both acid-treated coals after Ni loading. In Table 6, the Δϑ(COO−) values of HClMM and AceMM coals after Ni loading also decreased in comparison with HClMM and AceMM coals before Ni loading. From the FTIR results of acid-treated coals in the case of after Ni loading, the decrease in the band intensity of carboxyl groups indicated that the carboxyl groups on coal were exchanged with Ni ions and turned into metal-carboxylates. The interaction of the metal-carboxylate on acid-treated coals could also be confirmed by the decrease in Δϑ(COO−) values. The reductions in the carboxyl band intensities on acid-treated coals after Ni ion exchange in this study also corresponded to the metal loading on the acid-treated coal in the other literature. Li et al.44 indicated that the ion exchange of Na+ on the acid-treated coal resulted in a decrease in the band intensity of carboxyl groups. Moreover, Ban et al.31 reported that the addition of Ca2+ and K+ on acid-treated coal led to the decrease in the band intensity of the C
O of carboxyl groups at 1700 cm−1 decreased in the FTIR patterns of HClMM and AceMM coals after Ni loading. Meanwhile, the new IR bands of transition metal carbonyl complexes at 2200–955 cm−1 were observed in the FTIR patterns of both acid-treated coals after Ni loading. In Table 6, the Δϑ(COO−) values of HClMM and AceMM coals after Ni loading also decreased in comparison with HClMM and AceMM coals before Ni loading. From the FTIR results of acid-treated coals in the case of after Ni loading, the decrease in the band intensity of carboxyl groups indicated that the carboxyl groups on coal were exchanged with Ni ions and turned into metal-carboxylates. The interaction of the metal-carboxylate on acid-treated coals could also be confirmed by the decrease in Δϑ(COO−) values. The reductions in the carboxyl band intensities on acid-treated coals after Ni ion exchange in this study also corresponded to the metal loading on the acid-treated coal in the other literature. Li et al.44 indicated that the ion exchange of Na+ on the acid-treated coal resulted in a decrease in the band intensity of carboxyl groups. Moreover, Ban et al.31 reported that the addition of Ca2+ and K+ on acid-treated coal led to the decrease in the band intensity of the C![[double bond, length as m-dash]](https://www.rsc.org/images/entities/char_e001.gif) O absorption peak at 1700 cm−1. This implied that the carboxyl groups were converted into metal-carboxylates.
O absorption peak at 1700 cm−1. This implied that the carboxyl groups were converted into metal-carboxylates.
On comparing the Ni loading mechanisms of the acid-treated coals and the untreated coal, it was observed that the Ni ions that were exchanged with the carboxyl groups in both acid-treated coals differed from those of the untreated coal. The ion exchange of Ni ions on untreated coal occurred through hydroxyl and metal-carboxylate groups. This was because the coal treatment with HCl and CH3COOH could decrease the ash content in MM coal from 14.00 wt% to 2.75 wt% and 6.25 wt%, respectively, as shown in Table 4. The decreased ash content in acid-treated coals correlated with the reduction of the exchangeable metallic species content in the metal-carboxylate form, which resulted in the conversion of metal-carboxylate groups into carboxyl groups. As a result, the ion exchange of Ni ions was controlled through the carboxyl groups on acid-treated coals. This could mean that the content of exchangeable metallic species in coal affected the ion exchange of the Ni ions in the coal. In the case of low exchangeable metallic species content in HClMM coal and AceMM coal, the ion exchange of Ni ions could occur through the carboxyl groups in the coal. In contrast, for the ion exchange of Ni ions in the MM coal, which had a high content of exchangeable metallic species, the Ni ions could exchange with the metal-carboxylate groups.
Focusing on the form of Ni ions on acid-treated coals after Ni loading, the –OH stretching vibration in the region of 3600–3200 cm−1 and the –OH bending vibration at around 1640 cm−1 (ref. 45 and 46) were observed in the FTIR spectrum of HClMM coal after Ni loading. The appearances of both bands on HClMM coal after Ni loading could be assigned to H2O, which arose from the ion exchange with Ni in the form of Ni(H2O)62+ ions on HClMM coal. According to the description of the FTIR spectrum of [Ni(H2O)6](NO3)2 by Liang et al.,47 the broad band of the –OH stretching vibration mode was at around 3400 cm−1 and the band of the –OH bending vibration mode was 1640 cm−1 on the FTIR spectrum of [Ni(H2O)6](NO3)2. The two bands could be attributed to H2O. The appearances of H2O bands in [Ni(H2O)6](NO3)2 referred to H2O, which were the composition of the Ni(H2O)62+ ion. Moreover, the ion exchange of Ni in the form of Ni(H2O)62+ ions on HClMM coal could also be confirmed by the pH values of (NH3)6NiCO3 solutions after Ni loading, which was 8.4 as seen in Table 7. Meanwhile, the IR bands of Ni(NH3)62+ were also observed at 3237, 1206, 672 and 463 cm−1 on the FTIR pattern of HClMM coal after Ni loading, as shown in Fig. 6. The appearances of Ni(NH3)62+ bands on HClMM coal indicated that Ni ions could be exchanged with HClMM coal in the form of Ni(NH3)62+ ions. Therefore, Ni ions were able to exchange with the functional groups on HClMM coal in the forms of Ni(H2O)62+ and Ni(NH3)62+ ions. The examples of the mechanisms of Ni loading on HClMM are presented as eqn (8) and (9), respectively.
| 2COOH + Ni(H2O)62+ ↔ COO[Ni(H2O)6]OOC + 2H+ | (8) |
| 2COOH + Ni(NH3)62+ ↔ COO[Ni(NH3)62+] OOC + 2H+ | (9) |
For AceMM coal, the FTIR spectrum after Ni loading showed the IR bands of Ni(NH3)62+ at 3363, 1213, 670 and 468 cm−1, as seen in Fig. 6. Besides, the pH of (NH3)6NiCO3 solutions after the Ni loading of AceMM coal was 9.0, as shown in Table 7. Hence, the functional groups such as carboxyl groups on AceMM coal were in conjunction with Ni ions in the form of Ni(NH3)62+ ions according to eqn (9).
When the mechanism of the Ni ion exchange on NaMM coal was compared with that of untreated coal, it was observed that the mechanism of the Ni ion exchange on the NaMM coal was similar to the mechanism of the Ni ion exchange on MM coal. This was because the NaOH treatment could slightly remove the ash content in MM coal, which was 6.64% as presented in Table 4. As discussed in Section 3.2.2, the FTIR spectrum of NaMM coal after Ni loading (Fig. 4d) did not have the strong new bands such as carboxyl groups when compared with acid-treated coals (Fig. 4b and c). Hence, the ion exchange of Ni ions on NaMM coal still occurred through the hydroxyl and metal-carboxylate groups that were the same as MM coal. The Δϑ(COO−) values of MM coal and NaMM coal after Ni loading were 173 cm−1 and 171 cm−1, respectively, which are shown in Table 6. There was a negligible difference in the Δϑ(COO−) values of coal.
![[double bond, length as m-dash]](https://www.rsc.org/images/entities/char_e001.gif) O of carboxyl groups at 1700 cm−1 disappeared on the FTIR patterns of both treated coals after Ni loading. The IR bands of transition metal carbonyl complexes at 2200–955 cm−1 were observed in the FTIR patterns of NaHClMM and NaAceMM coals after Ni loading. In Table 6, the Δϑ(COO−) values of NaHClMM and NaAceMM coals after Ni loading decreased when compared with before Ni loading. From the FTIR results of NaHClMM and NaAceMM coals, it meant that Ni ions were exchanged with hydroxyl and carboxyl groups in the metal-carboxylate groups. Hydroxyl groups on NaHClMM and NaAceMM coals might have resulted from alkali treatment, while carboxyl groups on both treated coals might be due to acid treatment. In the case of NaAceMM, the two bands of the carbonate phases at 1379 cm−1 and 875 cm−1 were observed in the FTIR spectrum of NaAceMM coal after Ni loading, indicating that Ni ions were exchanged with metal ions of metal-carboxylate groups on NaAceMM coal. Concentrating on the form of the Ni ions on NaHClMM and NaAceMM coals after Ni loading, the FTIR of Ni(NH3)62+ at 3275, 1216, 671 and 463 cm−1 were observed on NaHClMM coal after Ni loading as presented in Fig. 6. Similarly, the FTIR spectrum of NaAceMM coal after Ni loading showed the bands of Ni(NH3)62+ at 3376, 1207, 671 and 467 cm−1. The pH values of (NH3)6NiCO3 solutions after the Ni loading of both coal samples were 9.6 as shown in Table 7. Thus, the Ni ions were exchanged with functional groups on both types of treated coals in the form of Ni(NH3)62+ ions.
O of carboxyl groups at 1700 cm−1 disappeared on the FTIR patterns of both treated coals after Ni loading. The IR bands of transition metal carbonyl complexes at 2200–955 cm−1 were observed in the FTIR patterns of NaHClMM and NaAceMM coals after Ni loading. In Table 6, the Δϑ(COO−) values of NaHClMM and NaAceMM coals after Ni loading decreased when compared with before Ni loading. From the FTIR results of NaHClMM and NaAceMM coals, it meant that Ni ions were exchanged with hydroxyl and carboxyl groups in the metal-carboxylate groups. Hydroxyl groups on NaHClMM and NaAceMM coals might have resulted from alkali treatment, while carboxyl groups on both treated coals might be due to acid treatment. In the case of NaAceMM, the two bands of the carbonate phases at 1379 cm−1 and 875 cm−1 were observed in the FTIR spectrum of NaAceMM coal after Ni loading, indicating that Ni ions were exchanged with metal ions of metal-carboxylate groups on NaAceMM coal. Concentrating on the form of the Ni ions on NaHClMM and NaAceMM coals after Ni loading, the FTIR of Ni(NH3)62+ at 3275, 1216, 671 and 463 cm−1 were observed on NaHClMM coal after Ni loading as presented in Fig. 6. Similarly, the FTIR spectrum of NaAceMM coal after Ni loading showed the bands of Ni(NH3)62+ at 3376, 1207, 671 and 467 cm−1. The pH values of (NH3)6NiCO3 solutions after the Ni loading of both coal samples were 9.6 as shown in Table 7. Thus, the Ni ions were exchanged with functional groups on both types of treated coals in the form of Ni(NH3)62+ ions.
As mentioned above, the mechanism of Ni loading on NaHClMM and NaAceMM coals resulted in the exchange of Ni ions with hydroxyl groups and carboxyl groups on both coal samples and converted them into metal-carboxylate groups. In the case of NaAceMM coal, Ni ions were still exchanged with metal-carboxylate groups due to the high ash content of the NaAceMM coal. For the formation of Ni ions on coal after Ni loading, Ni ions were exchanged with the functional groups on both NaHClMM and NaAceMM coals in the form of Ni(NH3)62+ ion.
In comparing the mechanisms of the Ni ion exchange of NaHClMM and NaAceMM coals with those of HClMM and AceMM coals, it was found that Ni ions were exchanged with carboxyl groups on NaHClMM and NaAceMM coals, which were the same as with the acid-treated coals. This resulted from the acid treatment leading to the reduction of the ash content in the coal and the conversion of the metal-carboxylate group into the carboxyl group. As a result, the carboxyl groups on both treated coals acted as the Ni ion exchange sites on coals. Additionally, the results of the ion exchange of Ni ions on NaAceMM were found to show that Ni could exchange with metal-carboxylate groups on NaAceMM coal, similar to both MM coal and NaMM coal. Since the percentage of ash removal of NaAceMM coal was 27.50%, it indicated that mineral matter in the form of the metal-carboxylate groups might remain in NaAceMM coal. These metal-carboxylate groups still served as the positions for the ion exchange of Ni on NaAceMM coal.
3.4 Production of Ni-loaded lignite char catalyst
After the Ni loading on coal, Ni-loaded lignite coal samples were pyrolyzed at 650 °C under a N2 atmosphere to produce Ni-loaded lignite char catalysts. FTIR analysis results of catalysts are shown in Fig. 9. The IR bands of Ni-loaded lignite char catalysts mainly appeared in the range of 2200–1955 cm−1, 1500–1400 cm−1 and 1300–1000 cm−1. The IR bands at 2200–1955 cm−1 were assigned to transition metal carbonyl complexes. The IR bands at 1500–1400 cm−1 correspond to aromatic C–C stretching (in-ring).48 The IR bands at 1300–1000 cm−1 were assigned to C–O stretching vibrations. Moreover, the bands of carbonate phases at 1350–1550 cm−1 and 880–860 cm−1 were also observed in the FTIR spectra of Ni/MMchar (Fig. 9a), Ni/NaMMchar (Fig. 9d) and Ni/NaAceMMchar (Fig. 9f) catalysts, but not Ni/HClMMchar (Fig. 9b), NiAceMMchar (Fig. 9c) and Ni/NaHClMMchar (Fig. 9e) catalysts. The formation of carbonate phases in the catalysts was also correlated with the XRD analysis results of catalysts. Fig. 10 presents XRD patterns of the Ni-loaded lignite char catalysts at 10–40° for 2θ to show the XRD pattern of the carbonate phases. According to the JCPDS database, the peaks corresponding to CaCO3 (JCPDS no. 5-0586) and Na2CO3 (JCPDS no. 77-2082) were observed in the XRD patterns of Ni/MMchar (Fig. 10a), Ni/NaMMchar (Fig. 10d) and Ni/NaAceMMchar (Fig. 10f) catalysts. However, the patterns of carbonate compounds were not found in Ni/HClMMchar (Fig. 10b), Ni/AceMMchar (Fig. 10c) and Ni/NaHClMMchar (Fig. 10e) catalysts. The FTIR and XRD results of Ni/MMchar, Ni/NaMMchar and NiNaAceMMchar supported the explanation given in Section 3.3 that Ni ions were able to exchange with the metal ions of metal-carboxylate groups in MM, NaMM and NaAceMM coals. After the ion exchange, the released metal ions were exchanged with carbonate ions from (NH3)6NiCO3 and converted into carbonate compounds that remained in the catalyst powder. Regarding the XRD patterns of Ni-loaded lignite char catalysts at 2θ of 10–80° as shown in Fig. 11, Ni was present in the form of metal in the catalysts. This was confirmed by the three characteristic peaks of Ni at 44.5°, 56.7° and 76.3° for 2θ, corresponding to the dominant planes of metallic nickel (111), (200) and (220), respectively, with the JCPDS no. 04-850. The XRD patterns of Ni metal in Ni-loaded lignite char catalysts in this study also correspond to the report by Chaiklangmuang et al.18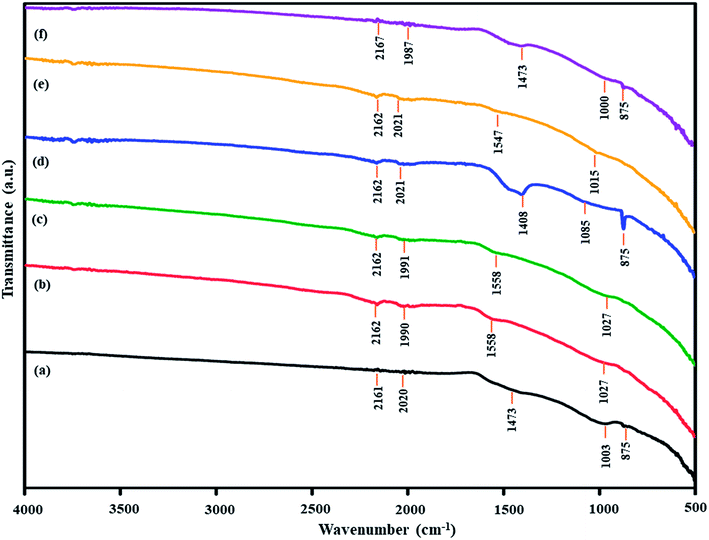 | ||
| Fig. 9 FTIR spectra of Ni-loaded lignite char catalysts: (a) Ni/MMchar, (b) Ni/HClMMchar, (c) Ni/AceMMchar, (d) Ni/NaMMchar, (e) Ni/NaHClMMchar and (f) Ni/NaAceMMchar. | ||
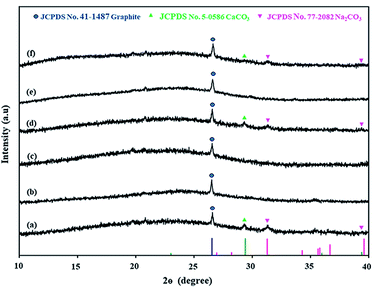 | ||
| Fig. 10 XRD patterns of Ni-loaded lignite char catalysts at 2θ of 10–40°: (a) Ni/MMchar, (b) Ni/HClMMchar, (c) Ni/AceMMchar, (d) Ni/NaMMchar, (e) Ni/NaHClMMchar and (f) Ni/NaAceMMchar. | ||
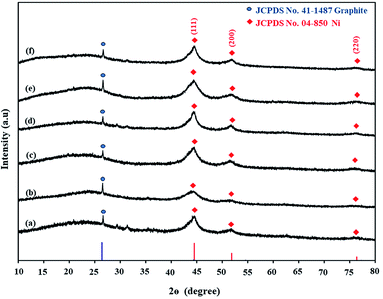 | ||
| Fig. 11 XRD patterns of Ni-loaded lignite char catalysts at 2θ of 10–80°: (a) Ni/MMchar, (b) Ni/HClMMchar, (c) Ni/AceMMchar, (d) Ni/NaMMchar, (e) Ni/NaHClMMchar and (f) Ni/NaAceMMchar. | ||
The occurrences of Ni metals on all catalysts could be explained by the fact that the Ni ions (Ni2+) that were exchanged with the oxygen-containing functional groups (e.g., hydroxyl, carboxyl and metal-carboxylate groups) in the untreated coal and each treated coal were reduced by H2 and CO and turned into Ni metal (Ni0).49,50 The H2 and CO were generated by the decomposition of the aliphatic hydrocarbons, hydroxyl and carboxylate groups of Ni-loaded coal samples during pyrolysis at 650 °C.51,52 The decomposition of the aliphatic hydrocarbons, hydroxyl and carboxylate groups of Ni-loaded lignite coal samples were confirmed by the FTIR spectra of catalysts. In Fig. 9, the IR bands of aliphatic hydrocarbons and oxygen-containing functional groups such as hydroxyl and carboxylate groups are not shown in the FTIR spectra of the catalysts.
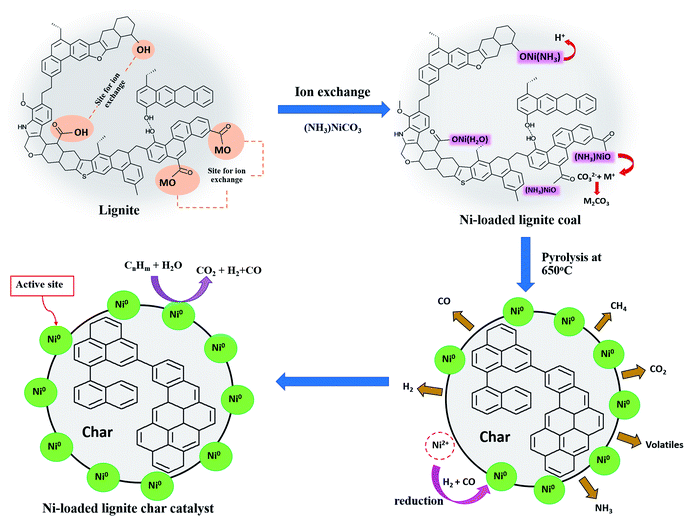
Possible predictions of the chemical pathways for the preparation of Ni-loaded lignite char catalysts using MM coal supports are shown in Fig. 12. In the Ni ion exchange stage, most of the Ni ions were able to exchange with hydroxyl and metal-carboxyl groups in the form of Ni(NH3)62+ ions on the untreated coals and those modified by acid, alkali and alkali followed by acid treatments. After the pyrolysis process, coals were transformed into char catalysts. Meanwhile, NH3 was released from Ni(NH3)62+ and then Ni metal (Ni0) was formed via the reduction of Ni ions (Ni2+) by H2 and CO, which were produced during pyrolysis. Ni metal formed the active sites on catalysts that could promote catalytic reactions and control the product selectivity. The structure–activity relationship of the Ni loading mechanism of the catalyst is presented in Fig. 13.
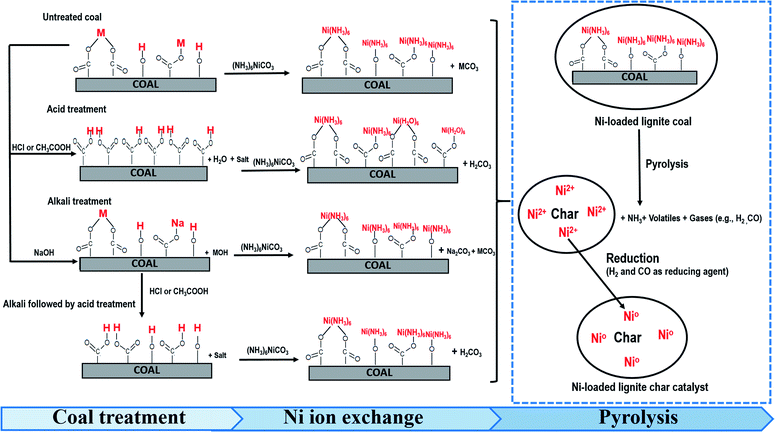 | ||
| Fig. 12 Predicted chemical pathways for the preparation of Ni-loaded lignite char catalysts in this paper. | ||
The Ni element contained in the catalysts (Table 8) was in the range of 16.51–20.09 wt%, which depended on the preparation methods of Ni-loaded lignite char catalyst. Compared with the Ni/MMchar catalyst, the Ni/NaMMchar catalyst showed the highest Ni content of 20.09 ± 0.59 wt% because NaOH was a strong oxidant. The NaOH solution could have affected the increase in the number of oxygen-containing functional groups in MM coal such as –OH groups, which were sites for ion exchange. According to Herviyanti et al.,35 NaOH treatment could increase the concentration of –OH groups in sub-bituminous coal since NaOH is an alkaline compound that could donate OH− ions to sub-bituminous coal, which increased the cation exchange capacity of the coal. In the coal treatment with acetic acid, the Ni contents in Ni/AceMMchar and Ni/NaAceMMchar were 17.01 ± 0.19 wt% and 17.32 ± 0.23 wt%, respectively. When considered with Ni/MM char, the Ni contents of Ni/AceMMchar and Ni/NaAceMMchar increased since the acetic acid containing the carboxylic functional groups was able to be absorbed into the coal, which caused an increase in the content of carboxylic functional groups on the surface of the coal. Radenovic and Malina14 reported that carbon black modification by the absorption of acetic acid onto carbon black could increase the nickel adsorption capacity from the solution due to the increase in the carboxylic functional group content on carbon black. The higher content of carboxylic functional groups could improve the adsorption of metal ions since the affinity between metals and carboxylic functional groups was extremely high.53,54 The cases of Ni/HClMMchar and Ni/NaHClMMchar showed 16.62 ± 0.97 wt% and 16.51 ± 0.46 wt% of Ni contents, respectively, which were negligible differences in comparison with Ni/MMchar. It may be inferred that the HCl solution did not affect the number of functional groups involved in the ion exchange with Ni. The results of Ni content in catalysts reflected that the type of chemical agents for the coal treatment affected the content of Ni loading in the catalyst, particularly the NaOH and CH3COOH solutions that influenced the enhancement of the Ni contents in the catalysts.
| Catalyst | Ni content (wt%) ±SD |
|---|---|
| Ni/MMchar | 16.55 ± 0.63 |
| Ni/HClMMchar | 16.62 ± 0.97 |
| Ni/AceMMchar | 17.01 ± 0.19 |
| Ni/NaMMchar | 20.09 ± 0.59 |
| Ni/NaHClMMchar | 16.51 ± 0.46 |
| Ni/NaAceMMchar | 17.32 ± 0.23 |
3.5 Oxygen functional groups on the catalyst surfaces
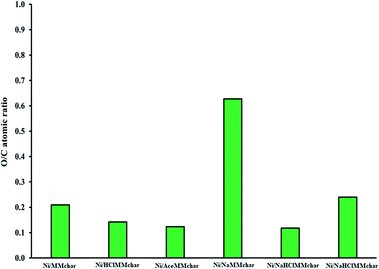
It is well known that the O/C atomic ratio can reflect the number of oxygen functional groups on catalyst surfaces.55–57 As described in Section 3.4, the oxygen functional groups are related to the Ni loading content of the catalysts. To investigate the oxygen functional groups on the catalyst surfaces, the O/C atomic ratios of catalysts were determined by SEM-EDS analysis as presented in Fig. 14.In acid treatment, the O/C atomic ratios of Ni/HClMMchar and Ni/AceMMchar catalysts were 0.14 and 0.12, respectively. Both modified catalysts had lower O/C atomic ratios than the Ni/MMchar catalyst. As a result, it may be inferred that the number of oxygen functional groups on the modified catalysts decreased when considered with the Ni/MMchar catalyst. The reduction of O/C atomic ratios of the catalysts might be due to the elimination of carboxylate groups in the pyrolysis stage.
For the alkali treatment, the Ni/NaMMchar catalyst had the highest O/C atomic ratio at 0.63, corresponding to the highest Ni content as well. The enhancements of the O/C atomic ratio and Ni content catalyst were caused by the number of oxygen-containing functional groups on MM coal promoted by the NaOH solution.
In the treatment with alkali followed by acid, the O/C atomic ratios of Ni/NaHClMMchar and Ni/NaAceMMchar were 0.12 and 0.24, respectively. The increase in the O/C atomic ratio of Ni/NaAceMMchar occurred with the formation of carbonate compounds (CO32−) in the catalyst as confirmed by FTTR results (Fig. 9). The appearance of carbonate compounds was also illustrated by the DTG results in Section 3.6 as presented in the next section.
(Fig. 15) shows the morphological studies and distributions of oxygen and nickel atoms on the surfaces of Ni/NaMMchar (Fig. 15a), Ni/AceMMchar (Fig. 15b) and Ni/NaAceMMchar (Fig. 15c) catalysts. Based on EDS-mapping images, the oxygen and nickel atoms had good dispersions on the catalyst surfaces. Focusing on the surface morphology of the catalysts, the surface of Ni/NaMMchar was smoother than those of Ni/AceMMchar and Ni/NaAceMMchar. This was because the NaOH treatment caused the coalescence of coal and the formation of sodium-aluminosilicate gel film that covered the catalyst surface10 and as a result, the surface of Ni/NaMMchar was quite unruffled.
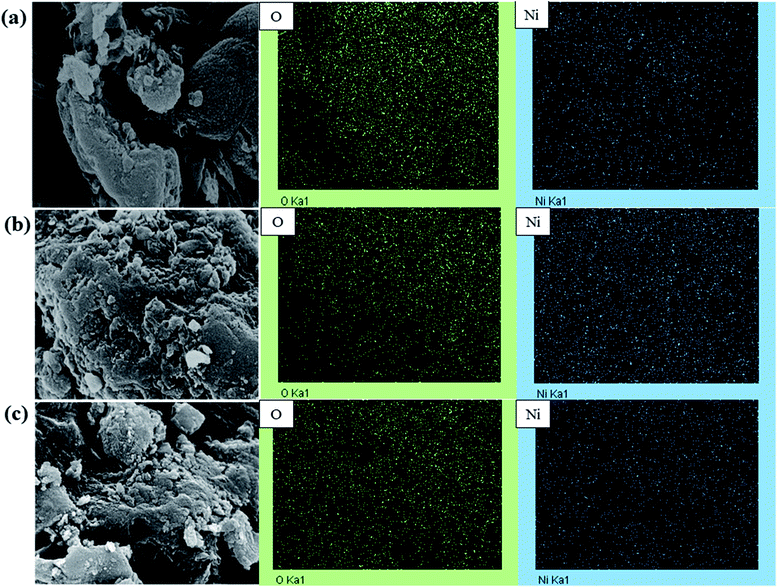 | ||
| Fig. 15 SEM images and distributions of oxygen and nickel atoms on the catalyst surfaces: (a) Ni/NaMMchar, (b) Ni/AceMMchar and (c) Ni/NaAceMMchar. | ||
3.6 Thermal behaviour and stability of Ni-loaded lignite char catalysts
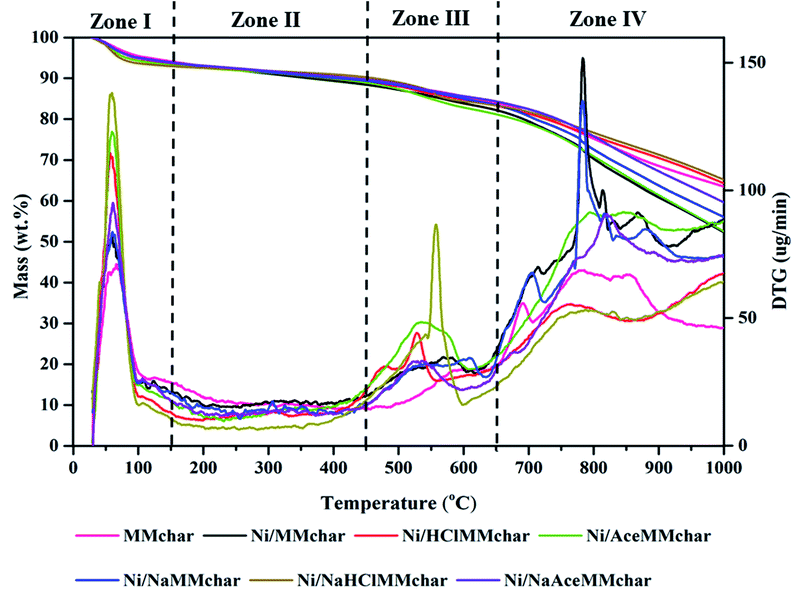
In view of the thermal behaviours of Ni-loaded lignite char catalysts under a nitrogen gas atmosphere, the DTG curves of the catalysts are presented in Fig. 16 and the maximum peak temperatures from DTG curves are listed in Table 9. The pyrolyzed temperature can be divided into four zones.| Catalyst | Maximum peak temperature (°C) | ||
|---|---|---|---|
| First peak | Second peak | Third peak | |
| Ni/MMchar | 56 | — | 783 |
| Ni/HClMMchar | 48 | 530 | — |
| Ni/AceMMchar | 62 | 544 | — |
| Ni/NaMMchar | 58 | — | 763 |
| Ni/NaHClMMchar | 56 | 557 | — |
| Ni/NaAceMMchar | 50 | — | 820 |
The DTG peaks of the catalysts were observed at around 27–150 °C in the first zone. The maximum peak temperatures occurred at about 48–62 °C, which resulted from the loss of moisture in the catalysts.5 In the second zone at 150–450 °C, low weight-loss rates were observed in the range of 9–25 μg min−1 and all the fresh catalysts decomposed slowly.
The third zone clearly showed the DTG-decompositions of Ni/HClMMchar, Ni/AceMMchar and Ni/NaHClMMchar catalysts at temperatures ranging from 496 °C to 557 °C, 400 °C to 603 °C, and 400 °C to 600 °C, respectively. Li et al.58 investigated that the obvious weight loss at around 200–400 °C was due to the disaggregation, release of the volatiles, and decomposition of lignite. Cheng et al.59 studied several coals treated with acids and reported that in the temperature range of 400–600 °C, the bonds between aliphatic carbons and between aliphatic carbon and aromatic carbon were cracked. Similarly, the decompositions of the Ni/lignite char catalysts were examined by DTG in this zone. The maximum peak temperatures of Ni/HClMMchar, Ni/AceMMchar and Ni/NaHClMMchar catalysts were 530 °C, 544 °C and 557 °C, respectively. According to Shi et al.,60 the single peak at around 450 °C confirmed the assignment of aliphatic carbon bonds, where the cleavage of aromatic carbon and nitrogen bond peaked at 425 °C, and the breakage of aromatic carbon and aliphatic carbon bonds and aromatic carbon and oxygen bonds peaked at around 550 °C.
In the fourth zone, the apparent DTG peaks of Ni/MMchar, Ni/NaMMchar and Ni/NaAceMMchar catalysts were observed in the temperature range of 722–839 °C, 723–830 °C and 685–882 °C, respectively. According to Li et al.,58 the temperature range of 720–920 °C corresponds to the loss of minerals in lignite that were mainly carbonate compounds in coals. Li et al.61 investigated the thermal analysis of the calcium carbonate decomposition, and they reported the initial temperature of CaCO3 at 600 °C and the final temperature at 829 °C, and its maximum peak temperature was 793 °C. Therefore, the apparent peaks in zone IV of this research implied the decomposition of carbonate compounds. From the FTIR spectra in Fig. 9, we also found the forms of carbonate compounds. According to the XRD patterns in Fig. 10, these carbonate compounds should be CaCO3 and Na2CO3 since their melting points are 825 °C and 580 °C, respectively. In this study, the Ca and Na elements were present high percentages as mentioned in Table 3.
Mostly, the Ni/lignite char catalysts have been applied in the thermo-chemical processes such as pyrolysis,62–64 gasification2,3,5,6,17,65 and reforming.66 The predictions of thermal stabilities of the catalysts were important to inspect the selection of catalyst applications.
As seen in Fig. 16, the TGA results indicated the loss of moisture in the range of 4.95–6.38 wt%. Generally, the released moisture from the catalyst affected the amount of steam in order to interfere with the catalytic reaction. According to the literature reviews,2–5 steam was one of the factors that was influential in the tar decomposition for producing hydrogen-rich gas. The slower mass loss was the pheromone in the second zone and the mass loss percentages were in the range of 2.69–5.35 wt%. For the third zone, the mass loss percentages of all fresh catalysts were in the range of 5.37–6.25 wt%. The low mass loss in zones I and III indicated that the temperature in the range of 150–650 °C hardly affected the thermal stabilities of catalysts. At higher temperatures, the mass loss percentages of catalysts in the fourth zone drastically increased, which were in the range of 18.18–29.92 wt%. The mass loss percentages of catalysts in descending order were Ni/AceMMchar > Ni/MMchar > Ni/NaMMchar > Ni/NaAceMMchar > Ni/HClMMchar > Ni/NaHClMMchar.
The comparisons of Ni-loaded lignite char catalysts with other Ni-loaded heterogeneous catalysts are presented in Table 10. The advantages of Ni/lignite char catalysts are more predominant than other Ni-loaded heterogeneous catalysts and may be summarized thus: (i) their catalyst surfaces are high and stable, indicating the increasing catalytic activity; (ii) the catalysts have higher efficiency in gas production; (iii) carbon depositions on catalysts are lower, resulting in the reduction of catalyst deactivation.
| Application | Fuel | Catalyst | Condition | Result | Ref. |
|---|---|---|---|---|---|
| Biomass gasification | Japanese cypress | 14.7 wt% Ni/YL and 20 wt% Ni/Al2O3 | Two-stage fixed bed reactor operated at 650 °C under N2 atmosphere | -Compared with non-catalyst, the total gas yields increased by 2.5 times with Ni/Al2O3 and 3.3 times with Ni/LY | 2 |
| -The Ni/LY could produce more gas than Ni/Al2O3 | |||||
| Catalytic gasification | Waste biomass (wood chip of red pine and pig manure compost) | Ni/BBC and Ni/Al2O3 | Two-stage fixed bed reactor operated at 650 °C under N2 atmosphere | Compared with non-catalyst, the gas yields of H2 and CO increased dramatically in the presence of Ni catalysts, with the total gas yield of 2.9 times in Ni/Al2O3 and 3.1 times in Ni/BCC | 3 |
| Biomass gasification | Red pine and Japanese cedar | 9 wt% Ni/YL and 20 wt% Ni/Al2O3 | Fluidized bed gasifier operated at 650 °C under N2 atmosphere | -Ni/YL could produce more H2 and CO than Ni/Al2O3 | 65 |
| -The surface areas of Ni/YL before and after use were higher than Ni/Al2O3 | |||||
| -The surface areas of Ni/YL and Ni/Al2O3 before use were 350 and 104 m2 s−1, respectively | |||||
| -The surface areas of Ni/YL and Ni/Al2O3 after use were 339 and 32 m2 s−1, respectively | |||||
| Catalytic reforming | Toluene | 19 wt% Ni/LY and 20 wt% Ni/Al2O3 | Reforming of toluene at 650 °C under N2 atmosphere | -Ni/LY was a potential anti-coke catalyst | 66 |
| -Ni/Al2O3 was not a stable catalyst and high carbon disposition |
4. Conclusions
This study focused on the influence of acid, alkali and alkali followed by acid treatments on lignite coal properties and their implications during the synthesis of Ni/lignite char catalyst via ion exchange. The Ni loading mechanisms were studied through FTIR, XRD, AAS and SEM-EDS including TGA-DTG for thermal behaviours. Ni loaded on original coal and treated coals were pyrolyzed at 650 °C to produce the six samples of Ni-loaded lignite char catalysts, which were Ni/MMchar, Ni/HClMMchar, Ni/AceMMchar, Ni/NaMMchar, Ni/NaHClMMchar and Ni/NaAceMMchar catalysts. The results found that the differences in coal treatments remarkably influenced ash contents and the functional groups in coals. The decreases in ash contents of HClMM, AceMM, NaHClMM and NaAceMM coals indicated that the exchangeable metallic species were removed by transforming metal-carboxylates into carboxyl groups. The transformations of metal-carboxylates were confirmed by the increased Δϑ(COO−) value. In terms of the Ni loading mechanism into coal, the carboxyl groups on acid-treated coals connected with Ni ions in the form of metal-carboxylate. For alkali treatment, hydroxyl and metal-carboxylate groups were sites for the Ni ion exchange, likewise original coal. For the treatment involving alkali followed by acid, the ion exchange of Ni ions on NaHClMM and NaAceMM coals occurred through hydroxyl and carboxyl groups; besides, the Ni ion exchange with metal-carboxylates was observed on NaAceMM coal. Considering the Ni ion forms, the Ni(NH3)62+ ion form was detected on MM, AceMM, NaMM, NaHClMM and NaAceMM coals, while the Ni(NH3)62+ and Ni(H2O)62+ ions were found on HClMM coal. In the production of Ni-loaded lignite char catalysts, the different Ni contents in catalysts emerged from the chemical agent types used in coal treatment. NaOH and CH3COOH solutions could modify the functional groups in coal in order to promote hydroxyl and carboxylic groups, resulting in a higher Ni loading capacity in catalysts. Therefore, the changes in the functional groups in the treated coals were the key factors in controlling the Ni loading on coals. Finally, the author expects that this study will shed light on the development of the metal-loaded char catalyst that can be applied in the conversion processes such as fuel upgrading and alternative energy from biomass transformation.Conflicts of interest
There are no conflicts to declare.Acknowledgements
This research project is supported by TSRI. In addition, this research work is partially supported by Chiang Mai University. The authors would like to acknowledge Electricity Generating Authority of Thailand and Department of Industrial Chemistry, Faculty of Science, Chiang Mai University.Notes and references
- J. I. Hayashi and C. Z. Li, Advances in the science of Victorian brown coal, 2004, pp. 11–84, DOI:10.1016/B978-008044269-3/50003-0
.
- L. Li, K. Morishita, H. Mogi, K. Yamasaki and T. Takarada, Fuel Process. Technol., 2010, 91, 889–894 CrossRef CAS
.
- X. Xiao, J. Cao, X. Meng, D. Le, L. Li, Y. Ogawa and T. Takarada, Fuel, 2013, 103, 135–140 CrossRef CAS
.
- S. Kim, D. Chun, Y. Rhim, J. Lim, S. Kim, H. Choi and J. Yoo, Int. J. Hydrogen Energy, 2015, 40, 11855–11862 CrossRef CAS
.
- B. S. Wang, J. P. Cao, X. Y Zhao, Y. Bian, C. Song, Y. P. Zhao and T. Takarada, Fuel Process. Technol., 2015, 136, 17–24 CrossRef CAS
.
- C. Phuhiran, T. Takarada and S. Chaiklangmuang, Int. J. Hydrogen Energy, 2014, 39, 3649–3656 CrossRef CAS
.
- S. Aich, D. Behera, B. K. Nandi and S. Bhattacharya, Int. J. Coal Sci. Technol., 2020, 7, 766–777 CrossRef CAS
.
- W. Li, Z. Q. Bai, J. Bai and X. Li, Fuel, 2017, 197, 209–216 CrossRef CAS
.
- S. K. Behera, U. Kumari and B. C. Meikap, J. Min. Metall., Sect. A, 2018, 54, 1–24 CrossRef CAS
.
- S. K. Behera, S. Chakraborty and B. C. Meikap, Fuel, 2017, 196, 102–109 CrossRef CAS
.
- H. Dhawan and D. K. Sharma, Int. J. Coal Sci. Technol., 2019, 6, 169–183 CrossRef CAS
.
- J. Starck, P. Burg, D. Cagniant, J. M. Tascón and A. Martinez-Alonso, Fuel, 2004, 83, 845–850 CrossRef CAS
.
- J. Ren, J. P. Cao, X. Y. Zhao, F. Wei, T. L. Liu, X. Fan and X. Y. Wei, Fuel, 2017, 202, 345–351 CrossRef CAS
.
- A. Radenovic and J. Malina, Hem. Ind., 2013, 67, 51–58 CrossRef CAS
.
- S. S. Shah, I. Ahmad, W. Ahmad, M. Ishaq and H. Khan, Energy Fuels, 2017, 31, 7867–7873 CrossRef CAS
.
- S. Mukherjee, Energy Fuels, 2003, 17, 559–564 CrossRef CAS
.
- L. Feng, X. Liu, L. Song, X. Wang, Y. Zhang, T. Cui and H. Tang, Powder Technol., 2013, 247, 19–23 CrossRef CAS
.
- S. Chaiklangmuang, L. Li, N. Kannari and T. Takarada, J. Energy Inst., 2018, 91, 222–232 CrossRef CAS
.
- N. Duongbia, N. Kannari, K. Sato, T. Takarada and S. Chaiklangmuang, Alexandria Eng. J., 2021, In press Search PubMed
.
- T. Ronnachai, C. Chatchwan, and C. Suparin, The 21st international union of materials research societies-international conference in asia, 2020, p. 392 Search PubMed
.
- F. Rehman, S. W. Ahmad, M. S. Zafar, S. Ahmad and M. Zia-Ul-Haq, Pol. J. Chem. Technol., 2018, 20, 103–109 CrossRef CAS
.
- M. Kumar and R. H. Shankar, Energy Sources, 2000, 22, 187–196 CrossRef CAS
.
- K. Kaneko, L. Li, A. Matsushima, H. Sato, T. Shimizu, H. Kim and T. Takarada, J. Chem. Eng. Jpn., 2016, 49, 294–299 CrossRef CAS
.
- C. R. Ward, Int. J. Coal Geol., 2002, 50, 135–168 CrossRef CAS
.
- C. R. Ward, Int. J. Coal Geol., 1991, 17, 69–93 CrossRef CAS
.
- S. D. Barma, R. Sathish and P. K. Baskey, J. Cleaner Prod., 2018, 195, 1203–1213 CrossRef CAS
.
- K. M. Steel, J. Besida, T. A. O'Donnell and D. G. Wood, Fuel Process. Technol., 2001, 70, 171–192 CrossRef CAS
.
- B. Manoj and P. Narayanan, J. Miner. Mater. Charact. Eng., 2013, 1, 39–43 CAS
.
- W. Cheng, J. Xue, J. Xie, G. Zhou and W. Nie, Energy Fuels, 2017, 31, 13834–13841 CrossRef CAS
.
- L. Ma, R. Guo, Y. Gao, L. Ren, G. Wei and C. Li, Combust. Sci. Technol., 2019, 191, 1456–1472 CrossRef CAS
.
- B. D. Nandiyanto, R. Oktiani and R. Ragadhita, Indonesian Journal of Science and Technology, 2019, 4, 97–118 CrossRef
.
- E. G. Palacios, G. Juárez-López and A. J. Monhemius, Hydrometallurgy, 2004, 72, 139–148 CrossRef CAS
.
- S. K. Papageorgiou, E. P. Kouvelos, E. P. Favvas, A. A. Sapalidis, G. E. Romanos and F. K. Katsaros, Carbohydr. Res., 2010, 345, 469–473 CrossRef CAS PubMed
.
- Y. Ban, Y. Wang, N. Li, R. He, K. Zhi and Q. Liu, R. Soc. Open Sci., 2018, 5, 180717–180727 CrossRef CAS PubMed
.
- H. Herviyanti, T. B. Prasetyo, J. Juniarti, S. Prima and S. Wahyuni, International Journal on Advanced Science, Engineering and Information Technology, 2018, 8, 2052–2058 CrossRef
.
- A. Sarkar, D. Seth, M. Jiang, F. T. Ng and G. L. Rempel, Top. Catal., 2014, 57, 730–740 CrossRef CAS
.
- Z. Kledyński, A. Machowska, B. Pacewska and I. Wilińska, J. Therm. Anal. Calorim., 2017, 130, 351–363 CrossRef
.
- D. P. Domonov, S. I. Pechenyuk, A. T. Belyaevskii and K. V. Yusenko, Nanomaterials, 2020, 10, 389–399 CrossRef CAS PubMed
.
- R. A. Nyquist and R. O. Kagel, Handbook of infrared and Raman spectra of inorganic compounds and organic salts, Academic press, 2012, DOI:10.1002/9780470027325.s4104
.
- A. Sharma, H. Nakagawa and K. Miura, Fuel, 2006, 85, 2396–2401 CrossRef CAS
.
- J. P. Cao, T. L. Liu, J. Ren, X. Y. Zhao, Y. Wu, J. X. Wang and X. Y. Wei, J. Anal. Appl. Pyrolysis, 2017, 127, 82–90 CrossRef CAS
.
- Y. Shinohara and N. Tsubouchi, ACS Omega, 2020, 5, 1688–1697 CrossRef CAS PubMed
.
- N. Tsubouchi, Y. Mochizuki, Y. Shinohara, Y. Hanaoka, T. Kikuchi and Y. Ohtsuka, Energy Fuels, 2018, 32, 226–232 CrossRef CAS
.
- X. Li, L. Fan, G.G. Wu, Z.Q. Bai and W Li, Anal. Lett, 2018, 51, 2532–2543 CrossRef
.
- J. M. Whittinghill, J. Norton and A. Proctor, J. Am. Oil Chem. Soc., 1999, 76, 1393–1398 CrossRef CAS
.
- P. K. Singh, P. K. Rajak, M. P. Singh, V. K. Singh and A. S. Naik, Int. J. Coal Sci. Technol., 2016, 3, 104–122 CrossRef CAS
.
- J. Liang, Y. Z. Wang, C. C. Wang and S. Y. Lu, J. Matter. Chem. A., 2016, 4, 9797–9806 RSC
.
- T. Hatori, K. Morishita, N. Kannari and T. Takarada, J. Jpn. Inst. Energy, 2017, 96, 519–524 CrossRef CAS
.
- T. Hatori, K. Morishita, N. Kannari and T. Takarada, J. Jpn. Inst. Energy, 2017, 96, 139–143 CrossRef
.
- Z. Na, Z. Xu, L. Ziliang, L. Qiuxiang, L. Wei, C. Qiue and Y. Shenfu, Asia-Pac. J. Chem. Eng., 2020, 15, 2384–2395 Search PubMed
.
- T. Xu, S. C. Srivatsa and S. Bhattacharya, J. Anal. Appl. Pyrolysis, 2016, 122, 122–130 CrossRef CAS
.
- L. Zhang, S. Qi, N. Takeda, S. Kudo, J. Hayashi and K. Norinaga, Int. J. Coal Sci. Technol., 2018, 5, 452–463 CrossRef CAS
.
- J. P. Chen, S. Wu and K. H. Chong, Carbon, 2003, 41, 1979–1986 CrossRef CAS
.
- D. Mugisidi, A. Ranaldo, J. W. Soedarsono and M. Hikam, Carbon, 2007, 45, 1081–1084 CrossRef CAS
.
- G. Zhou, C. Xu, W. Cheng, Q. Zhang and W. Nie, J. Anal. Methods Chem., 2015, 2015, 1–8 Search PubMed
.
- X. Ma, B. Zhou, A. Budai, A. Jeng, X. Hao, D. Wei and D. Rasse, Analysis, 2016, 47, 593–601 CAS
.
- S. Bakshi, C. Banik and D. A. Laird, Chemosphere, 2018, 194, 247–255 CrossRef CAS PubMed
.
- L. Li, X. Wang, S. Wang, Z. Cao, Z. Wu, H. Wang and J. Liu, Electroanalysis, 2016, 28, 243–248 CrossRef CAS
.
- X. Cheng, L. Shi, Q. Liu and Z. Liu, Energy Fuels, 2019, 33, 2008–2017 CrossRef CAS
.
- L. Shi, Q. Liu, X. Guo, W. Wu and Z. Liu, Fuel Process. Technol., 2013, 108, 125–132 CrossRef CAS
.
- X. G. Li, Y. Lv, B. G. Ma, W. Q. Wang and S. W. Jian, Arabian J. Chem., 2017, 10, S2534–S2538 CrossRef CAS
.
- Z. Lei, S. Hao, J. Yang and X. Dan, Int. J. Hydrogen Energy, 2020, 45, 19280–19290 CrossRef CAS
.
- C. Li, C. Zhang, M. Gholizadeh and X. Hu, J. Hazard. Mater., 2020, 399, 123075–123085 CrossRef CAS PubMed
.
- L. Chao, C. Zhang, L. Zhang, M. Gholizadeh and X. Hu, Waste Manag., 2020, 116, 9–21 CrossRef CAS PubMed
.
- D. D. Le, X. Xiao, K. Morishita and T. Takarada, J. Chem. Eng. Jpn., 2009, 42, 51–57 CrossRef CAS
.
- J. P. Cao, J. Ren, X. Y. Zhao, X. Y. Wei and T. Takarada, Fuel, 2018, 217, 515–521 CrossRef CAS
.
| This journal is © The Royal Society of Chemistry 2021 |

