
 Open Access Article
 This Open Access Article is licensed under a Creative Commons Attribution-Non Commercial 3.0 Unported Licence
Catalytic approach to in vivo metabolism of atractylenolide III using biomimetic iron–porphyrin complexes†
Hanae Lima,
Hyeri Jeona,
Seungwoo Hong*a and
Jung-Hoon Kim *b
*b
aDepartment of Chemistry, The Research Institute of Natural Sciences, Sookmyung Women's University, 04310, Seoul, Republic of Korea. E-mail: hsw@sookmyung.ac.kr; Fax: +82-2-2077-7321; Tel: +82-2-2077-7829
bDivision of Pharmacology, School of Korean Medicine, Pusan National University, 50612, Yangsan, Republic of Korea. E-mail: kmsct@pusan.ac.kr; Fax: +81-51-510-8420; Tel: +82-51-510-8456
First published on 7th October 2021
Abstract
Atractylenolide III (AT-III) is a pharmacologically effective phytochemical and is known to be oxygenated during systemic metabolism mainly by cytochrome P450 enzymes (CYP450s), iron-containing porphyrin-based oxygenases. In rat plasma samples, the oxygenated metabolite of orally ingested AT-III was determined using liquid chromatography/mass spectrometry and the oxygenated form of AT-III was maintained at higher levels than the original form of AT-III. In situ catalytic reactions using the iron(IV)-oxo porphyrin π-cation radical complex, [(tmp+˙)FeIV(O)]+, demonstrated that both H-atom abstraction and an oxygen rebound mechanism participated in the oxygenation process of AT-III. Density functional theory (DFT) confirmed the oxidative transformation occurred at the 4th and 10th carbon positions of AT-III. Co-treatment with acetaminophen had different effects between in vivo and in situ models of AT-III metabolism. AT-III was metabolized via an oxygenation process in the rat body, where CYP450 and other O2-activating metalloenzymes might participate in the metabolism. The present work provided the oxidative metabolism of AT-III using an in vivo model parallel with in situ biomimetic reaction models.
Introduction
Atractylenolide III (AT-III, C15H20O3, MW = 248.32 g mol−1) is a sesquiterpene lactone-type phytochemical mainly derived from Atractylodes japonica Koidzumi (Asteraceae), a medicinal plant traditionally used for treating gastrointestinal disorders. AT-III has been recently recognized as an emerging bioactive compound known for its pharmacological effects, such as anticarcinogenic properties,1 inhibition of muscular atrophy,2 microglial neuroprotection,3 and anti-inflammation.4 After oral administration, AT-III exerts these biological effects via systemic circulation by acting on the target organs or tissues in its original form or after chemical modification via in vivo metabolic processes. In our previous study a biomimetic iron(IV)-oxo porphyrin π-cation radical complex (known as compound I) model has shown that AT-III was oxidised from atractylenolide II (C15H20O2, MW = 232.32 g mol−1) and dehydrated to atractylenolide I (C15H18O2, MW = 230.3 g mol−1) via an intrinsic biosynthetic pathway in A. japonica (Scheme 1).5 Although AT-III is considered as one of the final products of oxidative metabolism in the plant, it can act as a precursor during in vivo drug metabolism after intragastric administration.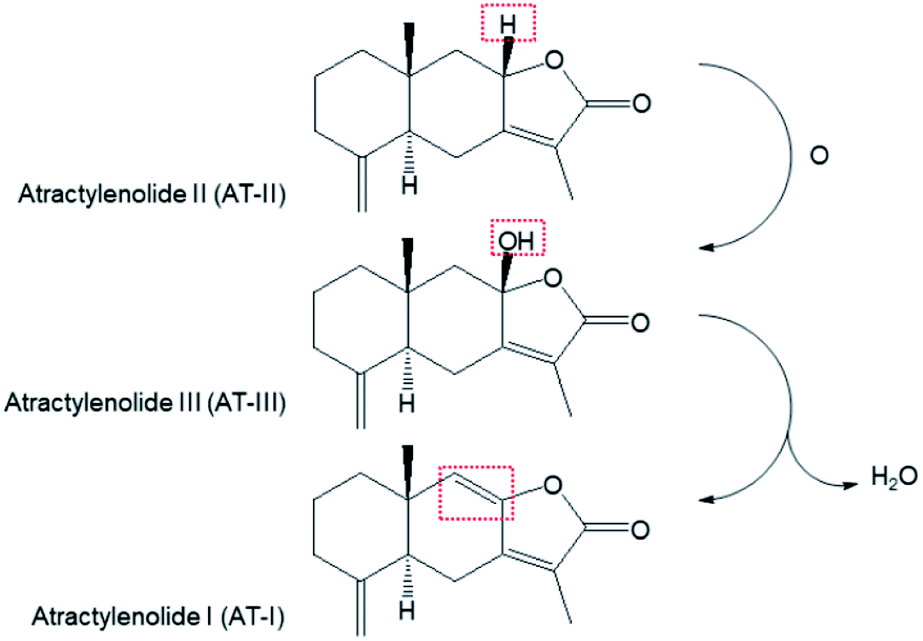 | ||
| Scheme 1 The transformation of atractylenolide I, II, and III in biosynthetic pathway (ref. 5). | ||
Drug metabolism, which is pivotal for modifying a biological substrate's structure, alters the compound's hydro-/electrophilic moieties, increases/decreases toxicity, or changes its biological activity.6 These modifications are caused by oxidation, reduction, and conjugation reactions in the presence of specific enzymes, and occur mainly in the liver.7 Among the heme-containing metalloenzymes responsible for drug metabolism, cytochrome P450 isozymes (CYP450s) play a key role in phase I metabolism via the oxidative transformation of the exogenous substrate, namely dextromethorphan.8 In the catalytic cycle of CYP450-mediated metabolism, the insertion of an oxygen atom in the substrate of interest is essentially mediated by an iron-containing porphyrin (heme), which is a core oxygen-presenting structure of CYP450 enzymes, with the help of the cofactor NADPH.9 The exogenous substrates initiates the electron transfer process and the ferric-to-ferrous reduction takes place in order to further react with dioxygen to yield porphyrin π-cation radical (known as compound I). The compound I, a strong oxidant, oxidizes biomolecules and mediates the dissociation of the transformed product.10 Compound I introduces two crucial metabolic pathways during the CYP450-mediated metabolism process, both of which are initiated by a hydrogen atom abstraction step via the hydroxylation or desaturation of the aliphatic groups.11
Various organic substrates have their own oxidation rate constants during their respective oxidation/oxygenation reactions with compound I; these rate constants can be modulated by adjusting experimental conditions such as the temperature and pressure.12,13 This has promoted increased interest in the use of synthetic biomimetic model complexes as oxidation catalysts. Researchers are keenly interested in finding chemical probes that can offer mechanistic insights into biological pathways of these oxidation/oxygenation reactions. Previous studies focused on stabilising and characterising compound I have led to breakthroughs in our understanding of the fundamental reaction steps governing the diverse oxidative reactivity of most heme enzymes in the metabolism of chemical drugs.14,15 Meanwhile, the oxidative reaction of compound I is also applicable to the in vivo metabolism of phytochemicals from natural products.
In this work, in vivo studies on the oxygenation of metabolites in plasma samples collected from rats after the oral administration of AT-III were conducted by applying an liquid chromatography/mass spectrometry (LC/MS) method. A biomimetic model such as an iron(IV)-oxo porphyrin π-cation radical complex was utilized to confirm the pathway governing the in vivo metabolism of AT-III mediated by CYP450 (Scheme S1†). The oxidation rate of AT-III was calculated and the structure of its oxygenated metabolite was estimated via density functional theory (DFT) calculation. Additionally, investigations on the influence of acetaminophen (APAP), which is a widely and frequently used over-the-counter analgesic, on the in vivo metabolism and the oxidation rate of AT-III were conducted to provide its synergistic effects.
Results and discussion
Determination of atractylenolide-III and its oxygenated metabolite in the plasma samples
The ionization of the target compounds was performed in positive electrospray ionization mode. A full-scan mode was applied for detecting AT-III and its metabolite. The molecular ion [M + H]+ of AT-III and its fragmented ions were acquired at m/z of 248.93 (tR = 8.3 min) and its fragmented ions were detected at m/z 230.96 and 163.01 via MS2 and MS3 analyses (Fig. S1†). After oral administration, the molecular ion of the AT-III metabolite, which had undergone the addition of an oxygen atom (AT-III–O, tR = 5.2 min), was detected at m/z 264.97 in the plasma samples. Further fragmentation was noted at m/z 246.99, 229.13 and 201.09, respectively, as determined via MS2 and MS3 analyses. These ions contained an extra 16 Da in their original structures, as previously reported (Fig. S2†).16In the mean relative area ratio–time profiles, the mean ratio of AT-III decreased for the peak at 0.5 h after oral administration, whereas the intensity of the oxygenated AT-III peaks increased almost threefold relative to the peaks of the original AT-III, regardless of the presence of APAP. These observed increases in the AT-III metabolite relative to the parent AT-III compound were attributed to in vivo metabolic amplification since some metabolites of phytochemicals are known to exhibit this behaviour.17,18 The relative area ratios of AT-III in the plasma samples between the single and APAP-combined administered groups were not significantly different for all time-courses investigated. The ratio associated with AT-III–O, which exhibited a notable increase at 0.5 h in both groups, also showed statistically insignificant differences between the single and combined administered groups across all time-courses investigated. Even though the mean area under the curve (AUC) of the relative area ratios of AT-III in the single group (1.883 ± 0.311) decreased slightly after co-administration with APAP (1.135 ± 0.288), the differences in the AUCs were not statistically significant. There were no significantly significant differences in the mean AUCs of the relative area ratios of AT-III–O between the single (9.246 ± 1.274) and the APAP-combined (9.015 ± 1.424) groups, respectively (Fig. 1). It was assumed that the influx of AT-III in the animal's circulation system and the production of the oxidative metabolite were both unaffected by the simultaneous administration of APAP.
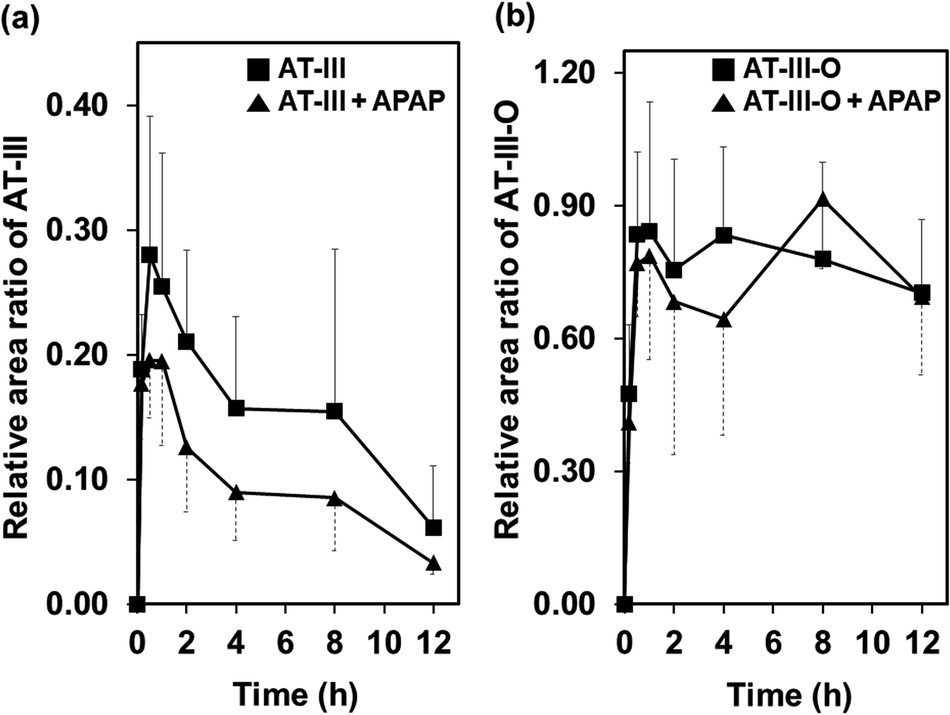 | ||
| Fig. 1 (a) Mean relative area ratio–time profiles of atractylenolide III (AT-III) and (b) oxygenated atractylenolide III (AT-III–O) after administration of AT-III single or with acetaminophen (APAP). Relative area ratio = the peak area of target compound/the peak area of IS. Differences of relative area ratios between single and combinative administration groups were not statistically significant. | ||
Oxidative transformation of atractylenolide III using biomimetic model of cytochrome P450
In our previous work, we demonstrated that a high-valent iron(IV)-oxo porphyrin π-cation radical complex, [(tmp+˙)FeIV(O)]+ (1) (tmp = meso-tetramesitylporphyrin), was capable of activating the C–H bond of AT-II to produce AT-III. H-atom abstraction from AT-II generated [(tmp)FeIV(OH)] and the subsequent oxygen rebound process formed AT-III.5 In the present study, the analysis of the plasma samples obtained after the single-administration of AT-III and the co-administration of AT-III and APAP revealed that the oxidised product of AT-III had been formed. The addition of AT-III to the CH3CN/CH2Cl2 (9![[thin space (1/6-em)]](https://www.rsc.org/images/entities/char_2009.gif) :1) solvent mixture containing 1 at −40 °C did not afford any spectral changes (Fig. S3,† inset). However, the direct oxidation of AT-III occurred when the reaction temperature was increased to −20 °C (Fig. 2).
:1) solvent mixture containing 1 at −40 °C did not afford any spectral changes (Fig. S3,† inset). However, the direct oxidation of AT-III occurred when the reaction temperature was increased to −20 °C (Fig. 2).
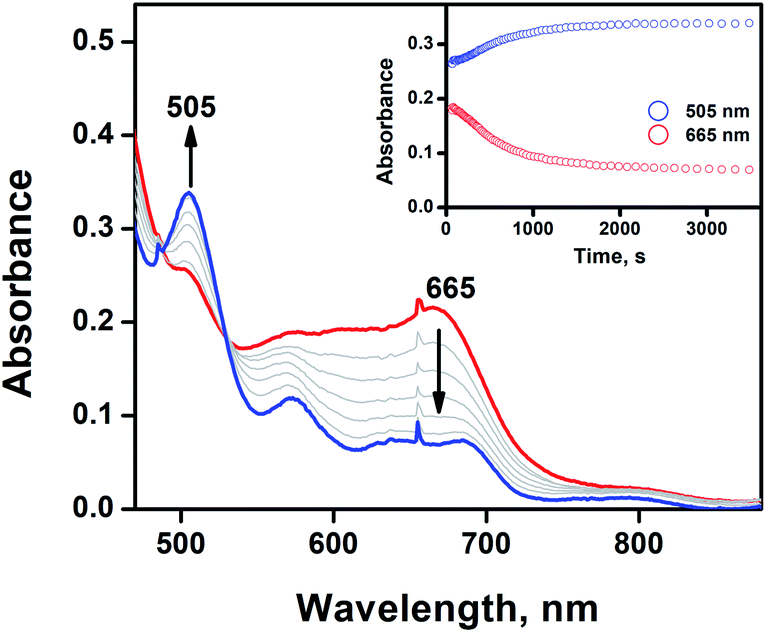 | ||
| Fig. 2 UV-vis spectral changes of [(tmp+˙)FeIV(O)]+ (0.025 mM) (1, red line) upon addition of 20 equiv. of AT-III at −20 °C, resulting in the formation of [FeIII(tmp)](CF3SO3) (blue line). Inset shows the time course of the formation of [FeIII(tmp)](CF3SO3) (blue dot) and the decay of 1 (red dot) monitored at 505 and 665 nm, respectively. | ||
The natural decay rate was independently calculated as 8.2 × 10⁻³ s−1 (Fig. S3,† inset). After the addition of 20 equiv. of AT-III to the CH3CN/CH2Cl2 (9:1) solvent mixture of 1, the notably slow decay rate of 1.2 × 10⁻² s−1 was observed due to the disappearance of 1 with the concomitant formation of [FeIII(tmp)]+ (Fig. 2). The observed decay rate of 1 showed a linear dependence on the AT-III concentration, resulting in a second-order rate constant (k2) value of 2.8 M−1 s−1 for the oxidation of AT-III by 1 at −20 °C (Fig. S4†). Interestingly, the immediate disappearance of 1 was detected when APAP was used as a substrate, indicating that APAP was more preferentially oxidised than AT-III (Fig. S5†). APAP is known to be oxidised to N-acetyl-p-benzoquinone-imine (NAPQI), with further conversion to benzoquinone.19 Since both AT-III and APAP could be competently oxidised by 1, their electrochemical properties were examined via cyclic voltammetry (Fig. S6†). The increased intensity of the oxidation peak potential of AT-III was ∼0.25 V vs. Ag/Ag+, whereas that of APAP was −0.50 V vs. Ag/Ag+. This clearly demonstrated that APAP was much easier to be oxidised than AT-III, thereby accounting for the differences in their redox reactivity originating from their electrochemical properties. The proposed mechanism of APAP oxidation indicated that the proton-coupled electron transfer process was surmised to be the rate-determining step for the production of NAPQI.19 For AT-III oxidation, the oxygenation reaction could occur via the H-atom abstraction process, followed by the oxygen rebound mechanism.5 As the electron transfer reaction occurred, smaller structural changes were noted in 1 than in the group transfer reaction because the oxidation of APAP would require less energetic barrier than that of AT-III.20 Thus, the reaction between 1 and APAP was preferentially promoted compared to its counterpart with AT-III.
Confirmation of oxygenated positions at AT-III using density functional theory (DFT) calculation
Gas chromatography analysis of the organic products, which was conducted after the completion of the reaction between 1 and AT-III, showed a new peak with a retention time at 21.3 min that was assigned to the oxidised product of AT-III (Fig. S7†). However, the peak at 21.3 min did not appear when APAP and AT-III were introduced simultaneously; instead, a new peak attributed to NAPQI was detected at a retention time of 18.3 min, clearly indicating that the presence of APAP in the reaction solution hindered the oxygenation of AT-III by 1. Even though gas chromatography/mass spectrometry (GC/MS) analysis suggested that an oxygen atom was incorporated into the product, the isolation and recrystallization of this organic product was unsuccessful. Alternatively, DFT-calculations for all possible oxygenated products were conducted to determine the optimised structures for the organic products and to simulate plausible positions for oxygenation on the AT-III molecule. The higher spin density on the carbon atoms at the 4th and 10th positions of the oxidised AT-III indicated that these carbons were more basic and, thus, highly prone to oxidation (Fig. 3a). We then calculated the relative energy of radical species of the corresponding radicals on 4th and 10th position; the energy of radical on 10th position of AT-III was 12.68 kcal mol−1 higher than that on 4th position (Fig. 3b and Table 1). Therefore, we suggested that the hydroxylation would occur at 4th position of AT-III. Given these findings, two oxygenated structures of AT-III were envisioned (Fig. 4). Analysis showed that their relative energies differed by only 1.49 kcal mol−1, indicating that both positions were susceptible to be hydroxylated (Table 1).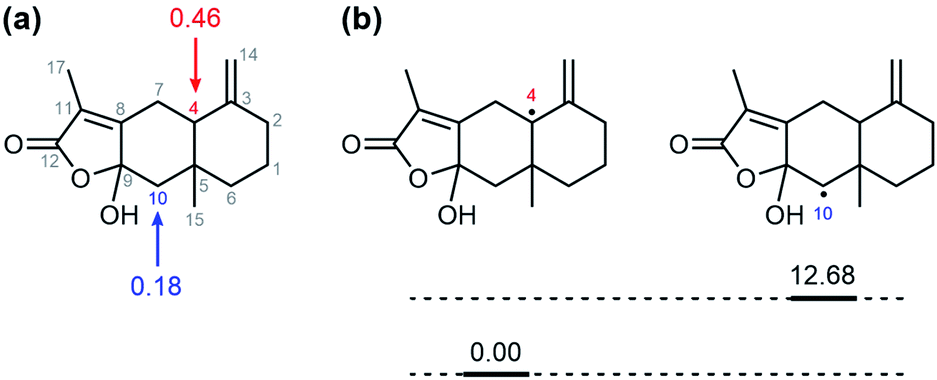 | ||
| Fig. 3 (a) Mulliken spin densities of one electron oxidized AT-III. (b) The relative energies diagram of radical on 4th and 10th carbon. | ||
| Δ6-31G | ΔΔ6-311+G** | ΔEa | ΔΔZ0 | ΔΔEthermalb | −TΔΔSb | ΔΔDisp | ΔGc | |
|---|---|---|---|---|---|---|---|---|
| a Electronic energy, sum of the previous two columns.b T = 298 K.c Sum of the five previous columns, ΔG = ΔE + ΔΔZ0 + ΔΔEthermal – TΔΔS + ΔΔDisp. | ||||||||
| 4th Carbon oxidized AT-III | 0.00 | 0.00 | 0.00 | 0.00 | 0.00 | 0.00 | 0.00 | 0.00 |
| 10th Carbon oxidized AT-III | 1.56 | −0.73 | 0.83 | 0.32 | 0.06 | −0.20 | 0.59 | 1.60 |
| Radical on 4th carbon of AT-III | 0.00 | 0.00 | 0.00 | 0.00 | 0.00 | 0.00 | 0.00 | 0.00 |
| Radical on 10th carbon of AT-III | 13.00 | −0.32 | 12.68 | −0.34 | 0.06 | 0.39 | −0.41 | 12.38 |
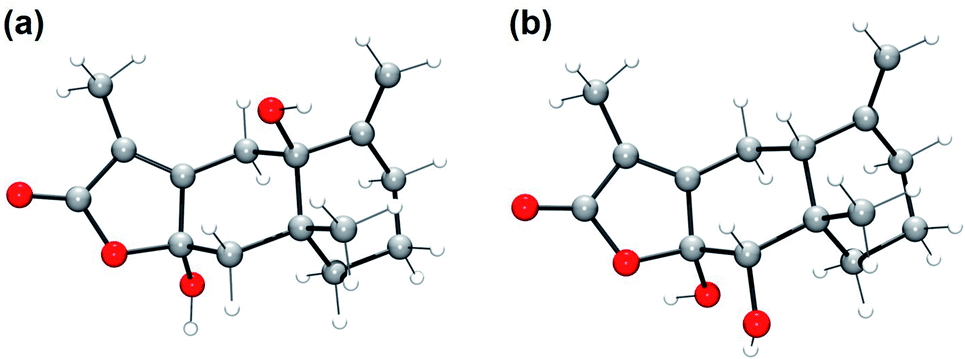 | ||
| Fig. 4 DFT-optimized structures of (a) 4th carbon and (b) 10th carbon oxidized AT-III. O, red; C, gray; H, white. | ||
LC/MS analysis revealed the presence of three distinct peaks in the oxidised by-product of AT-III after the reaction with 1 (Fig. S8a†). One (tR = 5.3 min) of these peaks, which produced a molecular ion observed at m/z 265.00, fragmented to m/z of 246.95, 229.12 and 201.06, respectively, as noted via MS2 and MS3 analyses. The molecular ion and its fragmented ions were noted as the addition of an oxygen atom (16 Da), and their associated spectra matched those of AT-III–O in the plasma samples after oral administration (Fig. S8b–d†). These results clearly provided the evidence that enzymes bearing an iron(IV)-oxo porphyrin, particularly the CYP450 enzymes, were responsible for the in vivo oxidative metabolism of ingested AT-III. The difference noted between the relative sizes of the peak observed at 5 min and the two peaks at 6 min were reversed in the plasma samples (Fig. S2a†), as the latter peaks were barely detected in the rat plasma samples due to lower detection sensitivity.
Experimental
Chemicals and reagents
Analytical-grade methanol and ethyl acetate were purchased from J.T. Baker Inc. (Phillipsburg, NJ, USA). LC/MS-grade acetonitrile and water containing 0.1% formic acid were purchased from Fisher Scientific (Pittsburgh, PA, USA). Atractylenolide III (AT-III) was purchased from ChemFace (Wuhan, Hubei, China). As the internal standard (IS), fraxinellone was purchased from Chengdu Biopurify Phytochemicals Ltd. (Chengdu, Sichuan, China). Acetonitrile (CH3CN) and dichloromethane (CH2Cl2) were dried according to reported procedures and distilled under Ar prior to use.21 m-Chloroperbenzoic acid (m-CPBA) was purified by washing with phosphate buffer (pH 7.4), followed by water and then dried under reduced pressure. [FeIII(tmp)]Cl was purchased from Frontier Scientific Inc. (Logan, UT, USA). [FeIII(tmp)](CF3SO3) was prepared by stirring equimolar amounts of [FeIII(tmp)]Cl and AgCF3SO3, followed by filtration through a 0.45 mm filter. The resulting solution was used immediately.Animals
Male Sprague Dawley (SD) rats (196.06 ± 7.61 g) were supplied by Samtako (Incheon, Korea). The SD rats were housed at constant temperature (22 ± 2 °C) and relative humidity (50 ± 10%) under a 12 h light/dark cycle for 7 days with free access to feed and water before the experiments. After an overnight fasting period, AT-III was administered to the rats intragastrically. Animal experiments were conducted per the guidelines for animal experimentation issued by Pusan National University. The experimental procedures were approved beforehand by the Animal Ethics Committee of Pusan National University (PNU-2020-2488).LC/MS conditions
An Accela LC system (Thermo Fisher Scientific, MA, USA) equipped with an autosampler, degasser, and quaternary solvent pump was used for the detection of AT-III and its metabolites. The compounds were separated on a Hypersil GOLD C18 column (2.1 mm × 100 mm, 1.9 μm; Thermo Fisher Scientific, MA, USA) at 35 °C. A flow rate was set at 300 μL min−1 with an injection volume of 5.0 μL. The aqueous mobile phase was optimised by using 0.1% formic acid and 10 mM ammonium acetate (pH 3.5 with formic acid); the peak of AT-III was only detected in the presence of 0.1% formic acid. Therefore, 0.1% formic acid was chosen as a modifier for the aqueous mobile phase (v/v). Compared to the adamantyl functional group (ADME) column, the octadecylsilane (C18)-coated column offered better sensitivity and improved the peak shape of AT-III. The mobile phase consisted of water (containing 0.1% formic acid, A) and acetonitrile (B); the gradient elution applied was as follows: 7% (B) for 0–1 min, 70–85% (B) for 1–10 min, 85% (B) for 10–11 min, followed by equilibrated to 7% (B) until the end of the analysis.An LCQ Fleet ion-trap mass spectrometer (Thermo Fisher Scientific, MA, USA) was used to detect compounds in the eluent using an electrospray ionisation source in the positive-ion mode. The MS conditions were nitrogen sheath gas (40 arbitrary units), nitrogen auxiliary gas (10 arbitrary units), spray voltage (5.0 kV), capillary temperature (280 °C) and capillary voltage (30.0 V). The molecular ions of AT-III and IS were detected in the full-scan mode (m/z 50–500). The molecular ions [M + H]+ and their fragmented ions were acquired at m/z 248.99–230.96 for AT-III and m/z 233.00–214.98 for IS. Moreover, the single oxygen atom-added metabolite of AT-III (AT-III–O) was detected at m/z 264.92–246.99 after the oral administration of AT-III, as previously reported.16 Data was processed using Xcalibur software (v. 2.1.0; Thermo Fisher Scientific, CA, USA).
Collection of rat plasma samples
AT-III (18 mg per rat) was administered to five SD rats and one rat was given a vehicle. AT-III was dissolved in 0.5% ethanol-contained saline (v/v). Blood samples (∼0.4 mL) were collected from the jugular vein in heparinised tubes before oral administration (0 h), and at 0.17, 0.5, 1, 2, 4, 8 and 12 h after intragastric administration. The collected blood samples were immediately centrifuged at 16249 × g for 10 min; 150 μL aliquots of the supernatant plasma were transferred to clean tubes and stored at −20 °C until the analysis.
Preparation of plasma samples
The extraction efficiencies of the liquid–liquid extraction (LLE) and the protein precipitation methods were compared using the absolute area of the target compounds and IS. The peak areas of AT-III and IS obtained via LLE in ethyl acetate (EA) were 1.4-fold higher than those obtained using the protein precipitation method in methanol. Therefore, the LLE method was chosen for preparing the plasma samples due to its higher extraction efficiency, simplicity and reliability. A 150 μL aliquot of the plasma sample was spiked with the IS solution (10 μL) and of methanol (10 μL), followed by the addition of EA (600 μL). The extraction of the target compounds was performed by vortex mixing for 2 min at room temperature, followed by centrifuging at 16249 × g for 10 min at 20 °C. The upper layer (EA) was then transferred to a clean 1.5 mL polypropylene tube and evaporated using a nitrogen gas blowing concentrator (MGS–2200; Eyela, Miyagi, Japan). The residue obtained after evaporation was reconstituted in methanol (100 μL) and vortex mixed for 2 min, followed by centrifugation at 16249 × g for 10 min at 20 °C. The supernatant was transferred to a glass vial and a 5 μL aliquot was injected into the UPLC-ion trap MS system.
Statistical analysis
The relative area ratio of each compound was calculated using the following equation: Relative area ratio = the peak area of the target compound/the peak area of IS. The difference in the ratios between the single and APAP-combined groups were determined via two-tailed t-test (independent sample t-test) using Microsoft Excel (ver. 2014; Redmond, WA, USA). The differences were considered statistically significant at p < 0.05, p < 0.01, or p < 0.001.Kinetics studies
The UV-vis spectra were recorded on a UV-visible spectrophotometer (Cary 8454; Agilent, Santa Clara, CA. USA) equipped with a temperature-controlled cuvette holder (UNISOKU Co., Ltd., Hirakata, Osaka, Japan). The reactions were followed by monitoring the UV-vis spectral changes of the reaction solutions at −40 °C. All reactions were run in triplicate, and the data reported represented the average of these reactions. The iron(IV)-oxo porphyrin π-cation radical species, [(tmp+˙)FeIV(O)]+ (1), was prepared as previously reported; briefly, [FeIII(tmp)](CF3SO3) was treated with 2.4 equiv. of m-CPBA in a CH3CN/CH2Cl2 (9:1) solvent mixture at −20 °C.5 The formation of the iron(IV)-oxo intermediates was confirmed via UV-vis spectrophotometry. Subsequently, appropriate amounts of AT-III were added to the reaction solutions. After the completion of the reactions, pseudo-first-order fitting of the kinetic data allowed us to determine the kobs values. The resulting solution was directly injected into the HPLC for the identification and quantification of the reaction products. The products were identified by comparing the obtained retention times and mass patterns to those of known authentic samples. The hydroxylated of AT-III was confirmed via LC/MS analysis.
Cyclic voltammetry
Electrochemical measurements were performed on a CHI617B electrochemical analyzer (CH Instruments, Inc., Austin, TX, USA) in CH3CN containing 0.10 M Bu4NPF6 (TBAPF6) as the supporting electrolyte at 25 °C. A conventional three-electrode cell was used with a glassy carbon working electrode (surface area of 0.030 cm2), a platinum wire as the counter electrode and an Ag/Ag+ electrode as the reference electrode (in CH3CN). The glassy carbon working electrode was routinely polished with BAS polishing alumina suspension and rinsed with acetone and acetonitrile before use. The measured potentials were recorded with respect to the Ag/Ag+ (0.010 M) reference electrode (in CH3CN).DFT calculation
The geometric optimisation of AT-III, the one-electron oxidised AT-III and the 4th and 10th carbon oxidised AT-III were conducted with the starting structure taken from the known structure of AT-III and manually modified. DFT22 geometric optimisations and frequency calculations were performed at the B3LYP/6-31G level23–32 of theory using the Gaussian 16 package.33 Solvent (water) effects were incorporated, even during geometry optimizations, through CPCM scheme as implemented in Gaussian 16.34,35 The energy evaluations were performed at the B3LYP/6-311+G** level29,36–44 on the structure obtained via B3LYP/6-31G.Conclusions
We noted that both AT-III and its oxygenated form (AT-III–O) were detected in plasma samples collected from rats after the oral administration of AT-III. A catalytic reaction model using iron(IV)-oxo porphyrin, [(tmp+˙)FeIV(O)]+ (1), revealed that the oxygenation of AT-III proceeded via H-atom abstraction and an oxygen rebound mechanism, with a second-order rate constant (k2) of 2.8 M−1 s−1 at −20 °C that was mediated by 1. Theoretical calculations revealed that the oxygenation of AT-III by 1 occurred at the 4th and 10th carbon positions. Although the chemical reaction model revealed that the oxidation of APAP was faster than that of AT-III using 1, we noted that the co-administration of APAP with AT-III did not affect the kinetic changes of AT-III and AT-III–O in the rat model. Given these findings, we theorised that the metabolism of AT-III involved CYP450 and other O2-activating metalloenzymes. The complexity of the metabolic pathways is highlighted in the present study and warrants more detailed investigations to determine its usefulness combinatorial medical applications.Author contributions
Hanae Lim: methodology, validation, formal analysis, investigation, data curation, writing – original draft. Hyeri Jeon: methodology, formal analysis, data curation. Seungwoo Hong: methodology, validation, formal analysis, investigation, data curation, writing – original draft, writing – review & editing, supervision, project administration, funding acquisition. Jung-Hoon Kim: methodology, validation, formal analysis, investigation, data curation, writing – original draft, writing – review & editing, supervision.Conflicts of interest
There are no conflicts to declare.Acknowledgements
This work was supported by National Research Foundation of Korea (NRF) grant funded by the Korea government (MSIT; the Ministry of Science and ICT) (No. 2020R1C1C1008886 to S. Hong). The authors thank the Korean Herbarium of Standard Herbal Resources, Korea Institute of Oriental Medicine for providing the sample materials.Notes and references
- J. B. Liu, D. Chen, T. T. Bao, F. T. Fan and C. Yu, Front. Pharmacol., 2020, 10, 1505 CrossRef PubMed
.
- M. Wang, R. Hu, Y. Wang, L. Liu, H. You, J. Zhang, X. Wu, T. Pei, F. Wang, L. Lu, W. Xiao and L. Wei, Oxid. Med. Cell. Longevity, 2019, 2019, 1875471 Search PubMed
- K. C. Zhou, J. Chen, J. Y. Wu, Q. Y. Wu, C. Q. Jia, Y. X. Z. Xu, L. Chen, W. Tu, G. Yang, J. Kong, J. Kou and S. Jiang, Phytomedicine, 2019, 59, 152922 CrossRef CAS PubMed
- G. Q. Ji, R. Q. Chen and L. Wang, Immunopharmacol. Immunotoxicol., 2016, 38, 98–102 CrossRef CAS PubMed
- J. H. Kim, Y. Lee, G. Lee, E. J. Doh and S. Hong, ACS Omega, 2018, 3, 14833–14840 CrossRef CAS PubMed
- F. P. Guengerich, AAPS J., 2006, 8, E101–E111 CrossRef CAS PubMed
- P. Josephy, F. P. Guengerich and J. O. Miners, Drug Metab. Rev., 2005, 37, 575–580 CrossRef CAS PubMed
- J. Olah, A. J. Mulholland and J. N. Harvey, Proc. Natl. Acad. Sci. U. S. A., 2011, 108, 6050–6055 CrossRef CAS PubMed
- P. C. Nair, R. A. McKinnon and J. O. Miners, Drug Metab. Rev., 2016, 48, 434–452 CrossRef CAS PubMed
- A. W. Munro, H. M. Girvan and K. J. McLean, Nat. Prod. Rep., 2007, 24, 585–609 RSC
- L. Ji, A. S. Faponle, M. G. Quesne, M. A. Sainna, J. Zhang, A. Franke, D. Kumar, R. van Eldik, W. Li and S. P. de Visser, Chem.–Eur. J., 2015, 21, 9083–9092 CrossRef CAS PubMed
- C. Fertinger, N. Hessenauer-Ilicheva, A. Franke and R. van Eldik, Chem.–Eur. J., 2009, 15, 13435–13440 CrossRef CAS PubMed
- M. Oszajca, A. Franke, A. Drzewiecka-Matuszek, M. Brindell, G. Stochel and R. van Eldik, Inorg. Chem., 2014, 53, 2848–2857 CrossRef CAS PubMed
- C. M. Chapman, J. M. Pruneau, C. A. Laverack, A. S. Dutton and G. B. Jones, Appl. Catal., A, 2015, 510, 204–215 CrossRef
- F. G. C. Reinhard and S. P. de Visser, Inorganics, 2017, 5, 77 CrossRef
- Z. Jiang, C. Peng, W. Huang, B. Wu, D. Zhang, H. Ouyang, Y. Feng and S. Yang, J. Chromatogr. Sci., 2019, 57, 163–176 CAS
- S. Spinozzi, C. Colliva, C. Camborata, M. Roberti, C. Ianni, F. Neri, C. Calvarese, A. Lisotti, G. Mazzella and A. Roda, J. Nat. Prod., 2014, 77, 766–772 CrossRef CAS PubMed
- Y. Bai, W. Peng, C. Yang, W. Zou, M. Liu, H. Wu, L. Fan, P. Li, X. Zeng and W. Su, Front. Pharmacol., 2020, 11, 364 CrossRef CAS PubMed
- D. W. Potter and J. A. Hinson, J. Biol. Chem., 1987, 262, 966–973 CrossRef CAS
- R. A. Marcus, Angew. Chem., Int. Ed. Engl., 1993, 32, 1111–1121 CrossRef
- W. L. F. Armarego and C. L. L. Chai, Purification of Laboratory Chemicals, Pergamon Press, Oxford, 6th edn, 2009 Search PubMed
- W. Kohn and L. J. Sham, Phys. Rev., 1965, 140, A1133–A1138 CrossRef
- R. Ditchfield, W. J. Hehre and J. A. People, J. Chem. Phys., 1971, 54, 724–728 CrossRef CAS
- W. J. Hehre, R. Ditchfield and J. A. Pople, J. Chem. Phys., 1972, 56, 2257–2261 CrossRef CAS
- P. C. Hariharan and J. A. Pople, Theor. Chem. Acc., 1973, 28, 213–222 Search PubMed
- P. C. Hariharan and J. A. Pople, Mol. Phys., 1974, 27, 209–214 CrossRef CAS
- M. S. Gordon, Chem. Phys. Lett., 1980, 76, 163–168 CrossRef CAS
- M. M. Francl, W. J. Pietro, W. J. Hehre, J. S. Binkley, D. J. DeFrees, J. A. Pople and M. S. Gordon, J. Chem. Phys., 1982, 77, 3654–3665 CrossRef CAS
- R. C. Binning Jr and L. A. Curtiss, J. Comput. Chem., 1990, 11, 1206–1216 CrossRef
- J.-P. Blaudeau, M. P. McGrath, L. A. Curtiss and L. Radom, J. Chem. Phys., 1997, 107, 5016–5021 CrossRef CAS
- V. A. Rassolov, J. A. Pople, M. A. Ratner and T. L. Windus, J. Chem. Phys., 1998, 109, 1223–1229 CrossRef CAS
- V. A. Rassolov, M. A. Ratner, J. A. Pople, P. C. Redfern and L. A. Curtiss, J. Comput. Chem., 2001, 22, 976–984 CrossRef CAS
- M. J. Frisch, G. W. Trucks, H. B. Schlegel, G. E. Scuseria, M. A. Robb, J. R. Cheeseman, G. Scalmani, V. Barone, G. A. Petersson, H. Nakatsuji, X. Li, M. Caricato, A. V. Marenich, J. Bloino, B. G. Janesko, R. Gomperts, B. Mennucci, H. P. Hratchian, J. V. Ortiz, A. F. Izmaylov, J. L. Sonnenberg, D. Williams-Young, F. Ding, F. Lipparini, F. Egidi, J. Goings, B. Peng, A. Petrone, T. Henderson, D. Ranasinghe, V. G. Zakrzewski, J. Gao, N. Rega, G. Zheng, W. Liang, M. Hada, M. Ehara, K. Toyota, R. Fukuda, J. Hasegawa, M. Ishida, T. Nakajima, Y. Honda, O. Kitao, H. Nakai, T. Vreven, K. Throssell, J. A. Montgomery Jr, J. E. Peralta, F. Ogliaro, M. J. Bearpark, J. J. Heyd, E. N. Brothers, K. N. Kudin, V. N. Staroverov, T. A. Keith, R. Kobayashi, J. Normand, K. Raghavachari, A. P. Rendell, J. C. Burant, S. S. Iyengar, J. Tomasi, M. Cossi, J. M. Millam, M. Klene, C. Adamo, R. Cammi, J. W. Ochterski, R. L. Martin, K. Morokuma, O. Farkas, J. B. Foresman and D. J. Fox, Gaussian 16, Revision B.01, Gaussian, Inc., Wallingford CT, 2016 Search PubMed
- V. Barone and M. Cossi, J. Phys. Chem. A, 1998, 102, 1995–2001 CrossRef CAS
- M. Cossi, N. Rega, G. Scalmani and V. Barone, J. Comput. Chem., 2003, 24, 669–681 CrossRef CAS PubMed
- A. D. McLean and G. S. Chandler, J. Chem. Phys., 1980, 72, 5639–5648 CrossRef CAS
- K. Raghavachari, J. S. Binkley, R. Seeger and J. A. Pople, J. Chem. Phys., 1980, 72, 650–654 CrossRef
- J.-P. Blaudeau, M. P. McGrath, L. A. Curtiss and L. Radom, J. Chem. Phys., 1997, 107, 5016–5021 CrossRef CAS
- A. J. H. Wachters, J. Chem. Phys., 1970, 52, 1033–1036 CrossRef CAS
- P. J. Hay, J. Chem. Phys., 1977, 66, 4377–4384 CrossRef CAS
- K. Raghavachari and G. W. Trucks, J. Chem. Phys., 1989, 91, 1062–1065 CrossRef
- M. P. McGrath and L. Radom, J. Chem. Phys., 1991, 94, 511–516 CrossRef CAS
- L. A. Curtiss, M. P. McGrath, J.-P. Blaudeau, N. E. Davis, R. C. Binning Jr and L. Radom, J. Chem. Phys., 1995, 103, 6104–6113 CrossRef CAS
- T. Clark, J. Chandrasekhar, G. W. Spitznagel and P. v. R. Schleyer, J. Comput. Chem., 1983, 4, 294–301 CrossRef CAS
Footnote |
| † Electronic supplementary information (ESI) available: Chromatograms of atractylenolide III/oxidized atractylenolide III and the mass spectra; UV-vis spectral changes of 1 (0.025 mM) observed at −20 °C; plot of pseudo-first order rate constants (kobs); UV-vis spectral changes of [(tmp+˙)FeIV(O)]+ (0.025 mM) (1, red line) after the addition of 20 equiv. of APAP at −20 °C; cyclic voltammograms of (a) AT-III (2.0 mM) and (b) APAP (2.0 mM); GC data of the standard samples; chromatogram of oxygenated atractylenolide III and the mass spectra. See DOI: 10.1039/d1ra05014a |
| This journal is © The Royal Society of Chemistry 2021 |