DOI:
10.1039/D1RA04942A
(Paper)
RSC Adv., 2021,
11, 34836-34841
Study on curing kinetics and behaviours of PGN adhesives
Received
25th June 2021
, Accepted 23rd September 2021
First published on 27th October 2021
Abstract
The curing kinetics between PGN and N100 were studied by Fourier transform infrared spectroscopy and dynamic torsional vibration method. The results showed that the entire curing process of adhesives was divided into three stages. Infrared spectroscopy can only monitor the first and second stages, while dynamic torsional vibration method monitors the second and third stages. Combining the two analysis methods allows the complete monitoring of the entire curing process in this system. Besides, differential scanning calorimeter is not suitable for studying this process.
1 Introduction
Polyglycidyl nitrate (PGN) is an energetic binder with –ONO2 groups. Due to its high energy density and high oxygen content,1–5 it is regarded as one of the most potential energetic adhesives in solid propellants in the future. PGN has been synthesized in the last century, so there are some reports on its synthesis,6,7 modification8,9 and application,10–12 but studies on the reaction kinetics of the PGN curing reaction system have been rare. It is important that curing kinetics and behaviours as well as the entire curing process of the system have potential values for improving its curing stability.
There are some ways for monitoring the curing process, including Fourier transform infrared spectroscopy (FT-IR), dynamic torsional vibration, differential scanning calorimetry (DSC)13,14 and dielectric analysis methods.15–17 In general, any single method cannot completely monitor the entire curing process. For instance, FT-IR spectroscopy can easily monitor the changes of chemical functional groups, but cannot monitor the physical crosslinking in the system at the later stage of the reaction. Abbas et al.18 performed FT-IR spectroscopy to study the chemical kinetics of the HTPB/IPDI and GAP/IPDI systems, and found that the activation energies of the HTPB/IPDI and GAP/IPDI systems were 41.06 kJ mol−1 and 63.51 kJ mol−1, respectively. Manu et al.19 performed FT-IR spectroscopy to study the curing reactions between hydroxyl-terminated glycidyl azide polymer (GAP) and different isocyanates at different temperatures; the results indicated that the reactivity of different isocyanates followed the sequence: TDI > IPDI ≫ MDCI. Unlike FT-IR spectroscopy, the dynamic torsional vibration method can monitor the mechanical torque changes in the late curing stage to analyze the curing mechanism and curing end point, but it cannot monitor the reaction mechanism in the early curing stage. Xu et al.20 used the dynamic torsional vibration method to study the curing behaviors of epoxy resin E51/OrgMMT/imidazole intercalated nanocomposites. Their results were in agreement with the theoretical predictions. He et al.21 studied the isothermal curing process of the epoxy resin-boron trifluoride monoethylamine complex-SiO2 resin system via the dynamic torsional vibration method. As a result, its curing conditions were optimized and the effect of filler on the cure was discussed.
Therefore, it is very important to study the whole curing process of the system in the field of solid propellants. In this study, the curing process of the PGN adhesives was studied by FT-IR, dynamic torsional vibration method and DSC, and its curing kinetics and behaviors were analyzed. The curing behaviors obtained by FT-IR and dynamic torsional vibration methods were similar, and the combination of the above methods can monitor the whole curing process.
2 Experimental section
2.1 Materials
Hydroxyl-terminated polyglycidyl nitrate (PGN, 3170 g mol−1) was dried at 60 °C in vacuum two days before use; PGN and biuret polyisocyanate (N100-isocyanate content: 5.38 mmol g−1) were obtained from Luoyang Liming Chemical Research Institute. Dibutyltin dilaurate (DBTDL) and diisooctyl sebacate were obtained from the Beijing chemical plant and used without further purification.
2.2 Preparation of the sample
Dibutyltin dilaurate (DBTDL) was dissolved in diisooctyl sebacate (DOS) solution as a catalyst at a concentration of 0.5%. First, 0.2% catalyst (0.01 g), N100 (0.6035 g), and PGN (4.3865 g) were added in a 50 mL glass beaker at room temperature, then stirred for 10 min. Finally, the obtained mixture was transferred to the corresponding instrument for experimental testing.
2.3 Characterization
Crosslink density test was carried out on a VTMR20-010V-T Nuclear Magnetic Resonance Crosslink Density Meter, Shanghai Niumai Electronic Technology Co., Ltd, at a test temperature of 60 °C. Scanning electron microscopy (SEM) was carried out on a Hitachi S4800, and before analysis, the surfaces were coated with thin layers of gold of about 100 Å. Fourier variable infrared spectroscopy (FT-IR) was performed on a Nicolet 8700 FTIR infrared spectrometer obtained from Thermo electron corporation in the United States; the resolution was 4 cm−1, the number of scans was 16, and the scan range was 4000 to 500 cm−1. Dynamic torsional vibration test was performed on a RCM-3000E computerized dynamic torsional vibration curing instrument of Wuxi Liyuan Electronics Chemical Equipment Co., Ltd to test the curing process of the sample. Differential scanning calorimeter (DSC) was performed on a DSC1/500/578 Differential Scanning Calorimeter (Mettler-Toledo Company, Switzerland) under N2 protection at the flow rate of 40 mL min−1. Thermal weight loss test (TG) was performed on a DSC/TGA1, Mettler-Toledo Company, Switzerland, and the heating rate was 10 °C min−1, the N2 atmosphere was 20 mL min−1, and the test temperature was from 30 °C to 600 °C.
3 Results and discussion
3.1 Characterization of curing process
First, LF-NMR was used to test the spin relaxation time (T2) of the adhesive system at different curing times to analyze the relationship between the relaxation and curing time. Fig. 1 shows that the area of the T2S part grows from scratch and gradually becomes larger with the increase in the curing time. In addition, the cross-linking density of the system increased, leading to a decrease in T2S, indicating that the system formed cross-linked structures. After 168 h, T2S was constant, implying that the system had reached the curing end point.
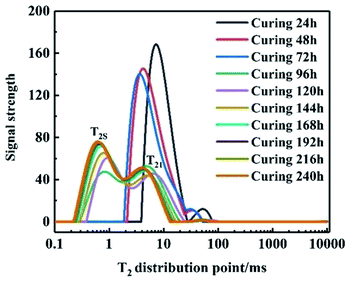 |
| | Fig. 1 Multi-component spin relaxation time of binder system at different times. | |
Second, the surface morphology of the adhesives was tested by SEM during curing, as shown in Fig. 2. It can be seen that the adhesive is liquid before the reaction, and the liquid outline was clearly visible. As the curing reaction increased, the viscosity suddenly increased to form gels, then the gel gradually increased, while the sol gradually decreased, and finally the cross-linked complex network polymer structure was formed. Fig. 2(d) shows the cross-sectional images of the cross-linked polymer after curing and molding. The surface of samples is relatively smooth and flat, implying that the curing was complete.
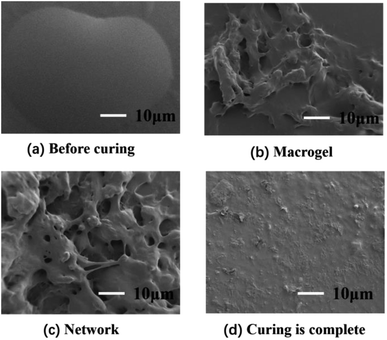 |
| | Fig. 2 SEM images of curing process with different time: (a) 0 d (b) 1 d (c) 2 d (d) 7 d. | |
3.2 Fourier transform infrared spectroscopy method
The infrared spectra of the PGN/N100 system at different times are shown in Fig. 3(a). It can be seen that the –NCO peaks gradually decreased, indicating that the content of –NCO groups decreased. By measuring the peak height of the reaction peak NCO (2264 cm−1) and the reference peak CH2 (2927 cm−1), the kinetic data of the PGN/N100/DBTDL system were obtained. Based on the changes in the –NCO peak height, the conversion rate of –NCO is calculated over time. The conversion rate calculation equation is given out as follows:| |
 | (1) |
where H10 and H1 is the peak heights of the –NCO characteristic absorption peak in the infrared spectrum at the initial time and t, respectively; H20 and H2 are the peak heights of the reference peak at the initial time and t, respectively. The conversion curve at different temperatures is shown in Fig. 3(b). It can be seen that the conversion rate of NCO is very high due to the high concentration. Moreover, its conversion becomes more prominent at high temperatures. After the conversion rate reached 60%, the reaction rate is greatly reduced due to the beginning of curing. The viscosity of the adhesive system increases rapidly. When the reaction degree of conversion reached 60%, the higher viscosity impeded molecular motion and reduced the diffusion rate, which changes the mechanism of the curing reaction. The time t60 corresponding to the cut-off point is shown in Table 1. To determine the best curing reaction type and molecular diffusion method, the models from Table 2 were used to fit the relation between t and conversion rate based on the data of samples at 80 °C. The fitting results are shown in Table 3.
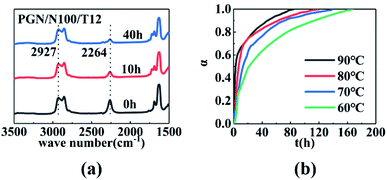 |
| | Fig. 3 (a) Infrared spectra of the PGN adhesive system at 90 °C. (b) Conversion time curves for the PGN adhesive system at different temperatures. | |
Table 1 Time t60 when the reaction conversion rate of PGN adhesive system is 60%
| Temperature/°C |
60 |
70 |
80 |
90 |
| t60/h |
38 |
19.3 |
10.2 |
5.3 |
Table 2 Curing reaction kinetic mechanism function
| Reaction type |
Name |
Mechanism |
Differential form |
Points form |
| Diffusion control reaction |
Parabolic law |
One-dimensional diffusion |
1/2α |
α2 |
| Valensi equation |
Two-dimensional diffusion |
[−ln(1 − α)]−1 |
α + (1 − α)ln(1 − α) |
| Ginstling-Brounshtein equation |
Three-dimensional diffusion |
3[(1 − α)−1/3 − 1]−1/2 |
(1 − 2α/3)-(1 − α)2/3 |
| Jander equation |
Three-dimensional diffusion |
3(1 − α)2/3[1 − (1 − α)1/3]−1/2 |
[1 − (1 − α)1/3]2 |
| Anti-Jander equation |
Three-dimensional diffusion |
3(1 + α)2/3[(1 + α)1/3 − 1]−1/2 |
[(1 + α)1/3 − 1]2 |
| Chemical reaction |
Chemical reaction |
Level 1 response |
1 − α |
−ln(1 − α) |
| Chemical reaction |
1.5 level response |
(1 − α)3/2 |
2[(1 − α)−3/2 − 1] |
| Chemical reaction |
2nd order reaction |
(1 − α)2 |
α/(1 − α) |
Table 3 Correlation coefficients fitted by different mechanism functions
| Reaction mechanism |
Correlation coefficient before 60% r |
Correlation coefficient after 60% r |
| Parabolic law |
0.989 |
0.974 |
| Valensi equation |
0.987 |
0.995 |
| Ginstling-Brounshtein equation |
0.986 |
0.997 |
| Jander equation |
0.982 |
0.938 |
| Anti-Jander equation |
0.985 |
0.967 |
| Level 1 response |
0.998 |
0.962 |
| 1.5 level response |
0.989 |
0.464 |
| 2nd order reaction |
0.994 |
0.621 |
The results show that a linear correlation is best when the first-order kinetic model is used for processing before the conversion rate is 60%. Therefore, the α at different times and temperature in Fig. 3(b) was substituted into the first-order kinetic model equation, as shown in Fig. 4(a).
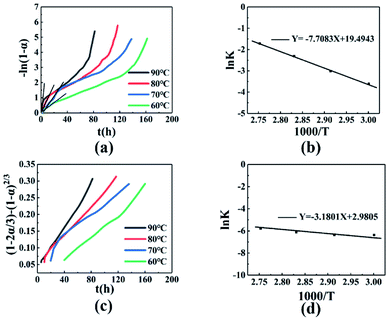 |
| | Fig. 4 (a) −ln(1 − α) − t relationship diagram. (b) ln![[thin space (1/6-em)]](https://www.rsc.org/images/entities/char_2009.gif) K − 1000/T relationship diagram before t60. (c) (1 − 2α/3) − (1 − α)2/3 − t relationship diagram. (d) ln K − 1000/T relationship diagram before t60. (c) (1 − 2α/3) − (1 − α)2/3 − t relationship diagram. (d) ln![[thin space (1/6-em)]](https://www.rsc.org/images/entities/char_2009.gif) K − 1000/T relationship diagram after t60. K − 1000/T relationship diagram after t60. | |
The fitted result between −ln(1 − α) and t is better before t60, and is poor after t60, as shown in Fig. 4(a). In addition, the slope k of the fitted line increased with temperature, indicating that the reaction rate increased. Performing a linear fit to the conversion rate before t60, the specific regression equations, correlation coefficient r, and linear slope value k at different temperatures are shown in Table 4. A plot of ln![[thin space (1/6-em)]](https://www.rsc.org/images/entities/char_2009.gif) k − 1/T gave a straight line after fitting, as shown in Fig. 4(b). Kinetic parameters can be obtained according to the Arrhenius equation, as follows (2):
k − 1/T gave a straight line after fitting, as shown in Fig. 4(b). Kinetic parameters can be obtained according to the Arrhenius equation, as follows (2):
where
k is the rate constant,
Ea is the activation energy,
T is the absolute temperature in Kelvin,
A is known as pre-exponential factor and
R is gas constant. Logarithmic form of the Arrhenius equation can be obtained as follows
(3):
| |
ln![[thin space (1/6-em)]](https://www.rsc.org/images/entities/char_2009.gif) k = ln k = ln![[thin space (1/6-em)]](https://www.rsc.org/images/entities/char_2009.gif) A − Ea/RT A − Ea/RT
| (3) |
Table 4 Fitted data at different temperatures before t60
| Temperature/°C |
Regression equation |
r |
k/(h−1) |
| 60 |
−ln(1 − α) = 0.027t |
0.975 |
0.027 |
| 70 |
−ln(1 − α) = 0.049t |
0.998 |
0.049 |
| 80 |
−ln(1 − α) = 0.099t |
0.998 |
0.099 |
| 90 |
−ln(1 − α) = 0.179t |
0.973 |
0.179 |
Based on Fig. 4(b) and the eqn (3), the activation energy before the conversion rate of 60% is 64.08 kJ mol−1, and the pre-exponential constant A = 2.92 × 10⁸ h−1.
Fitting the mechanical function of the reaction after 60% of conversion rate, as shown in Table 3. It was found that the relationship between the conversion rate and time conforms to the Ginstling-Brounshtein equation, the (1 − 2α/3) − (1 − α)2/3 − t curve is shown in Fig. 4(c). The fitting curve is linearly related, indicating that the curing reaction mechanism conformed to the three-dimensional diffusion model. After t60 time, the regression equation, the correlation coefficient r, and the value of the obtained fitting straight line slope k are shown in Table 5. The slope and intercept are obtained by fitting ln![[thin space (1/6-em)]](https://www.rsc.org/images/entities/char_2009.gif) k − 1/T, as shown in Fig. 4(d). According to the Arrhenius equation, when the conversion rate is higher than 60%, the activation energy of the curing reaction is 26.44 kJ mol−1, the pre-exponential constant A = 19.70 h−1.
k − 1/T, as shown in Fig. 4(d). According to the Arrhenius equation, when the conversion rate is higher than 60%, the activation energy of the curing reaction is 26.44 kJ mol−1, the pre-exponential constant A = 19.70 h−1.
Table 5 Fitting data at different temperatures after t60
| Temperature/°C |
Regression equation |
r |
k/(h−1) |
| 60 |
(1 − 2α/3) − (1 − α)2/3 = 0.0017t − 0.019 |
0.994 |
0.0017 |
| 70 |
(1 − 2α/3) − (1 − α)2/3 = 0.0017t + 0.058 |
0.987 |
0.0017 |
| 80 |
(1 − 2α/3) − (1 − α)2/3 = 0.0023t + 0.047 |
0.997 |
0.0023 |
| 90 |
(1 − 2α/3) − (1 − α)2/3 = 0.0032t + 0.037 |
0.996 |
0.0043 |
3.3 Dynamic torsional vibration method
The dynamic torsional vibration method was used to test the curing process of the PGN/N100/DBTDL adhesive system, and the curve in Fig. 5(a) was obtained. To study the curing process, 80 °C was used as an example for analysis, and it can be seen that the torque values do not change in the initial stage of the reaction. This is because the adhesive system is in a liquid state. As the reaction progresses, the hydroxyl group (–OH) in PGN and the isocyanate group (–NCO) in N100 quickly react chemically, and chemical cross-linking points appear, causing the torque to rise rapidly. As the concentration of reactants gradually decreased, the rate of increase in the torque value gradually reduced, implying that the system was completely cured and the three-dimensional crosslinking networks had been constructed.
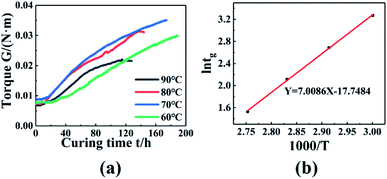 |
| | Fig. 5 (a) Torque changes with time at different temperatures. (b) ln![[thin space (1/6-em)]](https://www.rsc.org/images/entities/char_2009.gif) tg − 1000/T relationship diagram. tg − 1000/T relationship diagram. | |
When the system torque starts to rise, this time is called the gel point. The gel point time decreased with the temperature, as shown in Fig. 5(a). This is because the higher temperature enhanced the chemical reaction rate, and reduced the curing time. The gel point time is shown in Table 6 at different temperature. According to the Flory gelation theory, the fitted results are shown in Fig. 5(b), and the activation energy is 58.27 kJ mol−1.
Table 6 Gel point time at different temperatures
| Temperatures |
60 °C |
70 °C |
80 °C |
90 °C |
| tg/h |
26.3 |
14.7 |
8.3 |
4.6 |
To obtain the curing reaction mechanism function of the PGN adhesive system, a plot of the torque conversion rate with the curing time curve was obtained, as shown in Fig. 6(a). Taking 70 °C as an example, the various mechanism functions in Table 2 are fitted to the curve in Fig. 6(a), and the correlation coefficient is shown in Table 7. It was found that the linear correlation is the best at the range of 20–130 h using the Anti-Jander equation, which is basically the same as that of the FT-IR method after the conversion rate is 60%. Combined with the different temperature measured by FT-IR spectroscopy, the Anti-Jander equation was used to fit the conversion rates of 60 °C, 70 °C, 80 °C, and 90 °C in the intervals of 30–160 h, 20–130 h, 10–110 h, 5–70 h, and make [(1 + α)1/3 − 1]2 − t diagram, as shown in Fig. 6(b). It can be seen from the figure that the fitting effect is better; the regression equation and correlation coefficient are shown in Table 8. Therefore, it can be seen that the dynamic torsion vibration method to monitor the curing of PGN can be divided into three stages. The first stage is the stage before the gel point; in this stage, the internal curing reaction of the system occurs rapidly and forms a small amount of the cross-linked structure, while the torque basically remains unchanged. The second stage is that the cross-linking points increase significantly, the cross-linking network is gradually formed and the viscosity increases rapidly, the diffusion of molecules is restricted, so it can be seen that the reaction mechanism is a three-dimensional diffusion model. The third stage is the perfect stage of the cross-linking network, the chemical reaction is basically complete, and physical cross-linking is mainly caused by hydrogen bonding and the intermolecular interaction force. The cross-linking network is gradually improved until the torque is basically constant, completing the curing and cross-linking.
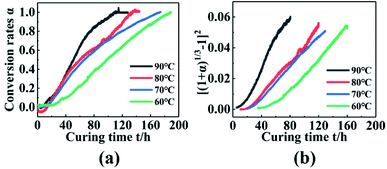 |
| | Fig. 6 (a) Changes in torque conversion rate with time at different temperatures. (b) [(1 + α)1/3 − 1]2 − t relationship diagram. | |
Table 7 Correlation coefficients fitted by different reaction mechanisms
| Reaction mechanism |
r |
| Parabolic law |
0.997 |
| Valensi equation |
0.985 |
| Ginstling-Brounshtein equation |
0.983 |
| Jander equation |
0.968 |
| Anti-Jander equation |
0.999 |
| Level 1 response |
0.997 |
| 1.5 level response |
0.994 |
| 2nd order reaction |
0.932 |
Table 8 Regression equation and correlation coefficient of reaction mechanism function at different temperatures
| Temperature/°C |
Regression equation |
r |
k/(h−1) |
| 60 |
[(1 + α)1/3 − 1]2 = 8.9 × 10⁻⁴t − 0.0088 |
0.993 |
8.9 × 10⁻⁴ |
| 70 |
[(1 + α)1/3 − 1]2 = 5.1 × 10⁻⁴t − 0.0097 |
0.999 |
5.1 × 10⁻⁴ |
| 80 |
[(1 + α)1/3 − 1]2 = 4.9 × 10⁻⁴t − 0.0121 |
0.996 |
4.9 × 10⁻⁴ |
| 90 |
[(1 + α)1/3 − 1]2 = 4.4 × 10⁻⁴t − 0.0214 |
0.988 |
4.4 × 10⁻⁴ |
3.4 Differential scanning calorimetry (DSC) method
First of all, to understand the thermal performance of PGN and N100, thermal analysis tests were conducted on them, and the thermal decomposition curves of PGN and N100 are shown in Fig. 7. It can be seen that PGN starts to decompose at about 170 °C; this is due to the decomposition of –ONO2 on its side base, while N100 also starts to decompose at about 180 °C. To avoid its decomposition, DSC was carried out to test the adhesive system at different heating rates in the range of 30–150 °C, and the kinetic parameters of the curing reaction were obtained.
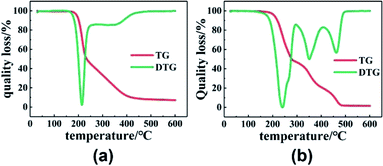 |
| | Fig. 7 (a) TG and DTG curves of PGN. (b) TG and DTG curves of N100. | |
Fig. 8(a) shows the DSC curves of the curing reaction of PGN and N100 at different heating rates. It can be seen that the position of the exothermic peak of the curing reaction of the PGN adhesive system is related to the heating rate, and the exothermic peak moves in the high-temperature direction with the increase in the heating rate. This is mainly because under the condition of a higher heating rate, the heat effect per unit time increases, but the energy absorption time of the system is shorter, and the reaction lags more. Based on this, the activation energy Ea, the pre-exponential constant A, and the reaction order n can be calculated using the Kissinger and Crane equations according to the corresponding peak exothermic temperature at different heating rates. Table 9 shows the peak exothermic temperature Tp of the exothermic peak corresponding to different heating rates. The data in Table 9 was processed according to the Kissinger equation, and a plot of the ln(β/Tp2) − 1/Tp gave the fitted straight line, as shown in Fig. 8(b). The slope and intercept of the straight line were substituted into the following formula (4):
| |
 | (4) |
where
R is the ideal gas constant,
R = 8.314 J (mol k)
−1, and
A is the pre-exponential constant (s
−1). It is calculated that the activation energy of the curing reaction of the PGN adhesive system is
Ea = 46.76 kJ mol
−1 and the pre-exponential constant
A = 1.68 × 10
7 s
−1. According to the Crane equation, the PGN adhesive curing reaction order was the calculated using the following formula
(5):
| |
 | (5) |
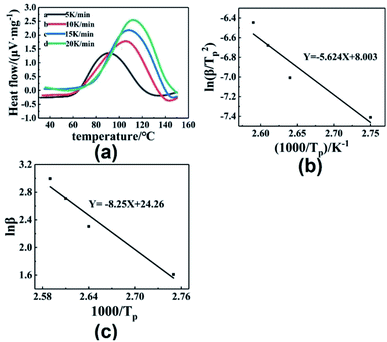 |
| | Fig. 8 (a) DSC curves of curing reaction at different heating rates. (b) ln(β/Tp2) − (1/Tp) relationship diagram. (c) ln![[thin space (1/6-em)]](https://www.rsc.org/images/entities/char_2009.gif) β − (1/Tp) relationship diagram. β − (1/Tp) relationship diagram. | |
Table 9 Tp of PGN/N100 at different heating rates
| β/(K min−1) |
5 |
10 |
15 |
20 |
| Tp/°C |
90.92 |
105.17 |
109.25 |
112.33 |
Since Ea/(nR) is much larger than 2Tp, the above formula can be approximately simplified to the following formula (6):
| |
 | (6) |
A plot of ln![[thin space (1/6-em)]](https://www.rsc.org/images/entities/char_2009.gif) β − 1/Tp gave the fitted straight line, as shown in Fig. 8(c). According to the slope, the reaction order n = 0.68 was calculated.
β − 1/Tp gave the fitted straight line, as shown in Fig. 8(c). According to the slope, the reaction order n = 0.68 was calculated.
4 Conclusions
In this study, different methods were used to monitor the curing process of PGN adhesives. By studying the curing reaction mechanism of the adhesive system, it was found that the combination of FT-IR and dynamic torsional vibration method can fully monitor the entire curing process of the adhesive. This is of great significance for studying the curing of polymers.
Conflicts of interest
The authors declare that they have no known competing financial interests or personal relationships that could have appeared to influence the work reported in this paper.
Notes and references
- Z. Zhang, W. Gang, L. Nan, M. Huang and Y. Luo, J. Appl. Polym. Sci., 2015, 131, 21 Search PubMed.
- E. Diaz, P. Brousseau, G. Ampleman and R. E. Prud‘homme, Propellants, Explos., Pyrotech., 2003, 28, 101 CrossRef CAS.
- F. Abrishami, N. Zohari and V. Zeynali, Polym. Adv. Technol., 2018, 30, 4 Search PubMed.
- Q. F. Dong, H. B. Li, X. H. Liu and C. Huang, Propellants, Explos., Pyrotech., 2018, 43, 294 CrossRef CAS.
- J. Chen, B. Jin, G. Luo, H. Liu, Q. Zhang, Q. Huang and R. Peng, J. Chem. Thermodyn., 2019, 132, 397 CrossRef CAS.
- H. Lin, X. D. Wang, B. Wang, C. F. Zhao, Q. Z. Niu and L. X. Wang, Chem. Propellants Polym. Mater., 2007, 5, 19 Search PubMed.
- E. Astuti, R. Supranto and A. Prasetya, Key Eng. Mater., 2016, 718, 95 Search PubMed.
- J. S. Kim, J. R. Cho, K. D. Lee and J. K. Kim, US Pat., US7880023 B2[P], 2011 Search PubMed.
- M. M. Vala, Y. Bayat and M. Bayat, Defence Sci. J., 2020, 70, 461 CrossRef CAS.
- M. L. Chan and A. D. Turner, US Pat., US6783614 B1[P], 2005 Search PubMed.
- Z. J. Zhang, N. Luo, Z. Wang and Y. J. Luo, J. Appl. Polym. Sci., 2015, 132, 42026 Search PubMed.
- F. Abrishami, N. Zohari and V. Zeynali, Polym. Adv. Technol., 2018, 30, 1 Search PubMed.
- K. B. Catherine, K. Krishnan and K. N. Ninan, J. Therm. Anal. Calorim., 2000, 59, 93 CrossRef CAS.
- K. Ghoreishi, M. A. Yarmo and N. Asim, J. Polym. Res., 2015, 22, 18 CrossRef.
- L. H. Garden, D. Hayward and R. A. Pethrick, Proc. Inst. Mech. Eng., Part E, 2007, 221, 521 CAS.
- F. Lionetto and A. Maffezzoli, J. Polym. Sci., Polym. Phys. Ed., 2005, 43, 596 CrossRef CAS.
- L. Zong, L. C. Kempel and M. C. Hawley, Polymer, 2005, 46, 2638 CrossRef CAS.
- A. Tanver, M. H. Huang, Y. J. Luo and Z. H. Hei, Adv. Mater. Res., 2015, 1061–1062, 337 Search PubMed.
- S. K. Manu, V. Sekkar, K. J. Scariah, T. L. Varghese and S. Mathew, J. Appl. Polym. Sci., 2008, 110, 908 CrossRef CAS.
- W. Xu, P. He and D. Chen, Eur. Polym. J., 2003, 39, 617 CrossRef CAS.
- P. He and C. Li, J. Appl. Polym. Sci., 2010, 43, 1011 Search PubMed.
|
| This journal is © The Royal Society of Chemistry 2021 |
Click here to see how this site uses Cookies. View our privacy policy here.  Open Access Article
 a,
Xiaomeng Li*a,
Shanjun Ding
 b and
Yunjun Luo
 a
a


![[thin space (1/6-em)]](https://www.rsc.org/images/entities/char_2009.gif) k − 1/T gave a straight line after fitting, as shown in Fig. 4(b). Kinetic parameters can be obtained according to the Arrhenius equation, as follows (2):
k − 1/T gave a straight line after fitting, as shown in Fig. 4(b). Kinetic parameters can be obtained according to the Arrhenius equation, as follows (2):![[thin space (1/6-em)]](https://www.rsc.org/images/entities/char_2009.gif) k = ln
k = ln![[thin space (1/6-em)]](https://www.rsc.org/images/entities/char_2009.gif) A − Ea/RT
A − Ea/RT
![[thin space (1/6-em)]](https://www.rsc.org/images/entities/char_2009.gif) k − 1/T, as shown in Fig. 4(d). According to the Arrhenius equation, when the conversion rate is higher than 60%, the activation energy of the curing reaction is 26.44 kJ mol−1, the pre-exponential constant A = 19.70 h−1.
k − 1/T, as shown in Fig. 4(d). According to the Arrhenius equation, when the conversion rate is higher than 60%, the activation energy of the curing reaction is 26.44 kJ mol−1, the pre-exponential constant A = 19.70 h−1.
![[thin space (1/6-em)]](https://www.rsc.org/images/entities/char_2009.gif) tg − 1000/T relationship diagram.
tg − 1000/T relationship diagram.


![[thin space (1/6-em)]](https://www.rsc.org/images/entities/char_2009.gif) β − (1/Tp) relationship diagram.
β − (1/Tp) relationship diagram.
![[thin space (1/6-em)]](https://www.rsc.org/images/entities/char_2009.gif) β − 1/Tp gave the fitted straight line, as shown in Fig. 8(c). According to the slope, the reaction order n = 0.68 was calculated.
β − 1/Tp gave the fitted straight line, as shown in Fig. 8(c). According to the slope, the reaction order n = 0.68 was calculated.


