DOI:
10.1039/D1RA04785J
(Paper)
RSC Adv., 2021,
11, 28361-28374
Retracted Article: Antibacterial and antibiofilm activities of silver-decorated zinc ferrite nanoparticles synthesized by a gamma irradiation-coupled sol–gel method against some pathogenic bacteria from medical operating room surfaces
Received
21st June 2021
, Accepted 9th August 2021
First published on 23rd August 2021
Abstract
This work aimed at the gamma irradiation-assisted synthesis of silver (Ag)-decorated ZnFe2O4 (ZFO) ferrite nanoparticles (NPs), which were tested for their antibacterial and antibiofilm activities against some pathogenic bacteria from medical operating room surfaces. The prepared Ag-decorated ZFO NPs were characterized via XRD, SEM, EDX, elemental mapping, and FTIR analysis. The antibacterial potential was tested as ZOI and MIC, while antibiofilm activity was estimated by the tube method. The growth curve assay, the effect of UV on the antimicrobial activity, and cell membrane leakage were evaluated, and the antibacterial reaction mechanism was investigated by SEM/EDX analysis. The XRD and FTIR results confirmed the successful preparation of Ag-decorated ZFO NPs. Antibacterial results revealed that the most potent decorated sample was Ag0.75@ZFO NPs, recording the most significant inhibition zone against Staphylococcus vitulinus (24.67 ± 0.577 mm) and low MIC (0.097 μg mL−1) against S. vitulinus. The antibiofilm activity of Ag0.75@ZFO NPs was the highest, recorded as 97.3% for S. aureus and 95.25% for Enterococcus columbae. In the case of UV exposure, bacterial growth reached the lowest grade. Finally, it was seen that the amount of cellular protein released from bacterial cells is directly proportional to the concentration of Ag0.75@ZFO NPs, which clearly explains the formation of pits in the cell membrane. The synthesized nanocomposites may find an application after mixing with operating room paints to reduce the harmful effect of pathogenic microbes and, therefore, eliminate bacterial contamination.
1. Introduction
A hospital-acquired infection, also identified as a nosocomial infection, is an issue of concern for clinical or other health care equipment.1 Hospitals, outpatient clinics, surgical operating rooms, and diagnostic laboratories collect bacterial infection. Bacterial disease affects sensitive patients in the clinical environment in different ways.2 Pathogenic bacteria have been identified to remain on inanimate ‘touch’ surfaces for long periods.3 Touch surfaces usually located in hospital rooms, such as bed tracks, chairs, door handles, and dispensers (alcohol gel, paper towel, detergent), are contaminated with some pathogenic bacteria like methicillin-resistant Staphylococcus aureus.4 One of the promising approaches to manage pathogenic bacteria is the application of nanoparticle (NP) therapeutics and nanostructured-based coating materials for controlling bacterial contamination in some medical devices.5
Owing to the current attraction to find new antimicrobial products that have specific features like the ability to fight multidrug-resistant bacteria, it is essential to improve the successful methods used to screen and quantify the antimicrobial impact of the treatments regarding their applications in human health, agriculture, and the environment.6 A medical laboratory must examine and suggest the antimicrobial tests and agents that are most suitable for bacterial isolation and the site of bacterial infection as a good quality control model.7
Biofilms are the usual predominant life form of bacteria in all types of environments, either natural or artificial. Biofilms can grow on a wide variety of surfaces. Biofilms have been associated with food spoilage, water pollution, and infectious diseases.8 The ability of S. aureus to produce biofilms has been wholly related to the production of polysaccharide intracellular adhesion and adhesions termed microbial surface components recognizing adhesive molecule matrix, which become involved as primary agents in biofilm development.9 In current times, the application of inorganic antimicrobial agents has attracted much consideration to control the biofilms produced by pathogenic bacteria.10 Inorganic antimicrobial composites, as compared to their organic equivalents, possess definite benefits such as being more safe and stable at high temperatures.10
Nanotechnology is one of the increasingly active topics of research in modern material sciences; consequently, metal NPs are of vital concern regarding their physicochemical properties and particularly optoelectronic features with regard to many areas such as drug distribution, electronic sensing, and photocatalysis.11 Zinc ferrite (ZnFe2O4; ZFO) is an excellent magnetic material with interesting properties, and is notable for its extraordinary optical, magnetic, and electrical features. Besides, the controllable nature of the ZFO structure can enhance the nanostructure, which leads to superparamagnetic materials.12–14 ZFO NPs have been broadly utilized in numerous areas such as biomedicine,15 energy storage,16 gas sensors,17 drug delivery,18 antimicrobial agents,19 and water remediation.20
On the other hand, metal NPs have extraordinary usage in various fields, like electronics,21 water purification,22 medicine,23 and biotechnology.24 Amongst NPs applied so far, silver (Ag) NPs have been notably examined for their unique features such as antibacterial,25 antiviral,26 antifungal,27 anti-inflammatory,28 and anticancer29,30 activities.
Many studies have shown the effectiveness of Ag NPs as a therapeutic agent for treating infectious diseases, and they have also been mixed inside clothes during production for application as an antimicrobial agent.31 Ag NPs are now commonly applied nanomaterials in the healthcare area, with global production yearly estimated to be 500 tons.32
Radiation-induced synthetic methods and especially those that allow the interaction of gamma rays with solutions may have a fantastic potential to fight with approved plans to increase the purposes in terms of synthesis, control in the size, shape, eco-friendly of starting materials, and decreases the production of the toxic materials, overall these benefits are eco-friendly.33,34
Overall, this paper reports, for the first time, the gamma irradiation-assisted synthesis of Ag-decorated ZFO NPs (Ag@ZFO). Afterwards, the pure ZFO NPs and Ag-decorated ZFO NPs were tested against pathogenic strains from medical operating room surfaces (surgical rooms). The synthesized Ag-decorated ZFO NPs were applied as antibacterial and antibiofilm agents against pathogenic bacteria. So, we assume that the synthesized samples could be used for various purposes in biomedical and industrial applications.
2. Materials and methods
2.1. Materials
Fe(NO3)3·9H2O (98.0%), ZnSO4·7H2O (98%), and AgNO3 (99%) were chosen as precursor materials for Fe, Zn, and Ag, respectively. Also, citric acid (C6H8O7, 99.57%) and ethylene glycol (C2H6O2, 99.8%) were used in the synthesis of the pure ZFO NPs via a sol–gel method.35–39
2.2. Synthesis of Ag-decorated ZFO NPs
An aqueous solution of starting precursors Fe(NO3)3·9H2O and ZnSO4·7H2O in their stoichiometric ratio in C6H8O7 and 10 ml of C2H6O2 was obtained via dissolving in deionized water. Further, the resulting solution was heated at 300 °C to initiate gel formation, and then the resulting gel was dried and ground employing agate mortar and pestle to obtain pure ZFO NPs. Furthermore, 5 g of pure ZFO NPs was mixed with different weight ratios of AgNO3 (0, 0.25, 0.50, and 0.75). The resulting suspension solutions were integrated under magnetic stirring for 30 min. The suspension mixture was subjected to a sonication process for 60 min.
2.3. Irradiation process
The mixture solution was exposed to 50 kGy at a dose rate of 1.1 kGy h−1 at ambient temperature. The irradiation was conducted employing 60Co gamma-cell sources, at NCRRT, Cairo, Egypt. The final product after filtration and washing process with a mixture of ethanol and water was dried in vacuum at 60 °C, affording the synthesized Ag-decorated ZFO NPs.
2.4. Characterization of Ag-decorated ZFO NPs
The pure ZFO NPs and Ag-decorated ZFO NPs were characterized via employing energy dispersive X-ray analysis (EDX), Fourier transform infrared (FTIR) spectroscopy, X-ray diffraction (XRD) technique, and scanning electron microscopy (SEM).40,41
2.5. Antibacterial activity of ZFO NPs and Ag-decorated ZFO NPs
2.5.1. Well diffusion test. Five pathogenic bacterial strains were isolated from medical operating room surfaces (surgical rooms) and identified as mentioned in our published paper.36 They were identified as Staphylococcus aureus, Staphylococcus sciuri, Staphylococcus lentus, Staphylococcus vitulinus, and Enterococcus columbae, which were kindly supplied from Drug Microbiology Lab., NCRRT, Cairo, Egypt. For further use, all the isolated and tested bacterial strains were kept on nutrient agar slants at 4 °C. The well diffusion technique was employed to evaluate the effects of pure ZFO NPs and Ag@ZFO NPs with different weight ratios of AgNO3 (0.25, 0.5, and 0.75) on the tested pathogens, according to El-Batal et al.42To study the antibacterial influence of pure ZFO NPs and Ag@ZFO NPs using the well diffusion method, a bacterial suspension was prepared and adjusted to standard 0.5 McFarland concentration equal to (1–2) × 108 CFU ml−1. Bacteria were inoculated on a nutrient agar medium, and 6.0 mm wells were slashed on every nutrient agar plate surface, filled by 100 μl of the tested treatments. Levofloxacin was used as a positive control. All the experiments were performed in triplicate, and the plates were incubated at 37 °C for 24 h. The lack of colonies in the microbial growth was represented as a zone of inhibition (ZOI) measured in mm.
2.5.2. Analysis of minimum inhibitory concentration (MIC) of ZFO NPs and Ag-decorated ZFO NPs. The MIC of pure ZFO NPs and Ag@ZFO NPs against the tested bacterial strains was estimated using the well diffusion method according to Roy et al.43 The overnight examined cultures were incubated for 2.0 h at 37 °C. After that, the inoculum of the tested bacteria was adjusted to 0.5 McFarland concentration. A total volume of 100 μl of McFarland's bacterial suspension was inoculated into nutrient agar medium plates. ZFO NPs and Ag@ZFO NPs were serially diluted two-fold with sterile distilled water to different concentrations (μg ml−1) then dipped individually in 6.0 mm wells made on the surface of the inoculated agar plates. The plates had incubated at 37 °C for 24 h, and the zone of inhibition was evaluated in mm. MIC was defined as the minimum concentration of ZFO NPs and Ag@ZFO NPs that will inhibit the apparent growth of bacteria after overnight incubation.
2.6. The antibiofilm activity of ZFO NPs and Ag-decorated ZFO NPs
ZFO NPs and Ag0.75@ZFO NPs (the best concentration used to inhibit bacterial growth) were investigated for their antibiofilm activity against the bacterial test strains by the tubes method as defined by Elbasuney et al.44 Test tubes containing 5.0 ml of nutrient broth were inoculated with 10 μl of 0.5 McFarland (1 × 10⁸ CFU ml−1) of the examined bacteria. Furthermore, 0.5 ml of ZFO NPs and Ag0.75@ZFO NPs was incorporated into the test tubes, while the same volume of water was added to the control tubes. The samples were incubated at 37 °C for 24 h. After the incubation, the media in the sample tubes were eliminated. The tubes were treated with phosphate buffer saline (PBS), pH 7, and finally dehydrated. Sodium acetate (5.0 ml) at a concentration of 3.0% was used for 10 min for stabilizing the adherent bacteria followed by washing with deionized water. The bacterial biofilms were stained with crystal violet (0.1%) for 15 min and then rinsed with deionized water. Finally, 2.0 ml of ethanol was added to dissolve the crystal violet. The biofilms were semi-quantitatively estimated using a UV-visible spectrophotometer at 570 nm. The percentage of inhibition was evaluated using eqn (1) according to Rather et al.:45| |
 | (1) |
where ODc is the absorbance of the control sample (without treatment) and ODt the absorbance of the treated samples.
2.7. Growth curve assay of ZFO NPs and Ag-decorated ZFO NPs
The effect of ZFO NPs and Ag0.75@ZFO NPs on the growth of S. vitulinus was estimated by growth curve method according to Huang et al.46 A bacterial suspension was fixed to 0.5 McFarland (1 × 10⁸ CFU ml−1) in 5 ml of nutrient broth tubes, then 0.5 ml of ZFO NPs or Ag0.75@ZFO NPs was added individually to each of the tested tubes. The absorbance of the bacterial growth after treatment was assessed every two hours up to 24 h at a wavelength of 600 nm. The mean of duplicate readings was plotted against the time intervals to obtain the standard growth curve.
2.8. Effect of UV on the antimicrobial activity of ZFO NPs and Ag-decorated ZFO NPs
The antimicrobial activity of ZFO NPs and Ag0.75@ZFO NPs without and with UV illumination was assessed against the test pathogenic microbe (S. vitulinus) using the optical density method.47 Bacterial cultures incubated for two hours were adjusted to standard 0.5 McFarland (1 × 10⁸ CFU ml−1). 100 μl of ZFO NPs or Ag0.75@ZFO NPs was added into the tubes. The tubes were grouped into two conditions: tubes with non-illuminated ZFO and Ag0.75@ZnFe2O4 NPs, and tubes with NPs exposed to UV light for 0, 15, 30, 45, 60, and 75 min with an intensity of 6.9 mW cm−2 incident on the samples at 37 °C. The turbidity of the medium was measured at 600 nm. The inhibition percentage of the tested bacterial pathogens was calculated by eqn (1).
2.9. Effect of Ag-decorated ZFO NPs on protein leakage from bacterial cell membranes
Fresh 18 h bacterial culture was fixed at 0.5 McFarland (1 × 10⁸ CFU ml−1) and (100 μl) inoculated in 10 ml of nutrient broth including well-sonicated Ag0.75@ZFO NPs (1.0, 0.5, 0.25 and 0.125 mg ml−1). Ag0.75@ZFO NPs-free broth inoculated with culture was adopted as the control. All the treated solutions were incubated for 5 h at 36 °C and then centrifuged at 5000 rpm for 10 min.48 For each individual sample, 100 μl supernatant was mixed with 1 ml of Bradford reagent. Optical density was estimated at 595 nm following 10 min of incubation (in the dark).48
2.10. Reaction mechanism determination by SEM and EDX-elemental analysis of the bacterial cells
The examined bacterial cells (S. vitulinus) were washed with PBS and fixed with 3.0% glutaraldehyde. Subsequently, the preserved bacterial cells were washed repeatedly with PBS and washed with ethanol for 15.0 min at 25 °C before dehydration. Finally, the bacterial cells were installed and fixed over aluminium stumps for starting the imaging.47 The treated and untreated bacterial cells' morphological and exterior features with the tested Ag0.75@ZFO NPs were examined using SEM imaging. The total elemental analyses of the tested bacterial cells were carried out by EDX.49
2.11. Statistical analysis
The statistical analyses of our results were performed using one-way ANOVA (at P < 0.05) and determined to be Duncan's multiple ranges investigates and the least significant difference summary.50 The results and data were checked and tested by SPSS software version 15.
3. Results and discussion
3.1. Structure of ZFO NPs, and Ag-decorated ZFO NPs
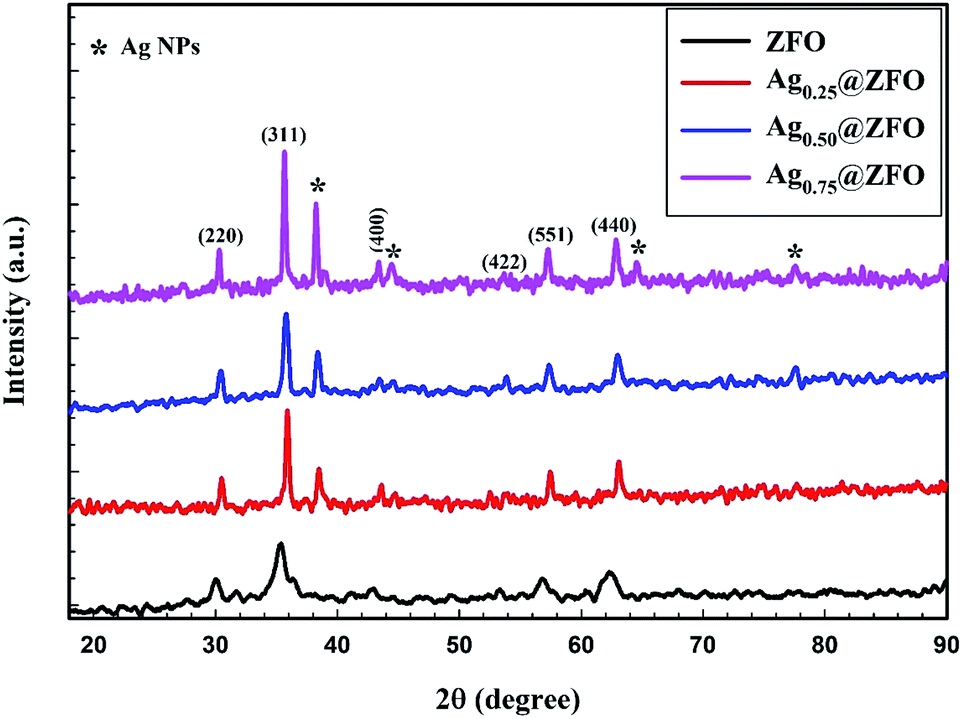
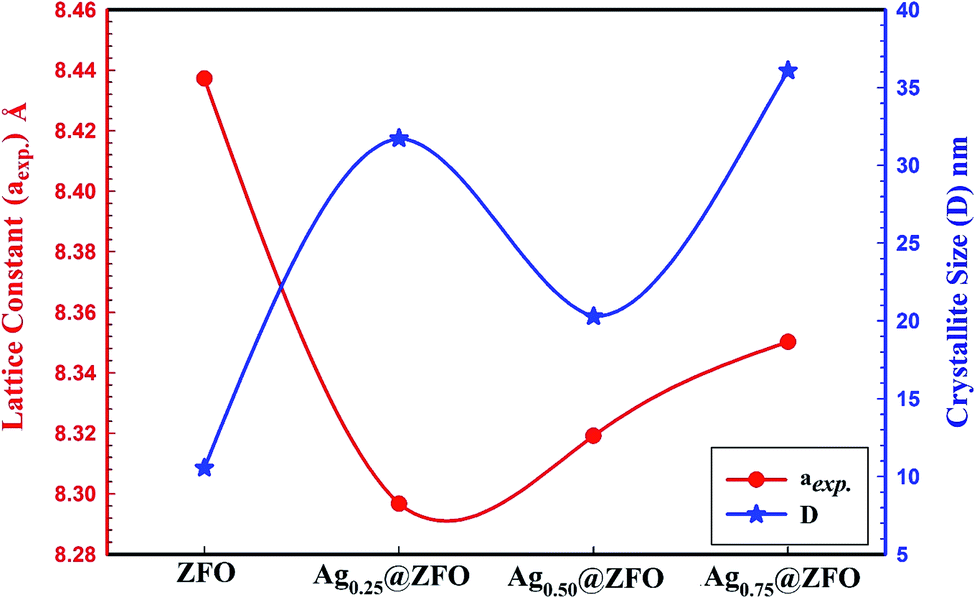
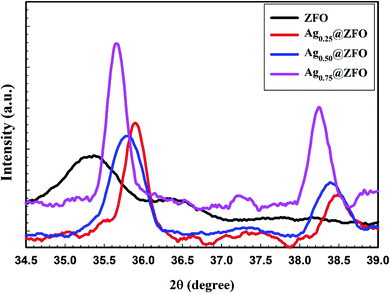
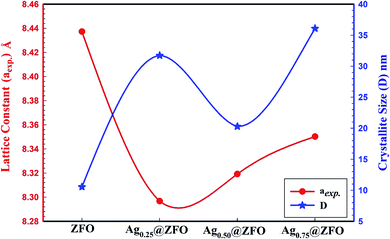
The XRD patterns of pure ZFO NPs, and Ag-decorated ZFO NPs with different Ag NPs ratios are illustrated in Fig. 1. The detected diffraction peaks for the pure ZFO NPs sample belonged to the Fd3m space group (JCPDS card no. 74-2397 and 89-100).13,51–53 Besides, the XRD patterns confirm the presence of Ag in the Ag-decorated ZFO NPs samples. Four characteristic diffraction peaks were seen at 2θ = 38.32°, 44.58°, 64.51°, and 77.64° and were categorized as the cubic phase of Ag (JCPDS no. 04-0783).54,55 Further, the intensity of Ag peaks increases with an increase in Ag coating ratio, as presented in Fig. 2. Additionally, the preferred orientation of the (311) plane at 2θ = 35.4° was shifted to higher 2θ for the Ag0.25@ZFO sample and then moved to the lower value with increasing ratio of Ag ions. This behaviour means that the lattice constant (aexp.) was decreased for the Ag0.25@ZFO NPs sample and increased with an increase in the proportion of Ag ions. The lattice constants of pure ZFO and Ag@ZFO NPs samples ranged from 8.2967 Å to 8.4373 Å, as shown in Table 1. The lattice constant of Ag@ZFO NPs samples was decreased due to the creation of Fe3+, which has a smaller radius (0.64 Å) than Fe2+ ion (0.74 Å). This process can be ascribed to the interaction of γ-radiation with the outer electrons of the iron contents in the spinel ZFO lattice (γ + Fe2+ ↔ Fe3+ + e−). The reduction in cell volume, on a large scale, can have a noticeable impact on the Ag@ZFO NPs crystallite size.56–58
 |
| | Fig. 1 XRD patterns of pure ZFO and Agx@ZFO (x = 0.25, 0.5, and 0.75) samples. | |
 |
| | Fig. 2 XRD patterns of preferred orientation for the (311) plane of pure ZFO and Agx@ZFO NPs (x = 0.25, 0.5, and 0.75) samples. | |
Table 1 The crystallite size, lattice constant, and hopping distance of ions between the A and B sites of pure ZFO NPs and Agx@ZFO NPs (x = 0.25, 0.5, and 0.75) samples
| Ferrite |
Crystallite size (nm) |
Lattice constant (Å) |
MA − MA(Å) |
MB − MB(Å) |
MA − MB(Å) |
| ZFO |
10.5 |
8.4373 |
3.6534 |
2.9830 |
3.4979 |
| Ag0.25@ZFO |
31.7 |
8.2967 |
3.5926 |
2.9333 |
3.4396 |
| Ag0.50@ZFO |
20.3 |
8.3192 |
3.6023 |
2.9413 |
3.4490 |
| Ag0.75@ZFO |
36.1 |
8.3502 |
3.6158 |
2.9523 |
3.4618 |
Further, the crystallite sizes of pure ZFO and Ag-decorated ZFO NPs samples were estimated via the Scherrer equation (see Table 1), and were found to be 10.5, 31.7, 20.3, and 36.1 nm for pure ZFO NPs, Ag0.25@ZFO NPs, Ag0.50@ZFO NPs, and Ag0.75@ZFO NPs, respectively, as presented in Fig. 3.59 Also, the increase in crystallite size after gamma irradiation had been ascribed to an increase the ordered parts of the crystallites (grains) at the expense of disordered grain boundary regions.60
 |
| | Fig. 3 The variation of the lattice constant and crystallite size of pure ZFO and Agx@ZFO NPs (x = 0.25, 0.5, and 0.75) samples. | |
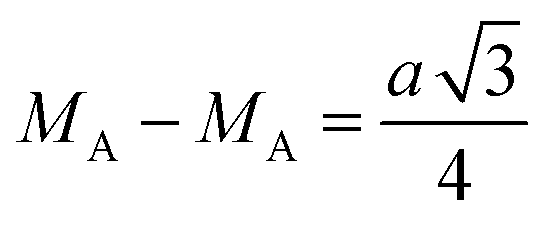
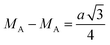
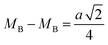
The hopping distance of ions between the A and B sites of pure ZFO NPs and Ag@ZFO NPs samples was determined after applying eqn (2)–(4):61,62
| |
 | (2) |
| |
 | (3) |
| |
 | (4) |
It is evident from Table 1 that the hopping distance of pure ZFO NPs and Ag@ZFO NPs samples slightly decreased for Ag0.25@ZFO NPs and then increased with Ag ratio, which was well matched with the behaviour of the lattice constant.61–63 Also, Gingasu et al.64 reported the green synthesis of Ag@CoFe2O4 (Ag@CFO) NPs. They observed that XRD patterns of Ag@CFO showed the formation of CFO and Ag NPs. Further, they studied the effect of annealing temperature on crystallinity. Besides, they found that the (aexp.) values varied between 8.364 Å and 8.378 Å. Also, the crystallite size decreased from 15.8 nm to 14.8 nm. Kooti et al.65 synthesized Ag@CFO NPs via the combustion technique. The XRD patterns confirmed the deposition of Ag NPs on the surface of CFO NPs. Interestingly, the intensity of diffraction peaks for pristine CFO NPs is higher than those for Ag@CFO NPs, which is ascribed to the Ag NPs coating on the CFO surface.
3.2. Characterization of ZFO NPs and Ag-decorated ZFO NPs
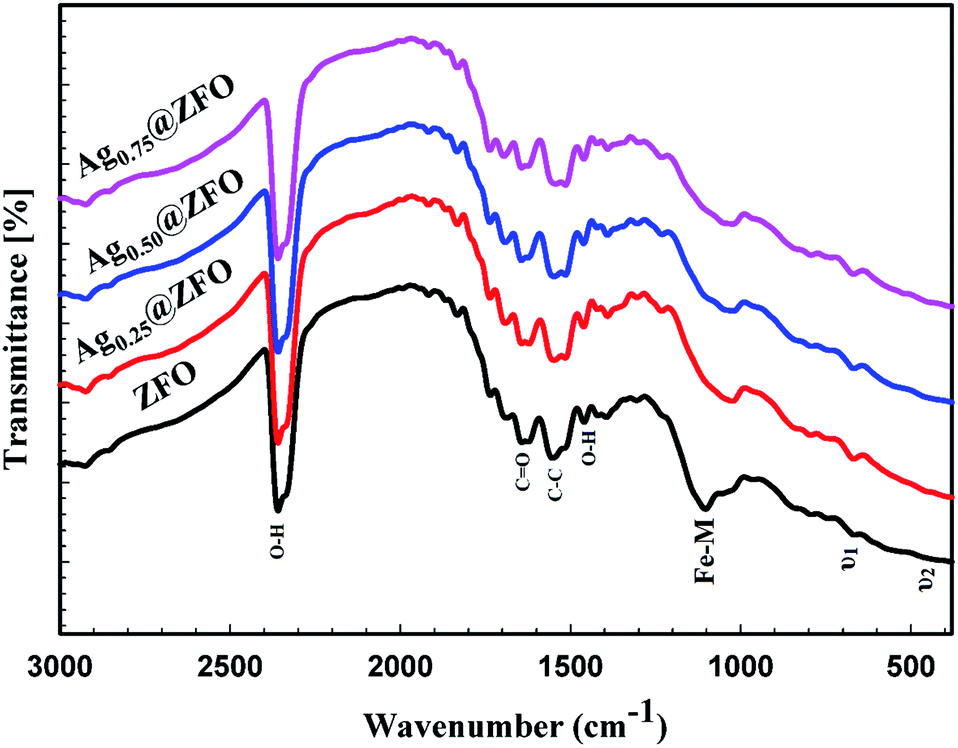
The FTIR spectra of pure ZFO NPs and Ag@ZFO NPs samples are given in Fig. 4. The spectrum of ZFO NPs has two characteristic vibrational bands (υ1 and υ2) resulting from the stretching vibration of tetrahedral groups (A-site) and octahedral groups (B-site), respectively.66–68 The peaks around 1105 cm−1 are attributed to the Fe–M ferrite system. Also, the observed bands at ∼2366 cm−1 and 1455 cm−1 were ascribed to H–O–H stretching, interpreted as the presence of free (or absorbed) water.69 Further, the bands detected at 1553 cm−1 correspond to C–H stretching while the peak around 1645 cm−1 corresponds to C![[double bond, length as m-dash]](https://www.rsc.org/images/entities/char_e001.gif) O stretching vibrations.70,71 The intensity of the absorption bands was reduced after coating the ZFO NPs with Ag NPs. Also, the increase in crystallite size after gamma irradiation led to migration of Zn2+ from A-site to B-site and an equal transfer of Fe3+ from B-site to A-site.60 This action leads to the appearance of a shift in the position of the absorption bands, as illustrated in Fig. 4.
O stretching vibrations.70,71 The intensity of the absorption bands was reduced after coating the ZFO NPs with Ag NPs. Also, the increase in crystallite size after gamma irradiation led to migration of Zn2+ from A-site to B-site and an equal transfer of Fe3+ from B-site to A-site.60 This action leads to the appearance of a shift in the position of the absorption bands, as illustrated in Fig. 4.
 |
| | Fig. 4 FTIR spectra of pure ZFO and Agx@ZFO NPs (x = 0.25, 0.5, and 0.75) samples. | |
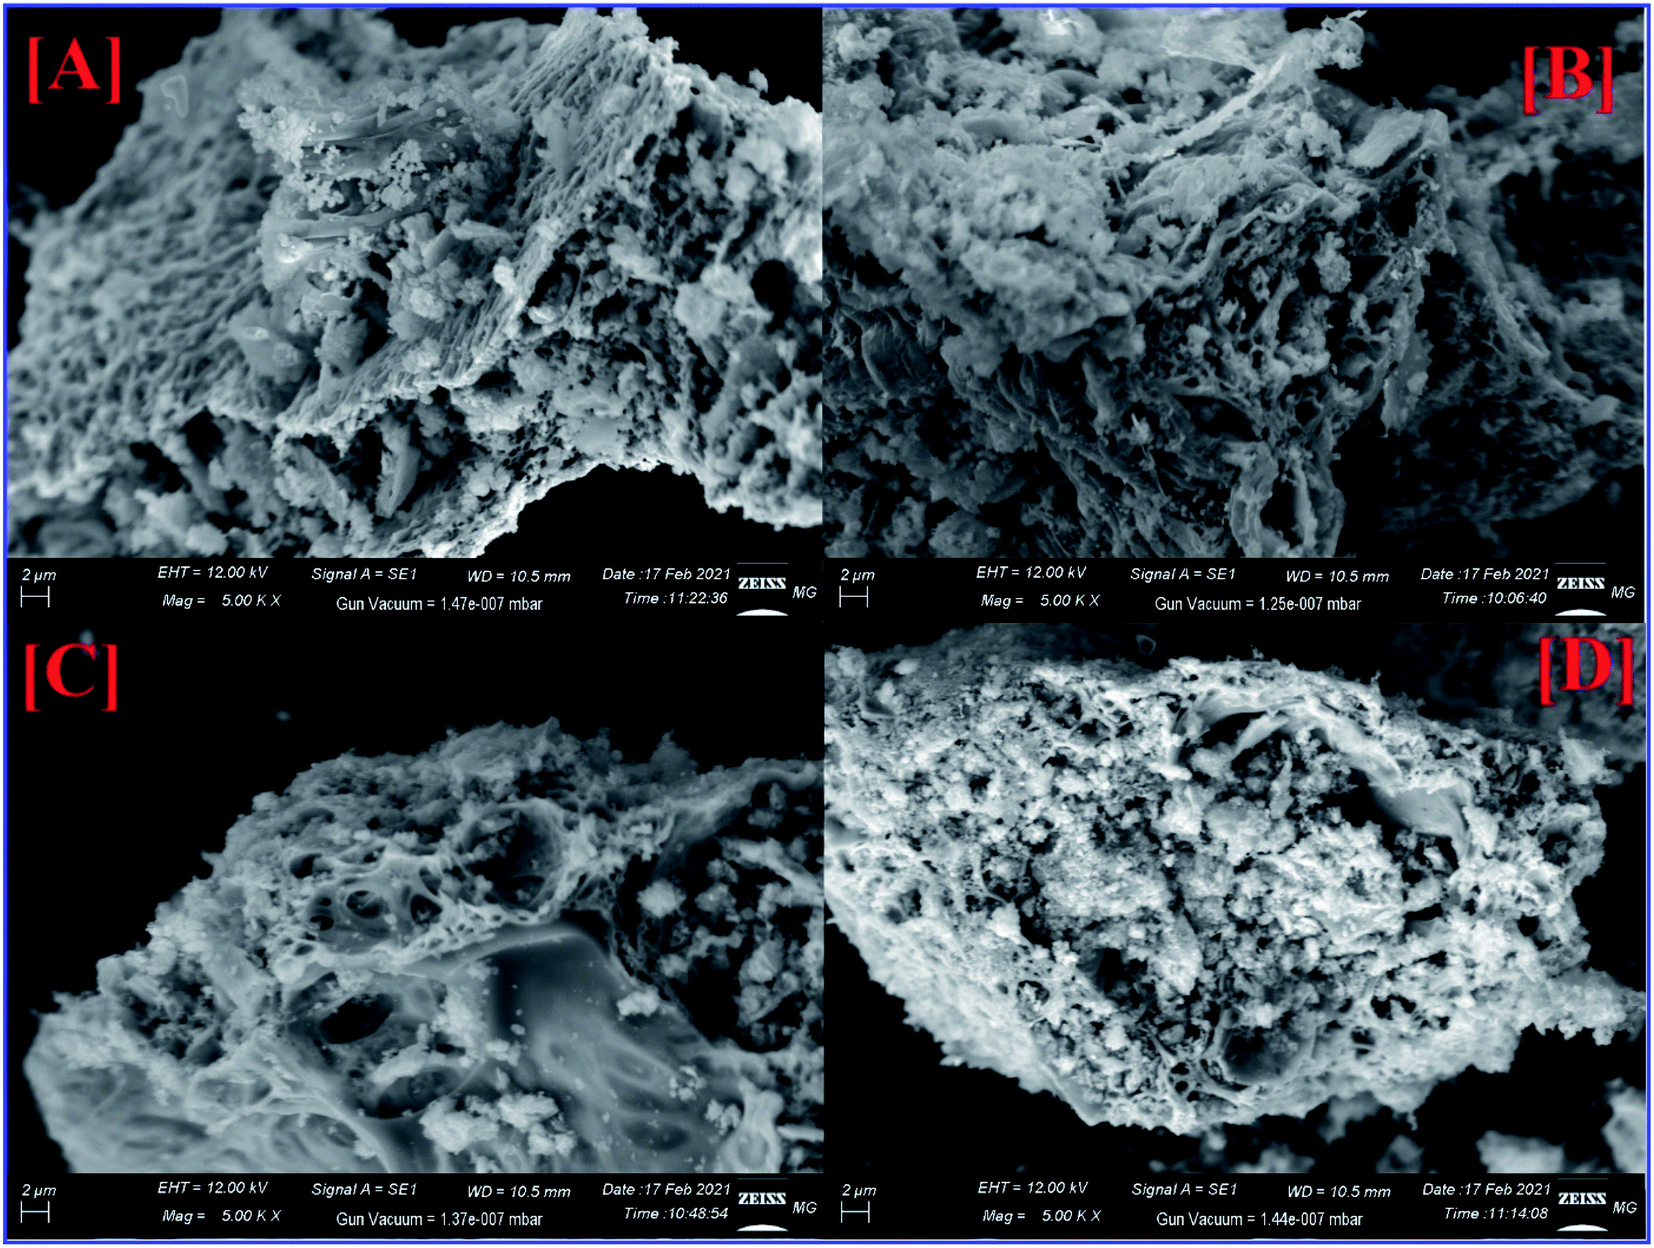
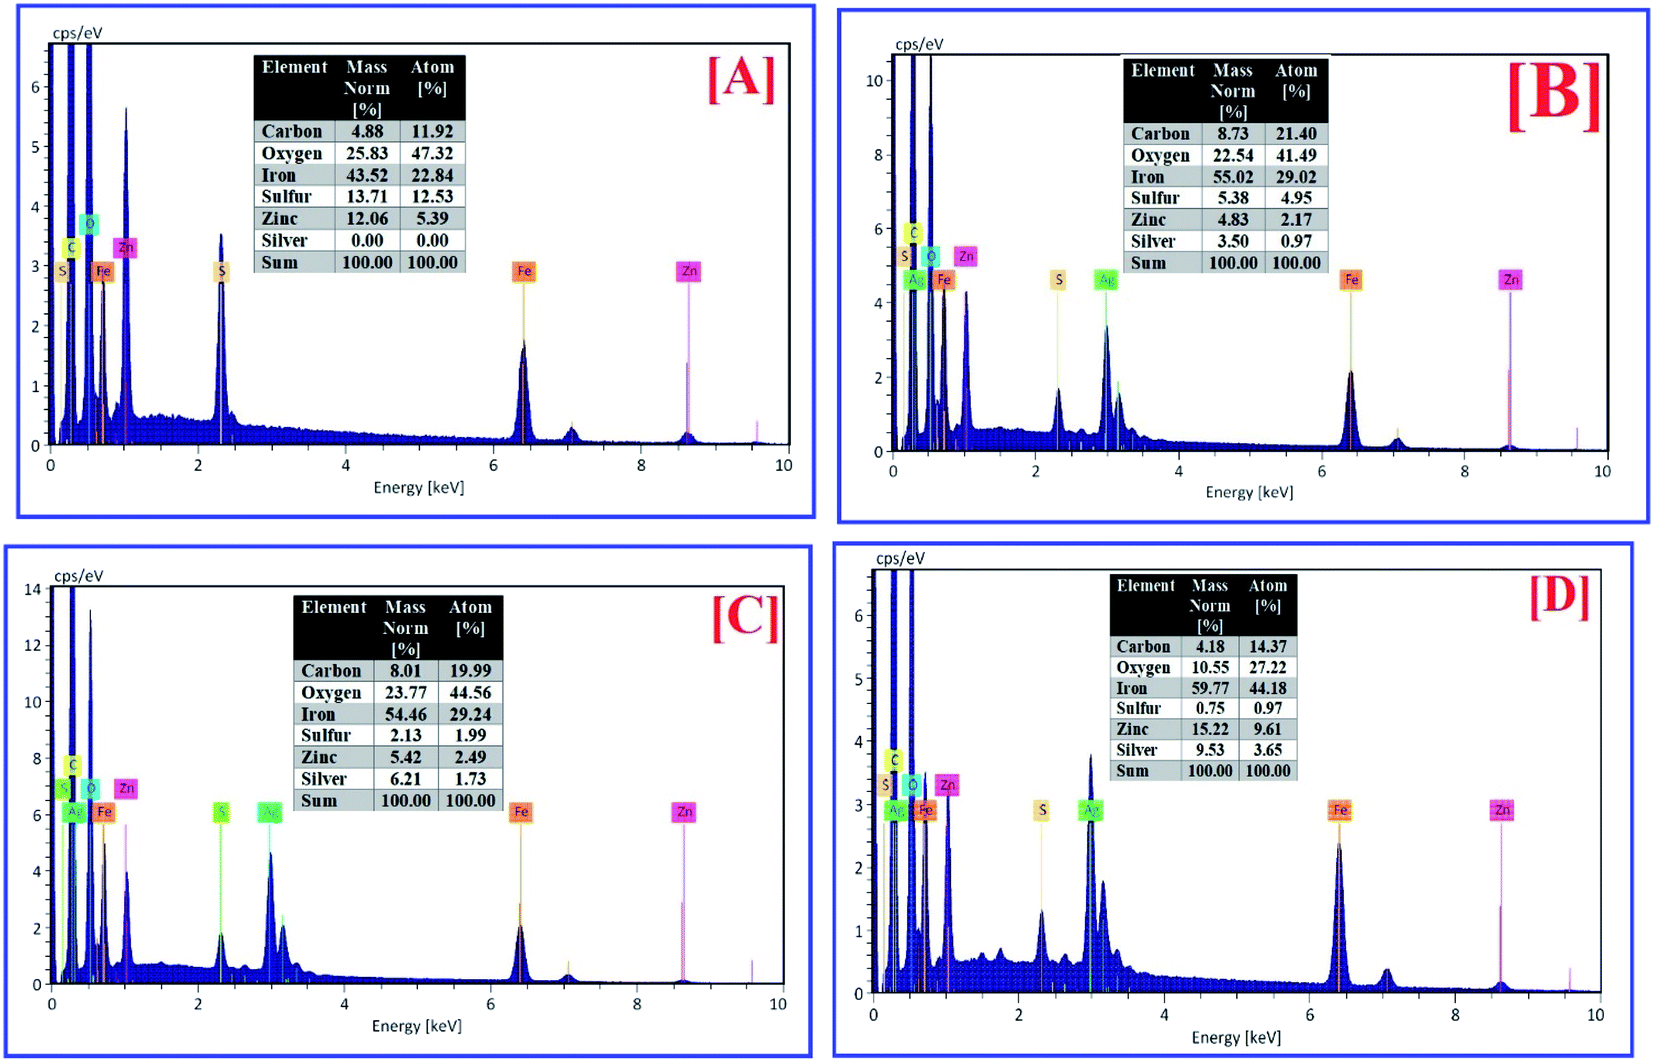
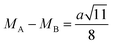
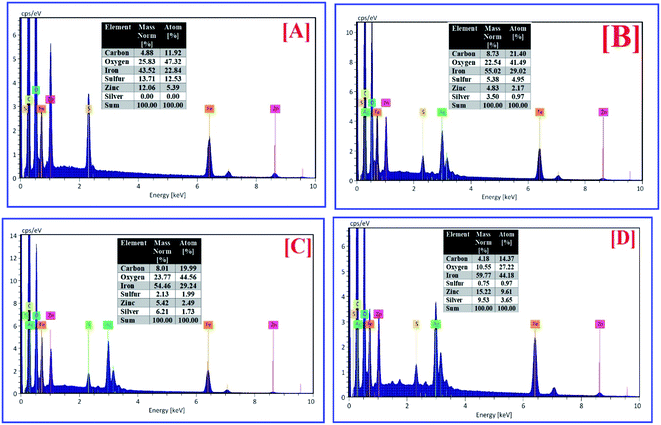
SEM, EDX, and elemental mapping were considered as holding a good outlook for characterizing the surface morphology and purity of pure ZFO NPs and Ag@ZFO NPs samples. Fig. 5 shows the surface morphology of pure ZFO NPs and Ag@ZFO NPs, which had porous formations. The pores showed honeycomb appearances with uniform particle distribution in size and shape.20,72 The elemental composition of pure ZFO NPs was analyzed by EDX (Fig. 6), where C, Zn, O, S and Fe were confirmed. Likewise, the Ag+-coated ZFO samples were analyzed, where Ag, C, Zn, O, S, and Fe were established. Besides, as the Ag content increased, Ag peaks became more intense, as illustrated in Fig. 6(B)–(D). The appearance of sulfur ions (S) was ascribed to the residuals of sulfate groups used in the fabrication approach. The remarkable carbon proportions that are seen in EDX spectra arise from ethylene glycol and citric acid.73–75 Further, Fig. 7 exhibits the elemental mapping images of Ag0.75@ZFO NPs. This figure proved that the C, Fe, S, O, Zn, and Ag elements were uniformly distributed through the Ag0.75@ZFO NPs without any foreign elements, which confirmed the purity of the Ag@ZFO NPs.75
 |
| | Fig. 5 SEM images of [A] pure ZFO, [B] Ag0.25@ZFO, [C] Ag0.50@ZFO, [D] Ag0.75@ZFO NPs. | |
 |
| | Fig. 6 EDX spectra of [A] pure ZFO NPs, [B] Ag0.25@ZFO NPs, [C] Ag0.50@ZFO NPs, [D] Ag0.75@ZFO NPs. | |
 |
| | Fig. 7 Elemental mapping images of Ag0.75@ZFO NPs. | |
3.3. Antibacterial activity of ZFO NPs and Ag-decorated ZFO NPs
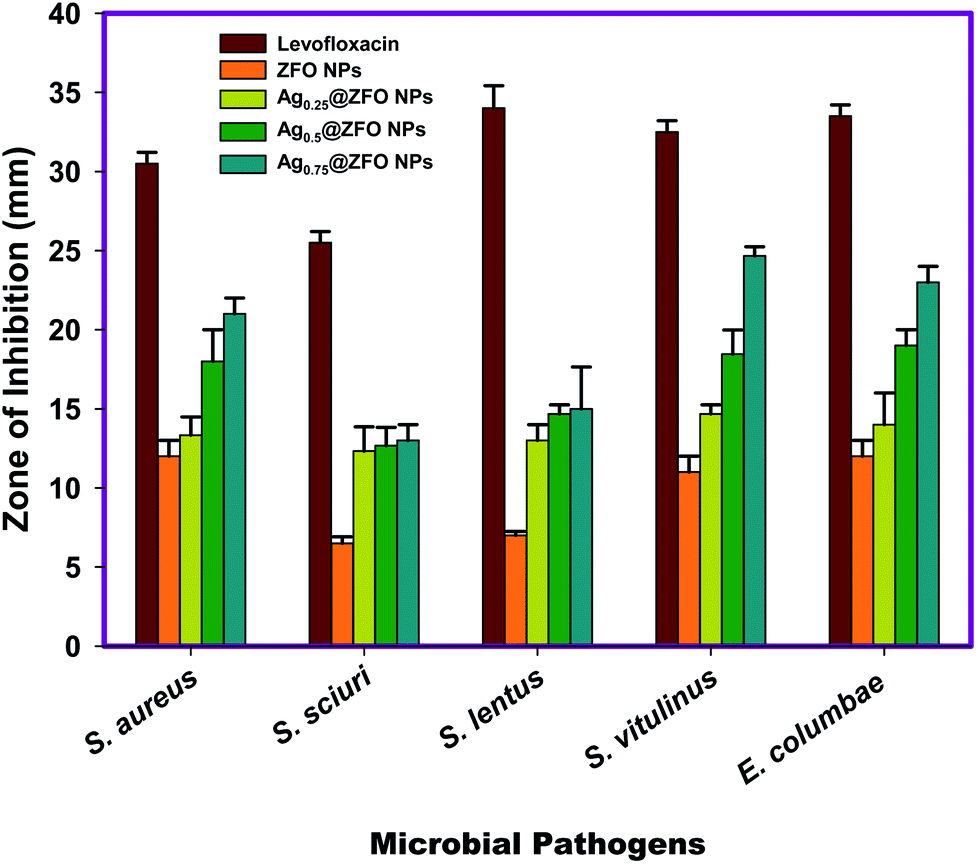
3.3.1. Well diffusion assay. The well diffusion test was carried out to assess the antibacterial action of ZFO NPs and Ag@ZFO NPs, where levofloxacin was used as a positive control, against S. aureus, S. sciuri, S. lentus, S. vitulinus, and E. columbae, as shown in Table 2 and Fig. 8. The results showed that both ZFO NPs and Ag@ZFO NPs with different weight ratios of AgNO3 (0, 0.25, 0.50, and 0.75) exhibit antibacterial activity against the tested pathogenic bacteria. Also, the antibacterial activity increases with the treatments containing Ag, with the inhibition effect becoming greater on increasing the concentration of Ag. Therefore, Ag0.75@ZFO NPs recorded the most significant zone of inhibition against the bacteria strains, with S. vitulinus being most affected by Ag0.75@ZFO NPs treatment (24.67 ± 0.577 mm).
Table 2 The antimicrobial activity (as ZOI) of pure ZFO NPs and Agx@ZFO NPs (x = 0.25, 0.5, and 0.75)a
| Microbial strain |
Zone of inhibition (mm) |
| Levofloxacin |
ZFO NPs |
Ag0.25@ZFO NPs |
Ag0.5@ZFO NPs |
Ag0.75@ZFO NPs |
| Values are means ± SD (n = 3). Data within the groups are analyzed using a one-way analysis of variance (ANOVA) followed by a, b, c, d, e, f. Duncan's multiple range test (DMRT), LSD = least significant differences. Levofloxacin: standard antibacterial agent as positive control. |
| Staphylococcus aureus |
30.54 ± 0.707b |
12.03 ± 0.571c |
13.33 ± 1.154d |
18.83 ± 2.001d |
21.93 ± 1.077c |
| Staphylococcus sciuri |
25.63 ± 0.707a |
6.53 ± 0.152a |
12.38 ± 1.527a |
12.67 ± 1.154a |
13.00 ± 0.524a |
| Staphylococcus lentus |
34.00 ± 1.411d |
7.03 ± 0.500b |
13.00 ± 0.577f |
14.67 ± 0.577g |
15.03 ± 2.640g |
| Staphylococcus vitulinus |
32.51 ± 0.572c |
11.33 ± 1.057d |
14.67 ± 0.577d |
18.45 ± 1.527e |
24.67 ± 0.577b |
| Enterococcus columbae |
33.67 ± 1.251c |
12.00 ± 1.230e |
14.00 ± 0.115e |
19.16 ± 1.000f |
23.57 ± 0.115f |
| LSD |
1.25 |
1.67 |
0.87 |
2.06 |
2.34 |
 |
| | Fig. 8 Antibacterial activity of pure ZFO NPs, Ag0.25@ZFO NPs, Ag0.50@ZFO NPs, and Ag0.75@ZFO NPs against S. aureus, S. sciuri, S. lentus, S. vitulinus, and E. columbae. | |
3.3.2. Analysis of MIC of ZFO NPs and Ag-decorated ZFO NPs. The MIC analyses of pure ZFO NPs and Ag@ZFO NPs were conducted. This experiment was conducted on ZFO NPs, and Ag@ZFO NPs at different concentrations of Ag as μg ml−1 using a well diffusion technique, and the results are reported in Table 3. MIC values are diversely proportional to the strength of the antibacterial treatment. The lowest MIC of ZFO NPs was 25.0 μg ml−1 against S. sciuri. In agreement with the well diffusion assay results, Ag@ZFO NPs were a more efficient antimicrobial agent than ZFO NPs. The MIC values for the three tested Ag concentrations were less than those for ZFO NPs. At the same time, Ag0.75@ZFO NPs recorded the lowest MIC. For Ag0.75@ZFO NPs, the MIC was less against S. vitulinus (0.097 μg ml−1). Ag0.75@ZFO NPs have dual behaviour, acting as bacteriostatic at lower concentration and, on the other hand, behaving as bactericidal at higher concentration. The complete inhibition of bacteria occurred by raising the concentration of Ag0.75@ZFO NPs.
Table 3 The MIC of ZFO NPs and Agx@ZFO NPs (x = 0.25, 0.5, and 0.75)
| Microbial strain |
Minimum inhibitory concentration (MIC); μg ml−1 |
| Pure ZFO NPs |
Ag0.25@ZFO NPs |
Ag0.5@ZFO NPs |
Ag0.75@ZFO NPs |
| Staphylococcus aureus |
12.5 |
1.560 |
0.390 |
0.195 |
| Staphylococcus sciuri |
25.0 |
1.560 |
0.781 |
0.390 |
| Staphylococcus lentus |
6.25 |
1.560 |
0.781 |
0.195 |
| Staphylococcus vitulinus |
6.25 |
0.781 |
0.195 |
0.097 |
| Enterococcus columbae |
6.25 |
0.390 |
0.195 |
0.195 |
3.4. Biofilm formation and antibiofilm activity of ZFO NPs and Ag-decorated ZFO NPs
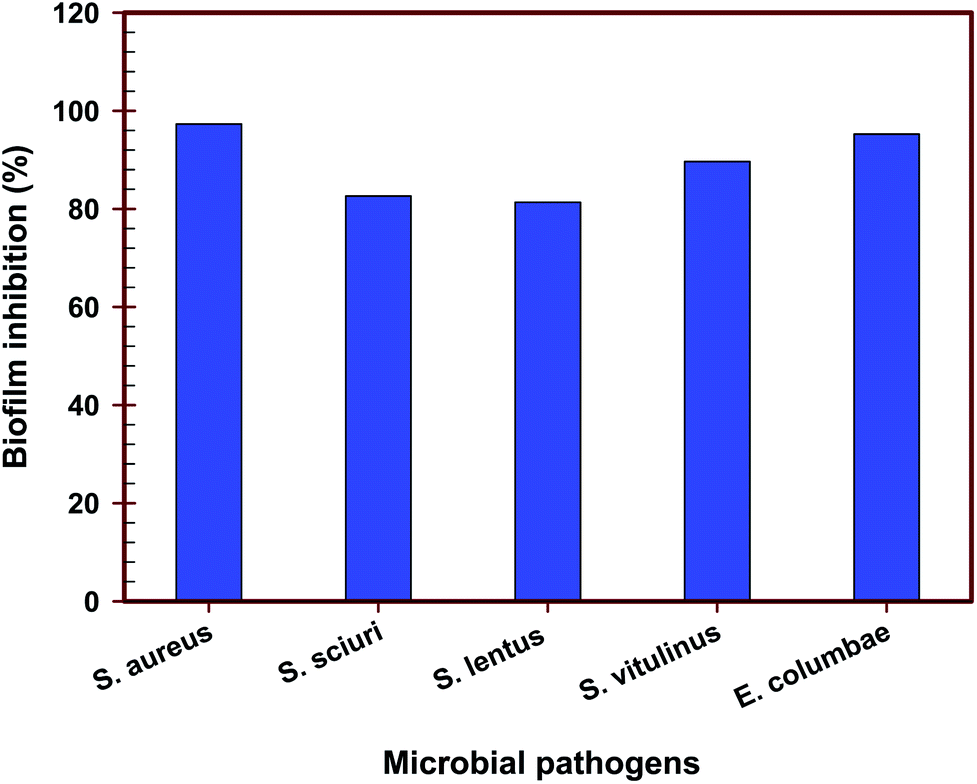
ZFO NPs and Ag0.75@ZFO NPs were evaluated for their ability to inhibit biofilm formation of the tested bacterial strains. 0.5 ml of pure ZFO NPs or Ag0.75@ZFO NPs was incorporated into test tubes containing 5.0 ml of nutrient broth inoculated with 10 μl of 0.5 McFarland (1 × 10⁸ CFU ml−1) of the examined bacteria. At the same time, the equivalent volume of water was added to the control tubes. It is clearly shown in Fig. 9 that Ag0.75@ZFO NPs were more efficient in inhibiting the biofilms of all the tested bacteria compared with pure ZFO NPs. The antibiofilm activity of Ag0.75@ZFO NPs was the highest, registering at 97.3% for S. aureus and 95.25% for E. columbae. Since the antimicrobial strength of NPs dramatically depends on the particle size, the smaller dimensions of Ag0.75@ZFO NPs provide potent antibiofilm activity. It has been recognized that biofilms are a common infection cause, and about 80% of bacterial infections in the world are connected with biofilms.76 Several mechanisms describe how the biofilm is manufactured on a surface, related to genes responsible for the adhesion program and the generation of extracellular polymeric substance. Environmental requirements may also influence biofilm development.77 The environmental requirements and expression of particular genes produced by adhesion may theoretically control biofilms' metabolic action.78 The low cellular metabolism protects the antimicrobial factors that progress through bacterial growth.79
 |
| | Fig. 9 Antibiofilm efficiency of pure ZFO NPs and Ag0.75@ZFO NPs against S. aureus, S. sciuri, S. lentus, S. vitulinus, and E. columbae. | |
3.5. Growth curve assay of ZFO NPs and Ag-decorated ZFO NPs
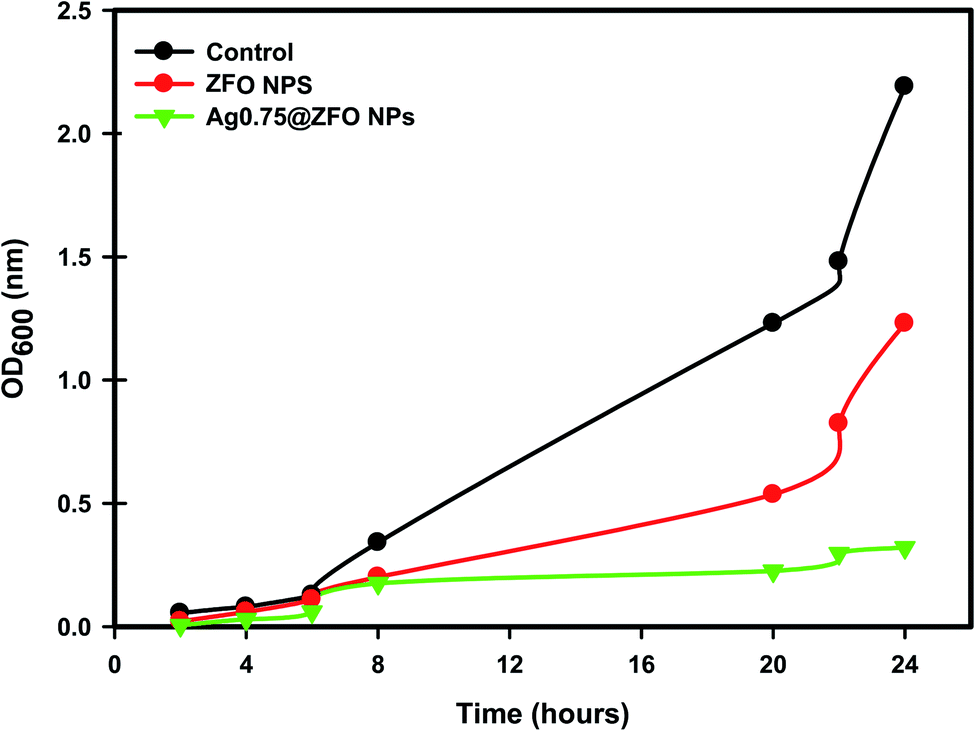
The effect of pure ZFO NPs and Ag0.75@ZFO NPs on the growth of S. vitulinus is shown in Fig. 10. The growth of S. vitulinus in the control sample occurred rapidly, with the highest optical density values at λ = 600 nm (OD600) reaching about 2.21 nm. In contrast, the OD600 values of the ZFO NPs and Ag0.75@ZFO NPs were lower, indicating the inhibition effect on the growth of S. vitulinus. Ag0.75@ZFO NPs exert an additional suppressing influence compared with pure ZFO NPs that may be explained by the high antibacterial activity of Ag, as reported previously by several researchers.80–82
 |
| | Fig. 10 The effect of pure ZFO NPs and Ag0.75@ZFO NPs on the growth curve of S. vitulinus. | |
On the surface of the NPs, the photogeneration of reactive oxygen species (ROS) has been reported in previous research.80,81 The ZFO NPs-generated ROS cause protein oxidation, DNA damage, and lipid peroxidation that can kill bacteria without affecting the non-bacterial cells.82 Also, the bacterial cell membrane has a negative charge, while the metal ions released from ZFO NPs (Zn2+ and Fe3+) have a positive charge. So, they get in direct connection leading to damage to DNA replication, denaturation of proteins, and death of bacteria.83
The higher sensitivity of the Gram-positive bacteria to the NPs may be described as a result of the lower stiffness of the cell membrane.84 An additional potential reason can be the size, shape, and surface charge of the ZFO NPs, which could be more favorable for contact with Gram-positive bacteria. Previously, NPs like oleoyl-chitosan NPs have been recorded as changing the membrane permeability, damaging the S. aureus cell membrane.85 Fei et al.86 also found that Ag NPs clusters crinkled and pierced the bacterial membrane, producing a significant leakage of cytoplasmic constituents and ultimately inducing bacterial death. The Gram-positive bacteria have essentially too thick peptidoglycans with a cell wall of ∼80 nm, which functions as a barrier protecting molecules such as proteins from quickly leaking out following the disruption of the cell membrane.87 Xu et al.88 showed that ZFO NPs, after irradiation for 80 min, ruptured the cell membrane of Escherichia coli, meaning that disinfection was completed. The ZFO NPs exhibited antibacterial activity against various bacterial strains, S. aureus, Pseudomonas aeruginosa, E. coli and Bacillus subtilis.89
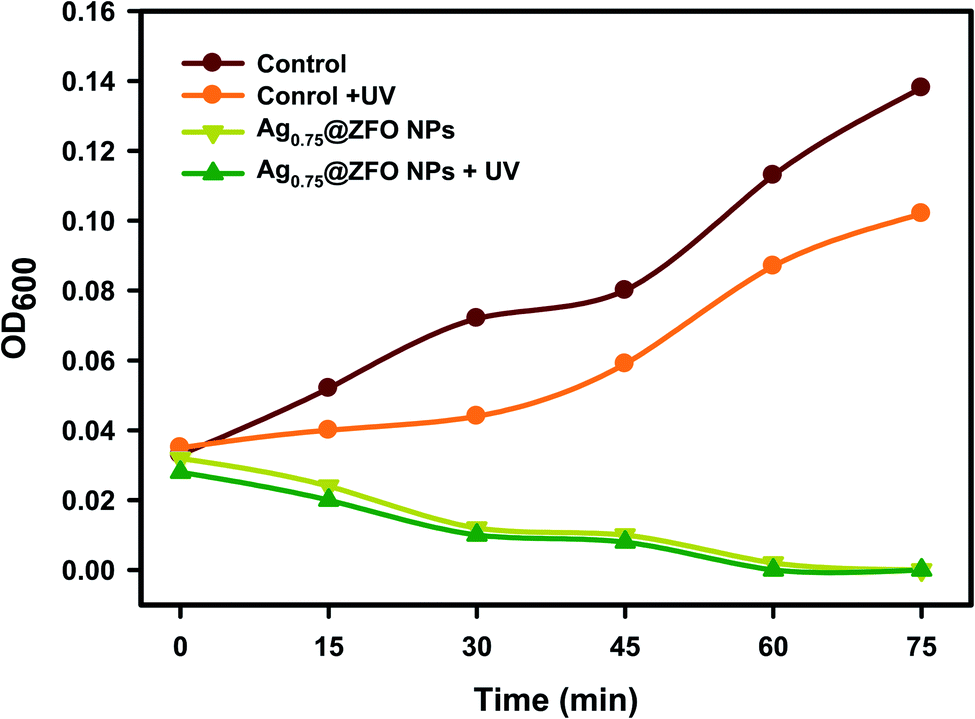
3.6. Effect of UV on the antimicrobial activity of ZFO NPs and Ag-decorated ZFO NPs
The results presented in Fig. 11 show that S. vitulinus is more sensitive to UV light, increasing its sensitivity when the time of exposure was prolonged. The exposure period of 0 to 75 min with 15 min time intervals has an impact on the growth of S. vitulinus. The growth of S. vitulinus was successfully affected by the treatment of Ag0.75@ZFO NPs compared with the untreated control. With UV exposure, the bacterial growth reached the lowest grade due to the activation by UV illumination. Because of that, 6 min of UV exposure was selected to maximize the potential for photoactivation of Ag0.75@ZFO NPs.
 |
| | Fig. 11 The effect of UV on the antibacterial activity of pure ZFO NPs and Ag0.75@ZFO NPs against S. vitulinus. | |
Also, it is essential to show that UV light did not impact the turbidity of the culture broths used in the research (i.e. NB and MRS). As presented in Fig. 11, UV exposure showed no difference in the collected OD600 values for NB and MRS broths. A study of the impact of UV light on the various microorganisms applied in this research was conducted in the second case to distinguish whether the exposure time of UV light on the bacteria affected their growth. Ag0.75@ZFO NPs are a potent disinfectant once stimulated by UV light. In water and air conditions, NPs absorb photons, ending in the development of active hydroxyl (.OH) and additional ROS (O2−, H2O2, with others) and in the appearance of O2 and H2O.90 The ROS generated, especially H2O2, can cross cell membranes and create active oxidative hydroxyl species in a reaction inside bacterial cells that eventually leads to disinfection.80,81
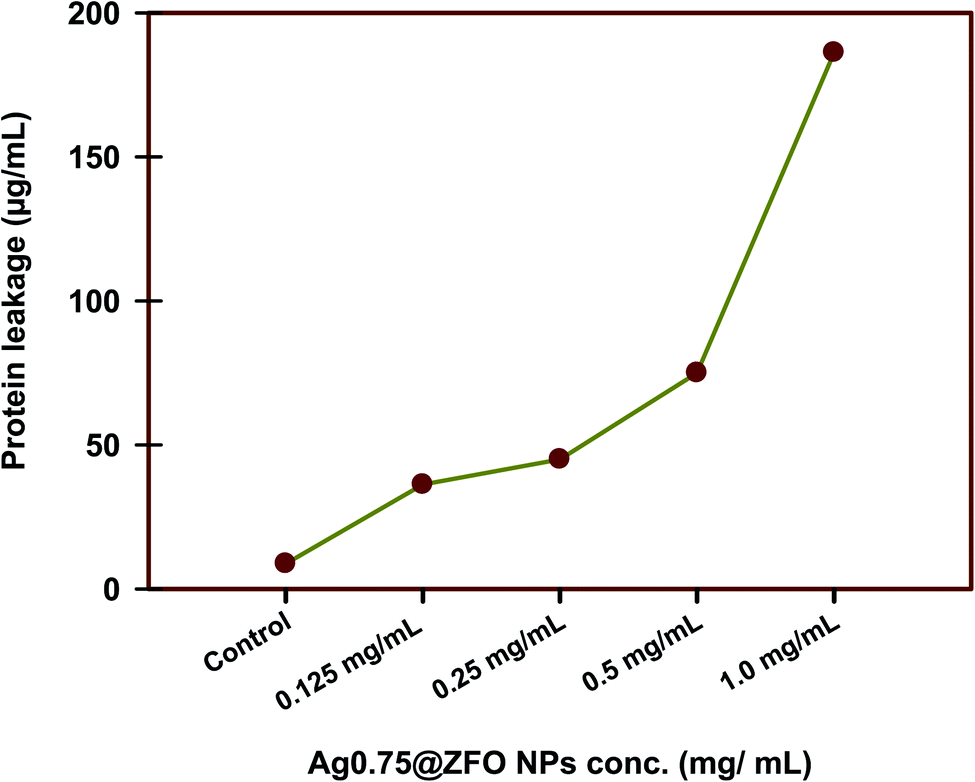
3.7. Determination of protein leakage from bacterial cell membranes
The amounts of protein released in a suspension of the treated bacterial cells were estimated using the Bradford assay.91 From Fig. 12, it is seen that the amount of cellular protein released from bacterial cells (S. vitulinus) is directly proportional to the concentration of Ag0.75@ZFO NPs and reached 186.25 μg ml−1 after treatment with 1.0 mg ml−1 of the tested Ag0.75@ZFO NPs, which confirms the antibacterial nature of the synthesized NPs, which clearly leads to the formation of pits in the cell membrane of bacterial cells resulting in the leakage of the proteins from the cytoplasm of the bacterial cell. These experimental results showed that Ag0.75@ZFO NPs enhanced the permeability of S. vitulinus cell membranes. So it could be inferred that disruption of membranous permeability would be an essential factor for the inhibition of bacterial growth. Related research92,93 reported similar results with synthesized metal NPs showing concentration-dependent destabilization in the cell membrane of bacterial cells and leading to leakage of their intracellular material into the extracellular matrix (cell suspension).
 |
| | Fig. 12 The effect of Ag0.75@ZFO NPs on the protein leakage from S. vitulinus cell membranes. | |
Recently, Paul et al.94 confirmed that the change in bacterial cell membrane permeability was expressed in terms of percentage change in relative electric conductivity. It was revealed that the relative electric conductivities of all samples increase with an increase in the concentration of the nanocomposite. The integrity of the bacterial cell membrane was determined by measurement of the release of cell constituents of the bacteria like proteins; the leakage increased with time as there was irreversible cell membrane damage that led to the leakage of cell constituents leading to cell death.94
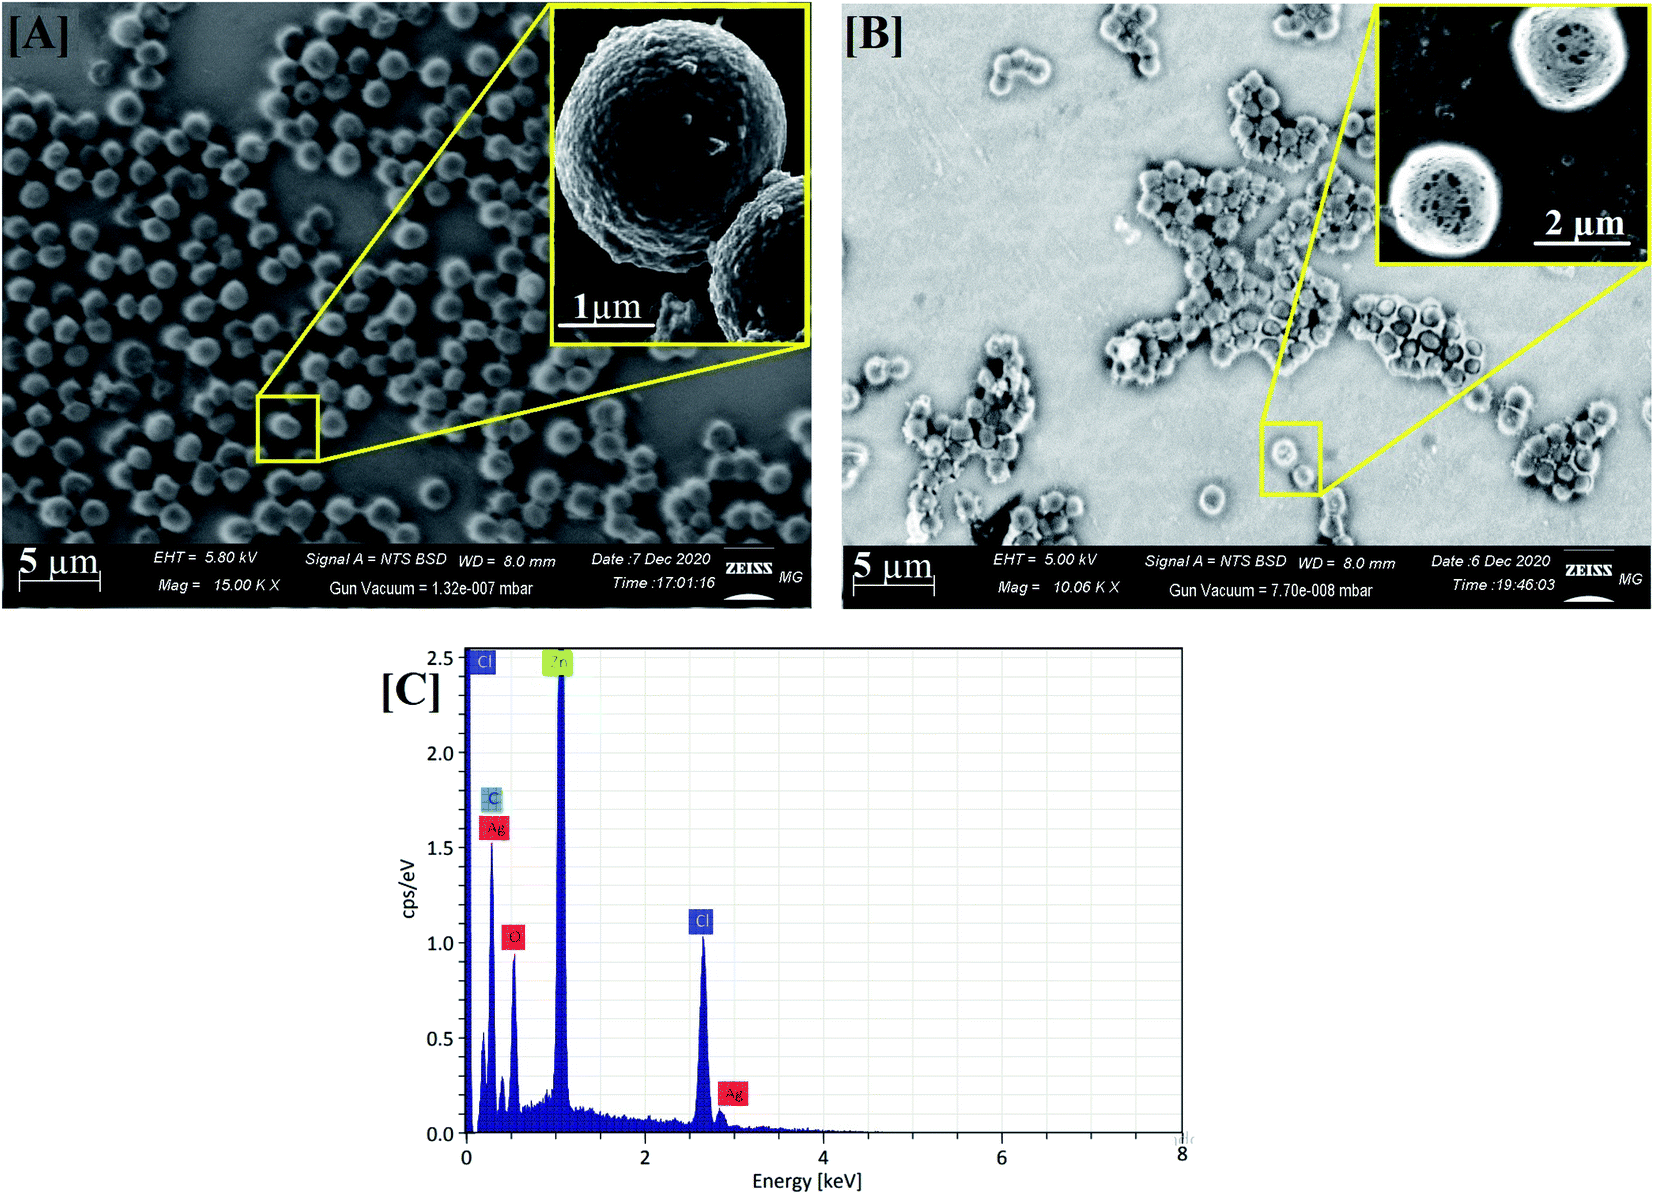
3.8. Reaction mechanism determination by SEM/EDX analysis
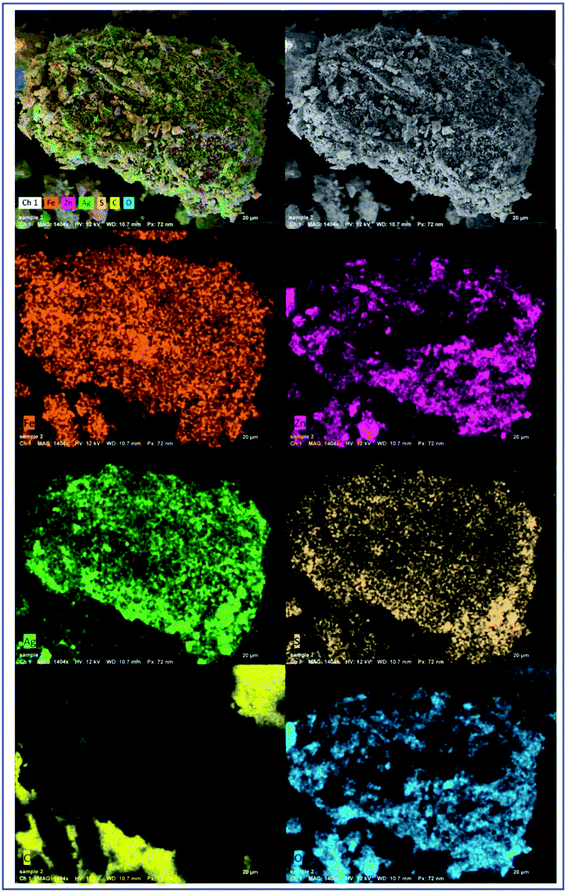
SEM/EDX analysis was conducted to explain the potential antimicrobial mechanism against S. vitulinus, as seen in Fig. 13. The SEM study of the control, namely S. vitulinus in the absence of Ag-decorated ZFO NPs, exhibited bacterial groups that had continually grown with standard typical bacterial exterior and semi-formed biofilm (Fig. 13A). After Ag0.75@ZFO NPs treatment, remarkable morphological variations were distinguished in S. vitulinus (Fig. 13B), including the total lysis of the outer surface attended by deformations of the S. vitulinus cells with the reduction in the whole viable number. Finally, the biofilm growth was limited, which is in accord with the membrane leakage assay (Fig. 12). The EDX elemental study explains Ag, C, O and Zn elements (for Ag0.75@ZFO NPs) with bacterial elements like C and O, along with Cl from the microelement bacterial medium. All detected aspects were found at the abnormal pores and the outer surface of the S. vitulinus cells, confirming the established Ag0.75@ZFO NPs' completion (Fig. 13C).
 |
| | Fig. 13 Reaction mechanism determination of the synthesized Ag0.75@ZFO NPs using SEM/EDX analysis. [A] Control, untreated S. vitulinus. [B] Treated S. vitulinus. [C] The corresponding elemental analysis of the treated S. vitulinus cells. | |
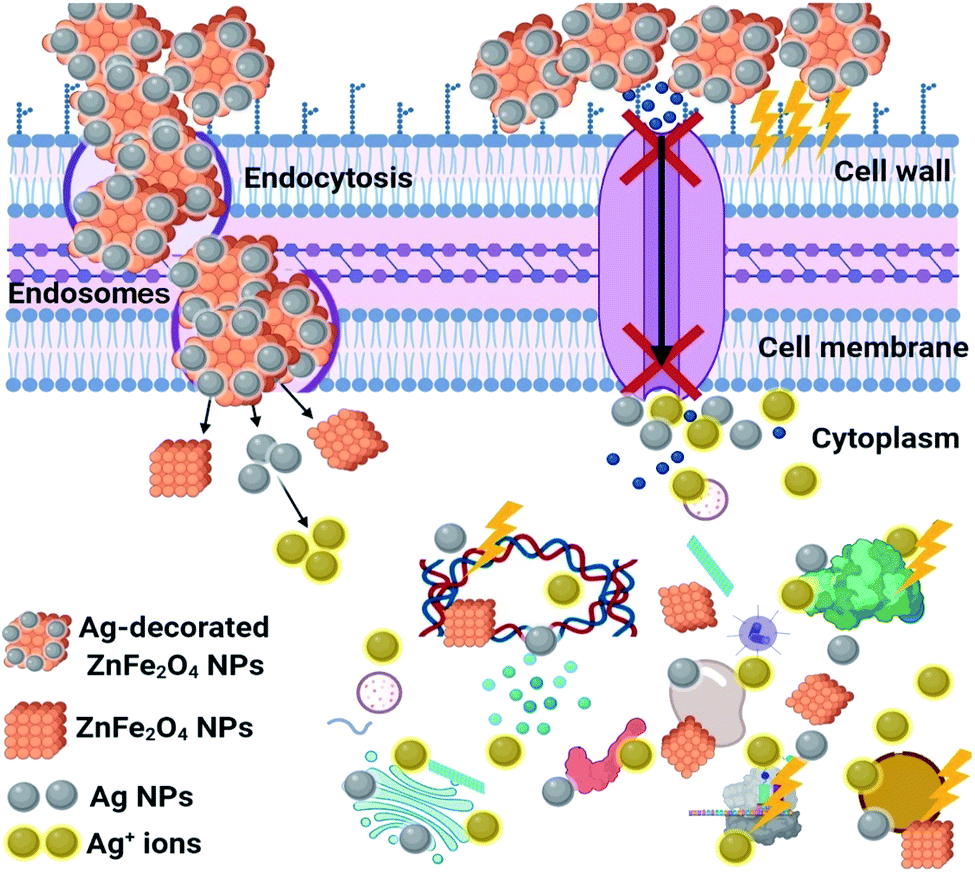
The schematic representation in Fig. 14 shows the potential antibacterial mechanism. It can be seen that Ag0.75@ZFO NPs begin their performance by adhesion at the exterior surface of the bacterial cell, causing membrane destruction and changing transport movement. Then occurs the distribution of Ag+ inside the bacterial cell (at pH = 3) and distributing all intracellular compositions like plasmid, DNA, and other essential organelles. Ultimately, cellular toxicity happens due to the oxidative stress caused by the generation of ROS. Finally, ZFO NPs withstand the bacterial cells' acidic state, and exchange did not occur,47 but the antibacterial impact is maintained by changing the signal transduction pathways.
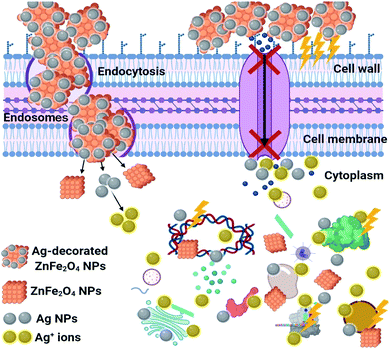 |
| | Fig. 14 Schematic representation regarding the four prominent stages of antibacterial potential of Ag0.75@ZFO NPs, where (1) Ag0.75@ZFO NPs adhere to the bacterial cell surface resulting in membrane damage and altered transport activity; (2) Ag0.75@ZFO NPs block ion transport from and to the bacterial cell; (3) Ag0.75@ZFO NPs create and increase ROS leading to bacterial cell wall damage; and (4) Ag0.75@ZFO NPs penetrate inside the bacterial cells and interact with cellular organelles and biomolecules, thereby affecting cellular machinery, and modulate the cellular signaling system and causing cell death. Ag0.75@ZFO NPs may serve as a vehicle to effectively deliver Ag+ ions to the bacterial cytoplasm and membrane, where proton motive force would decrease the pH to be less than 3.0 and therefore improve the release of Ag+ ions. | |
Results of related comparative studies95–100 are presented in Table 4 to compare our results with the literature and confirm the encouraging antibacterial activity of the synthesized Ag-decorated ZFO NPs.
Table 4 Comparison of related studies regarding antimicrobial potential of different synthesized ferrites
| Synthetic method |
Mean particle size and/or crystal size |
Antimicrobial activity |
Mode of action |
Reference |
| Irradiation-coupled sol–gel method |
10.5 nm to 36.1 nm |
Ag0.75@ZFO NPs recorded the most significant inhibition zone against Staphylococcus vitulinus (24.67 ± 0.577 mm) and low MIC (0.097 μg ml−1) against S. vitulinus |
Ag0.75@ZFO NPs start their action by adhesion at the outer surface of the bacterial cell, causing membrane damage and altered transport activity. Then, diffusion of Ag+ inside the bacterial cell (at pH = 3) and dividing all of the intracellular structure like mitochondria, plasmid, DNA, and other vital organelles. Afterwards, cellular toxicity occurs due to the oxidative stress generated by the production of ROS |
Present study |
| Green method |
— |
More effective against Gram-positive bacterial strain than Gram negative bacterial strain; zone of inhibition, 9.0 mm |
Stress could result from ROS, engendered by the interplay of oxygen and metal species or from the disturbance of electronic or ionic transport due to strong affinity of the NPs for the cell membrane which results in their antibacterial activity |
95 |
| Sol–gel method |
— |
Inhibit the growth of different bacteria with zone of inhibition ranging from 12 to 15 mm |
Production of ROS and membrane disruptions cause the antimicrobial activity of NPs |
96 |
| Precipitation method |
— |
Showed better antibacterial activity (ZOI ranged from 21 to 26 mm) |
ZnS/Ag/CoFe2O4 nanocomposite generates different ROS including superoxide and hydroxyl radicals. The superoxide radicals are directly involved and damage the outer surface of the bacteria |
97 |
| Honey-assisted combustion method |
25.2 nm to 28.4 nm |
Highly concentrated NPs produce greatest antimicrobial action with inhibition zone from 10–20 mm in diameter |
Possible mechanism of antimicrobial activity for the NPs is due to: (1) interference during cell wall synthesis; (2) suppression during protein biosynthesis (translation); (3) interference or disruption of transcription process; (4) disruption of primary metabolic pathways |
98 |
| Hydrothermal method |
Nano-flakes with lengths of thousands of nanometers and thickness of 50–60 nm |
Effective bactericidal agent |
ROS formation. NPs may attach to the surface of the cell membrane disturbing permeability and respiration functions of the cell |
99 |
| Solid-state combustion method |
100 nm |
ZOI ranged from 13 to 16 mm with different bacterial strains |
These NPs exhibit attractive antibacterial properties due to increased specific surface area as the reduced particle size leading to enhanced particle surface reactivity |
100 |
4. Conclusion
For the first time, this work exhibits that gamma irradiation assisted the synthesis of Ag-decorated ZFO NPs. XRD and FTIR analyses have confirmed the successful preparation of Ag@ZFO NPs. The successful identification of the samples was confirmed via XRD and FTIR. Also, the EDX spectra proved that the fundamental elements were uniformly distributed through the Ag@ZFO NPs without any foreign constituents, which established the purity of the synthesized Ag@ZFO NPs. Ag-decorated ZFO NPs showed the well-known decisive antibacterial action towards all the chosen pathogenic bacteria. The activity of Ag0.75@ZFO NPs declines in the following order: S. vitulinus (24.60 mm), > E. columbae (23.5 mm) > S. aureus (21.90 mm) > S. lentus (15.00 mm) > S. sciuri (13.00 nm). For Ag0.75@ZFO NPs, the MIC was less against S. vitulinus (0.097 μg ml−1). The antibiofilm activity of Ag0.75@ZFO NPs was the highest, registering at 97.3% for S. aureus and 95.25% for E. columbae. Since the antimicrobial potency of NPs dramatically depends on the particle size, the smaller dimensions of Ag0.75@ZFO NPs give potent antibiofilm activity against bacteria. Ag0.75@ZFO NPs are a highly effective disinfectant once activated by UV light. The cellular protein released from S. vitulinus is directly proportional to the concentration of Ag0.75@ZFO NPs and reached 186.25 μg ml−1 after treatment with 1.0 mg ml−1, which clearly explains the formation of pits in the cell membrane of bacterial cells resulting in the leakage of the proteins from the cytoplasm of S. vitulinus cells. It is suggested that Ag-decorated ZFO NPs could substitute for some disinfectant solutions applied for surface cleaning in clinics and some paints included in medical operating chambers to save the atmosphere from penetrating pathogenic microbes. Moreover, Ag-decorated ZFO NPs may be acceptable as a constituent in some cosmetics and pharmaceuticals for biomedical treatments. Finally, Ag-decorated ZFO NPs may be used in manufacturing and environmental purposes like rainwater treatment for contaminants and preserve the environment from dangerous pathogens and hazardous pigments.
Conflicts of interest
The authors declare that they have no conflict of interest.
Acknowledgements
The authors would like to thank the Nanotechnology Research Unit (PI Prof. Dr Ahmed I. El-Batal), Drug Microbiology Lab., Drug Radiation Research Department, NCRRT, Egypt, for financing and supporting this study under the project “Nutraceuticals and Functional Foods Production by using Nano/Biotechnological and Irradiation Processes”. Also, the authors would like to thank Zeiss microscope team in Cairo for their invaluable advice during this study.
References
- V. D. Rosenthal, H. Bijie, D. G. Maki, Y. Mehta, A. Apisarnthanarak, E. A. Medeiros, H. Leblebicioglu, D. Fisher, C. Álvarez-Moreno and I. A. Khader, Am. J. Infect. Control, 2012, 40, 396–407 CrossRef PubMed.
- J. R. Curtis, N. Patkar, A. Xie, C. Martin, J. J. Allison, M. Saag, D. Shatin and K. G. Saag, Arthritis Rheum., 2007, 56, 1125–1133 CrossRef CAS PubMed.
- S. Wilks, H. Michels and C. Keevil, Int. J. Food Microbiol., 2005, 105, 445–454 CrossRef CAS PubMed.
- Z. W. Jaradat, Q. O. Ababneh, S. T. Sha'aban, A. A. Alkofahi, D. Assaleh and A. Al Shara, Pathog. Global Health, 2020, 1–25 Search PubMed.
- K. Ssekatawa, D. K. Byarugaba, C. D. Kato, F. Ejobi, R. Tweyongyere, M. Lubwama, J. B. Kirabira and E. M. Wampande, J. Nanopart. Res., 2020, 22, 1–30 CrossRef.
- M. Mirhosseini and M. Afzali, Food Control, 2016, 68, 208–215 CrossRef CAS.
- L. B. Reller, M. Weinstein, J. H. Jorgensen and M. J. Ferraro, Clin. Infect. Dis., 2009, 49, 1749–1755 CrossRef PubMed.
- M. Iñiguez-Moreno, M. Gutiérrez-Lomelí, P. J. Guerrero-Medina and M. G. Avila-Novoa, Braz. J. Microbiol., 2018, 49, 310–319 CrossRef PubMed.
- J. Tang, J. Chen, H. Li, P. Zeng and J. Li, Foodborne Pathog. Dis., 2013, 10, 757–763 CrossRef CAS PubMed.
- M. Wilczynski, Ceramic Engineering and Science Proceedings, The American Ceramic Society, 735 Ceramic Place Westerville, OH 4308 I, 2000, available at https://ceramics.onlinelibrary.wiley.com/doi/pdf/10.1002/9780470294642#page=84 Search PubMed.
- J.-Z. Guo, H. Cui, W. Zhou and W. Wang, J. Photochem. Photobiol., A, 2008, 193, 89–96 CrossRef CAS.
- R. Rameshbabu, R. Ramesh, S. Kanagesan, A. Karthigeyan and S. Ponnusamy, J. Mater. Sci.: Mater. Electron., 2013, 24, 4279–4283 CrossRef CAS.
- R. Rameshbabu and B. Neppolian, J. Cluster Sci., 2016, 27, 1977–1987 CrossRef CAS.
- V. S. R. Raju, Mater. Sci. Eng., B, 2017, 224, 88–92 CrossRef.
- S. M. Hoque, M. S. Hossain, S. Choudhury, S. Akhter and F. Hyder, Mater. Lett., 2016, 162, 60–63 CrossRef CAS PubMed.
- F. Martinez-Julian, A. Guerrero, M. Haro, J. Bisquert, D. Bresser, E. Paillard, S. Passerini and G. Garcia-Belmonte, J. Phys. Chem. C, 2014, 118, 6069–6076 CrossRef CAS.
- K. Wu, J. Li and C. Zhang, Ceram. Int., 2019, 45, 11143–11157 CrossRef CAS.
- S. O. Aisida, P. A. Akpa, I. Ahmad, M. Maaza and F. I. Ezema, Phys. B, 2019, 571, 130–136 CrossRef CAS.
- M. Madhukara Naik, H. S. Bhojya Naik, G. Nagaraju, M. Vinuth, K. Vinu and R. Viswanath, Nano-Struct. Nano-Objects, 2019, 19, 100322 CrossRef CAS.
- H. Hassan, M. A. Maksoud and L. A. Attia, J. Mater. Sci.: Mater. Electron., 2020, 31, 1616–1633 CrossRef CAS.
- S. Liu, M. C. Yuen and R. Kramer-Bottiglio, Flexible Printed Electron., 2019, 4, 015004 CrossRef CAS.
- M. S. J. Khan, T. Kamal, F. Ali, A. M. Asiri and S. B. Khan, Int. J. Biol. Macromol., 2019, 132, 772–783 CrossRef CAS PubMed.
- B. A. Aderibigbe, Molecules, 2017, 22, 1370 CrossRef PubMed.
- D. Shcharbin, I. Halets-Bui, V. Abashkin, V. Dzmitruk, S. Loznikova, M. Odabaşı, Ö. Acet, B. Önal, N. Özdemir and N. Shcharbina, Colloids Surf., B, 2019, 182, 110354 CrossRef CAS PubMed.
- R. Salomoni, P. Léo, A. Montemor, B. Rinaldi and M. Rodrigues, Nanotechnol., Sci. Appl., 2017, 10, 115 CrossRef CAS PubMed.
- S. Park, H. H. Park, S. Y. Kim, S. J. Kim, K. Woo and G. Ko, Appl. Environ. Microbiol., 2014, 80, 2343–2350 CrossRef PubMed.
- N. T. Khan and M. Mushtaq, Biol. Med., 2017, 9, 1 Search PubMed.
- G. Kannayiram, A. Sandhya, S. Sowmiya, S. Valarmathi and D. Joseph, Asian J. Pharm. Clin. Res., 2019, 346–349 CrossRef CAS.
- S. Yesilot and C. Aydin, East. J. Med., 2019, 24, 111–116 CrossRef.
- K. Venugopal, H. Rather, K. Rajagopal, M. Shanthi, K. Sheriff, M. Illiyas, R. Rather, E. Manikandan, S. Uvarajan and M. Bhaskar, J. Photochem. Photobiol., B, 2017, 167, 282–289 CrossRef CAS PubMed.
- Z. Yu, A. Suryawanshi, H. He, J. Liu, Y. Li, X. Lin and Z. Sun, Cellulose, 2020, 27, 5391–5406 CrossRef CAS.
- N. C. Mueller and B. Nowack, Environ. Sci. Technol., 2008, 42, 4447–4453 CrossRef CAS PubMed.
- G. G. Flores-Rojas, F. López-Saucedo and E. Bucio, Radiat. Phys. Chem., 2020, 169, 107962 CrossRef CAS.
- Z. I. Ali, M. Bekhit, R. Sokary and T. A. Afify, Int. J. Environ. Anal. Chem., 2019, 99, 1313–1324 CrossRef CAS.
- A. H. Ashour, A. I. El-Batal, M. I. A. A. Maksoud, G. S. El-Sayyad, S. Labib, E. Abdeltwab and M. M. El-Okr, Particuology, 2018, 40, 141–151 CrossRef CAS.
- M. I. A. A. Maksoud, G. S. El-Sayyad, A. H. Ashour, A. I. El-Batal, M. A. Elsayed, M. Gobara, A. M. El-Khawaga, E. K. Abdel-Khalek and M. M. El-Okr, Microb. Pathog., 2019, 127, 144–158 CrossRef CAS PubMed.
- M. I. A. Abdel Maksoud, G. S. El-Sayyad, A. H. Ashour, A. I. El-Batal, M. S. Abd-Elmonem, H. A. M. Hendawy, E. K. Abdel-Khalek, S. Labib, E. Abdeltwab and M. M. El-Okr, Mater. Sci. Eng., C, 2018, 92, 644–656 CrossRef CAS PubMed.
- M. I. A. A. Maksoud, A. El-ghandour, G. S. El-Sayyad, A. S. Awed, R. A. Fahim, M. M. Atta, A. H. Ashour, A. I. El-Batal, M. Gobara, E. K. Abdel-Khalek and M. M. El-Okr, J. Mater. Sci.: Mater. Electron., 2019, 30, 4908–4919 CrossRef CAS.
- M. I. A. Abdel Maksoud, A. El-ghandour, G. S. El-Sayyad, A. S. Awed, A. H. Ashour, A. I. El-Batal, M. Gobara, E. K. Abdel-Khalek and M. M. El-Okr, J. Sol-Gel Sci. Technol., 2019, 90, 631–642 CrossRef CAS.
- A. A. Reheem, A. Atta and M. A. Maksoud, Radiat. Phys. Chem., 2016, 127, 269–275 CrossRef CAS.
- P. Belavi, G. Chavan, L. Naik, R. Somashekar and R. Kotnala, Mater. Chem. Phys., 2012, 132, 138–144 CrossRef CAS.
- A. I. El-Batal, G. S. El-Sayyad, F. M. Mosallam and R. M. Fathy, J. Cluster Sci., 2020, 31, 79–90 CrossRef CAS.
- F. E. Roy, T. Berteau, J. Bestman-Smith, S. Grandjean Lapierre, S. F. Dufresne, M.-C. Domingo and J.-M. Leduc, J. Clin. Microbiol., 2021, 59 DOI:10.1128/jcm.00259-21.
- S. Elbasuney, G. S. El-Sayyad, H. Tantawy and A. H. Hashem, RSC Adv., 2021, 11, 25961–25975 RSC.
- M. A. Rather, K. Gupta and M. Mandal, J. Ethnopharmacol., 2021, 269, 113699 CrossRef CAS PubMed.
- W. Huang, J.-Q. Wang, H.-Y. Song, Q. Zhang and G.-F. Liu, Asian Pac. J. Trop. Med., 2017, 10, 663–669 CrossRef CAS PubMed.
- A. N. El-Shazly, G. S. El-Sayyad, A. H. Hegazy, M. A. Hamza, R. M. Fathy, E. El Shenawy and N. K. Allam, Sci. Rep., 2021, 11, 1–14 CrossRef PubMed.
- H. Agarwal, A. Nakara, S. Menon and V. Shanmugam, J. Drug Delivery Sci. Technol., 2019, 53, 101212 CrossRef CAS.
- M. Abd Elkodous, G. S. El-Sayyad, S. M. Youssry, H. G. Nada, M. Gobara, M. A. Elsayed, A. M. El-Khawaga, G. Kawamura, W. K. Tan and A. I. El-Batal, Sci. Rep., 2020, 10, 1–22 CrossRef PubMed.
- A. M. Brown, Comput. Methods Programs Biomed., 2005, 79, 89–95 CrossRef PubMed.
- P. Y. Reyes-Rodríguez, D. A. Cortés-Hernández, J. C. Escobedo-Bocardo, J. M. Almanza-Robles, H. J. Sánchez-Fuentes, A. Jasso-Terán, L. E. De León-Prado, J. Méndez-Nonell and G. F. Hurtado-López, J. Magn. Magn. Mater., 2017, 427, 268–271 CrossRef.
- U. Ghodake, R. C. Kambale and S. Suryavanshi, Ceram. Int., 2017, 43, 1129–1134 CrossRef CAS.
- C. Sambathkumar, S. E. Arasi, B. Natarajan, A. Arivarasan and P. Devendran, Int. J. Eng. Adv. Technol., 2019, 9, 1S4 Search PubMed.
- B. Gauri, K. Vidya, D. Sharada and W. Shobha, Res. J. Chem. Environ., 2016, 20, 1–5 CAS.
- H. Yang, Y.-y. Ren, T. Wang and C. Wang, Results Phys., 2016, 6, 299–304 CrossRef.
- A. Karim, S. E. Shirsath, S. Shukla and K. Jadhav, Nucl. Instrum. Methods Phys. Res., Sect. B, 2010, 268, 2706–2711 CrossRef CAS.
- S. Sharma, R. Kumar, V. S. Kumar, M. Knobel, V. Reddy, A. Gupta and M. Singh, Nucl. Instrum. Methods Phys. Res., Sect. B, 2006, 248, 37–41 CrossRef CAS.
- P. P. Naik, R. B. Tangsali, B. Sonaye and S. Sugur, J. Magn. Magn. Mater., 2015, 385, 377–385 CrossRef CAS.
- U. Holzwarth and N. Gibson, Nat. Nanotechnol., 2011, 6, 534 CrossRef CAS PubMed.
- S. Assar, H. Abosheiasha and A. El Sayed, J. Magn. Magn. Mater., 2017, 421, 355–367 CrossRef CAS.
- S. Kakade, R. Kambale, C. Ramanna and Y. Kolekar, RSC Adv., 2016, 6, 33308–33317 RSC.
- S. Bahhar, H. Lemziouka, A. Boutahar, H. Bioud, H. Lassri and E. Hlil, Chem. Phys. Lett., 2019, 716, 186–191 CrossRef CAS.
- B. Alshahrani, H. ElSaeedy, A. Korna, H. Yakout, M. A. Maksoud, R. A. Fahim, M. Gobara and A. Ashour, J. Mater. Sci.: Mater. Electron., 2021, 32, 780–797 CrossRef CAS.
- D. Gingasu, I. Mindru, L. Patron, J. M. Calderon-Moreno, O. C. Mocioiu, S. Preda, N. Stanica, S. Nita, N. Dobre and M. Popa, J. Nanomater., 2016, 2016, 2106756 Search PubMed.
- M. Kooti, S. Saiahi and H. Motamedi, J. Magn. Magn. Mater., 2013, 333, 138–143 CrossRef CAS.
- C. Murugesan and G. Chandrasekaran, RSC Adv., 2015, 5, 73714–73725 RSC.
- J. S. Kounsalye, A. V. Humbe, A. R. Chavan and K. Jadhav, Phys. B, 2018, 547, 64–71 CrossRef CAS.
- S. Chakrabarty, A. Dutta and M. Pal, J. Magn. Magn. Mater., 2018, 461, 69–75 CrossRef CAS.
- D. Karthickraja, S. Karthi, G. Kumar, D. Sardar, G. Dannangoda, K. Martirosyan and E. Girija, New J. Chem., 2019, 43, 13584–13593 RSC.
- S. Bhattacharjee, G. Debnath, A. R. Das, A. K. Saha and P. Das, Adv. Nat. Sci.: Nanosci. Nanotechnol., 2017, 8, 045008 Search PubMed.
- D. Rawat, P. Barman and R. R. Singh, Sci. Rep., 2019, 9, 1–12 CAS.
- M. Abd Elkodous, G. S. El-Sayyad, I. Y. Abdelrahman, H. S. El-Bastawisy, F. M. Mosallam, H. A. Nasser, M. Gobara, A. Baraka, M. A. Elsayed and A. I. El-Batal, Colloids Surf., B, 2019, 180, 411–428 CrossRef CAS PubMed.
- E. R. Kumar, P. S. P. Reddy, G. S. Devi and S. Sathiyaraj, J. Magn. Magn. Mater., 2016, 398, 281–288 CrossRef.
- M. Amer, T. Meaz, A. Hashhash, S. Attalah and A. Ghoneim, Mater. Chem. Phys., 2015, 162, 442–451 CrossRef CAS.
- M. I. A. Abdel Maksoud, A. El-Ghandour, G. S. El-Sayyad, R. A. Fahim, A. H. El-Hanbaly, M. Bekhit, E. K. Abdel-Khalek, H. H. El-Bahnasawy, M. Abd Elkodous, A. H. Ashour and A. S. Awed, J. Inorg. Organomet. Polym. Mater., 2020, 30, 3709–3721 CrossRef CAS.
- J. C. Janssens, H. Steenackers, S. Robijns, E. Gellens, J. Levin, H. Zhao, K. Hermans, D. De Coster, T. L. Verhoeven and K. Marchal, Appl. Environ. Microbiol., 2008, 74, 6639–6648 CrossRef CAS PubMed.
- R. M. Donlan, Emerging Infect. Dis., 2002, 8, 881 CrossRef PubMed.
- W. M. Dunne, Clin. Microbiol. Rev., 2002, 15, 155–166 CrossRef CAS PubMed.
- M. Burmølle, J. S. Webb, D. Rao, L. H. Hansen, S. J. Sørensen and S. Kjelleberg, Appl. Environ. Microbiol., 2006, 72, 3916–3923 CrossRef PubMed.
- R. M. Fathy and A. Y. Mahfouz, J. Nanostruct. Chem., 2021, 11, 301–321 CrossRef CAS.
- A. Joe, S.-H. Park, D.-J. Kim, Y.-J. Lee, K.-H. Jhee, Y. Sohn and E.-S. Jang, J. Solid State Chem., 2018, 267, 124–133 CrossRef CAS.
- M. M. Naik, H. B. Naik, G. Nagaraju, M. Vinuth, H. R. Naika and K. Vinu, Microchem. J., 2019, 146, 1227–1235 CrossRef.
- G. Sharmila, M. Thirumarimurugan and C. Muthukumaran, Microchem. J., 2019, 145, 578–587 CrossRef CAS.
- A. Samavati, M. Mustafa, A. Ismail, M. Othman and M. Rahman, Mater. Express, 2016, 6, 473–482 CrossRef CAS.
- R. Haghniaz, A. Rabbani, F. Vajhadin, T. Khan, R. Kousar, A. R. Khan, H. Montazerian, J. Iqbal, A. Libanori and H.-J. Kim, J. Nanobiotechnol., 2021, 19, 1–15 CrossRef PubMed.
- X. Fei, X. Ma, G. Fang, Y. Chong, X. Tian and C. Ge, J. Nanosci. Nanotechnol., 2020, 20, 1425–1433 CrossRef CAS PubMed.
- P. C. Lee, C. C. Chu, Y. J. Tsai, Y. C. Chuang and F. D. Lung, Chem. Biol. Drug Des., 2019, 94, 1537–1544 CAS.
- Y. Xu, Q. Liu, M. Xie, S. Huang, M. He, L. Huang, H. Xu and H. Li, J. Colloid Interface Sci., 2018, 528, 70–81 CrossRef CAS PubMed.
- S. Patil, H. B. Naik, G. Nagaraju, R. Viswanath and S. Rashmi, Mater. Chem. Phys., 2018, 212, 351–362 CrossRef CAS.
- L. F. Gaunt, C. B. Beggs and G. E. Georghiou, IEEE Trans. Plasma Sci., 2006, 34, 1257–1269 CAS.
- N. Bradford, Anal. Biochem., 1976, 72, e254 CrossRef.
- S. Rajesh, V. Dharanishanthi and A. V. Kanna, J. Exp. Nanosci., 2015, 10, 1143–1152 CrossRef CAS.
- Z. Azam, A. Ayaz, M. Younas, Z. Qureshi, B. Arshad, W. Zaman, F. Ullah, M. Q. Nasar, S. Bahadur and M. M. Irfan, Microb. Pathog., 2020, 144, 104188 CrossRef CAS PubMed.
- D. Paul, S. Maiti, D. P. Sethi and S. Neogi, Adv. Powder Technol., 2021, 32, 131–143 CrossRef CAS.
- P. Mahajan, A. Sharma, B. Kaur, N. Goyal and S. Gautam, Vacuum, 2019, 161, 389–397 CrossRef CAS.
- S. Thankachan, M. Femsy and N. John, Mater. Today: Proc., 2020, 25, 289–293 CAS.
- G. Palanisamy, K. Bhuvaneswari, A. Chinnadurai, G. Bharathi and T. Pazhanivel, J. Phys. Chem. Solids, 2020, 138, 109231 CrossRef CAS.
- M. Satheeshkumar, E. R. Kumar, C. Srinivas, N. Suriyanarayanan, M. Deepty, C. Prajapat, T. C. Rao and D. Sastry, J. Magn. Magn. Mater., 2019, 469, 691–697 CrossRef CAS.
- C. Karunakaran and P. Vinayagamoorthy, Surf. Interfaces, 2018, 10, 123–128 CrossRef CAS.
- A. Lagashetty, A. Pattar and S. K. Ganiger, Heliyon, 2019, 5, e01760 CrossRef PubMed.
Footnote |
| † Equal contribution. |
|
| This journal is © The Royal Society of Chemistry 2021 |
Click here to see how this site uses Cookies. View our privacy policy here. 
 Open Access Article
 This Open Access Article is licensed under a
  a,
Gharieb S. El-Sayyad†
a,
Gharieb S. El-Sayyad†