 Open Access Article
Surface blocking of azolla modified copper electrode for trace determination of phthalic acid esters as the molecular barricades by differential pulse voltammetry: response surface modelling optimized biosensor†
Maryam Darvishi,
Shahab Shariati *,
Fariba Safa and
Akbar Islamnezhad
Department of Chemistry, Rasht Branch, Islamic Azad University, Rasht, Iran. E-mail: shariaty@iaurasht.ac.ir; Fax: +981333402718
First published on 5th October 2021
Abstract
In this work, a sensitive and efficient voltammetric biosensor was introduced for differential pulse voltammetric (DPV) determination of some phthalic acid esters (PAEs) including dibutyl phthalate (DBP), dimethyl phthalate (DMP), di(2-ethylhexyl)phthalate (DEHP) and dicyclohexyl phthalate (DCHP) in aqueous solutions. Briefly, the surface of a copper electrode was modified by azolla paste prepared using azolla powder and electroencephalography gel (EEG). The modified surface was characterized by electrochemical impedance spectroscopy (EIS), field emission scanning electron microscopy (FESEM), transmission electron microscopy (TEM), Fourier transform infrared spectroscopy (FT-IR), Brunauer–Emmett–Teller (BET) analysis and energy dispersive X-ray (EDX) methods. Determination of PAEs was conducted based on their blocking effect on the electrode surface for ferrous ion oxidation. The central composite design (CCD) was conducted to optimize the effects of four experimental parameters including the concentration of Fe2+ ions (CFe2+) and supporting electrolyte (Csup. elec), solution pH and modifier/gel mass ratio on the decrease in the anodic peak current of ferrous ions as the response. Predicted optimal conditions (CFe2+= 319 μM, Csup. elec= 0.125 M, pH = 7.52 and modifier/gel mass ratio = 0.19) were validated by experimental checking which resulted in an error of 1.453%. At the optimum conditions, linear relationships were found between the DPV responses and PAEs concentrations and the limit of detection (LOD) and limit of quantification (LOQ) values were in the ranges of 0.2–0.4 μg L−1 and 0.5–1.0 μg L−1, respectively. Good recovery percentages ranging from 97.3 to 100.3% with RSD < 3.2% suggested the proposed method for efficient, accurate and quick determination of PAEs in real water samples.
1. Introduction
Phthalic acid esters (PAEs) are a group of hand-made chemicals used as softeners, stabilizers or additives in many consumer and industrial products. Humans are exposed to these substances throughout their lives, even in the womb through maternal contact.1 They lower testosterone and cause abnormalities in the male reproductive system and may have carcinogenic effects and cause genetic damage.2–4 These substances may enter the environment during production, use or destruction of products and cause pollution to water, soil and atmosphere. Some PAEs such as dibutyl phthalate (DBP), di(2-ethylhexyl)phthalate (DEHP), dimethyl phthalate (DMP) and dicyclohexyl phthalate (DCHP) are used in insecticides, cosmetics, perfumes and plastics. United States Environmental Protection Agency (US-EPA) classified PAEs as major pollutants, according to which the maximum allowable limit of DEHP in drinking water was considered at 6 μg L−1.5–13 Also, the threshold limit values for DCHP, DBP, DMP and DEHP that cause apparent changes (color, smell, taste) in water are 0.55, 0.45, 5.0 and 5.0 mg L−1, respectively.14 PAEs are commonly determined using gas chromatography (GC),15 high performance liquid chromatography (HPLC),16 LC-MS and GC-MS instruments.17,18 Although these techniques are accurate and sensitive, they require very expensive and sophisticated tools, skilled users, and sample pretreatment methods. Therefore, utilizing inexpensive, rapid and sensitive methods for determining of PAEs is very essential. Electrochemical methods including electrochemical sensors have been used as a powerful analytical tool for studying and determining PAEs due to their sensitivity, simplicity, low cost and easy sample miniaturization.19–24Azolla fern that is seen in still waters has small leaves with dark green or reddish-brown color and a length of 2.5 cm. It has symbiosis with the blue-green algae, called Anabaena that acts for assimilation and fixation of atmospheric nitrogen.25 Six known species of azolla are widely distributed in temperate, tropical and subtropical regions of the world. The growth rate of this plant is so high that it weighs twice as much every day. The life cycle of azolla plant is 15 to 30 days. The chemical composition of azolla varies according to the growth stage and environmental conditions.26 Up to now, raw and magnetite modified azolla have been successfully employed for adsorption and phytodegradation of different water pollutants.27–31
In this work, PAEs played as the electrode surface blocking and reducing the anodic peak current. As it was published in the earliest report, detecting electrochemically inactive biomacromolecules, such as enzymes, antibodies, and DNA was demonstrated by blocking a solution redox reaction when molecules adsorb and block electrode sites. For this purpose, a large concentration of potassium ferrocyanide on an ultramicroelectrode was used.32 In a previous study, reduced graphene oxide/glassy carbon electrode (rGO/GCE) was used for electrochemical detection of alloxan. Differential pulse voltammetry (DPV) was used for improving the sensitivity of alloxan detection through its blocking effect on the electrode surface.33 In another work, DPV was used for the electroanalytical detection of p-nitroaniline as a surface blocker for the synthesized silver nanoparticles.34 In other study, a core–shell structure was synthesized by porous conjugated metalloporphyrins and graphene oxide, with excellent performance in the electrocatalytic reduction of trace nitrobenzene. The DPV current decreased with increasing the concentration of nitrobenzene.35 In another study, the nonylphenol molecularly imprinted polymers were grafted on the surface of acrylamide functionalized MWCNT modified glassy carbon electrode. This sensor was used for detection of nonylphenol. Based on the results, DPV signal was reduced by increasing the concentration of nonylphenol on decreasing current.36 In another work, the electrochemical sensor was designed by electrodepositing molecularly imprinted poly p-aminothiophenol (PATP) based on graphene-Au nanoparticles multilayer films. According to DPV signal, this sensor exhibited high sensitivity to detection of nonylphenol. It was observed that with increasing the concentration of nonylphenol, the obtained current decreased.37
Central composite design (CCD) is one of the most popular response surface methodology (RSM) designs for modeling the relationship between the experimental factors and the observed responses. Optimization of chemical processes using this scheme consists of three steps: (i) performing statistically designed experiments, (ii) developing a significant mathematical model, and (iii) predicting the optimum responses through the experimental space.38 Central composite design (CCD) is a RSM that have been used for process modeling from two or more factors, generally involving five levels. The CCD consists of a two-level full factorial design, a star design, and the central point. One of the advantages of the CCD is that the full two-level factorial design can be performed preliminarily for a previous evaluation of the factors and afterward used in the RSM.39,40
In some electrochemical studies, RSM design was used to determine the optimal values of experimental factors. In one study, magnetic ion imprinted polymer modified glassy carbon electrode (GCE) was synthesized and used for determination of Pb2+ contents in complicated samples. Effective parameters for detection of Pb2+ were studied by DPV and Box–Behnken design (BBD) method to establish optimum conditions.41 In other study, Au nanoparticles modified choline chloride functionalized graphene oxide (AuNPs-ChCl-GO) was fabricated for DPV measurements and CCD design was used for optimizing of experimental factors.42 In another research, an electrochemical sensor for the detection of amoxicillin was prepared using TiO2-g-C3N4@Au NPs composites after obtaining the optimal conditions by BBD design.43
In this effort, we report new approach for surface modification and surface blocking of biosensor. The biosensor response was optimized by RSM-based method using DBP and after that the optimized biosensor was utilized for determination of four PAEs in aqueous solutions. Specifically, we investigated the DPV signal cutback track that has been established by A. J. Bard.32 PAEs were determined based on their blocking effect on the electrode surface for oxidation of ferrous ions. RSM method was followed to optimize the effects of four experimental variables on the decrease in the anodic peak current of Fe2+ ions as the electrochemical response. Finally, figures of merit of the proposed electrode for determining PAEs were obtained. To the best of our knowledge, combination of an azolla modified copper electrode with RSM has not been already employed for determination of PAEs based on their surface blocking effect.
2. Experimental
2.1. Materials and apparatus
Phosphoric acid 85% (w/w), iron(II)chloride tetrahydrate (FeCl2·4H2O), potassium chloride, sodium chloride, potassium nitrate and sodium sulphate were purchased with high purity from Merck (Darmstadt, Germany). Sodium hydroxide, DBP, DMP, DCHP and DEHP were purchased from Sigma-Aldrich (Milwaukee, WI, USA). Chemical structure of the studied PAEs is shown in Fig. 1. Electroencephalography gel was purchased from Abzar darman (Tehran, Iran).In the work, a cylindrical copper electrode (I.D = 7 mm and O.D. = 10 mm) along with an Ag/AgCl reference electrode and a platinum counter electrode were utilized. All electrochemical experiments were performed with Potentiostat–Galvanostat (μAutolab, Netherlands) equipped with a three-electrodes cell at room temperature (r.t). The cell consisted of the azolla modified copper electrode as working electrode, an Ag/AgCl reference electrode and a Pt counter electrode. A WTW pH meter (InoLab 7110, Germany) was utilized to adjust the pH of solutions. Fourier transform infrared spectroscopy (FT-IR) (Shimadzu, 8900, Japan) was used to study the azolla surface before and after exposure to PAEs. Field emission scanning electron microscopy (FESEM) (TESCAN, Mira3, Czech Republic) and transmission electron microscopy (TEM, Philips, CM120, Netherlands) images were obtained to study the size and morphology of particles. Nitrogen adsorption–desorption experiments were carried out at 77 K on a Belsorpmini II accelerated surface area and porosimetry system (Microtrac Bel Crop, Japan). The Brunauer–Emmett–Teller (BET) surface area (SBET) was calculated from the linearity of the BET equation. The surface area, volume and pore diameter of particles were calculated from pore size distribution curves using the Barrett–Joyner–Halenda (BJH) formula. Energy dispersive X-ray (EDX, TESCAN, Mira2, Czech Republic) analysis was carried out to obtain the elemental composition of azolla.
The Design-Expert software was utilized (the Design-Expert 12, DOE software, Stat-Ease, Minneapolis, MN55413, USA) to optimize the effective parameters via CCD method.
2.2. Preparation of standard solutions
Standard solution of Fe2+ ions (10−3 mol L−1) was prepared by dissolving a certain amount of FeCl2·4H2O in doubly distilled water (DW). Phosphate buffer (0.01 mol L−1, pH = 7) for adjusting the pH of solutions and KCl, NaCl, Na2SO4 and KNO3 solutions (0.1 mol L−1) were prepared as supporting electrolyte.2.3. Preparation of azolla powder
To prepare the azolla powder for modification of electrode surface, sufficient amount of Azolla filiculoides Lam was collected from Anzali wetland (Guilan, Iran) and washed five times with tap water and then, with DW. After that, the cleaned azolla was dried in an oven at 60 °C for three days and then, was grounded in a mortar. The resulting powder was sieved through a 200-mesh sieve to produce the particle size of <74 microns.282.4. Electrochemical measurements
To modify the copper electrode, a certain amount of azolla powder was mixed with electroencephalography gel to obtain a smooth paste with good adhesion and the surface of copper electrode was covered by this paste. After each experiment, the modified working electrode was rinsed with pure methanol to remove the modifier from the electrode surface. Then, it was sanded and washed again with pure methanol and finally placed in distilled water. Fig. 2 shows the effect of modification of the surface of copper electrode on the oxidation peak current of Fe2+/Fe3+ pairs. Obviously, the anodic peak current increases in presence of the azolla modifier on the surface of the copper electrode.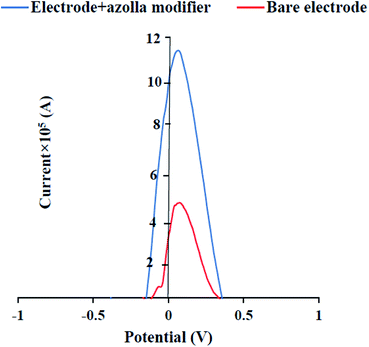 | ||
| Fig. 2 Effect of azolla modification of copper electrode on the anodic peak current of Fe2+/Fe3+ pairs. | ||
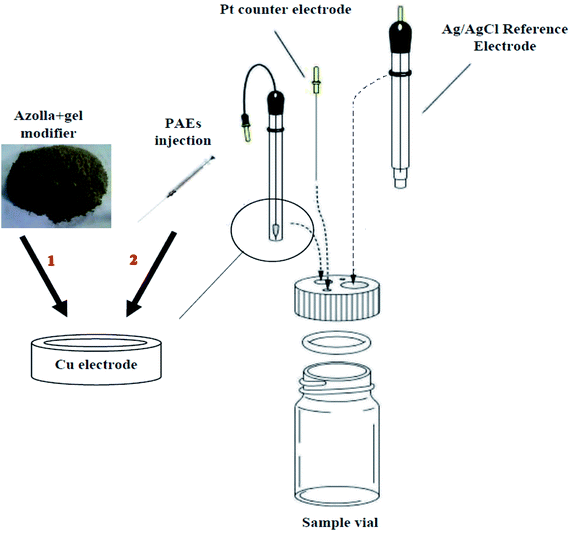
In each experiment, 1 mL of phosphate buffer (0.01 mol L−1, pH = 7), 5 mL of Fe2+ solution (10−3 mol L−1) and 4 mL of supporting electrolyte solution (0.1 mol L−1), were added to the electrochemical cell. For measuring the anodic peak current of Fe2+/Fe3+ pairs on the surface of un-modified and azolla modified copper electrodes, the applied potential was scanned between −1.5 to +1.5 V during pretests. After that, well-defined peak was recognized between −0.2 to +0.4 V, but all experiments were done on the potential range of −1 to +1 V (Fig. 2). Then, 20 μL sample solution containing certain concentration of each PAE, as blocking agent, was separately injected into the surface of modified electrode with a microsyringe. Thereafter, the cutback in DPV response of Fe2+/Fe3+ pairs was measured by scanning potential between −1 to 1 V. Fig. 3 shows the schematic of azolla modified working electrode in the three-electrodes cell.
3. Results and discussion
3.1. Characterization of azolla powder
TEM and FESEM images of azolla powder, before and after spiking by 3 μg L−1 PAEs, were shown in Fig. 4. As shown, the average particle size and the pore size were in the micrometer and nanometer scales, respectively. EDX analysis was used to investigate the composition of elements in azolla powder. According to the obtained results (Fig. S1†), C (56.3%) and O (36.5%) were the most abundant elements in the powder. Moreover, Si (1.5%), Na (1.2%), K (1.1%), Al (0.9%) and other elements including Mg, S, Ca and Cl (<2.5%) were observed in the azolla powder. BET analysis was used to measure the porosity and surface area of azolla powder. According to the obtained results (Fig. S2†), Vm (BET monolayer capacity), the BET surface area (SBET), total pore volume (p/p0 = 0.990) and mean pore diameter were 0.178 cm3 (STP) g−1, 0.775 m2 g−1, 0.0051 cm3 g−1 and 26.554 nm, respectively. The pore size distribution of the sample was calculated by the desorption branches of the isotherm using the BJH formula. Values of Vp (the mean volume of the pores) = 0.005425 cm3 g−1, ap (surface of pores) = 1.6527 m2 g−1, and rp,peak (area) = 1.64 nm were obtained by the BJH plot (Fig. S3†) showing that the azolla powder has pores with a diameter of nanometers.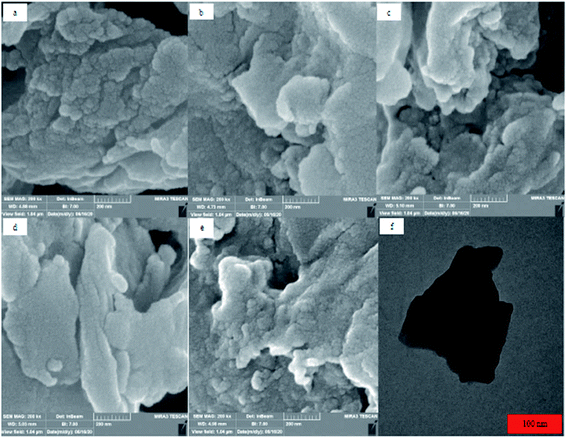 | ||
| Fig. 4 FESEM images of (a) azolla, (b) azolla + DMP, (c) azolla + DEHP, (d) azolla + DBP, (e) azolla + DCHP and (f) TEM image of azolla. | ||
FT-IR spectra of azolla before and after spiking with each PAE were shown in Fig. 5. Azolla peaks are marked and the band at 3438.84 cm−1 is related to the stretching vibration of hydroxyl group. The band at 2918.10 cm−1 is related to the C–H stretching. The bands at 1656.74 cm−1 and 1631.67 cm−1 can be attributed to C![[double bond, length as m-dash]](https://www.rsc.org/images/entities/char_e001.gif) O and N–H stretching vibrations, respectively. Additionally, the bands of C–O and C–N stretching vibrations are observed in 1105.14 cm−1 and 1066.54 cm−1, respectively. Notably, the peaks observed in the azolla spectrum showed a relative reduction after injection of PAEs. The observation is probably due to the fact that amino acid groups of azolla binds to the C–O group in PAEs. As the amount of PAE increases, more surface area of the electrode is occupied. With the formation of this molecular barrier, the possibility of reaching Fe2+ to the electrode surface decreases and the oxidation peak of Fe2+/Fe3+ pair is reduced.
O and N–H stretching vibrations, respectively. Additionally, the bands of C–O and C–N stretching vibrations are observed in 1105.14 cm−1 and 1066.54 cm−1, respectively. Notably, the peaks observed in the azolla spectrum showed a relative reduction after injection of PAEs. The observation is probably due to the fact that amino acid groups of azolla binds to the C–O group in PAEs. As the amount of PAE increases, more surface area of the electrode is occupied. With the formation of this molecular barrier, the possibility of reaching Fe2+ to the electrode surface decreases and the oxidation peak of Fe2+/Fe3+ pair is reduced.
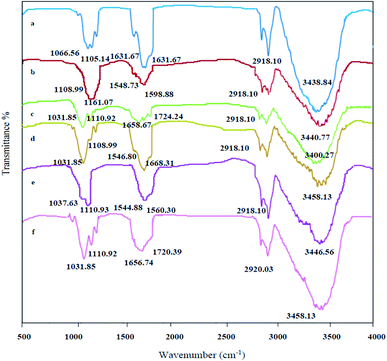 | ||
| Fig. 5 FT-IR spectra of azolla before and after PAEs injection: (a) azolla, (b) azolla + gel, (c) azolla + gel + DBP, (d) azolla + gel + DMP, (e) azolla + gel + DCHP, (f) azolla + gel + DEHP. | ||
3.2. Optimization experiments
In this research, firstly we tried to select the proper potential for redox pair of Fe2+/Fe3+ and made efforts to maximize the corresponding DPV signal. After that, in preliminary experiments, we examined the various levels of each parameter to find the best electrolyte salts and the best effective intervals for each parameter for further optimization by CCD. The optimization was performed for DBP and the optimum parameters were used for measurements of all the investigated PAEs compounds.| Variable | Symbol | Levels | ||||
|---|---|---|---|---|---|---|
| −α | −1 | 0 | +1 | +α | ||
| Fe2+ (μM) | A | 200 | 300 | 400 | 500 | 600 |
| pH | B | 7.20 | 7.45 | 7.70 | 7.95 | 8.2 |
| KCl (M) | C | 0.050 | 0.075 | 0.100 | 0.125 | 0.220 |
| Modifier/gel mass ratio | D | 0.10 | 0.13 | 0.16 | 0.19 | 0.22 |
| Std order | A | B | C | D | i1a (×105) | i2b (×105) | −Δi (×105) |
|---|---|---|---|---|---|---|---|
| a i1 = DPV response of azolla modified copper electrode.b i2 = DPV response after DBP injection as blocker. | |||||||
| 1 | 300 | 7.45 | 0.075 | 0.13 | 10.30 | 4.87 | 5.43 |
| 2 | 500 | 7.45 | 0.075 | 0.13 | 8.31 | 3.16 | 5.15 |
| 3 | 300 | 7.95 | 0.075 | 0.13 | 11.57 | 6.22 | 5.35 |
| 4 | 500 | 7.95 | 0.075 | 0.13 | 26.90 | 21.70 | 5.20 |
| 5 | 300 | 7.45 | 0.125 | 0.13 | 11.30 | 6.07 | 5.23 |
| 6 | 500 | 7.45 | 0.125 | 0.13 | 9.89 | 5.63 | 4.20 |
| 7 | 300 | 7.95 | 0.125 | 0.13 | 16.90 | 11.70 | 5.20 |
| 8 | 500 | 7.95 | 0.125 | 0.13 | 10.40 | 5.95 | 4.45 |
| 9 | 300 | 7.45 | 0.075 | 0.19 | 8.35 | 5.95 | 5.00 |
| 10 | 500 | 7.45 | 0.075 | 0.19 | 22.00 | 16.70 | 5.30 |
| 11 | 300 | 7.95 | 0.075 | 0.19 | 26.90 | 22.30 | 4.60 |
| 12 | 500 | 7.95 | 0.075 | 0.19 | 26.70 | 21.70 | 5.20 |
| 13 | 300 | 7.45 | 0.125 | 0.19 | 14.00 | 8.57 | 5.43 |
| 14 | 500 | 7.45 | 0.125 | 0.19 | 8.22 | 3.03 | 5.19 |
| 15 | 300 | 7.95 | 0.125 | 0.19 | 10.10 | 4.87 | 5.23 |
| 16 | 500 | 7.95 | 0.125 | 0.19 | 8.24 | 3.05 | 5.19 |
| 17 | 200 | 7.70 | 0.100 | 0.16 | 8.37 | 3.20 | 5.17 |
| 18 | 600 | 7.70 | 0.100 | 0.16 | 15.30 | 10.60 | 4.70 |
| 19 | 400 | 7.20 | 0.100 | 0.16 | 26.30 | 21.10 | 5.20 |
| 20 | 400 | 8.20 | 0.100 | 0.16 | 11.70 | 6.67 | 5.23 |
| 21 | 400 | 7.70 | 0.050 | 0.16 | 27.00 | 21.80 | 5.20 |
| 22 | 400 | 7.70 | 0.150 | 0.16 | 9.90 | 4.87 | 5.03 |
| 23 | 400 | 7.70 | 0.100 | 0.10 | 8.37 | 3.20 | 5.00 |
| 24 | 400 | 7.70 | 0.100 | 0.22 | 26.80 | 21.60 | 5.20 |
| 25 | 400 | 7.70 | 0.100 | 0.16 | 11.50 | 6.27 | 5.23 |
| 26 | 400 | 7.70 | 0.100 | 0.16 | 14.70 | 9.41 | 5.29 |
| 27 | 400 | 7.70 | 0.100 | 0.16 | 9.99 | 4.69 | 5.30 |
| 28 | 400 | 7.70 | 0.100 | 0.16 | 12.50 | 7.22 | 5.28 |
| 29 | 400 | 7.70 | 0.100 | 0.16 | 11.40 | 6.17 | 5.23 |
| 30 | 400 | 7.70 | 0.100 | 0.16 | 8.40 | 3.11 | 5.29 |
To investigate four factors, CCD consisted of 30 experiments were designed with CCD model. In this model, each factor has five different levels including: −α (1 run), −1 (8 runs), 0 (12 runs), +1 (8 runs), +α (1 run). Center runs provided information about the presence of curvature in the system, and α value was calculated as α = (2n)1/4 where n is the number of factors.44
Performance of the process was evaluated by analyzing the obtained responses using the ANOVA table to evaluate the model.
The statistical characteristics of the regression models developed for the experimental data were compared in Table 3. According to the results, a quadratic model was identified as the best response surface model for the electrochemical response. The model in terms of actual input variables is as follows:
| Δi = 3.8 + 0.0149A − 3.3B + 46.6C − 26D − 0.0023AB + 0.0632AC − 0.0589AD | (1) |
| –5.5BC + 7.4BD − 249.2CD + 0.000008A2 + 0.238B2 + 63.8C2 + 48.5D2 |
| Source | Sequential p-value | Lack of fit p-value | R2a | Adjusted R2 | Predicted R2 | |
|---|---|---|---|---|---|---|
| a The correlation coefficient value must be in the range of 0–1, with the larger values being more desirable. | ||||||
| Linear | 0.2392 | <0.0001 | 0.1911 | 0.0617 | 0.2350 | |
| 2-Factor interaction | <0.0001 | 0.0022 | 0.8826 | 0.8209 | 0.7836 | |
| Quadratic | <0.0001 | 0.2135 | 0.9886 | 0.9780 | 0.9439 | Suggested |
| Cubic | 0.2720 | 0.2202 | 0.9960 | 0.9834 | 0.7347 | Aliased |
The model showed a p-value <0.0001, lack of fit p-value = 0.2135, correlation coefficient (R2) = 0.9886, adjusted correlation coefficient (Radj2) = 0.9780, predicted correlation coefficient (Rpred2) = 0.9439 was identified as the best response surface model for the electrochemical response. It can be seen that the numerical values of the correlation coefficient and the adjusted correlation coefficient are close to each other and both are more than 97%. The statistical quality of the quadratic model and its significance were assessed by analysis of variance (ANOVA).
The results of ANOVA for the quadratic model were shown in Table 4. According to this table, the Fisher ratio was equal to 93.02, which indicated high statistical validity and excellent matching to the response level. Moreover, p < 0.0001 implied the model was significant at 99.99% confidence level. The results also indicated that the lack of fit was not significant relative to the pure error. Based on ANOVA results, the main effects of A, C, D, interaction effects of AB, AC, AD, BD, CD and second order effects of A2, C2 and D2 were highly significant to the response at 99.9% of confidence level. The terms of B, B2 and BC had also significant effects on the response at >99% confidence level.
| Source | Sum of squares | Df | Mean square | F-Value | p-Value | Remark |
|---|---|---|---|---|---|---|
| Model | 2.258 × 10⁻¹⁰ | 14 | 1.613 × 10⁻¹¹ | 93.02 | <0.0001 | Significant |
| A | 2.667 × 10⁻¹¹ | 1 | 2.667 × 10⁻¹¹ | 153.82 | <0.0001 | Significant |
| B | 8.438 × 10⁻¹³ | 1 | 8.438 × 10⁻¹³ | 4.87 | 0.0434 | |
| C | 8.760 × 10⁻¹² | 1 | 8.760 × 10⁻¹² | 50.52 | <0.0001 | Significant |
| D | 7.370 × 10⁻¹² | 1 | 7.370 × 10⁻¹² | 42.51 | <0.0001 | Significant |
| AB | 5.176 × 10⁻¹² | 1 | 5.176 × 10⁻¹² | 29.85 | <0.0001 | Significant |
| AC | 4.001 × 10⁻¹¹ | 1 | 4.001 × 10⁻¹¹ | 230.73 | <0.0001 | Significant |
| AD | 5.006 × 10⁻¹¹ | 1 | 5.006 × 10⁻¹¹ | 288.69 | <0.0001 | Significant |
| BC | 1.891 × 10⁻¹² | 1 | 1.891 × 10⁻¹² | 10.90 | 0.0048 | Significant |
| BD | 4.951 × 10⁻¹² | 1 | 4.951 × 10⁻¹² | 28.55 | <0.0001 | Significant |
| CD | 5.588 × 10⁻¹¹ | 1 | 5.588 × 10⁻¹¹ | 322.26 | <0.0001 | Significant |
| A2 | 1.977 × 10⁻¹¹ | 1 | 1.977 × 10⁻¹¹ | 114.01 | <0.0001 | Significant |
| B2 | 6.086 × 10⁻¹³ | 1 | 6.086 × 10⁻¹³ | 3.51 | 0.0806 | |
| C2 | 4.366 × 10⁻¹² | 1 | 4.366 × 10⁻¹² | 25.18 | 0.0002 | Significant |
| D2 | 5.225 × 10⁻¹² | 1 | 5.225 × 10⁻¹² | 30.13 | <0.0001 | Significant |
| Residual | 2.601 × 10⁻¹² | 15 | 1.734 × 10⁻¹³ | |||
| Lack of fit | 2.101 × 10⁻¹² | 10 | 2.101 × 10⁻¹³ | 2.10 | 0.2135 | Not significant |
| Pure error | 5.000 × 10⁻¹³ | 5 | 1.000 × 10⁻¹³ | |||
| Core total | 2.284 × 10⁻¹⁰ | 29 |
Correspondence of the generated response surface model to the electrochemical responses is graphically illustrated in Fig. 7. The data were calculated by the Design Expert software through employing the values of four studied variables as inputs of the quadratic model (eqn (1)), and obtaining the corresponding Δi values. As shown in Fig. 7a, the model predicted Δi values very close to the diagonal line, which indicates that the obtained responses are very close to the predicted responses. Moreover, the normal probability plot given in Fig. 7b proves the existence of homogeneous error variances.
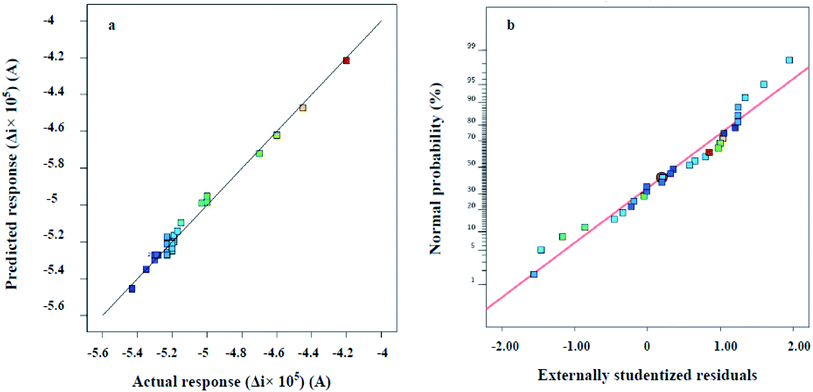 | ||
| Fig. 7 (a) Scatter plot of the predicted versus actual responses (b) normal plot of residuals response. | ||
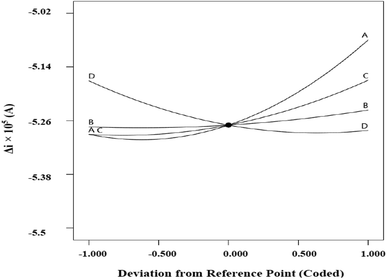
Fig. 8 indicates the net effects of the experimental variables on the electrochemical response. Based on the perturbation plot, clear nonlinear correlations exist between the response and the studied factors. As shown, the steepest curvature belonged to A (Fe2+ concentration) suggesting that Δi was very sensitive to the variable. Moreover, the response was more sensitive to D (modifier/gel mass ratio) compared to the other experimental variables.
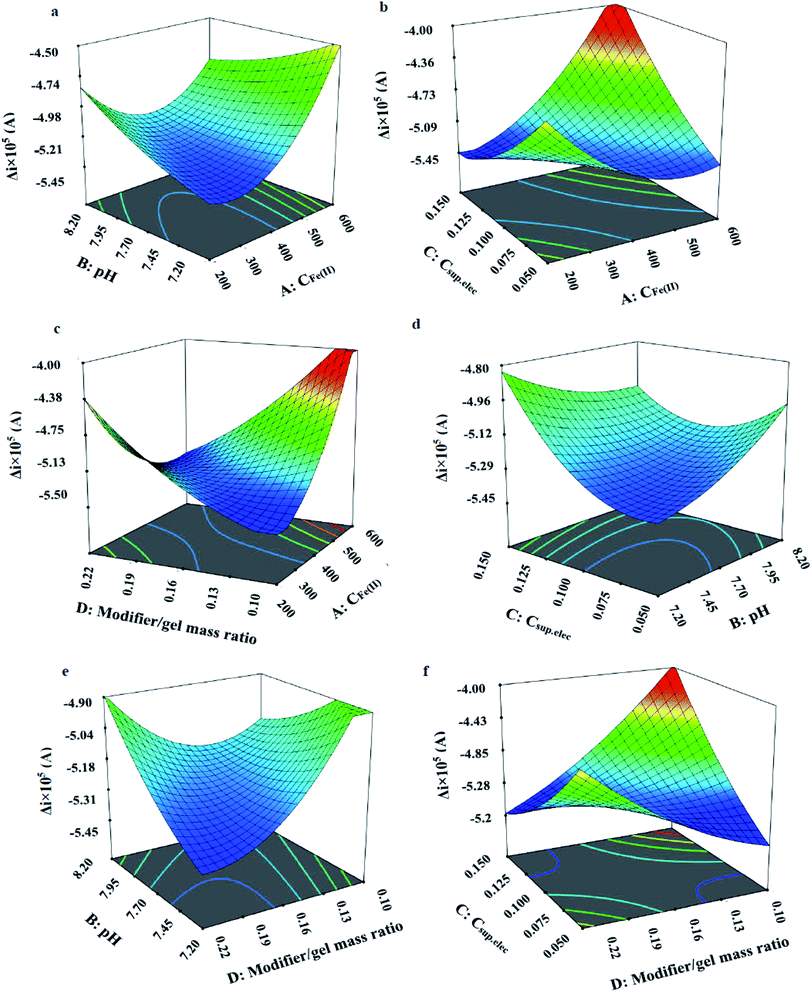
For accurate understanding of the significant two-factor interaction effects on the response of the model, response surface 3D plots as a function of the two independent variables, maintaining other variables at their middle levels were used.
Fig. 9(a) shows the significant combined effects of pH and the CFe2+. It can be seen, the response (Δi) was decreased by increasing the concentration of Fe2+ and after 400 μM of Fe2+, the response was increased. Also, the figure indicates that pH effect on the response depends on the concentration of Fe2+. Fig. 9(b) indicates the effects of Csup. elec and CFe2+. The plot shows that with increasing of the concentration of the supporting electrolyte, the response of the electrode decreased. The effect of CFe2+ in this plot is similar to the plot A. Fig. 9(c–f) indicate the effects of the modifier/gel ratio and CFe2+; Csup. elec and pH; modifier/gel ratio and pH; modifier/gel ratio and Csup. elec; respectively. According to the results, the optimal conditions including, CFe2+ = 319 μM, KCl supporting electrolyte concentration = 0.125 M, pH = 7.52 and modifier to gel ratio = 0.19 were displayed as the software output.
3.3. Electrochemical impedance spectroscopy
In order to detect the electrode/electrolyte interaction and obtain information about changes during modification and injection of PAEs on the electrode surface, the electrochemical impedance spectroscopy (EIS) technique was used. This method can provide crystal clear information regarding modification step, interface and PAEs-caused surface change after injection.45 Fig. 10(a) shows the Nyquist plot of the bare copper electrode. Based on circuit fit and simulation, the constructed circuit can be drawn as Fig. 10(b). Analysis of proposed circuit conducts us to these figures; total resistance (RT) = 542.8 KΩ and charge transfer resistance (RCT) = 468.8 KΩ. The Rsei assigned for solid Fe(OH)3 and electrolyte interface layer because of trace amount of Fe(OH)3 formation in just vicinity of the bare copper surface at pH 7.0.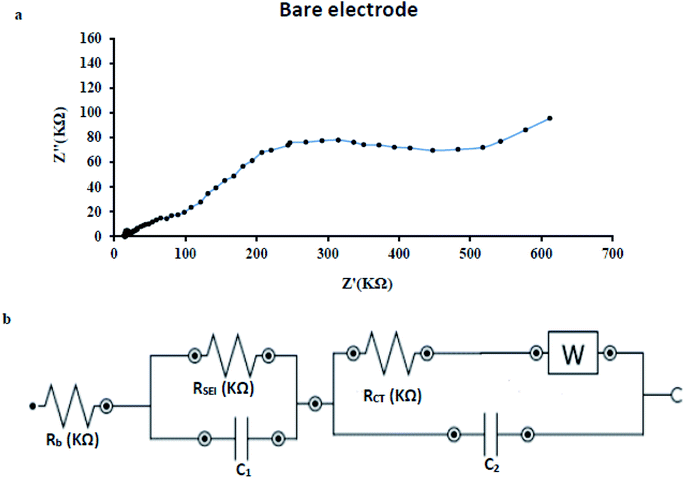 | ||
| Fig. 10 (a) Nyquist plot of the bare copper electrode (b) the constructed circuit for bare copper electrode under optimum condition, applied potential = −1 V and frequency = 1 × 10⁵ to 0.1 Hz. | ||
From the Nyquist plot of the modified electrode in Fig. 11(a), it is obvious that a new element should be added to equivalent circuit as drawn in Fig. 11(b). The RAZ element comprises from modification step and azolla paste layer. In this case; RT = 551.6 KΩ and RCT = 438.7 KΩ. The RSEI raises two times which means well-built coverage of bare surface of copper electrode during modification step. The modification step uses two materials; first, azolla powder which will increase resistance as an insulating matrix and second, EEG that amplifies charge transfer process but decrease resistance. These ingredients determine the resistance of prepared paste. According to above-mentioned data, the modified surface shows just 1.6% growth in RT and −6.4% diminishing in RCT. The recent findings reveal the most important role of EEG which makes electron transfer easier.
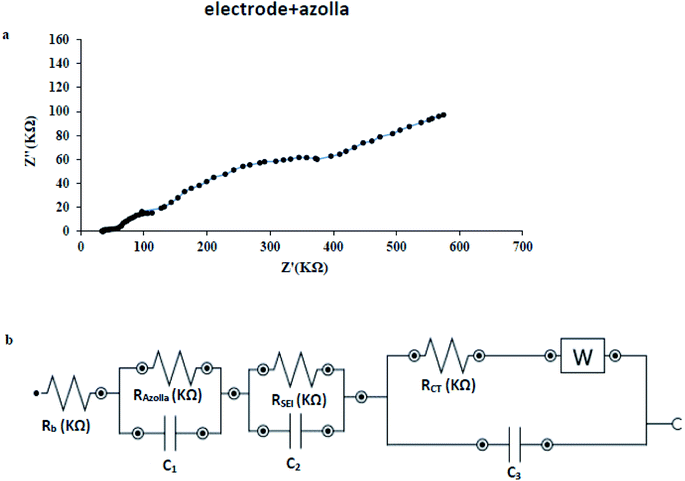 | ||
| Fig. 11 (a) Nyquist plot of azolla modified electrode (b) the constructed circuit for azolla modified electrode under optimum condition, applied potential = −1 V and frequency = 1 × 10⁵ to 0.1 Hz. | ||
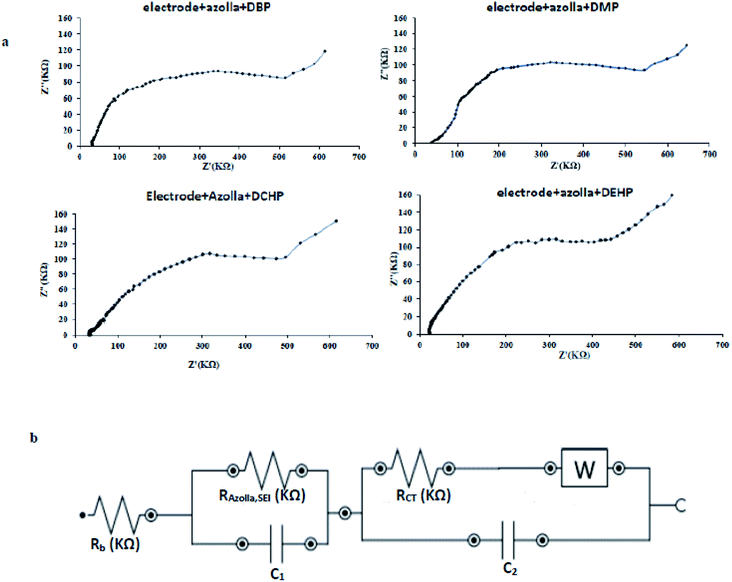
In Fig. 12a impedance spectrum of biosensor after blocker injection could be seen. Injection of PAEs as a blocker enlarges charge transfer resistance because of its blocking effect on biosensors surface. This remarkable increase caused the RSEI to be lost inside of the semicircle part. Blocker injection not only alters the resistance (RT = 614.5 KΩ, RCT = 563.9 KΩ), but also eliminates one part of circuit as seen in Fig. 12b. Both of surface modification and injection of blocker increase the resistance. These growths are equal to 1.6% in modification step and 28.5% in the blocker injection. For that reason (18 times magnification of RCT), blocker effectively interacts with the surface of biosensor and blocks active sites of oxidation and consequently oxidation peak appears on the lower position in DPV. Fig. 12 and its equivalent circuit lead us to the most interesting season of this research. The various RCT for PAEs were calculated and summarized in Table 5. The results in table, confirm the existence of correlation between type of PAEs and changes in resistance (ΔRCT). In the other words, structure of PAEs is a key factor affecting ΔRCT. So, this can be used in characterization of various PAEs based on ΔRCT at the same concentration level. By taking a closer look, spatial hindrance of PAEs play major role in RCT shifts. The smaller blocker provides the better point-by-point coverage of surface which conclude the bigger shift in charge transfer resistance.
The above-mentioned results, give us exciting sign of future opportunity for developing the impedimetric biosensor of PAEs. This biosensor will work based on the charge transfer resistance shifts versus changes of PAEs concentration. It is clear that the small changes in carbonyl group polarity will affect ΔRCT and probably bring selectivity for impedimetric biosensor of PAEs. Further research is needed to confirm these novel findings.
3.4. Analytical figures of merits of the proposed modified electrode
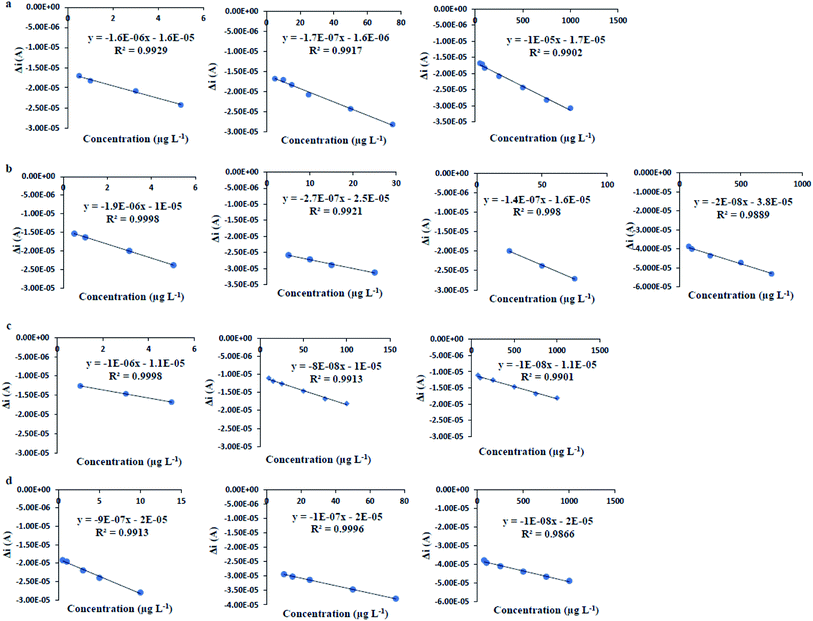
Determination of the figures of merit of an analytical method provide valuable information about the sensitivity, precision and linear range of method and help us to compare the performance of the method for a specific application. To investigate the quantitative parameters of the proposed modified electrode for determination of PAEs, the figures of merit were determined under the obtained optimum conditions (CFe2+ = 319 μM, Csup. elec = 0.125 M KCl, pH = 7.52, modifier to gel ratio = 0.19, injection volume of PAEs sample = 20 μL). In this study, separate standard solutions of each PAE in the concentration range of 0.1 to 5000 μg L−1 were used as blocker and the resulted DPV signals were measured. According to the results (Fig. 13 and Table 6), it was observed that with increasing in the concentration of DBP, as model compound, the current is decreased and the potential was shifted to the right and positive values. The current peak was extracted from differential pulse voltammograms and the current–concentration relationship was investigated.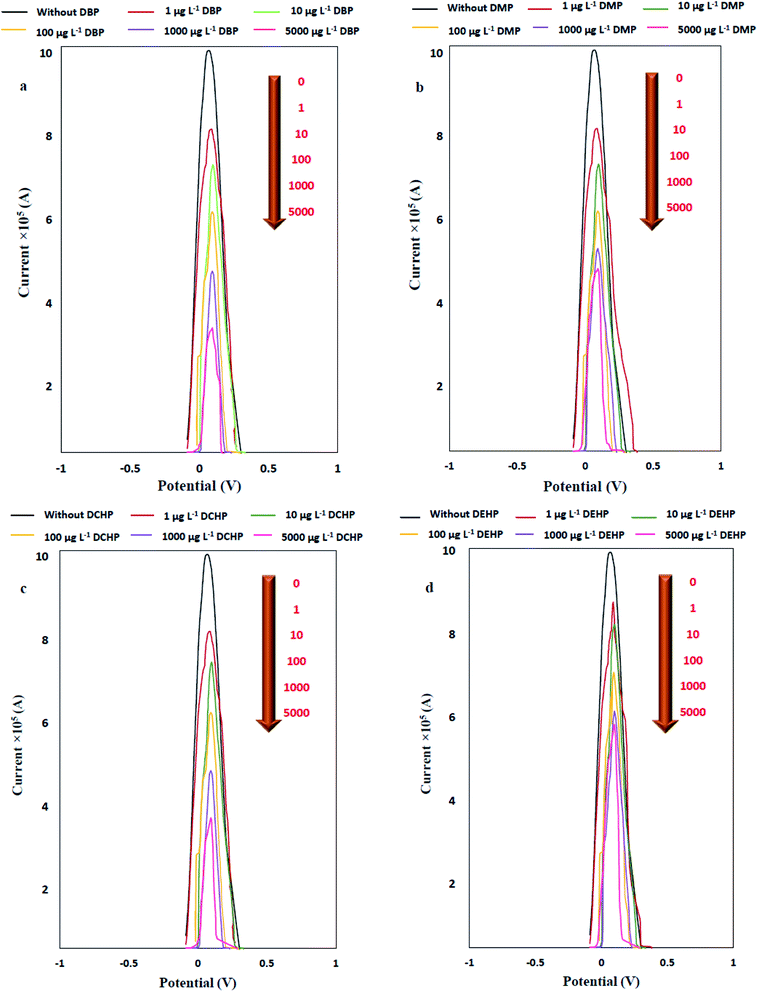 | ||
| Fig. 13 DPV signal of Fe2+/Fe3+ pair after PAEs addition in the concentration range of 1 to 5000 μg L−1 as blocker to the modified electrode. | ||
| CPAEs (μg L−1) | DBP | DMP | DCHP | DEHP | ||||||||
|---|---|---|---|---|---|---|---|---|---|---|---|---|
| i1a (×105) | i2b (×105) | −Δi (×105) | i1a (×105) | i2b (×105) | −Δi (×105) | i1a (×105) | i2b (×105) | −Δi (×105) | i1a (×105) | i2b (×105) | −Δi (×105) | |
| a i1 = DPV response of azolla modified copper electrode.b i2 = DPV response after PAEs injection. | ||||||||||||
| 0.1 | 9.91 | 8.23 | 1.68 | 9.91 | 8.46 | 1.45 | 9.91 | 8.52 | 1.39 | 9.91 | 8.79 | 1.11 |
| 0.5 | 8.20 | 1.71 | 8.09 | 1.82 | 8.37 | 1.53 | 8.71 | 1.19 | ||||
| 1 | 8.08 | 1.83 | 7.95 | 1.96 | 8.29 | 1.63 | 8.65 | 1.26 | ||||
| 3 | 7.83 | 2.08 | 7.59 | 2.32 | 7.91 | 2.00 | 8.44 | 1.47 | ||||
| 5 | 7.48 | 2.43 | 7.26 | 2.65 | 7.53 | 2.38 | 8.23 | 1.68 | ||||
| 10 | 7.09 | 2.82 | 7.11 | 2.80 | 7.20 | 2.71 | 8.10 | 1.81 | ||||
| 15 | 6.84 | 3.07 | 6.89 | 3.02 | 6.91 | 3.00 | 7.90 | 2.01 | ||||
| 25 | 6.69 | 3.22 | 6.69 | 3.22 | 6.79 | 3.12 | 7.70 | 2.21 | ||||
| 50 | 6.46 | 3.45 | 6.38 | 3.53 | 6.64 | 3.27 | 7.44 | 2.47 | ||||
| 75 | 6.09 | 3.82 | 6.13 | 3.78 | 6.26 | 3.65 | 7.16 | 2.75 | ||||
| 100 | 5.93 | 3.98 | 5.88 | 4.03 | 6.04 | 3.87 | 6.90 | 3.00 | ||||
| 250 | 5.83 | 4.08 | 5.76 | 4.15 | 5.90 | 4.01 | 6.80 | 3.11 | ||||
| 500 | 5.49 | 4.42 | 5.41 | 4.50 | 5.55 | 4.36 | 6.56 | 3.45 | ||||
| 750 | 5.04 | 4.87 | 5.23 | 4.68 | 5.18 | 4.72 | 6.26 | 3.62 | ||||
| 1000 | 4.47 | 5.43 | 5.01 | 4.90 | 4.59 | 4.53 | 6.07 | 3.84 | ||||
| 5000 | 3.07 | 6.83 | 4.51 | 5.40 | 3.28 | 6.62 | 5.59 | 4.32 | ||||
Limit of detection (LOD) and limit of quantification (LOQ) were obtained based on the equations  where Sb is the standard deviation of five replicates of blank measurements and m is the slope of the calibration curve (the relative standard deviation (RSD%, n = 5)) at the concentration level of 1000 μg L−1 was obtained as 0.51%. Furthermore, linear dynamic range (LDR) obtained from linear correlations between the response (Δi) and PAEs concentration, are given in Table 7 and Fig. 14.
| PAEs | LOD (μg L−1) | LOQ (μg L−1) | LDR (μg L−1) | Linear equation | Regression coefficient (R2) |
|---|---|---|---|---|---|
| DBP | 0.2 | 0.5 | 0.5–5 | y = −1.6 × 10⁻⁶x − 1.6 × 10⁻⁵ | 0.9929 |
| 5–75 | y = −1.7 × 10⁻⁷x − 1.6 × 10⁻⁶ | 0.9917 | |||
| 50–1000 | y = −1.0 × 10⁻⁵x − 1.7 × 10⁻⁵ | 0.9902 | |||
| DCHP | 0.2 | 0.5 | 0.5–5 | y = −1.9 × 10⁻⁶x − 1.4 × 10⁻⁵ | 0.9998 |
| 5–25 | y = −2.7 × 10⁻⁷x − 2.5 × 10⁻⁵ | 0.9921 | |||
| 25–75 | y = −1.4 × 10⁻⁷x − 1.6 × 10⁻⁵ | 0.9980 | |||
| 75–1000 | y = −2.0 × 10⁻⁸x − 3.8 × 10⁻⁵ | 0.9890 | |||
| DEHP | 0.4 | 1.0 | 1–5 | y = −1.0 × 10⁻⁶x − 1.1 × 10⁻⁵ | 0.9998 |
| 10–100 | y = −8.0 × 10⁻⁸x − 1.0 × 10⁻⁵ | 0.9913 | |||
| 75–1000 | y = −1.0 × 10⁻⁸x − 1.1 × 10⁻⁵ | 0.9901 | |||
| DMP | 0.2 | 0.5 | 0.5–10 | y = −7 × 10⁻⁷x − 2 × 10⁻⁵ | 0.9913 |
| 10–75 | y = −1 × 10⁻⁷x − 2 × 10⁻⁵ | 0.9996 | |||
| 75–1000 | y = −1 × 10⁻⁸x − 2 × 10⁻⁵ | 0.9866 |
Table 8 compares the figures of merit of the proposed azolla modified electrode with other electrodes employed for PAEs determination in previous studies. According to the data, RSD% values in this work were 0.51%, which is less than other studies. Moreover, the detection limit of this work is better than the second work given in the table. In this work, azolla was used as a modifier, which is an available fern in the environment. Using this method is easier, faster and cost-effective than other methods.
| PAEs | Methoda | Electrode | LDR | LOD | LOQ | RSD% | References |
|---|---|---|---|---|---|---|---|
| a EIS: electrochemical impedance spectroscopy, CV: cyclic voltammetry, DPV: differential pulse voltammetry, LSV: linear sweep voltammetry. | |||||||
| DEHP | EIS | Graphene electrode | 1.11–2.22 ng L−1 | 0.02 ng L−1 | — | — | 46 |
| DEHP | EIS | MIP with GFET | 50–200 μg L−1 | 25 μg L−1 | — | — | 47 |
| DEHP | LSV&CV&EIS | EST/PANI/CNT/Cu-NP modified GCE | 0.24–0.52 μM | 0.06 nM | 0.2 nM | 0.1–0.3 | 48 |
| DBP | CV&EIS | MIP with polypyrrole | 0.01–1.0 μM | 4.5 nM | — | 5.21 | 49 |
| DBP | CV&EIS | MGO@AuNPs-MIP | 2.5–5000 nM | 0.8 nM | — | 2.5 | 21 |
| DBP | CV&DPV | MIP with MMISPE | 10 -1 × 10 6 ng L−1 | 0.052 ng L−1 | — | 2.2–2.5 | 24 |
| DBP | LSV&CV&EIS | EST/PANI/CNT/Cu-NP modified GCE | 0.24–0.52 μM | 0.04 nM | 0.1 nM | 1–3.7 | 48 |
| DMP | LSV&CV&EIS | EST/PANI/CNT/Cu-NP modified GCE | 0.24–0.52 μM | 0.03 nM | 0.1 nM | 0.0–0.6 | 48 |
| DEHP, DBP, DMP, DCHP | DPV&EIS | Copper electrode modified with azolla | 0.5–5 μg L−1 (DBP, DCHP), 1–5 μg L−1 (DEHP) & 0.5–10 μg L−1 (DMP) | 0.2–0.4 μg L−1 | 0.7–1.5 μg L−1 | 0.51 | This study |
3.5. Applicability of the proposed modified electrode for determination of PAEs in real samples
Measurement of chemicals in real samples shows the applicability of the electrode to produce accurate and precise results in different matrices. To measure PAEs in real samples including sea water (Caspian Sea, Guilan, Iran), river water (Shafarood River, Masal, Guilan, Iran), well water (Lakani Street, Rasht, Guilan, Iran) and tap water (Rasht, Iran), the standard addition method was utilized. The results obtained from PAEs determination by azolla modified electrode are presented in Table 9. Clearly, achieving the recovery percentages in the range of 97.3–100.3% and RSD% values ranging 1.7 to 3.2 confirmed high precision and accuracy of the results.| Samples | PAEs | Added (μg L−1) | Found (μg L−1) | i1a (×105) | i2b (×105) | −Δi (×105) | Recovery% | RSDc% |
|---|---|---|---|---|---|---|---|---|
| a i1 = DPV response of azolla modified copper electrode.b i2 = DPV response after injection of PAEs solution.c RSD = standard deviation/mean. | ||||||||
| Tab water | DBP | 3.00 | 2.96 ± 0.05 | 9.906 | 7.832 | 2.074 | 98.7 | 1.7 |
| DCHP | 2.96 ± 0.08 | 7.944 | 1.962 | 98.7 | 2.7 | |||
| DEHP | 2.97 ± 0.08 | 8.509 | 1.397 | 99.0 | 2.6 | |||
| DMP | 2.96 ± 0.05 | 7.699 | 2.207 | 98.7 | 1.9 | |||
| Sea water | DBP | 3.00 | 2.99 ± 0.09 | 9.906 | 7.828 | 2.078 | 99.7 | 3.1 |
| DCHP | 2.92 ± 0.05 | 7.951 | 1.955 | 97.3 | 1.9 | |||
| DEHP | 2.97 ± 0.09 | 8.509 | 1.397 | 99.0 | 3.1 | |||
| DMP | 2.95 ± 0.08 | 7.699 | 2.207 | 98.3 | 2.7 | |||
| Well water | DBP | 3.00 | 2.94 ± 0.07 | 9.906 | 7.836 | 2.070 | 98.0 | 2.4 |
| DCHP | 2.97 ± 0.08 | 7.942 | 1.964 | 99.0 | 2.6 | |||
| DEHP | 2.95 ± 0.05 | 8.511 | 1.395 | 98.3 | 1.8 | |||
| DMP | 2.98 ± 0.08 | 7.697 | 2.209 | 99.3 | 2.6 | |||
| River water | DBP | 3.00 | 3.01 ± 0.08 | 9.906 | 7.824 | 2.082 | 100.3 | 2.7 |
| DCHP | 2.95 ± 0.09 | 7.945 | 1.961 | 98.3 | 3.2 | |||
| DEHP | 2.96 ± 0.07 | 8.510 | 1.396 | 98.7 | 2.4 | |||
| DMP | 2.97 ± 0.07 | 7.698 | 2.208 | 99.0 | 2.2 | |||
4. Conclusions
The azolla paste modified copper electrode for DPV determination of PAEs was investigated in this study. Injection of PAEs as blocking on the surface of the modified electrode for ferrous ions oxidation was conducted. The central composite design was used to optimize the effects of four experimental parameters including the concentrations of Fe2+ ions (CFe2+) and supporting electrolyte (Csup. elec), solution pH and modifier/gel mass ratio on the decrease in the anodic peak current of ferrous ions as the response. At the optimum conditions (CFe2+ = 319 μM, Csup. elec = 0.125 M, pH = 7.52 and modifier/gel mass ratio = 0.19), linear relationships between the DPV responses and PAEs concentrations were found and the limit of detection (LOD) and limit of quantification (LOQ) values were in the ranges of 0.2–0.4 μg L−1 and 0.5–1.0 μg L−1, respectively. With increasing PAEs concentration under a linear behavior, the DPV response (Δi) of anodic peak was increased. The proposed method was used for efficient, accurate and quick determination of PAEs in real water samples with RSD <3.2%.Conflicts of interest
The authors declare that they have no known competing financial interests or personal relationships that could have appeared to influence the work reported in this paper.Data availability statement
The data that support the findings of this study are available from the corresponding author upon reasonable request.Acknowledgements
The authors are grateful to Rasht Branch, Islamic Azad University and Department of Environment, Islamic Republic of Iran for supporting this study.References
- L. E. Johns, G. S. Cooper, A. Galizia and J. D. Meeker, Exposure assessment issues in epidemiology studies of phthalates, Environ. Int., 2015, 85, 27–39 CrossRef CAS PubMed.
- K. J. Johnson, N. E. Heger and K. Boekelheide, Of Mice and Men (and Rats): Phthalate-Induced Fetal Testis Endocrine Disruption Is Species-Dependent, Toxicol. Sci., 2012, 129(2), 235–248 CrossRef CAS PubMed.
- K. L. Howdeshell, C. V. Riber and V. S. Wilson, Mechanisms of action of phthalate esters, individually and in combination, to induce abnormal reproductive development in male laboratory rats, Environ. Res., 2008, 108(2), 168–176 CrossRef CAS PubMed.
- W. M. Kluwe, E. E. Mcconnell, J. E. Huff, J. K. Haseman, J. F. Douglas and W. V. Hartwell, Carcinogenicity testing of phthalate esters and related compounds by the National Toxicology Program and the National Cancer Institute, Environ. Health Perspect., 1982, 45, 129–133 CrossRef CAS PubMed.
- M. C. Zhang, Q. E. Wang and H. S. Zhuang, A novel competitive fluorescence immunoassay for the determination of dibutyl phthalate, Anal. Bioanal. Chem., 2006, 386(5), 1401–1406 CrossRef CAS PubMed.
- R. Planello, O. Herrero, J. L. Martinez and G. Marcillo, Comparative effects of butyl benzyl phthalate (BBP) and di(2-ethylhexyl) phthalate (DEHP) on the aquatic larvae of Chironomus riparius based on gene expression assays related to the endocrine system, the stress response and ribosomes, Aquat. Toxicol., 2011, 105(1), 62–70 CrossRef CAS PubMed.
- M. Huang, Y. Li and G. Gu, The effects of hydraulic retention time and sludge retention time on the fate of di-(2-ethylhexyl) phthalate in a laboratory-scale anaerobic–anoxic–aerobic activated sludge system, Bioresour. Technol., 2008, 99(17), 8107–8111 CrossRef CAS PubMed.
- X.-Z. Meng, Y. Wang, N. Xiang, L. Chen, Z. Liu, B. u, X. Dai, Y. H. Zhang, Z. Xie and R. Ebinghaus, Flow of sewage sludge-borne phthalate esters (PAEs) from human release to human intake: Implication for risk assessment of sludge applied to soil, Sci. Total Environ., 2014, 476–477, 242–249 CrossRef CAS PubMed.
- K. Hayashi, A. Nakae, Y. Fukushima, K. Sakamoto, T. Furuichi, K. Kitahara, Y. Miyazaki, C. Ikenoue, S. Matumotos and T. Toda, Contamination of rice by etofenprox, diethyl phthalate and alkylphenols: effects on first delivery and sperm count in mice, J. Toxicol. Sci., 2010, 35(1), 49–55 CrossRef CAS PubMed.
- S. Pflieger-Bruss, H. C. Schuppe and B. Schill, The male reproductive system and its susceptibility to endocrine disrupting chemicals, Andrologia, 2004, 36(6), 337–345 CrossRef CAS PubMed.
- A. Schecter, M. Lorber, Y. Guo, Q. Wu, S. H. Yun, K. Kannan, M. Hommel, N. Imran, L. S. Hynan, D. Cheng, J. A. Colacino and L. S. BirnBaum, Phthalate Concentrations and Dietary Exposure from Food Purchased in New York State, Environ. Health Perspect., 2013, 121(4), 473–479 CrossRef PubMed.
- B. Zhao, Y. Chu, Y. Huang, D. O. Hardy, S. Lin and R. S. Ge, Structure-dependent inhibition of human and rat 11β-hydroxysteroid dehydrogenase 2 activities by phthalates, Chem.-Biol. Interact., 2010, 183(1), 79–84 CrossRef CAS PubMed.
- Y. Huang, I. Li, J. M. Garcia, H. Lin, Y. Wang, P. Yan, L. Wang, Y. Tan, J. Luo, Z. Qiu, J. Chen and W. Shu, Phthalate levels in cord blood are associated with preterm delivery and fetal growth parameters in Chinese women, PLoS One, 2014, 9(2), e87430 CrossRef PubMed.
- A. Makhijani, IEER Comments on the US Environmental Protection Agency's Environmental Radiation Protection Standards for Nuclear Power Operations—Advance Notice of Proposed Rulemaking (ANPR)(40 CFR Part 190; Docket ID No. EPA-HQ-OAR-2013-0689), 2014 Search PubMed.
- C. S. Giam, H. S. Chan and G. S. Neff, Rapid and inexpensive method for detection of polychlorinated biphenyls and phthalates in air, Anal. Chem., 1975, 47(13), 2319–2320 CrossRef CAS PubMed.
- T. Dine, C. K. X. LUY, M. Cazin, C. L. Brunet, J. C. Cazin and F. Goudaliz, Rapid determination by high performance liquid chromatography of di-2-ethylhexyl phthalate in plasma stored in plastic bags, Biomed. Chromatogr., 1991, 5(2), 94–97 CrossRef CAS PubMed.
- X. L. Cao, Determination of phthalates and adipate in bottled water by headspace solid-phase microextraction and gas chromatography/mass spectrometry, J. Chromatogr. A, 2008, 1178(1–2), 231–238 CrossRef CAS PubMed.
- A. Khedr, Optimized extraction method for LC-MS determination of bisphenol A, melamine and di (2-ethylhexyl) phthalate in selected soft drinks, syringes, and milk powder, J. Chromatogr. B: Anal. Technol. Biomed. Life Sci., 2013, 930, 98–103 CrossRef CAS PubMed.
- M. S. Qureshi, J. Fischer, J. Barek and M. I. Bhanger, Voltammetric determination of aliphatic phthalate esters at a hanging mercury drop minielectrode and a meniscus modified silver solid amalgam electrode, Elect. Anal, 2010, 22(17-18), 1957–1962 CAS.
- S. Xiong, I. Cheng, L. He, M. Wang, X. Zhang and Z. Wu, Detection of di (2-ethylhexyl) phthalate through graphene-β-cyclodextrin composites by electrochemical impedance spectroscopy, Anal. Methods, 2014, 6(6), 1736–1742 RSC.
- X. Li, X. Wang, H. Duan and C. Luo, Electrochemical sensor based on magnetic graphene oxide@gold nanoparticles-molecular imprinted polymers for determination of dibutyl phthalate, Talanta, 2015, 131, 354–360 CrossRef CAS PubMed.
- S. Xiong, J. Cheng, L. He, D. Cai, X. Zhang and Z. Wu, Fabrication of β-cyclodextrin/graphene/1,10-diaminodecane composite on glassy carbon electrode and impedimetric method for di(2-ethyl hexyl) phthalate determination, J. Electroanal. Chem., 2015, 743, 18–24 CrossRef CAS.
- A. I. Zia, S. C. Mukhopadhyay, I. H. Al-Bahadly, P. L. Yu, C. P. Goonerate and J. Kosel, Introducing molecular selectivity in rapid impedimetric sensing of phthalates, in 2014 IEEE international instrumentation and measurement technology conference (I2MTC) proceedings, IEEE, 2014 Search PubMed.
- Z. Zhang, L. Luo, R. Cai and H. Chen, A sensitive and selective molecularly imprinted sensor combined with magnetic molecularly imprinted solid phase extraction for determination of dibutyl phthalate, Biosens. Bioelectron., 2013, 49, 367–373 CrossRef CAS PubMed.
- P. K. Pillai, S. Premalatha and S. Rajamony, Azolla-A sustainable feed substitute for livestock, Leisa. India, 2002, 4(1), 15–17 Search PubMed.
- W. Raja, P. Rathour, S. A. John and P. W. Rameteke, Azolla: An aquatic pteridophyte with great potential, Int. J. Adv. Res. Biol. Sci., 2012, 2(2), 68–72 Search PubMed.
- N. Alizadeh, S. Shariati and N. Besharati, Adsorption of crystal violet and methylene blue on azolla and fig leaves modified with magnetite iron oxide nanoparticles, Int. J. Environ. Res., 2017, 11(2), 197–206 CrossRef CAS.
- F. Shariati, S. Shariati and M. A. Amiri Moghaddam, Application of magnetite nanoparticles modified azolla as an adsorbent for removal of reactive yellow dye from aqueous solutions, Desalin. Water Treat., 2021, 212, 323–332 CrossRef CAS.
- N. Besharati, N. Alizadeh and S. Shariati, Removal of tetracycline from aqueous solution by azolla, fig leaves, egg shell and egg membrane modified with magnetite nanoparticles, Desalin. Water Treat., 2021, 1–11 Search PubMed.
- N. Choen-Shoel, Z. Barkay, D. Ilzycer, I. Gilath and E. Telor, Biofiltration of toxic elements by azolla biomass, Water, Air, Soil Pollut., 2002, 135(1), 93–104 CrossRef.
- M. R. Rahimi kooh, M. K. Dahri, L. B. Lim, L. H. Lim and S. L. Lee, Phytoextraction capability of Azolla pinnata in the removal of rhodamine B from aqueous solution: artificial neural network and random forests approaches, Appl. Water Sci., 2019, 9(4), 1–9 Search PubMed.
- J. D. Dick, C. Renault and A. J. Bard, Observation of single-protein and DNA macromolecule collisions on ultramicroelectrodes, JACKS, 2015, 137(26), 8376–8379 CrossRef CAS PubMed.
- S. Paramasivam, C. V. Raju, S. Hemalathas, J. Mathiyarasa and S. S. Kumar, Electrochemical Detection of Alloxan on Reduced Graphene oxide Modified Glassy Carbon Electrode, Elect. Anal, 2020, 32(6), 1273–1279 CAS.
- F. Laghrib, A. Farahi, M. Bakasse, S. Lahrich and M. A. El Mhammedi, Chemical synthesis of nanosilver on chitosan and electroanalysis activity against the p-nitroaniline reduction, J. Electroanal. Chem., 2019, 845, 111–118 CrossRef CAS.
- H. Li, C. Huang, Y. Li, W. Yang and F. Liu, Electrocatalytic reduction of trace nitrobenzene using a graphene-oxide@polymerized-manganese-porphyrin composite, RSC Adv., 2019, 9(39), 22523–22530 RSC.
- B. Liu, J. Yan, M. Wang and X. Wu, Electrochemical Sensor Based on Molecularly Imprinted Polymer for Determination of Nonylphenol, Int. J. Electrochem. Sci., 2018, 13, 11953–11960 CrossRef CAS.
- L. Zheng, C. Zhang, J. Ma, S. Hong, Y. She, A. M. El-Aty, Y. He, H. Yu, H. Liu and J. Wang, Fabrication of a highly sensitive electrochemical sensor based on electropolymerized molecularly imprinted polymer hybrid nanocomposites for the determination of 4-nonylphenol in packaged milk samples, Anal. Biochem., 2018, 559, 44–50 CrossRef CAS PubMed.
- M. Evans, Optimisation of manufacturing processes: a response surface approach, CRC Press, 2003, p. 791 Search PubMed.
- L. C. Sergio, V. A. Lemos, V. S. de Carvalho, E. G. da Silva, A. F. Queiroz, C. S. Felix, D. L. da Silva, G. B. Dourado and R. V. Oliveira, Multivariate optimization techniques in analytical chemistry - an overview, Microchem. J., 2018, 140, 176–182 CrossRef.
- M. Wadie, E. M. Abdel-Moety, M. R. Rezk and M. A. Tantay, Eco-friendly chiral HPLC method for determination of alfuzosin enantiomers and solifenacin in their newly pharmaceutical combination: method optimization via central composite design, Microchem. J., 2021, 165, 106095 CrossRef CAS.
- Z. Dahaghin, P. A. Kilmartin and H. Z. Mousavi, Novel ion imprinted polymer electrochemical sensor for the selective detection of lead(II), Food Chem., 2020, 303, 125–374 CrossRef PubMed.
- S. Bahrani, Z. Razmi, M. Ghaedi, A. Asfaram and H. Javadian, Ultrasound-accelerated synthesis of gold nanoparticles modified choline chloride functionalized graphene oxide as a novel sensitive bioelectrochemical sensor: optimized meloxicam detection using CCD-RSM design and application for human plasma sample, Ultrason. Sonochem., 2018, 42, 776–786 CrossRef CAS PubMed.
- J. Song, M. Huang, N. Jiang, S. Zheng, T. Mu, L. Meng, Y. Liu, J. Liu and G. Chen, Ultrasensitive detection of amoxicillin by TiO2-g-C3N4@AuNPs impedimetric aptasensor: Fabrication, optimization, and mechanism, J. Hazard. Mater., 2020, 391, 122024 CrossRef CAS PubMed.
- M. Ehyaee, F. Safa and S. Shariati, Magnetic nanocomposite of multi-walled carbon nanotube as effective adsorbent for methyl violet removal from aqueous solutions: response surface modeling and kinetic study, Korean J. Chem. Eng., 2017, 34(4), 1051–1061 CrossRef CAS.
- A. Kulikovsky, Proton and Electron Transport Impedance of Inactive Catalyst Layer Embedded in PEM Fuel Cell, J. Electrochem. Soc., 2021, 168(3), 034501 CrossRef CAS.
- X. Jiang, Y. Xie, D. Wan, F. Zheng and J. Wang, Enrichment-Free Rapid Detection of Phthalates in Chinese Liquor with Electrochemical Impedance Spectroscopy, Sensors, 2020, 20(3), 901 CrossRef CAS PubMed.
- S. Venkatesh, C. C. Yeung, Q. J. Sun, J. Zhuang, T. Li, R. K. Y. Li and V. A. L. Roy, Selective and sensitive onsite detection of phthalates in common solvents, Sens. Actuators, B, 2018, 259, 650–657 CrossRef CAS.
- J. Annamalai and N. Vasudevan, Detection of phthalate esters in PET bottled drinks and lake water using esterase/PANI/CNT/CuNP based electrochemical biosensor, Anal. Chim. Acta, 2020, 1135, 175–186 CrossRef CAS PubMed.
- G. Bolat, T. Yaman and S. Abaci, Molecularly imprinted electrochemical impedance sensor for sensitive dibutyl phthalate (DBP) determination, Sens. Actuators, B, 2019, 299, 127000 CrossRef CAS.
Footnote |
| † Electronic supplementary information (ESI) available. See DOI: 10.1039/d1ra04714k |
| This journal is © The Royal Society of Chemistry 2021 |


