 Open Access Article
Probing the ionic structure of FLiNaK–ZrF4 salt mixtures by solid-state NMR†
Rongshan Lanab,
Yiyang Liuab,
Ling Hanab,
Jing Yangab,
Huiqin Yina,
Min Gea,
Xiaobin Fu *a,
Hongtao Liu*a and
Yuan Qiana
aShanghai Institute of Applied Physics, Chinese Academy of Science, Shanghai 201800, China. E-mail: liuhongtao@sinap.ac.cn; fuxiaobin@sinap.ac.cn
bUniversity of Chinese Academy of Sciences, Beijing 100049, China
First published on 6th July 2021
Abstract
In this study, by applying 19F, 23Na and 7Li high-resolution NMR methods, the evolution of the [ZrxFy]4x−y local ionic structures in FLiNaK–ZrF4 salt mixtures were elucidated. K3ZrF7, Na3ZrF7 and Na7Zr6F31 crystal phases were identified when the melt salts were being solidified. The distribution of these [ZrxFy]4x−y species was dependent on the content of ZrF4 in FLiNaK eutectic salts. Moreover, K3ZrF7 phase transition from an orthorhombic lattice into a disordered cubic lattice was clarified, thereby causing dynamics of the coordinated F− ions to be reduced and the well-ordered crystal lattices to be destroyed. These mentioned results provide a further insight into the Zr–F based ionic structure and the formation of the disordered Zr–F structure in ZrF4-based eutectic salts.
1 Introduction
Fluoride eutectic salts have been studied extensively as a coolant or a fuel salt for nuclear reactor systems due to their ability to act as an effective heat transfer fluid at high temperature and low pressure and based on high radiation flux.1–4 Specific to the fuel salt, the concentration of free oxygen dianion O2− is rigorously regulated to avoid UO2![[thin space (1/6-em)]](https://www.rsc.org/images/entities/char_2009.gif) 5–7 being precipitated. As reported by Oak Ridge National Laboratory (ORNL), the zirconium tetrafluoride (ZrF4) can act as the O2− absorber additive in fuel salts for removing free O2− and avoiding UO2 being precipitated.8 However, ZrF4 exerts a significant coordination effect with fluorine anions to form a series of [ZrxFy]4x−y anions, in which the Zr–F–Zr bridges bond chains or networks. In addition, the competition of F− anions with other metal ions will drastically impact the salt properties (e.g., the melt viscosity and thermo-conductivity). Accordingly, the structure study on ZrF4 containing alkali fluorides is capable of presenting valuable information to support the novel fuel salt design, modeling and composition optimization.
5–7 being precipitated. As reported by Oak Ridge National Laboratory (ORNL), the zirconium tetrafluoride (ZrF4) can act as the O2− absorber additive in fuel salts for removing free O2− and avoiding UO2 being precipitated.8 However, ZrF4 exerts a significant coordination effect with fluorine anions to form a series of [ZrxFy]4x−y anions, in which the Zr–F–Zr bridges bond chains or networks. In addition, the competition of F− anions with other metal ions will drastically impact the salt properties (e.g., the melt viscosity and thermo-conductivity). Accordingly, the structure study on ZrF4 containing alkali fluorides is capable of presenting valuable information to support the novel fuel salt design, modeling and composition optimization.
To analyze the local structure and phase transformation of [ZrxFy]4x−y ions in AF–ZrF4 systems (A = Li+, Na+, K+), numerous experimental and theoretical studies have been conducted. According to Toth et al.,9 the effects of the ZrF4 concentration on the local ionic structure in LiF–NaF–ZrF4 eutectic salt were studied under Raman spectroscopy. Three zirconium-based species, i.e., [ZrF6]2−, [ZrF7]3− and [ZrF8]4−, coexist in the melts. As reported by Dracopoulos et al.,10 the 6-fold and 7-fold coordinated ionic species could form a series of small chains in KF–ZrF4 eutectic salt. With the F–Zr–F chains formed, the potential to form disordered network structures was illustrated. However, the specific evolution of the ionic structure and the crystal phase formation have been rarely investigated when complicated FLiNaK–ZrF4 salts are being solidified, as impacted by the overlapped characteristic signals of the IR or Raman spectroscopy. As compared with other IR or Raman spectroscopy, high-resolution NMR method refers to a powerful method to investigate the local structure of ZrF4-based systems.11–14 The high resolution of the NMR signals and the multiple detectable elements (7Li, 19F, 23Na) are capable of presenting specific microstructure information of the zirconium ions in complex salt system. For instance, Pauvert et al.15 reported the structural evolution of the free fluoride ions and other Zr–F ions in LiF–ZrF4 system. When ZrF4 component tended to increase, the bridged Zr–F structure was certified to form Zr–F–Zr chains based on 19F NMR method.
In this study, the coordination structure of [ZrxFy]4x−y in FLiNaK–ZrF4 eutectic salts was investigated specifically with high resolution solid-state NMR method.16 7Li, 19F and 23Na NMR spectra were adopted to analyze the chemical environment of zirconium ions, as well as the evolution of the different ionic species. As indicated from the results, K3ZrF7, Na3ZrF7 and Na7Zr6F31 crystal phases were formed when the melt FLiNaK–ZrF4 salts were being solidified. With the increase in the ZrF4 concentration, K3ZrF7 phase transition from the crystalline phase into the disordered cubic was characterized, thereby suggesting that the dynamics of the coordinated F− ions was reduced, and the well-ordered crystal lattices were destructed. This study helps clarify the Zr–F based ionic structure and the evolution of the [ZrxFy]4x−y species, which is critical to the solidification, energy storage and segregation of the ZrF4-based molten salts.
2 Experimental method
2.1 Samples preparation
The NaF (99.99%), KF (99.99%) and LiF (99.99%) were purchased from Aladdin and dehydrated by heating under vacuum at the temperature of 353 K for one week before use, and ZrF4 (99.99%) with a cover wrapped by beeswax from Strem Chemicals, Inc without further purification. The highly-purified LiF–NaF–KF (46.5![[thin space (1/6-em)]](https://www.rsc.org/images/entities/char_2009.gif) :
:![[thin space (1/6-em)]](https://www.rsc.org/images/entities/char_2009.gif) 11.5
11.5![[thin space (1/6-em)]](https://www.rsc.org/images/entities/char_2009.gif) :
:![[thin space (1/6-em)]](https://www.rsc.org/images/entities/char_2009.gif) 42 mol%) eutectic salt was supplied by Shanghai Institute of Organic Chemistry, Chinese Academy of Sciences (inductively coupled plasma optical emission spectroscopy, ICP-OES results were shown in Table S1†), without further purification. Considering the eutectic point of 727 K, the (FLiNaK)eut–ZrF4 eutectic solidification salts with various ZrF4 compositions were prepared in a glove box under dried argon by artificially mixing suitable proportions between (FLiNaK)eut salt and ZrF4 at 923 K for keeping 4 h then that directly cool down to room temperature in the furnace. The related information that the number of kinds of ions and the ratio of n(F−) to n(Zr4+) in FLiNaK–ZrF4 (0 ≤ XZrF4 ≤ 18.3 mol%) systems were shown in Table S2.† The eutectic NaF–ZrF4 (40.5 mol%) and NaF–ZrF4 (20 mol%) salts were synthesized by the following: 1 g of salts were weighted by artificially mixing suitable proportions in a nickel crucible, then they were heated to 923 K and 1073 K respectively, and kept for 4 hours. After that, the temperature was directly cooled down to room temperature in the furnace. In order to help the discussion, the chemical shift of major compositions measured in 19F MAS NMR was summarized in Table S3.†
42 mol%) eutectic salt was supplied by Shanghai Institute of Organic Chemistry, Chinese Academy of Sciences (inductively coupled plasma optical emission spectroscopy, ICP-OES results were shown in Table S1†), without further purification. Considering the eutectic point of 727 K, the (FLiNaK)eut–ZrF4 eutectic solidification salts with various ZrF4 compositions were prepared in a glove box under dried argon by artificially mixing suitable proportions between (FLiNaK)eut salt and ZrF4 at 923 K for keeping 4 h then that directly cool down to room temperature in the furnace. The related information that the number of kinds of ions and the ratio of n(F−) to n(Zr4+) in FLiNaK–ZrF4 (0 ≤ XZrF4 ≤ 18.3 mol%) systems were shown in Table S2.† The eutectic NaF–ZrF4 (40.5 mol%) and NaF–ZrF4 (20 mol%) salts were synthesized by the following: 1 g of salts were weighted by artificially mixing suitable proportions in a nickel crucible, then they were heated to 923 K and 1073 K respectively, and kept for 4 hours. After that, the temperature was directly cooled down to room temperature in the furnace. In order to help the discussion, the chemical shift of major compositions measured in 19F MAS NMR was summarized in Table S3.†
2.2 Solid-state NMR experiments
All of the 19F, 23Na and 7Li solid-state NMR experiments were performed on a Bruker Avance NEO 400 WB spectrometer with a magnetic field of 9.4 T, operating at frequencies of 376.61 MHz, 105.87 MHz and 155.55 MHz, respectively. The data was collected using a 3.2 mm double-resonance magic angle spinning (MAS) probe and a 15 kHz spinning rate at room temperature. In order to make quantitative experiments more effectively, the following conditions were set: the recycle delay (d1) were 5000 s, 100 s, 3000 s and the number of scans (ns) were 4, 16, 2 for 19F, 23Na and 7Li solid-state NMR experiments respectively. The chemical shifts of 19F, 23Na and 7Li were referenced using 1 M C2H4O2F3N aqueous solution (δ = −74.5 ppm), 1 M NaCl aqueous solution (δ = 0 ppm) and 1 M LiCl aqueous solution (δ = 0 ppm) at room temperature, respectively.2.3 X-ray diffraction measurements
X-ray diffraction was performed at room temperature on a Bruker D8 Advance using Cu-Kα (1.5406 Å) radiation (40 kV, 20 mA). All samples were mounted on the same sample holder and scanned from 2θ = 5° to 90° at a speed of 15° min−1.3 Results and discussion
3.1 Formation of the K3ZrF7 crystal phase in FLiNaK–ZrF4 eutectic salt
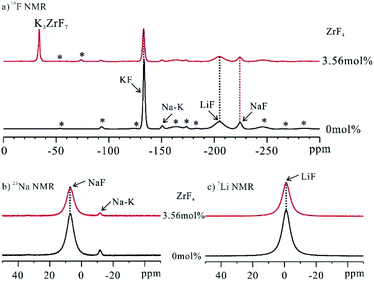
The ionic structure of FLiNaK–ZrF4 eutectic salts were firstly studied by comparing with FLiNaK. For the investigation of the local structure of the ions, 19F, 23Na and 7Li solid-state MAS NMR was performed (Fig. 1). The characteristic signal of ZrF4 could not be identified in 19F NMR spectrum of FLiNaK–ZrF4 (3.56 mol%) system (Fig. S1†),17,18 which demonstrated that no ZrF4 crystal phase existed in the eutectic salt samples. Comparing to the pure FLiNaK eutectic solidification salt in which the signal of KF, LiF and NaF was located at −132.9 ppm, −205.4 ppm and −224.6 ppm respectively,19 a novel signal at −35.0 ppm was detected, which complied well with the reported result that has the characteristic signal at −34.8 ppm20 and the XRD results of the authors (Fig. S2†). Moreover, the intensity of KF tended to decrease, which could be induced by the appearance of the new crystal phase. Given the mentioned analysis, the new crystal phase in FLiNaK–ZrF4 eutectic salt was demonstrated as K3ZrF7 crystals. It was interesting to note that no novel signals were identified in the spectrum of 23Na NMR and 7Li NMR (Fig. 1b and c), thereby suggesting that NaF and LiF were not involved in the complexation with ZrF4 in FLiNaK–ZrF4 system. Moreover, no major change in the integration of 23Na NMR and 7Li NMR signal of NaF and LiF appeared (Fig. S3 and S4†) when the composition of ZrF4 was changing from 0 to 13.6 mol%, indicating that NaF and LiF were not involved in the complexation with ZrF4 in FLiNaK–ZrF4 (XZrF4 ≤ 13.6) systems.To explore the formation of the new K3ZrF7 crystals in depth, FLiNaK–ZrF4 salts exhibiting different ZrF4 contents were synthesized. 19F NMR was performed on the mentioned samples to elucidate the variation of different crystals (Fig. S5†), and the integration of the relative intensity of the mentioned crystals was plotted in Fig. 2a.
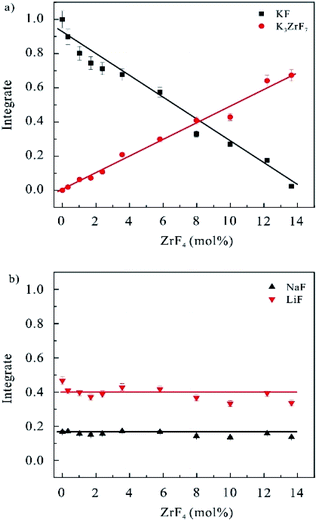 | ||
| Fig. 2 Integrate of the 19F NMR signals of different components in FLiNaK–ZrF4 (0 ≤ XZrF4 ≤ 13.6 mol%) systems versus the molar fraction of ZrF4 components. | ||
As the ZrF4 contents increased, the number of free fluoride ions F− of KF crystal phase declined linearly, while the amount of K3ZrF7 tended to increase. Under the concentrations of ZrF4 reaching 13.6 mol%, the signal of KF crystal phase at the −132.9 ppm almost disappeared, and the signal of K3ZrF7 phase at −35.0 ppm increased to the maximum. Thus, the added Zr4+ ions were coordinated with the free F− ions, and the K3ZrF7 crystal phase were formed first when the molten salt was being solidified as impacted by the weaker bonding energy between K+ and F− ions than Na+–F− and Li+–F− ion pairs. Fig. 2b plots the evolving curves of the 19F NMR signal intensity of NaF and LiF crystals. No variations of the integration were identified, which suggested that NaF and LiF crystals existed stably in FLiNaK–ZrF4 (0 ≤ XZrF4 ≤ 13.6 mol%) salts and were not involved in the complexation with ZrF4. Accordingly, only zirconium-based species K3ZrF7 was proven to be formed in FLiNaK–ZrF4 (0 ≤ XZrF4 ≤ 13.6 mol%) solidification salts.
3.2 Complexation between ZrF4 and NaF
Given the mentioned analysis, ionic structure of Na+ ions remained unchanged in FLiNaK–ZrF4 salts with ZrF4 concentration less than 13.6 mol%. To study the local ionic structure of Na+ ions in FLiNaK–ZrF4 salts, the 23Na NMR was performed on the salt samples exhibiting higher ZrF4 concentration (Fig. 3).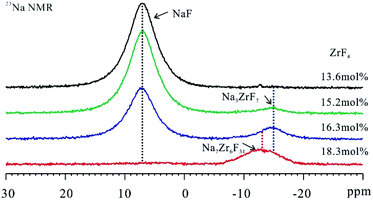 | ||
| Fig. 3 23Na NMR spectra of FLiNaK–ZrF4 (13.6 ≤ XZrF4 ≤ 18.3 mol%) eutectic solidification salts at ambient temperature. MAS spin rate in the mentioned experiments was set to 15 kHz. | ||
The signal of NaF at 7.1 ppm tended to decrease and finally disappeared in the spectrum of 23Na NMR with the rise of the ZrF4 content in FLiNaK salt. Moreover, the disappearance of the NaF crystal phase was verified according to 19F NMR results (Fig. S6†). It was therefore revealed that the complexation was developed between NaF and ZrF4 phases when ZrF4 component increased in FLiNaK. In addition, one broad signal at −15.0 ppm presented when 15.2 mol% of ZrF4 component was introduced to FLiNaK salt. With the composition of ZrF4 increasing further to 16.3 mol%, this signal remained and tended to increase. As suggested from this result, the Na-based coordinated crystal phases were formed in the mentioned salts. With the increase of the ZrF4 concentration (18.3 mol%), this signal would shift to the low field (−12.9 ppm) and together with the half-peak width increased. This may be caused by the distribution of different new formed Na-based coordinated crystal phases.
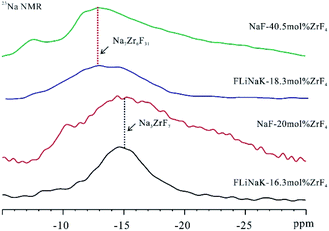
To confirm the ion structure of the mentioned two types of Na-based complexes, NaF–ZrF4 (40.5 mol%) and NaF–ZrF4 (20 mol%) binary systems were prepared for comparison. Fig. 4 illustrates the 23Na MAS NMR spectra for FLiNaK–ZrF4 (16.3 mol%) and FLiNaK–ZrF4 (18.3 mol%) salts. Obviously, one broad peak at −15.0 ppm was present in FLiNaK–ZrF4 (16.3 mol%) salt.
As inspired by Thoma et al.,21 Na3ZrF7 crystals should exist in NaF–ZrF4 (20 mol%), so the 23Na NMR signal at −15.0 ppm belonged to Na3ZrF7 crystal phase. Moreover, a broad signal at nearly −12.9 ppm was identified in NaF–ZrF4 (40.5 mol%) salt, which was reported to have Na7Zr6F31 crystal phase.21 Thus, the low field shift of the broad signal might be attributed to the formation of Na7Zr6F31 crystal phase in FLiNaK–ZrF4 (18.3 mol%) salt.
3.3 Phase transition of K3ZrF7 crystals
With the formation of Na3ZrF7 and Na7Zr6F31 crystals, a phase transition of K3ZrF7 crystals was also observed with the increase in the ZrF4 concentration. Fig. 5 presents the 19F NMR spectra of FLiNaK–ZrF4 (13.6 ≤ XZrF4 ≤ 18.3 mol%) eutectic salts. Three signals with different full widths at half maximum (FWHM), i.e., were located at −35.0 ppm, −36.9 ppm and −37.8 ppm in FLiNaK–ZrF4 (13.6 mol%) system, respectively. With the increase in the concentration of ZrF4, the strength of
  site decreased
  rapidly, and that of
  and
and  sites increased. Moreover, the new
  and
and  signals were observed to be broadened compared with
  In accordance with the existing reports,22–24 three crystal phases could exist in K3ZrF7, i.e., orthorhombic, tetragonal and disordered cubic lattice. Formation of the disordered cubic crystal phase always leads to the reduction of the crystallinity, and the broadening of the NMR signals should originate from the formation of the disordered crystal phase in the eutectic salt. Thus, for the higher ZrF4 systems, i.e., 16.3 mol% and 18.3 mol% of ZrF4 within FLiNaK, K3ZrF7 was a disordered cubic crystal. According to the gradual increase of
  and
and  signals and the gradual decrease of
  signals with the increase of ZrF4 contents, it can be deduced that the K3ZrF7 phase transition was changed from orthorhombic lattice into disordered cubic lattice.
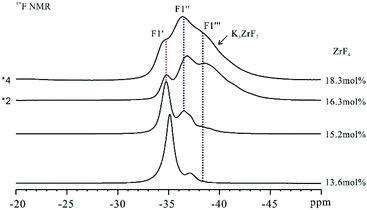 | ||
| Fig. 5 19F NMR spectra of FLiNaK–ZrF4 (13.6 ≤ XZrF4 ≤ 18.3 mol%) eutectic solidification salts at ambient temperature. MAS spin rate in the mentioned experiments was set to 15 kHz. | ||
The formation of different [ZrxFy]4x−y ionic structures and crystal phases during the solidification of the salt melts could be discussed. After heating into melts, Zr4+ ions tended to form a coordinated structure with F− ions as [ZrF7]3− or [ZrF6]2−, which is similar to the results that [AF7]3−, [AF8]4− and [AF9]5− coexisted in LiF–AF4 (A = Th4+ or U4+) molten salt.25,26 When cooling down, K3ZrF7 crystal phase would be formed first as impacted by the weak bonding energy of K+ and F− ions. The absence of [ZrF6]2− could be attributed to the instability of such Zr–F coordination in solid phase. With the concentration of ZrF4 increasing continuously, Na+ ions would be involved in the formation of the new crystal phases and cause Na3ZrF7 and Na7Zr6F31 crystal phases to appear. This result was well consistent with the existing results that diffusion coefficients of K+, Na+ and Li+ successively increased within molten AF–ZrF4 systems (A+ = Li+, Na+, K+).27 Moreover, the disordered cubic crystal phase of K3ZrF7 was formed as the ZrF4 contents increased in FLiNaK. The formation of such disordered structure should account for the broadening of the 19F NMR signals of the characteristic signals of K3ZrF7 in the FLiNaK–ZrF4 eutectic salts exhibiting higher ZrF4 concentration.
4 Conclusions
In brief, the evolution of the ionic structure of [ZrxFy]4x−y with the increase in ZrF4 compositions in FLiNaK solidification salts was investigated specifically with NMR method. As indicated from the results, the complexation reactions of ZrF4 tended to proceed as KF > NaF > LiF. Moreover, the predominant species (e.g., K3ZrF7, Na3ZrF7 and Na7Zr6F31) were formed, and the distribution of the mentioned species varied with the amount of ZrF4 compositions from 0 to 18.3 mol%. To begin with, the content of K3ZrF7 was increased to maximum when ZrF4 content was 13.6 mol%, then gradually decreased. However, the contents of Na3ZrF7 and Na7Zr6F31 was increased when ZrF4 contents was more than 13.6 mol%. Moreover, the phase of K3ZrF7 was observed to transit from orthorhombic lattice into disordered cubic lattice in the samples exhibiting higher ZrF4 concentration, thereby causing the well-ordered crystal lattices to be destructed. The mentioned results present a further insight into the local structure of ZrF4-based molten salt and glasses systems.Author contributions
Rongshan Lan: investigation; formal analysis; writing – original draft; Yiyang Liu: methodology; Ling Han: ICP-OES measurement analysis; Jing Yang and Huiqin Yin: resources of original materials; Min Ge and Yuan Qian: supervision; Hongtao Liu and Xiaobin Fu: conceptualization; writing – review and editing; funding acquisition.Conflicts of interest
There are no conflicts to declare.Acknowledgements
The authors are gratefully for financial support from the “Transformational Technologies for Clean Energy and Demonstration”, Strategic Priority Research Program of the Chinese Academy of Sciences (Grant No. XDA21000000). The author X. Fu acknowledges financial support from the Young Potential Program of Shanghai Institute of Applied Physics, Chinese Academy of Sciences.References
- C. W. Forsberg, P. F. Peterson and P. S. Pickard, Nucl. Technol., 2003, 144, 289–302 CrossRef CAS.
- J. Serp, M. Allibert, O. Beneš, S. Delpech, O. Feynberg, V. Ghetta, D. Heuer, D. Holcomb, V. Ignatiev, J. L. Kloosterman, L. Luzzi, E. Merle-Lucotte, J. Uhlir, R. Yoshioka and Z. M. Dai, Prog. Nucl. Energy, 2014, 77, 308–319 CrossRef CAS.
- J. C. Gehin and J. J. Powers, Nucl. Technol., 2016, 194, 152–161 CrossRef.
- H. Xu, Z. Dai and X. Cai, Nucl. Phys. News, 2014, 24, 24–30 CrossRef.
- M. Shen, H. Peng, M. Ge, C. Y. Wang, Y. Zuo and L. D. Xie, RSC Adv., 2015, 5, 40708–40713 RSC.
- H. Peng, M. Shen, Y. Zuo, H. Y. Fu and L. D. Xie, J. Nucl. Mater., 2018, 5, 256–264 CrossRef.
- H. Peng, Y. L. Song, N. Ji, L. D. Xie, W. Huang and Y. Gong, RSC Adv., 2021, 11, 18708–18716 RSC.
- W. R. Grimes. Reactor chemistry division annual prodress report, Washington, USA, 7th edn, 1962 Search PubMed.
- L. M. Toth, A. S. Quist and G. E. Boyd, J. Phys. Chem., 1973, 77, 1384–1388 CrossRef CAS.
- V. Dracopoulos, J. Vagelatos and G. N. Papatheodorou, J. Chem. Soc., Dalton Trans., 2001, 7, 1117–1122 RSC.
- A. L. Rollet and C. Bessada, Annu. Rep. NMR Spectrosc., 2013, 78, 149–207 CrossRef CAS.
- A. L. Rollet, H. Matsuura and C. Bessada, Dalton Trans., 2014, 44, 522–529 RSC.
- X. M. Dou, D. Mohan, C. U. Pittman and S. Yang, Chem. Eng. J., 2012, 198, 236–245 CrossRef.
- A. S. Vorob'ev, A. V. Suzdaltsev, P. S. Pershin, A. E. Galashev and Y. P. Zaikov, J. Mol. Liq., 2020, 299, 112241 CrossRef.
- O. Pauvert, D. Zanghi, M. Salanne, C. Simon, A. Rakhmatullin, H. Matsuura, Y. Okamoto, F. Vivet and C. Bessada, J. Phys. Chem. B, 2010, 114, 6472–6479 CrossRef CAS.
- J. F. Stebbins, Modern Methods in Solid-state NMR, ed. P. Hodgkinson, RSC, Cambridge, UK, 2018, ch. 9, pp. 262–288 Search PubMed.
- R. E. Youngman and S. Sabyasachi, Solid State Nucl. Magn. Reson., 2005, 27, 77–89 CrossRef CAS PubMed.
- C. Legein, F. Fayon, C. Martineau, M. Body, J.-Y. Buzare', D. Massiot, E. Durand, A. Tressaud, A. Demourgues, O. Pe'ron and B. Boulard, Inorg. Chem., 2006, 45, 10636–10641 CrossRef CAS.
- Y. Y. Liu, R. S. Lan, C. W. Dong, K. Wang, X. B. Fu, H. T Liu, Y. Qian and J. Q. Wang, J. Phys. Chem. C, 2021, 125(8), 4704–4709 CrossRef CAS.
- A. Rakhmatullin, M. Boča, J. Mlynáriková, E. Hadzimová, Z. Vasková, I. B. Polovov and M. Mičušík, J. Fluorine Chem., 2018, 208, 24–35 CrossRef CAS.
- C. J. Barton, W. R. Grimes, H. Insley, R. E. Moore and R. E. Thoma, J. Phys. Chem., 1958, 62, 665–676 CrossRef CAS.
- E. C. Reynhardt, J. C. Pratt, A. Watton and H. E. Petch, J. Phys. C: Solid State Phys., 1981, 14, 4701–4715 CrossRef CAS.
- M. T. Dov, M. C. Caracoche, A. M. Rodríguez, J. A. Martínez, P. C. Rivas and A. R. L. García, Phys. Rev. B: Condens. Matter Mater. Phys., 1989, 40, 11258–11263 CrossRef PubMed.
- M. V. Gorev, M. S. Molokeev, A. V. Kartashev, E. I. Pogoreltsev, S. V. Mel'nikova, N. M. Laptash and I. N. Flerov, J. Fluorine Chem., 2021, 241, 10967 CrossRef.
- X. J. Guo, H. L. Qian, J. X. Dai, W. H. Liu, J. T. Hu, R. F. Shen and J. Q. Wang, J. Mol. Liq., 2019, 277, 409–417 CrossRef CAS.
- C. Bessada, D. Zanghi, M. Salanne, A. Gil-Martin, M. Gibilaro, P. Chamelot, L. Massot, A. Nezu and H. Matsuura, J. Mol. Liq., 2020, 307, 112927 CrossRef CAS.
- M. Salanne, C. Simon, H. Groult, F. Lantelme, T. Goto and A. Barhound, J. Fluorine Chem., 2009, 130, 61–66 CrossRef CAS.
Footnote |
| † Electronic supplementary information (ESI) available. See DOI: 10.1039/d1ra04629b |
| This journal is © The Royal Society of Chemistry 2021 |

