DOI:
10.1039/D1RA04474E
(Paper)
RSC Adv., 2021,
11, 28169-28177
Flow behaviors of nitrogen and foams in micro-visual fracture-vuggy structures
Received
9th June 2021
, Accepted 20th July 2021
First published on 20th August 2021
Abstract
Nitrogen gas flooding and foam flooding have been widely used for oil and gas development in fracture-vuggy carbonate reservoirs. However, flow behaviors of nitrogen and foams are not very clear owing to the complex connectivity of fractures and vuggys. In this work, four types of micro-visual fracture-vuggy models were designed and fabricated to systematically investigate the dynamic flow behaviors of nitrogen and foam in fracture-vuggy structures. Results indicate that the swept volume and oil displacement efficiency can be improved more by foam flooding than by nitrogen flooding owing to the abilities of foams on mobility adjustment, IFT reduction, and oil emulsification. The presence of vuggy can strengthen the effect of gravity differentiation during nitrogen flooding, while foam flooding can diminish the gravity differentiation effect. Besides, pressure difference at the curved oil–gas interface plays a great role in the flow characteristics of nitrogen and foam. Moreover, the EOR rate is used to evaluate the EOR potential of nitrogen foam flooding technology over nitrogen flooding technology. This work systematically reveals the dynamic flow behaviors of nitrogen and foam in various micro visual fracture-vuggy structures, which can provide theoretical support for the development of the fracture-cavity reservoir.
1. Introduction
The geological reserves of carbonate reservoirs account for around 70% of the world's total oil and gas reserves. In particular, proven recoverable reserves account for about 50% of the world's proven recoverable reserves. Moreover, recovered oil and gas production account for about 60% of the world's total recovered oil and gas production, of which more than 30% are contributed by fracture-vuggy carbonate reservoirs.1–3 The most distinct feature of fracture-vuggy carbonate reservoirs is that the fracture is the main flow channel for fluids, while vuggy is the main storage space for crude oil.4 Tahe oilfield, located in northwest China, belongs to a typical fracture-vuggy carbonate reservoir. The sizes of fractures and vuggys are distributed in a wide range in Tahe oilfield. Therefore, Tahe oilfield shows extremely strong heterogeneity, and the fluids present partial dispersion characteristics due to the complex fracture-vuggy structures.5,6 The above-mentioned characteristics result in a lower oil recovery factor during the oil and gas development in fracture-vuggy carbonate reservoirs.
The traditional processes for developing oil and gas in fracture-vuggy carbonate reservoirs are generally divided into primary, secondary and tertiary stages. At the primary stage (using natural energy), the most obvious characteristic is that the oil production decline rate is very high although the initial production capacity is high. At the secondary stage, the oil production capacity can be improved to some extent after water is injected into reservoirs. However, there is a short time for oil stable production. Besides, water channelings are easy to be formed, resulting in a lower oil recovery factor.4 After water flooding, nitrogen is injected to further replenish the formation energy and start retaining oil on the top of storage space (referred to attic oil).7–9 The main mechanisms for nitrogen flooding are formation energy replenishment, crude oil swelling, and crude oil viscosity reduction. Yuan10 reported that the oil recovery factor can be increased by more than 40% by nitrogen flooding after water flooding. However, nitrogen channeling is easy to occur due to high injection rate, strong heterogeneity and the gravity differentiation effect.11,12 In order to delay the formation of gas channeling, foams have been widely used to increase the swept volume of gas.13 Apart from increasing the swept volume, foams can also adjust the mobility ratio, increase the oil displacement efficiency and then improve oil recovery. Telmadarreie14 found that foams can play a great role in the heavy-oil recovery process compared to gas injection, which is ascribed to the swept efficiency improvement.
Previously, we have reported the distribution characteristics of remaining oil and injected water and nitrogen in a 3D macro-visual fracture-vuggy model.4 Besides, systematical experiments on nitrogen and foam flow behaviors in macro visual models have been analyzed and reported.1,15–17 These macro-visual models are designed and fabricated based on the similarity criterion. In this work, four types of micro-visual fracture-vuggy models are designed and fabricated based on the SEM images of outcrop cores obtained from Tahe oilfield to observe and reveal the flow behaviors of fluids. Nitrogen and foams are separately injected into the models to observe the micro flow behaviors. Moreover, the relationships of nitrogen and oils, and foams and oils are also investigated. This work is expected to provide flow mechanisms support for the applications of nitrogen and foam flooding in fracture-vuggy carbonate reservoirs.
2. Materials and methods
2.1 Materials used
Aviation kerosene, liquid paraffin, sodium alpha-olefin sulfonate (AOS), Sudan III, partially hydrolyzed polyacrylamide (HPAM) with a molecular weight of 25 million (Beijing Hengju company), and nitrogen gas were used in this work without further purification. The simulated oil was prepared at a paraffin-to-kerosene volume ratio of 20![[thin space (1/6-em)]](https://www.rsc.org/images/entities/char_2009.gif) :1. The viscosity of simulated oil is 23 mPa s at room temperature. The simulated oil was dyed red using a small dosage of Sudan III to enhance the experimental visual effects. Simulated formation water was prepared in the laboratory to generate foams based on the ion content of oilfield formation water. The ion composition of oilfield formation water is shown in Table 1. The based foam liquid is made up of 0.3 wt% AOS and 0.15 wt% HPAM. The half-life of foams generated by 200 mL of based foam liquid (0.3 wt% AOS and 0.15 wt% HPAM at 235663.1 mg L−1 salinity condition) is 6.5 min.
:1. The viscosity of simulated oil is 23 mPa s at room temperature. The simulated oil was dyed red using a small dosage of Sudan III to enhance the experimental visual effects. Simulated formation water was prepared in the laboratory to generate foams based on the ion content of oilfield formation water. The ion composition of oilfield formation water is shown in Table 1. The based foam liquid is made up of 0.3 wt% AOS and 0.15 wt% HPAM. The half-life of foams generated by 200 mL of based foam liquid (0.3 wt% AOS and 0.15 wt% HPAM at 235663.1 mg L−1 salinity condition) is 6.5 min.
Table 1 Ion composition of the formation brine in Tahe oilfield
| Salinity (mg L−1) |
Ionic concentration (mg L−1) |
| Cl− |
Na+ + K+ |
Ca2+ |
Mg2+ |
SO42− |
HCO3− |
| 235663.1 |
146384.1 |
61385.4 |
25987.1 |
872.6 |
516.8 |
517.1 |
2.2 Design and fabrication of micro-visual model
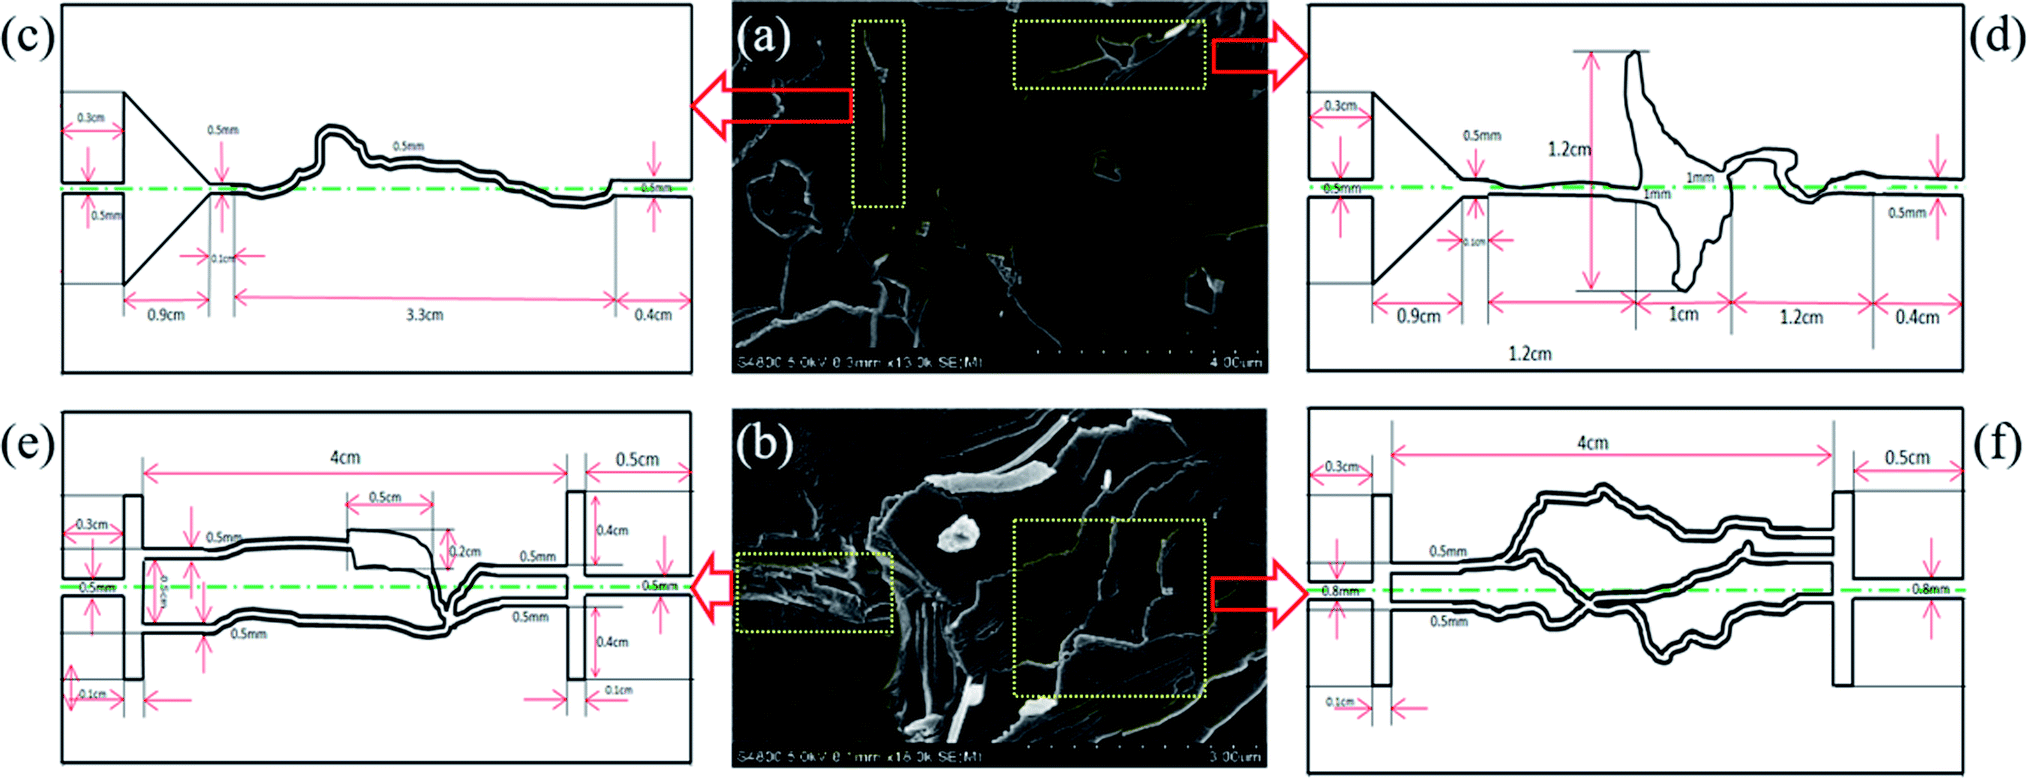
Several micro-visual models were designed and fabricated to observe and analyze the flow behaviors of nitrogen gas and nitrogen foams. In order to restore the connection modes of fractures and vuggys in actual reservoirs, we depicted four different fracture-vuggy connection modes. The structures and sizes of fractures and vuggys were depicted using the CAD software based on the SEM images of outcrop cores from Tahe oilfield. Then, a laser numerical control (NC) lathe was used to engrave the fractures and vuggys in half of the micro-visual fracture-vuggy models. Finally, a piece without fracture-vuggy structures and another piece with fracture-vuggy structures were glued and sealed precisely with epoxy. Lipophilic acrylic sheets were used to fabricate the micro-visual physical models, which is similar to the carbonate surface properties in actual reservoirs. Fig. 1 shows the SEM images of outcrop cores (a and b) and four fracture-vuggy models (tortuous fracture model (c), fracture-vuggy-fracture model (d), cross fracture-vuggy-fracture model (e), and multiple cross-complex fracture model (f)). The tortuous fracture model refers to a certain degree of tortuousness in a single fracture; the fracture-vuggy-fracture model refers to a continuous fracture interrupted by a single vuggy; cross fracture-vuggy-fracture model is a combination of staggered fractures and vuggys; multiple cross complex fractures model refers to multiple cross combinations of more than two fractures. The micro-visual models are 5 cm in length and 2 cm in width.
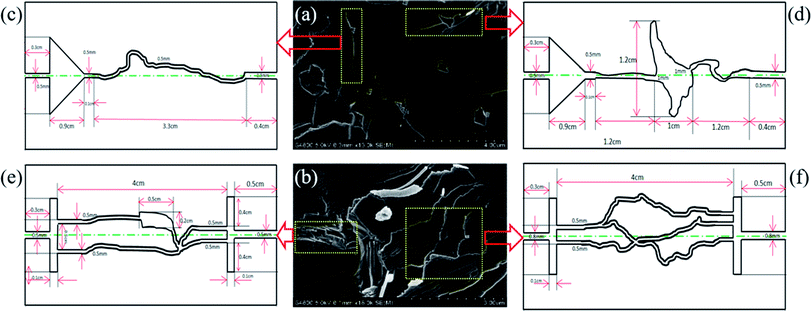 |
| | Fig. 1 Design and fabrication of microscopic visual models ((a and b) SEM images of outcrop cores sections; (c) tortuous fracture model; (d) fracture-vuggy-fracture model; (e) cross fracture-vuggy-fracture model; and (f) multiple cross complex fractures model). | |
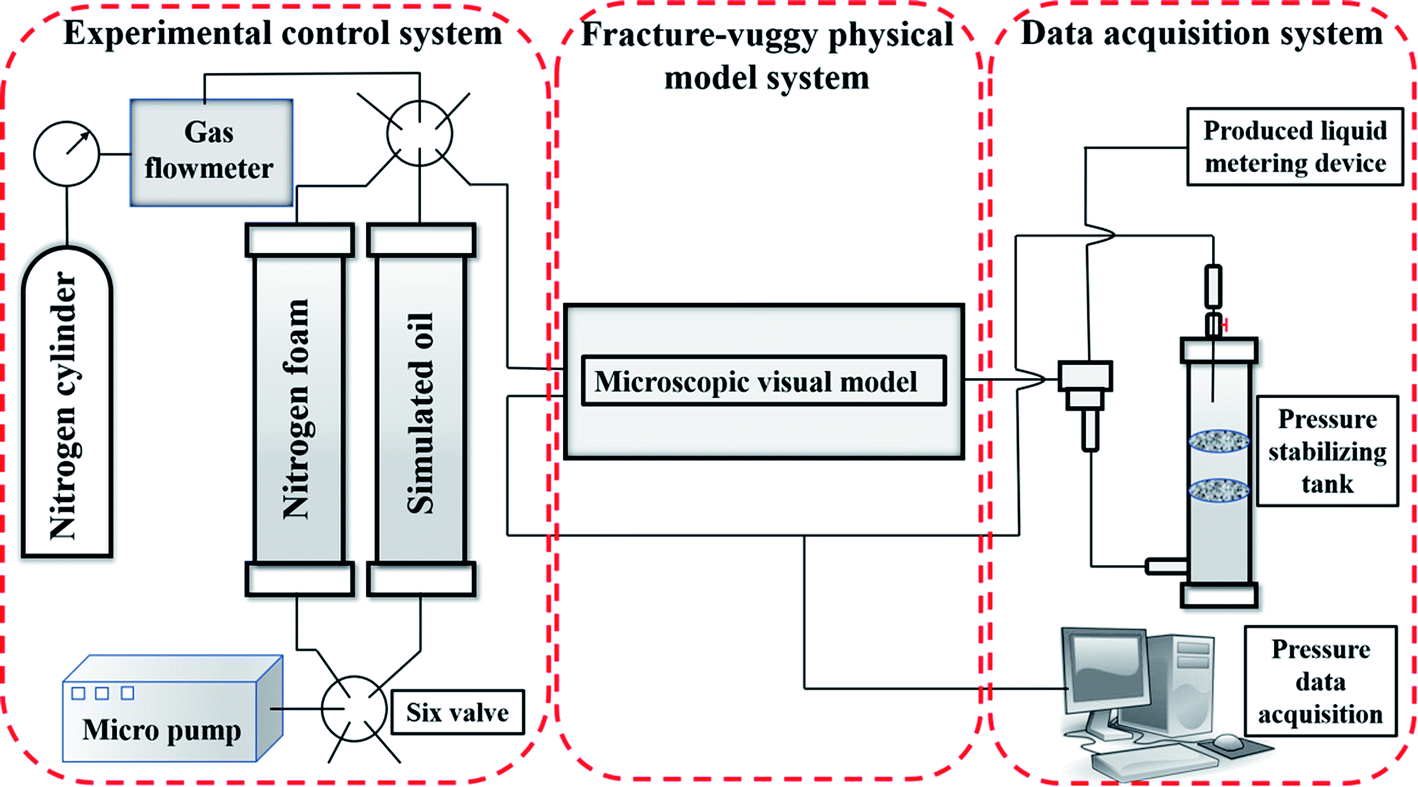
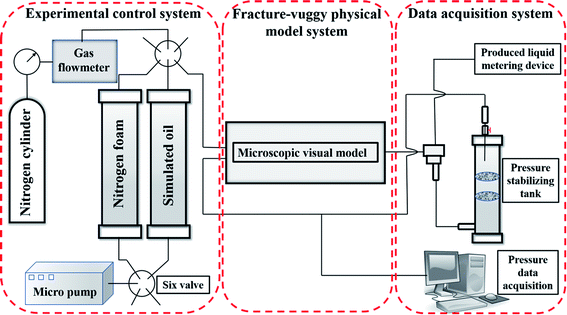
2.3 Experimental methods and procedures
The schematic diagram of flooding procedures in the micro-visual models is shown in Fig. 2. Briefly, micro-visual models were saturated with simulated oil completely; and then nitrogen gas as a displacing phase was injected to displace simulated oil. In order to distinguish micro flow behaviors of nitrogen gas and foams, a nitrogen foam as a displacing phase was also injected into the micro-visual model after it is saturated with simulated oil. The nitrogen foam was generated by the Waring blender method at a volume ratio of 1:1 of based foam liquid and nitrogen before injection. The injection velocity of nitrogen gas and foam is 50 μL min−1. The corresponding parameters of four micro-visual fracture-vuggy models are shown in Table 2.
 |
| | Fig. 2 Procedures of the micro-visual model experiment. | |
Table 2 The corresponding parameters of four micro-visual fracture-vuggy models
| Type of model |
Pore volume (μL) |
Nitrogen |
Foam |
| Time (min) |
Volume (μL) |
Rate (μL min−1) |
Time (min) |
Volume (μL) |
Rate (μL min−1) |
| Tortuous fracture |
44.6 |
2 |
100 |
50 |
2 |
100 |
50 |
| Fracture-vuggy-fracture |
108.4 |
4 |
200 |
50 |
6 |
250 |
50 |
| Cross fracture-vuggy-fracture |
78.5 |
3 |
150 |
50 |
5 |
250 |
50 |
| Multiple cross complex fractures |
91.8 |
4 |
200 |
50 |
5 |
250 |
50 |
A camera (Canon EOS-5D) was used to take videos during the above experiments. This camera was placed directly in front of the visual physical model. The pictures in this study were screenshots in the experimental videos.
3. Results and discussions
3.1 Flow characteristics of nitrogen gas and foam flooding in a tortuous fracture model
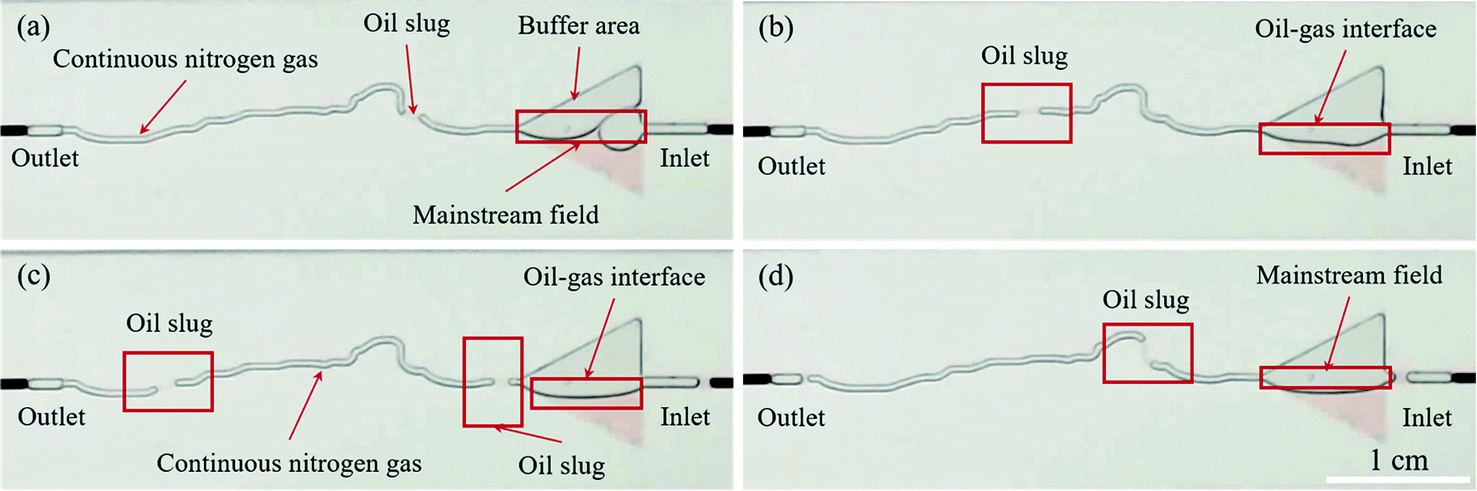
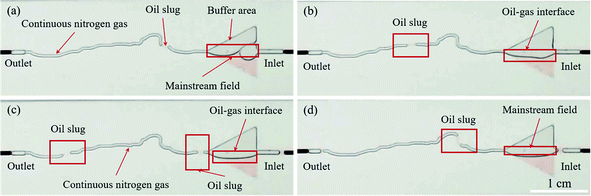
3.1.1 Nitrogen gas flooding. Fig. 3 shows the dynamic flow characteristics of nitrogen gas flooding in the tortuous fracture model. A triangle buffer area was designed and carved in the front of the fracture to make nitrogen gas flow more stable. It can be seen clearly that nitrogen gas flows in the tortuous fracture model in the form of continuous phase (Fig. 3(a)). An oil slug can be generated when nitrogen gas contacts with simulated oil in the mainstream field of the triangle buffer area. In this case, there are so few oil–gas interfaces in the fracture that the flow resistance of nitrogen gas is low, and then nitrogen gas breaks through the outlet quickly. The oil slug that contributes to oil recovery is driven by a continuous nitrogen gas phase (Fig. 3(b)). The oil–gas interface in the buffer area can be affected by nitrogen gas. Hence, a new oil slug is generated due to the fluctuation of the oil–gas interface in the triangle buffer area (Fig. 3(b and c)). Besides, it should be noted that no oil slug will be generated once the oil–gas interface is outside the mainstream field area in the buffer area (Fig. 3(d)).
 |
| | Fig. 3 Dynamic flow characteristics of nitrogen flooding in the tortuous fracture model. | |
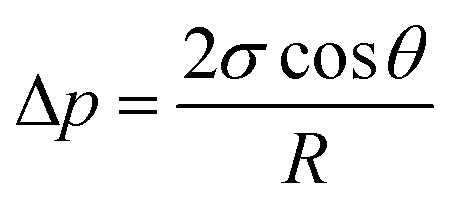
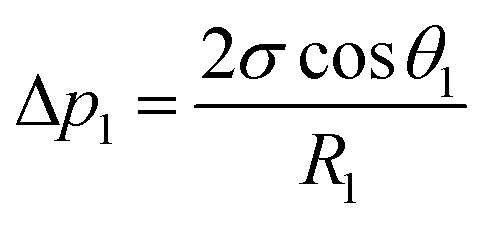
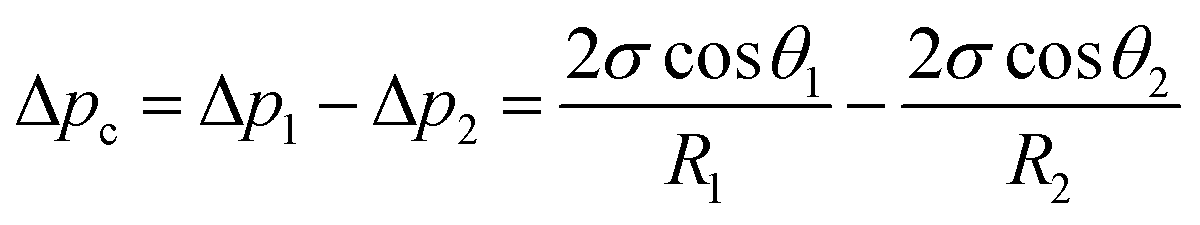
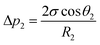
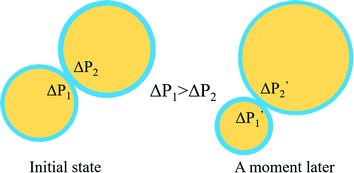
3.1.2 Nitrogen foam flooding. Fig. 4 displays the flow characteristics of nitrogen foam flooding in the tortuous fracture model. Obviously, the nitrogen foam accumulates and spreads in a fan shape in the triangle buffer area, leading to the improvement of swept efficiency (Fig. 4(a)). The nitrogen foam can be extruded and deformed, as it flows from buffer area to fracture in the presence of injection pressure. The schematic of foam deformation is shown in Fig. 4(b). According to Laplace's eqn (1), a pressure difference (Δp) is generated at the curved interface and points to the curved center. There are two different curvature radii in a bubble when foam flows from the buffer area to fracture. The pressure difference (Δp1) at the curved interface in the fracture can be calculated from eqn (2), while the pressure difference (Δp2) at the curved interface in the buffer area can be determined from eqn (3). The value of Δp is inversely proportional to the radius of the curved interface. Owing to R1/cosθ1 < R2/cosθ2, the value of Δp1 is greater than that of Δp2. Hence, the net pressure difference (Δpc) pointing to buffer area can be obtained from eqn (4), which impedes foam flow forward. The increase in the flow resistance of foams can enhance the sweep efficiency, resulting in a decrease in the residual simulated oil saturation in the buffer area. In order to overcome the net pressure difference (Δpc), the injection pressure (pI) must be greater than Δpc. Subsequently, nitrogen foam slug can be pushed forward to displace simulated oil (Fig. 4(c)). As the nitrogen foam is injected continuously, several foam slugs appear in the fracture to displace simulated oil. Compared to nitrogen gas flooding, there is little residual simulated oil in the buffer area after nitrogen foam injection (Fig. 4(d)):| |
 | (1) |
| |
 | (2) |
| |
 | (3) |
| |
 | (4) |
where Δp represents the pressure difference at the curved interface; R/cosθ represents the radius of the curved interface; σ is the surface tension of simulated oil and nitrogen gas; and θ is the contact angle.
 |
| | Fig. 4 Dynamic flow characteristics of nitrogen foam flooding in the tortuous fracture model. | |
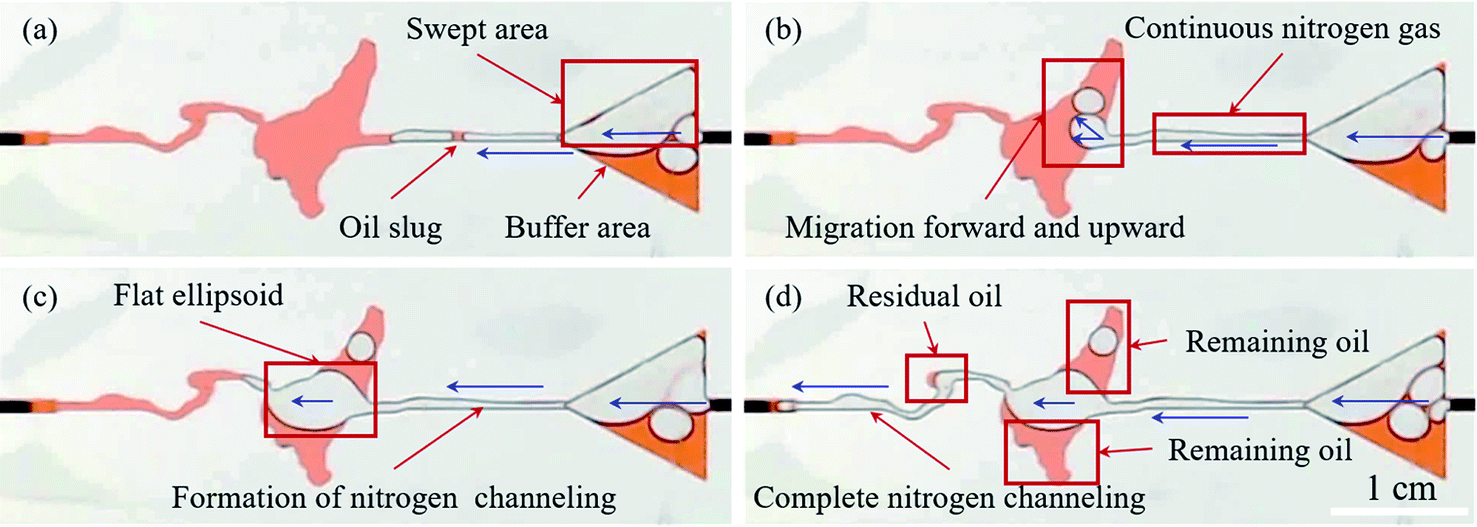
3.2 Flow behaviors of nitrogen gas and foam flooding in the fracture-vuggy-fracture model
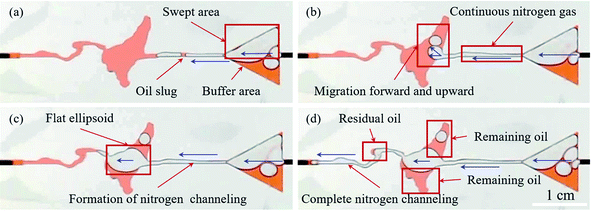
3.2.1 Nitrogen gas flooding. Flow behaviors of nitrogen gas in the fracture-vuggy-fracture model are exhibited in Fig. 5. A buffer area with a triangular shape was also carved in the front of the fracture inlet. It can be seen that the simulated oil in the top of buffer area was first displaced due to the density difference between simulated oil and nitrogen gas, shown in Fig. 5(a). Nitrogen gas flows forward as a continuous phase and then enters the vuggy located between two fractures. Nitrogen gas migrates forward and upward in the vuggy under the influence of displacement pressure gradient and gravity differentiation (Fig. 5(b)). The effect of gravity differentiation on the oil–gas interface or flow characteristics still exists when nitrogen gas migrates forward in fractures. Wen1 systematically studied the migration characteristics of nitrogen gas in fractures with different values of opening width. The results indicated that the flow pattern of nitrogen gas in fractures can be affected by gravity differentiation of displacing and displaced phase. The swept area of nitrogen gas is only a flat ellipsoid after nitrogen gas enters into the vuggy. Then, nitrogen gas quickly breaks through the vuggy and enters into the next fracture, as shown in Fig. 5(c). This phenomenon is also a precursor to the formation of nitrogen channeling. With the continuous injection of nitrogen gas, a complete nitrogen channeling is formed from the inlet to the outlet, leading to a stable oil recovery factor. The remaining oil concentrating in the vuggy and residual oil left in the corner of fracture can be seen clearly in the fracture-vuggy-fracture model after finishing nitrogen gas flooding.
 |
| | Fig. 5 Dynamic flow behaviors of nitrogen gas flooding in the fracture-vuggy-fracture model. | |
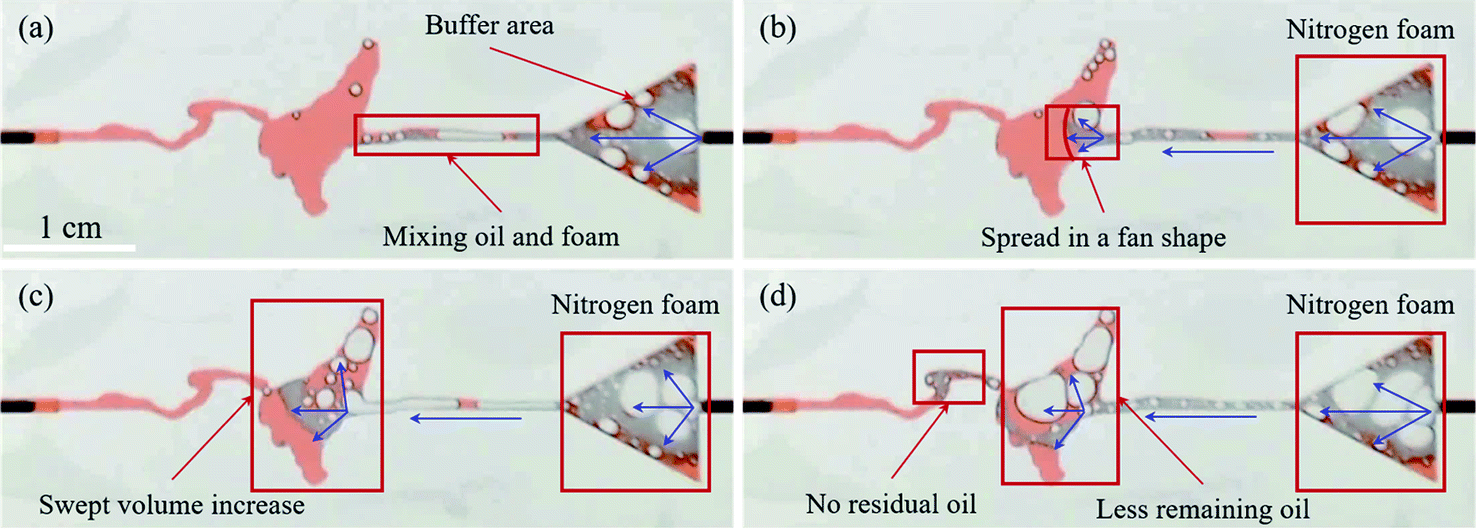
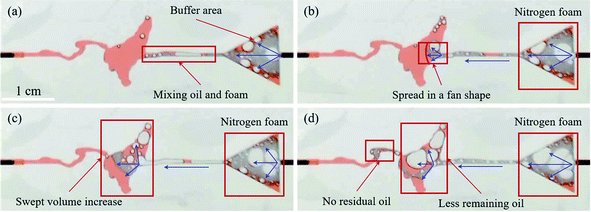
3.2.2 Nitrogen foam flooding. Fig. 6 exhibits the dynamic flow behaviors of nitrogen foams in the fracture-vuggy-fracture model. At the beginning of foam injection (Fig. 6(a)), the foam accumulates in the buffer area and then almost occupies the whole space, which is different from the phenomenon observed from Fig. 5(a). The effect of gravity differentiation is weakened during foam injection. It can be seen that the foam mixes with simulated oil since nitrogen foam contacts with simulated oil (Fig. 6(a)). The mobility ratio can be controlled by this mixing effect during foam injection. Fig. 6(b) shows that the nitrogen foam evenly spreads in a fan shape as it flows from fracture to vuggy. Compared to Fig. 5(c), the larger swept volume in the vuggy can be observed due to the fan sweep pattern (Fig. 6(c)). Moreover, the simulated oil in the corner of fracture can be started and recovered during foam injection (Fig. 6(d)). The foam membrane contains surfactants, which can reduce interfacial tension and emulsify simulated oil, leading to higher oil recovery factor.18 Obviously, there is less remaining oil and no residual oil left in the same position compared to Fig. 5(d).
 |
| | Fig. 6 Dynamic flow characteristics of nitrogen foam flooding in the fracture-vuggy-fracture model. | |
3.3 Flow behaviors of nitrogen gas and foam flooding in the cross fracture-vuggy-fracture model
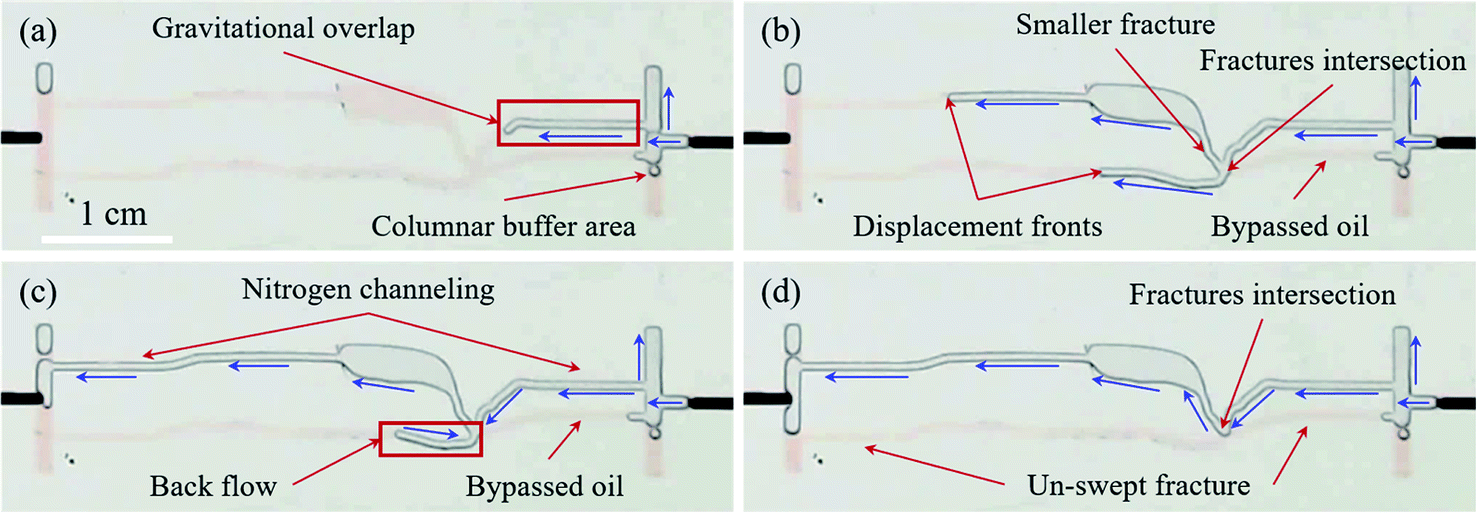
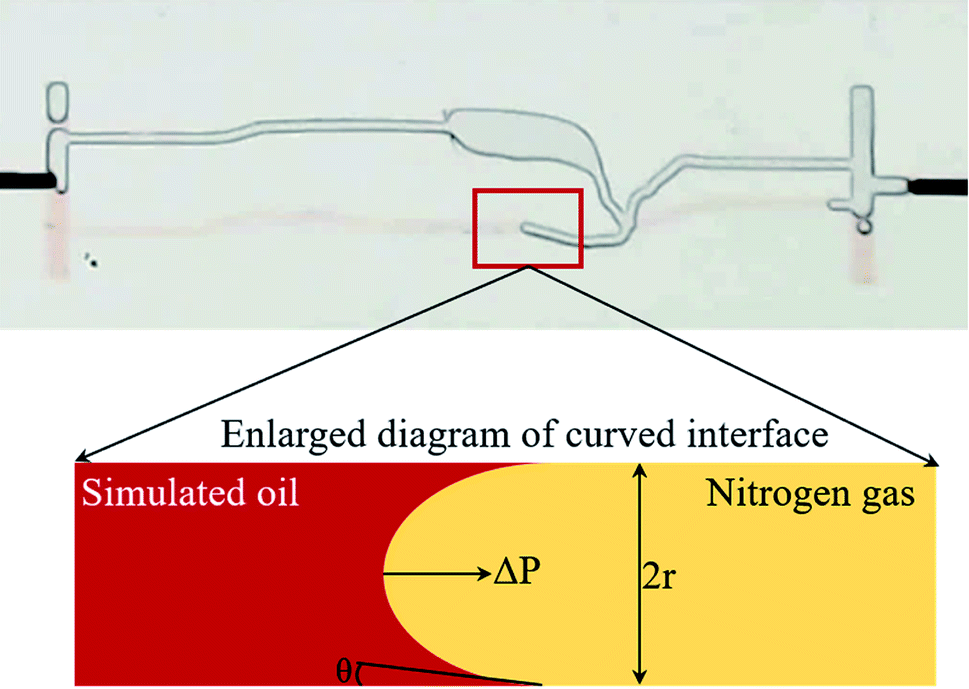
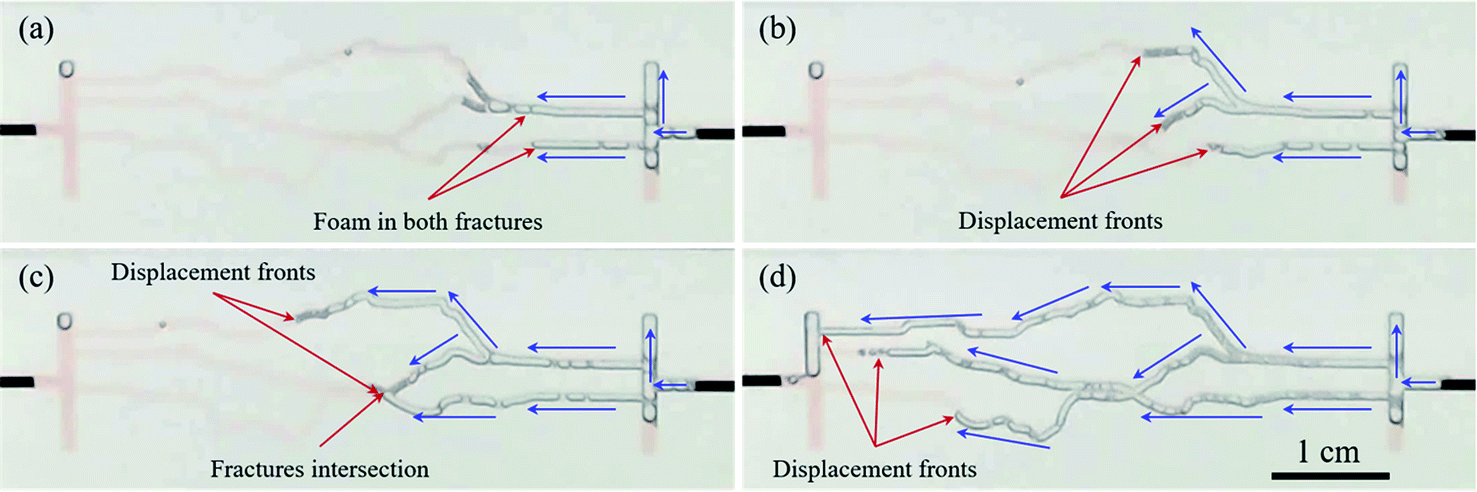
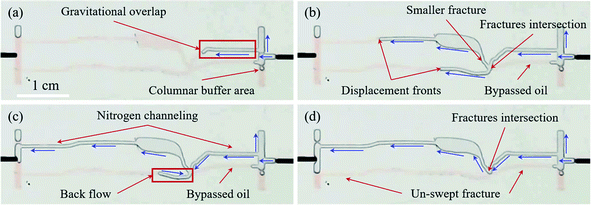
3.3.1 Nitrogen gas flooding. Dynamic flow characteristics of nitrogen flooding in the cross fracture-vuggy-fracture model are shown in Fig. 7. Columnar buffer areas were designed and carved in the front and behind of fractures. It can be seen that nitrogen gas prefers to flow through the upper fracture due to the more obvious effect of gravity differentiation (Fig. 7(a)). This preference is bound to result in a large amount of bypassed oil in the lower fracture. When nitrogen gas comes to the fractures intersection, it enters into the upper and lower fractures at the same time. The result can be ascribed to the smaller fracture width with higher flow resistance in the upper fracture near fractures intersection, as shown in Fig. 7(b). However, the position of nitrogen displacement front in the upper fracture is obviously in front of that in the lower fracture. This result can be owing to the presence of lower flow resistance of nitrogen gas in the upper vuggy. From Fig. 7(c), an interesting phenomenon that nitrogen gas in the lower fracture flows backward when nitrogen gas breaks through the outlet from the upper fracture can be investigated. The flow characteristics of a specific fluid are controlled by a pressure gradient. Almost all injection pressure (energy) is vented through the outlet after nitrogen gas breaks through from the upper fracture. In the lower fracture, the pressure difference (Fig. 8) at the curved interface of nitrogen gas and simulated oil points to the inlet according to Laplace's eqn (1). Owing to the presence of pressure difference (Δp), it is possible for nitrogen gas to flow backward gradually until nitrogen gas returns to the fractures' intersection (Fig. 7(d)). It can also be seen that none of the simulated oil in the lower fracture is recovered due to the formation of nitrogen channeling. In this case, the oil recovery factor of nitrogen gas flooding is very low.
 |
| | Fig. 7 Dynamic flow feature of nitrogen flooding in the cross fracture-vuggy-fracture model. | |
 |
| | Fig. 8 Analysis of pressure difference at the curved interface. | |
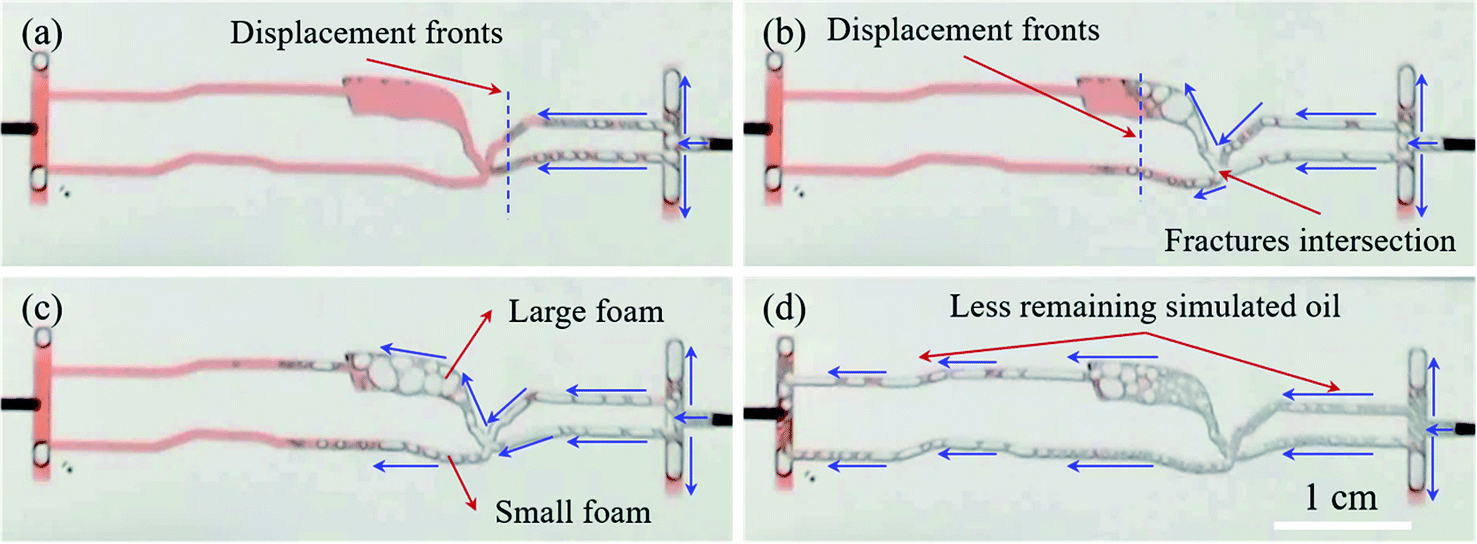
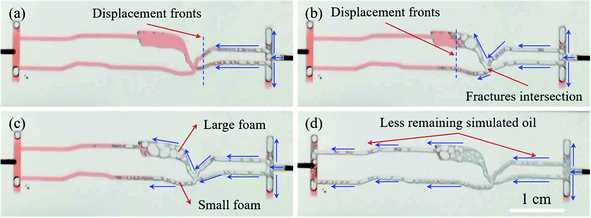
3.3.2 Nitrogen foam flooding. Fig. 9 displays the dynamic flow characteristics of nitrogen foam flooding in the cross fracture-vuggy-fracture model. It can be seen that the swept path of the foam is completely different from that of nitrogen gas in Fig. 7(a). The nitrogen foam spreads evenly in the upper and lower fractures, as shown in Fig. 9(a). The migration rates of the nitrogen foam in the upper and lower fractures are the same because the displacement fronts in both fractures are in the same position. Behind the fracture intersection, the nitrogen foam still evenly migrates forward in the upper fracture-vuggy and lower fracture (Fig. 9(b)). It should be noted that the size of foams in the upper vuggy and lower fracture is different (Fig. 9(c)). The size of foams in vuggy is significantly larger than that in the fracture. The mechanism of “foam with large size gets larger while foam with small size gets smaller” can be used to explain the observed phenomenon. According to Laplace's eqn (1), the pressure difference (Δp) at the curved interface is inversely proportional to the radius of the curved interface. In other words, the Δp generated by the small foam is greater than that produced by a large foam, which facilitates the flow of nitrogen gas from a small foam into a large one. The mechanism diagram of foam size change is shown in Fig. 10. With continuous injection, the nitrogen foam breaks through the outlet simultaneously in both fractures (Fig. 9(d)). It can be seen clearly that there is almost no simulated oil left in the cross fracture-vuggy-fracture model during the foam injection process.
 |
| | Fig. 9 Dynamic flow feature of nitrogen foam flooding in the cross fracture-vuggy-fracture model. | |
 |
| | Fig. 10 Diagram of mechanism analysis of foam size change. | |
3.4 Flow behaviors of nitrogen gas and foam flooding in the multiple cross complex fracture model
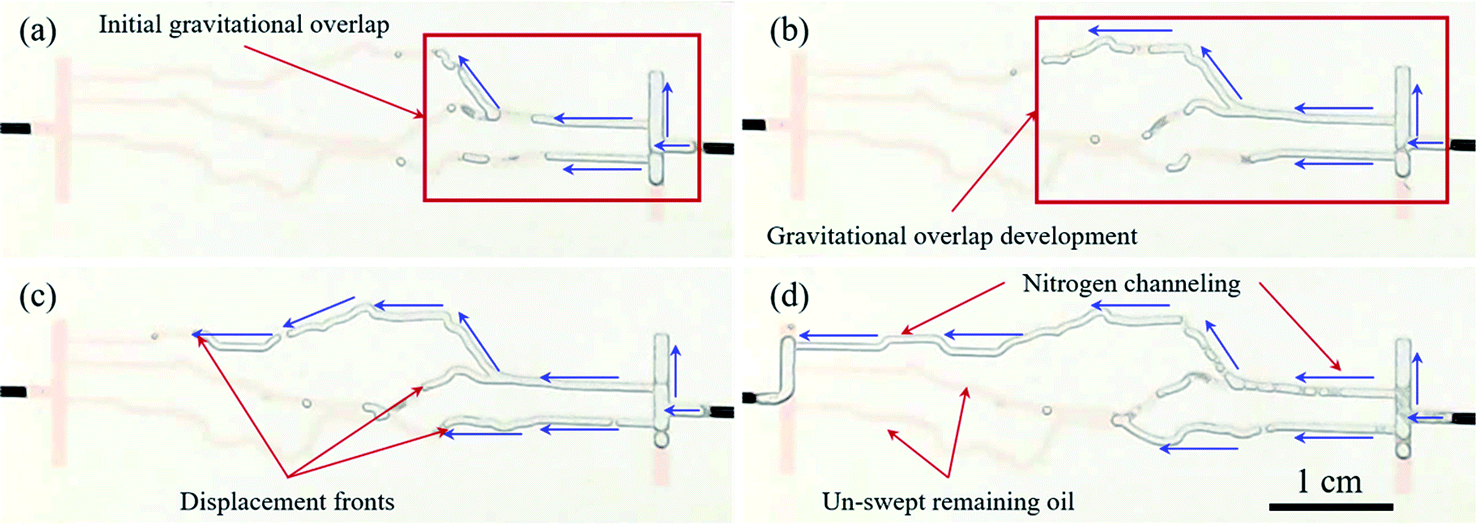
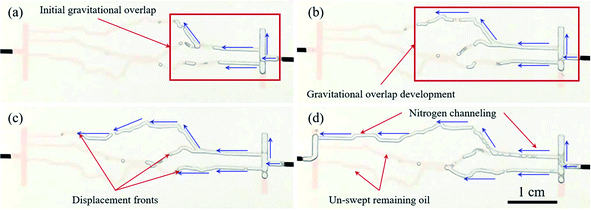
3.4.1 Nitrogen gas flooding. Fig. 11 shows the dynamic flow behaviors of nitrogen gas flooding in the multiple cross complex fracture model. It can be seen that the slight effect of gravity differentiation occurs at the beginning of nitrogen gas injection (Fig. 11(a)). With continuous injection of nitrogen gas, the effect of gravity differentiation is strengthened due to the difference of flow resistance in fractures (Fig. 11(b)). The gravitational overlap effect is strengthened, resulting in that the displacement front positions in fractures are significantly different, as shown in Fig. 11(c). After nitrogen channeling is formed in the upper fracture, the displacement fronts in the lower fractures keep stable at the fractures intersection, as shown in Fig. 11(d). Consequently, there is a large amount of remaining oil left in the lower fractures.
 |
| | Fig. 11 Dynamic flow behaviors of nitrogen flooding in the multiple cross complex fracture model. | |
Apart from the above-mentioned results, there is a little bit of difference for nitrogen gas flooding in the cross fracture-vuggy-fracture model (Fig. 7(d)) and multiple cross complex fracture model (Fig. 11(d)), respectively. In the cross fracture-vuggy-fracture model, the lower fracture is not swept by nitrogen gas. However, the lower fractures in the front of fracture intersection are swept by nitrogen gas in the multiple cross complex fractures model. This subtle difference could be attributed to the presence of vuggy. The flow resistance in vuggy is less than that in the fracture, which makes that nitrogen gas is more inclined to flow in the upper fracture in the cross fracture-vuggy-fracture model.
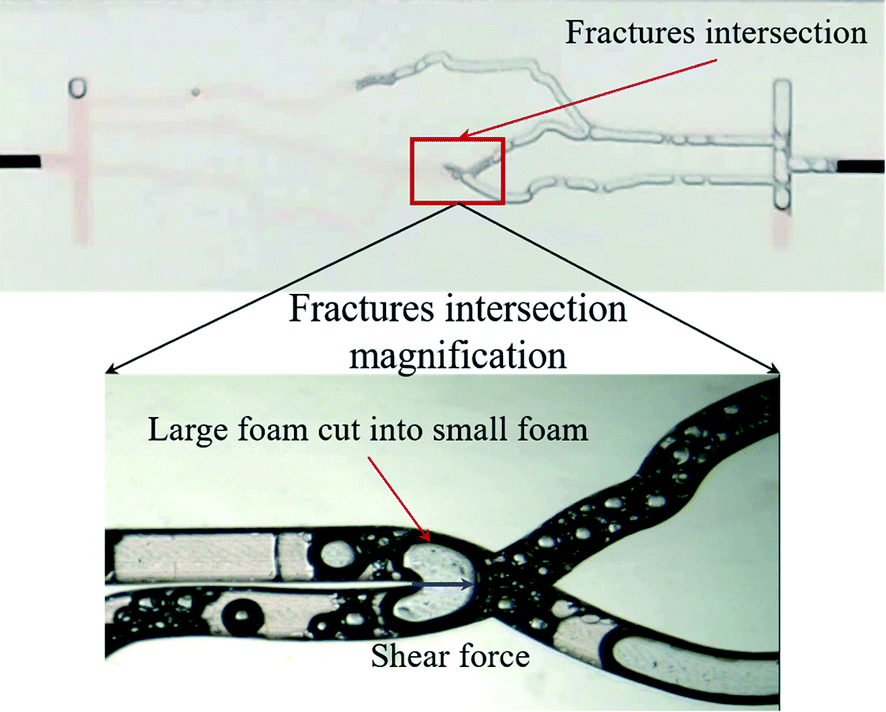
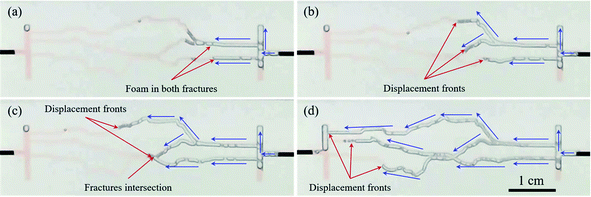
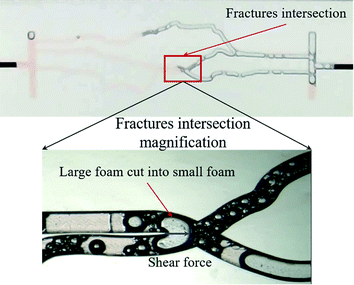
3.4.2 Nitrogen foam flooding. Dynamic flow behaviors of nitrogen foam flooding in the multiple cross complex fracture model are also investigated, as shown in Fig. 12. Fig. 12(a) shows that the nitrogen foam can enter both the upper and lower fracture channels simultaneously. With continuous injection of the nitrogen foam, displacement fronts of the foam in fractures come in close proximity because the effect of gravitational overlap is weakened gradually (Fig. 12(b)). The nitrogen foam is forced to be deformed as it reaches fracture intersection (Fig. 12(c)). The fracture intersection is magnified, so that it can be clearly seen that the large foam is cut into the small foam under the action of shear force (Fig. 13). Fracture-vuggy carbonate reservoirs have large-scale fractures and vuggys, and a very weak shear force, resulting in almost no foam regenerative ability after defoaming. However, when the bubble meets the intersection of the fractures, the shear force is likely to split the bubble into two, as shown in Fig. 13. The foam deformation effect can delay the subsequent foam flow forward, resulting in a significant difference in the position of displacement fronts (Fig. 12(c)). Fig. 12(d) illustrates that displacement fronts of the nitrogen foam in lower fractures are almost close to the outlet when the displacement front of the nitrogen foam in the upper fracture has already reached the outlet. Hence, compared to nitrogen gas flooding in the multiple cross complex fracture model, the nitrogen foam has greater potential for enhanced oil recovery.
 |
| | Fig. 12 Dynamic flow behaviors of nitrogen foam flooding in the multiple cross complex fractures model. | |
 |
| | Fig. 13 Foam deformation at the fracture intersection. | |
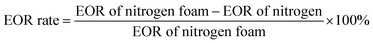
4. Ultimate oil recovery analyzations
The ultimate oil recovery with nitrogen and nitrogen foams in four fracture-vuggy models was recorded and calculated, as shown in Table 3. Obviously, nitrogen foam flooding can significantly recover more oil from fracture-vuggy models compared with nitrogen flooding. The EOR rate, as shown in eqn (5), is used to evaluate the EOR potential of nitrogen foam flooding technology over nitrogen flooding technology in different fracture-vuggy structure models. Nitrogen foam flooding has a higher EOR rate in the model in the presence of vuggy. This result could be attributed to the fact that nitrogen foam flooding can give full play to the potential of profile control in the stronger reservoir heterogeneity. The highest EOR rate value of 46.8% can be obtained in the fracture-vuggy-fracture model instead of the cross fracture-vuggy-fracture model, as shown in Table 3. The phenomenon is due to the vuggy locating at the upper fracture (seen in Fig. 1(e)), resulting in that the most oil in the vuggy can be recovered by nitrogen gas flooding.| |
 | (5) |
Table 3 Summary of EOR with nitrogen and nitrogen foams in different models
| EOR |
Models |
| Tortuous fracture |
Fracture-vuggy-fracture |
Cross fracture-vuggy-fracture |
Multiple cross complex fractures |
| Nitrogen, % |
61.7 |
47.1 |
55.4 |
66.1 |
| Nitrogen foam, % |
90.4 |
88.5 |
98.3 |
98.6 |
| EOR rate, % |
31.7 |
46.8 |
43.6 |
33.0 |
5. Conclusions
In conclusion, four different types of micro-visual fracture-vuggy models have been designed and fabricated based on the SEM images of outcrop core sections to systematically study the flow behaviors of nitrogen and foams. Several conclusions are drawn as follows:
(1) Flow behaviors of nitrogen and foams are greatly affected by the fracture-vuggy structure. The presence of vuggy in the upper fracture can strengthen the effect of gravity differentiation during nitrogen flooding, while foam flooding can diminish the gravity differentiation effect.
(2) Pressure difference at the curved oil–gas interface plays a great role in flow behaviors of nitrogen and foams. The foam with a large size gets larger, while the foam with a small size gets smaller owing to the presence of pressure difference.
(3) Compared to nitrogen flooding, the swept efficiency and oil displacement efficiency can be improved by foam flooding owing to the abilities of foams on mobility adjustment, IFT reduction, and oil emulsification, and then higher oil recovery factor is obtained eventually.
(4) The EOR rate is used to evaluate the EOR potential of nitrogen foam flooding technology over nitrogen flooding technology in different fracture-vuggy structure models. Experimental results indicate that nitrogen foam flooding has a higher EOR rate in the model in the presence of vuggy.
Conflicts of interest
The authors declare that they have no known competing financial interests or personal relationships that could have appeared to influence the work reported in this paper.
Acknowledgements
The authors gratefully appreciate the financial support of the Science Foundation of China University of Petroleum, Beijing (No. 2462020XKBH013). Financial supports from the National Natural Science Foundation of China (Grant No. 51804316) and the Science Foundation of China University of Petroleum, Beijing (Grant No. 2462017YJRC037) are also greatly acknowledged. Finally, Tuo Liang wants to thank the invaluable care and support from Jiaxin Xi (my wife) over the years. You are the world to me.
References
- Y. C. Wen, M. Qu, J. R. Hou, T. Liang, I. Raj, S. X. Ma and N. Yuan, J. Pet. Sci. Eng., 2019, 180, 994–1005 CrossRef CAS.
- A. Lv, Study of Reservoir Engineering Methods for Fractured-Vuggy Carbonate reservoirs[D], China University of Petroleum, 2007 Search PubMed.
- H. Jiang, X. Song and Y. Wang, Offshore Oil, 2008, 28(4), 6–13 Search PubMed.
- M. Qu, J. R. Hou, P. P. Qi, F. L. Zhao, S. X. Ma, L. Churchwell, Q. Wang, H. Li and T. Y. Yang, J. Pet. Sci. Eng., 2018, 166, 871–879 CrossRef CAS.
- J. R. Hou, Pet. Geol. Recovery Effic., 2015, 22(5), 64–68 Search PubMed.
- Z. Zheng, Pet. Geol. Recovery Effic., 2016, 23(2), 93–97 Search PubMed.
- D. Alfarge, M. Z. Wei and B. J. Bai, Energy Fuels, 2017, 31(8), 8462–8480 CrossRef CAS.
- Q. Xie, Y. Q. Chen, A. Sari, W. F. Pu, A. Saeedi and X. W. Liao, Energy Fuels, 2017, 31(12), 13593–13599 CrossRef CAS.
- K. Huang, W. Y. Zhu, L. Sun, Q. Wang and Q. Liu, J. Pet. Sci. Eng., 2019, 181, 106130 CrossRef CAS.
- D. Y. Yuan, J. R. Hou, Z. J. Song, Y. Wang, M. Luo and Z. Y. Zheng, J. Pet. Sci. Eng., 2015, 129, 15–22 CrossRef CAS.
- J. Wang, Z. M. Ji, H. Q. Liu, Y. T. Huang, Y. S. Wang and Y. L. Pu, Pet. Explor. Dev., 2019, 46(2), 355–366 CrossRef.
- Z. Song, SPE Asia Pacific Oil & Gas Conference and Exhibition, 2016 Search PubMed.
- M. Salleh, Simulation study of the effect of water alternating gas (WAG) and foam-assisted water alternating gas (FAWAG) with CO2 injection, in The Presence of Asphaltene in Light Oil Reservoir, Universiti Teknologi Petronas, 2014 Search PubMed.
- A. Telmadarreie and J. J. Trivedi, SPE J., 2016, 21(5), 1655–1668 CrossRef CAS.
- M. Qu, J. R. Hou, Y. C. Wen and T. Liang, J. Pet. Sci. Eng., 2020, 186, 106723 CrossRef CAS.
- J. B. Yang and J. R. Hou, J. Pet. Sci. Eng., 2020, 192, 107334 CrossRef CAS.
- T. Liang and J. R. Hou, J. Pet. Sci. Eng., 2021, 200, 108286 CrossRef CAS.
- S. A. Jones, V. Van der Bent, R. Farajzadeh, W. R. Rossen and S. Vincent-Bonnieu, Colloids Surf., A, 2016, 500, 166–176 CrossRef CAS.
|
| This journal is © The Royal Society of Chemistry 2021 |
Click here to see how this site uses Cookies. View our privacy policy here. 
 Open Access Article
 This Open Access Article is licensed under a Creative Commons Attribution-Non Commercial 3.0 Unported Licence
 a,
Jirui Houa,
Ming Qu*a,
Chuanzhen Songb,
Jie Lic,
Tao Tand,
Xinbian Lud and
Yong Zhenge
a,
Jirui Houa,
Ming Qu*a,
Chuanzhen Songb,
Jie Lic,
Tao Tand,
Xinbian Lud and
Yong Zhenge